

Abstract
We tested the potential role of vascular endothelial growth factor (VEGF) and of fibroblast growth factor-2 (FGF-2) in the angiogenesis associated with experimental liver fibrogenesis induced by common bile duct ligation in Sprague-Dawley rats. In normal rats, VEGF and FGF-2 immunoreactivities were restricted to less than 3% of hepatocytes. One week after bile duct ligation, hypoxia was demonstrated by the immunodetection of pimonidazole adducts unevenly distributed throughout the lobule. After 2 weeks, hypoxia and VEGF expression were detected in >95% of hepatocytes and coexisted with an increase in periportal vascular endothelial cell proliferation, as ascertained by Ki67 immunolabeling. Subsequently, at 3 weeks the density of von Willebrand-labeled vascular section in fibrotic areas significantly increased. Semiquantitative reverse transcription polymerase chain reaction showed that VEGF120 and VEGF164 transcripts, that correspond to secreted isoforms, increased within 2 weeks, while VEGF188 transcripts remained unchanged. FGF-2 mainly consisting of a 22-kd isoform, according to Western blot, was identified by immunohistochemistry in 49% and 100% of hepatocytes at 3 and 7 weeks, respectively. Our data provide evidence that in biliary-type liver fibrogenesis, angiogenesis is stimulated primarily by VEGF in response to hepatocellular hypoxia while FGF-2 likely contributes to the maintenance of angiogenesis at later stages.
In their pioneering studies, Rappaport and co-workers showed that the development of scars in the cirrhotic liver was invariably accompanied by an intense vascular proliferation. These authors suggested that tissue remodeling and fibrous repair might represent the “road builder” for collateral flow in cirrhosis 1 Their observations have been fully confirmed by others showing that in cirrhotic tissues, the regenerative nodules are surrounded by a dense vascular plexus. 2,3 Yet, the mechanisms triggering this intense vascular proliferative response remain to be determined.
Vascular endothelial growth factor (VEGF) and fibroblast growth factor-2 (FGF-2) are the most potent angiogenic factors identified thus far. Their role in vascular proliferation associated with tumor growth or wound healing has been widely documented in different organs. 4 In addition, it has been demonstrated that hypoxia was the main inducer of VEGF expression 5 which, in turn, stimulates local proliferation of capillaries to increase oxygen delivery. Besides beneficial effects, this vascular response may nevertheless also result in deleterious effects best illustrated by tumor growth and proliferative retinopathy. 6,7
We and others 8,9 have recently observed an up-regulation of VEGF in the cirrhotic liver of patients with or without hepatocellular carcinoma, suggesting that this factor might be responsible for cirrhosis-associated angiogenesis. Intrahepatic shunts and capillarization of sinusoids are well established characteristics of cirrhosis that restrict the access of blood solutes to hepatocytes. 10-12 In addition, a decrease in the hepatic microvascular perfusion secondary to biliary obstruction in rat has been recently shown to occur long before the onset of cirrhosis, within 7 days following bile duct ligation (BDL). 13 Whether these vascular morphological and functional alterations may induce chronic hypoxia in the fibrotic liver and thereby elicit an angiogenic response is unknown.
The aim of the present study was to investigate the role of VEGF and FGF-2 in an experimental model of biliary fibrosis. We next studied the role of hypoxia in triggering VEGF expression and thereby in stimulating angiogenesis in this model.
Materials and Methods
Animal Model of Cholestatic Liver Injury
Male Sprague-Dawley rats were used at a body weight of 200 to 250 g. The common bile duct was ligated as described previously 14 while normal and sham-operated rats were used as controls. At various times after surgery (3 days, 1, 2, 3, 4, 5, 6, and 7 weeks), rats were euthanized with an overdose of ketamine (Parke-Davis, Courbevoie, France). Cholestasis was monitored by serum bilirubin level. At the time of sacrifice, arterial and mixed venous blood samples were withdrawn for the measurement of oxygen tension (PO2) and liver tissue was processed as described below.
Histology and Immunohistochemistry
Liver samples were fixed in 10% buffered formalin, paraffin-embedded and sectioned at 4 μm. Tissue sections were stained with hematoxylin-phloxin-safran before standard histology. Immunolabeling was performed using polyclonal antibodies against VEGF (a goat polyclonal IgG: sc-152-G and a rabbit polyclonal IgG: sc-507) (1:100) (Santa Cruz Biotechnology, Santa Cruz, CA) and FGF-2 (1:100) (Santa Cruz Biotechnology) and monoclonal antibodies against von Willebrand factor (vWF) (1:200) (Dako, Glostrup, Denmark). An avidin-biotin-peroxidase technique (Vectastain ABC Kit, Vector, Burlingame, CA) was used for VEGF, FGF-2, and vWF detection. For vWF, immunoperoxidase was performed after microwave antigen retrieval (750 W, 3 × 5 minutes in citrate buffer 0.01 mol/L, pH 6). Before immunostaining, endogenous biotin was blocked using a commercial kit (Eurobio, France) and endogenous peroxidase activity was inhibited in 3% alcoholic hydrogen peroxide for 30 minutes. Color development was achieved with 3-amino-9 ethyl carbazole. The controls were obtained by omitting the first antibody and were all negative. Two independent sections of each sample were evaluated. The cells exhibiting a moderate to intense signal for VEGF and FGF-2 were considered as positive and counted. At least 400 hepatocytes were analyzed in two independent fields. Cell proliferation was assessed by means of a three-step immunoperoxidase method with a monoclonal antibody raised against Ki67 (Novocastra, Newcastle, UK). The cell nuclei were identified as positive or negative and counted. At least 1200 hepatocytes and 600 bile duct epithelial cells were analyzed in three independent fields. Endothelial cell proliferation was assessed by counting the percentage of Ki67 positive endothelial cell nuclei in the periportal vessels of five independent high-magnification (×400) fields per animal. The vascular density in the periportal fibrosis was assessed by determining the count of vWF-labeled vessel sections in 10 successive high-magnification (×400) fields per animal using an eyepiece with a net micrometer (Carl Zeiss, Jena, Germany). The liver samples of at least two rats at each time point (normal rats, 1, 3, and 6 weeks after BDL) were examined. The same procedure was applied to determine the count of bile duct sections. For endothelial cell proliferation and vascular density data, mean values for more than two groups (at each time point) were compared by analysis of variance (Kruskall-Wallis test) and in case of significance, Scheffé or Games-Howell tests were used to detect difference between single groups. All results were expressed as mean ± SEM.
Reverse Transcription Polymerase Chain Reaction Analysis of VEGF Transcripts
Total RNAs were extracted by a guanidinium thiocyanate based method using a commercial kit (Trizol, Gibco BRL). Five micrograms of RNAs were reverse transcribed using a commercial kit (Pharmacia Biotech). Samples of cDNA were subjected to VEGF amplification combined with GAPDH co-amplification by polymerase chain reaction (PCR). The VEGF and GAPDH oligonucleotide primers were designed based on published rat cDNA sequences in EMBL database. The VEGF sense primer was 5′-ACCTCCACCATGCCAAGT-3′ (position on cDNA: 54–71) and the antisense primer was 5′-TAGTTCCCGAAACCCTGA-3′ (position on cDNA: 602–619). The GAPDH sense primer was 5′-CCATGGAGAAGGCTGGGG-3′ (position on cDNA: 335–352) and the antisense primer, 5′-CAAAGTTGTCATGGATGACC-3′ (position on cDNA: 510–529). PCR was performed in a 50-μl reaction mixture containing: 10 mmol/L Tris-HCl, pH 9.0); 50 mmol/L KCl; 1.5 mmol/L MgCl2; 0.2 mmol/L dNTPs; 25 pmol/L of each VEGF primer; and 2.5 pmol/L of each GAPDH primer. The PCR conditions were as follow: 94°C for 7 minutes, then 25, 28, 31, 34, and 37 cycles of 1 minute denaturation at 94°C, 1 minute annealing at 57°C, 1 minute 30 seconds extension at 72°C, and a 10-minute terminal extension at 72°C. To monitor the kinetics of PCR product formation, aliquots were withdrawn at different PCR cycles and analyzed by Southern blot after hybridization of the membrane with specific VEGF and GAPDH 32P-labeled probes. PCR products were semiquantified by optical density scanning of the blot.
Western Blot Analysis of FGF-2 Expression
Tissue samples were homogenized using an all-glass homogenizer in ice-cold lysis buffer (Tris 20 mmol/L, pH 7.5; NaCl, 150 mmol/L; SDS, 2%; EDTA, 5 mmol/L; aprotinin, 5 mg/ml; leupeptin, 1 mg/ml; pepstatin, 0.7 mg/ml; N-tosyl-l-lysine chloromethylketone, 50 mg/ml; N-tosyl-l-phenylalanine chloromethylketone, 100 mg/ml; soybean trypsin inhibitor, 100 mg/ml; phenylmethylsulfonyl fluoride, 1 mmol/L) and then sonicated. The cellular debris were pelleted by two 20-minute centrifugations (15,000 × g) at 4°C. The protein concentration was determined by the BCA protein assay (Pierce, Rockford, IL) and aliquots were stored at −80°C. Equal amounts of proteins were heated at 95°C for 4 minutes in SDS, dithiothreitol, and β-mercaptoethanol containing sample buffer and fractionated by 12% SDS-PAGE. After transfer onto a nitrocellulose membrane, FGF-2 was detected by using a rabbit anti-FGF-2 polyclonal antibody (Santa Cruz Biotechnology) at a dilution of 1:500. Immune complexes were revealed by means of a horseradish peroxidase-conjugated anti-rabbit IgG antibody and an enhanced chemiluminescence kit (Amersham).
Hypoxia Assay
Pimonidazole binding has been used to assess changes in hepatic tissue oxygenation. 15 Nitroimidazole compounds such as pimonidazole are reductively activated and covalently bound to macromolecules in cells at low oxygen concentration. 16 In brief, the rats were injected with pimonidazole (120 mg/ml intravenously) 1 hour before killing at 1 week, 2 weeks, and 4 weeks following bile duct ligation or sham operation. Liver tissue was formalin-fixed and embedded in paraffin. Pimonidazole adducts were detected in formalin-fixed paraffin-embedded tissues with a biotin-streptavidin-peroxidase indirect immunostaining method modified for rat liver as previously described, using a monoclonal antibody provided by J. A. Raleigh. 16
Results
Vascular Proliferation Associated with Cholestatic Liver Injury
Bile duct ligation triggered major structural changes in the liver architecture, as previously described. 3,17 After 3 days, ductular reaction was readily detectable, and after 3 weeks, the ductular reaction was intense and associated with extensive fibrosis. After 7 weeks, biliary cirrhosis was present. Increased cell proliferation in response to cholestatic liver injury occurred in both parenchymal and nonparenchymal liver cells, as established before. The kinetics of cell proliferation as ascertained by Ki67 immunolabeling varied according to cell types: bile duct epithelial cells were the first to proliferate and reached a plateau at 3 days, whereas the proliferation of hepatocytes peaked at 1 week. The rate of positive nuclei in bile ducts raised from 1.5% in normal liver to 38% at 3 days, while that of hepatocytes raised from 1.5% in normal liver to 18% at 1 week. Proliferation of the vascular endothelial cells lining periportal vessels was determined on the same liver sections by the number of Ki67-positive nuclei in these cells. While no significant change was noted up to 1 week, inasmuch as 1.79 ± 1.79%, 6.25 ± 2.19% (ns) and 13.01 ± 2.98% (ns) of nuclei were positive in normal rats, 3 days and 1 week after bile duct ligation, respectively, an increase in the rate of Ki67-labeled nuclei occurred thereafter and reached 27.86 ± 3.59% at 2 weeks (P < 0.05 as compared with normal, 3 days and 1 week) (Figure 1, A and B) ▶ .
Figure 1.
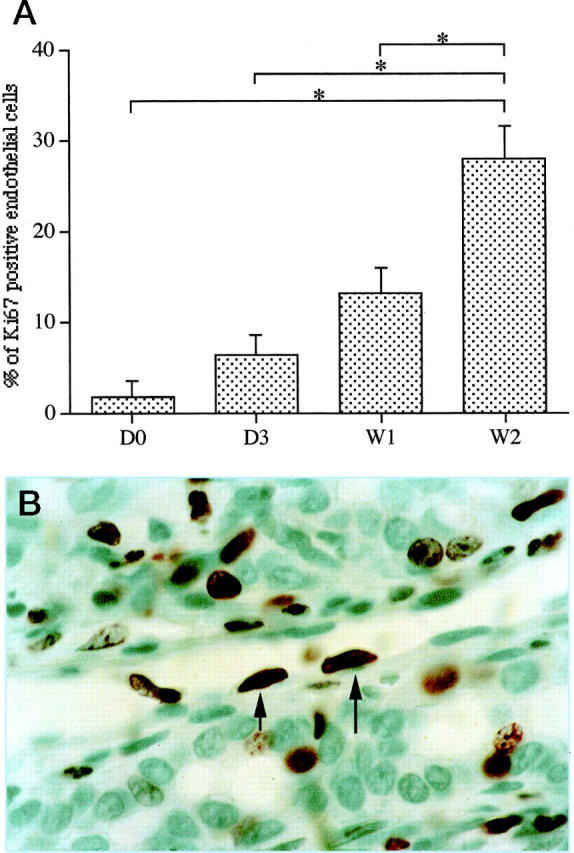
Time course of vascular endothelial cell proliferation after BDL. Vascular endothelial cell proliferation was assessed by Ki67 immunodetection on liver tissue sections. A represents the percentage of labeled endothelial cell nuclei in periportal area vessels from normal rats (DO), and 3 days (D3), 1 week (W1), and 2 weeks (W2) after BDL. While no significant change was observed up to 1 week, an increase in the rate of Ki67-labeled nuclei occurred at 2 weeks. All of the results are expressed as means ± SEM, *P < 0.05. B illustrates immunodetection of Ki67 in endothelial cells of periportal vessels at 2 weeks. Positive nuclei are indicated by arrows. Immunoperoxidase technique with hematoxylin counterstain. Magnification, ×1000.
After vascular endothelial cells has been identified by von Willebrand factor immunolabeling, vessel sections within the ductular reaction were counted to determine vascular density, as described under Materials and Methods. In normal rats, vWF was restricted to the endothelium of portal veins (Figure 2A) ▶ and central veins (not shown). One week after BDL, there was no significant change in vascular density (Figure 2B) ▶ . In contrast, after 3 weeks and 6 weeks, there was a marked increase in vWF-labeled vessels that were located within ductular reaction (Figure 2, C and D) ▶ . The results are entirely consistent with the time course of vascular endothelial cell proliferation as shown in Figure 1 ▶ . Similarly, the proliferation of bile duct epithelial cells was followed by a significant increase in bile duct sections at 1 week. The quantification of vascular density is shown in Figure 2E ▶ (left) in parallel with that of ductular proliferation (Figure 2E ▶ , right), that was assessed by the same method. However, both proliferation events occurred at different time points.
Figure 2.
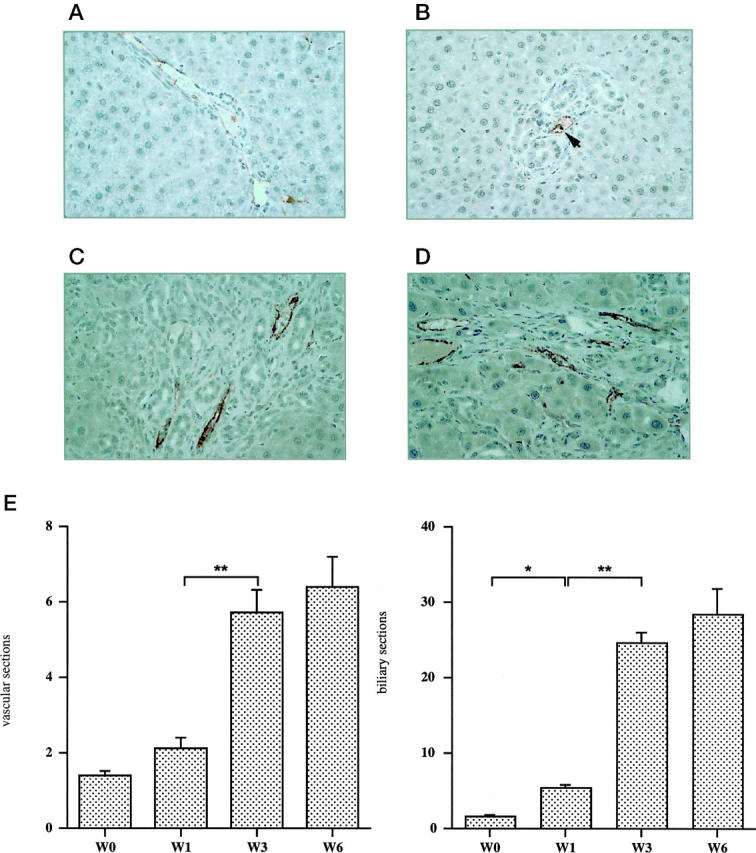
Angiogenesis associated with the development of biliary-type liver fibrosis. Vascular endothelial cells were labeled by an anti-vWF antibody in the liver of normal rats (A), 1 week (B), 3 weeks (C), and 6 weeks (D) after BDL. The number of vessel sections per field at each time point is presented (E; left panel): normal (W0); 1 week (W1); 3 weeks (W3), P < 0.0001 as compared with 1 week; and 6 weeks (W6). The number of bile duct sections per field was assessed by the same method (E; right panel): normal (W0); 1 week (W1), P < 0.05 as compared with normal; 3 weeks (W3), P < 0.0001 as compared with 1 week; and 6 weeks (W6). All of the results are expressed as means ± SEM (n = 20); *P < 0.05; **P < 0.0001. Immunoperoxidase technique with hematoxylin counterstain. Magnification, ×400 (A–D).
Hepatic Expression of Angiogenic Factors VEGF and FGF-2 in Cholestatic Liver Injury
On liver sections from normal rats, VEGF and FGF-2 immunolabeling was detected in the first row of perivenular hepatocytes (Figure 3, A and B) ▶ . In addition, 3% of hepatocytes unevenly distributed within the lobule displayed FGF-2 reactivity. The labeling intensity was high in 1%, and moderate in 2% of hepatocytes (Figure 3B) ▶ . No expression was found in the other cell types. Two weeks (data not shown) and 3 weeks (Figure 3C) ▶ after BDL, more than 95% of hepatocytes exhibited VEGF immunolabeling. Seven weeks after BDL, an intense and homogeneous signal for VEGF was observed in 100% of hepatocytes (Figure 3E) ▶ . VEGF immunolabeling was restricted to hepatocytes and was undetectable in nonparenchymal cells, including bile duct epithelial cells and myofibroblasts. A similar pattern of VEGF expression was obtained with the two different polyclonal anti-VEGF antibodies that we have used (data not shown). FGF-2 expression also increased after BDL but the time course and distribution pattern differed from those of VEGF (Figure 3, D and F) ▶ . A significant signal for FGF-2 was detected in 49% (intense in 9%) of hepatocytes 3 weeks after BDL (Figure 3D) ▶ and in more than 95% (intense in 35%) of hepatocytes after 7 weeks (Figure 3F) ▶ .
Figure 3.
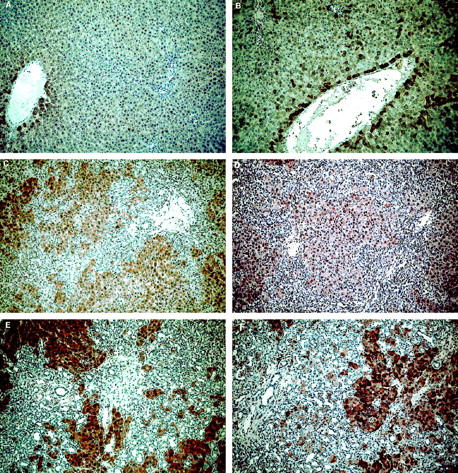
Increased expression of VEGF and FGF-2 after BDL. VEGF (A, C, E) and FGF-2 (B, D, F) were detected by immunohistochemistry. In normal rats (A, B ), the liver architecture was normal and the expression of VEGF and FGF-2 was detected in perivenular hepatocytes. A few scattered hepatocytes (3%) within the lobule also displayed FGF-2 immunoreactivity (B). Three weeks after BDL (C, D), at the stage of intense ductular reaction and extensive fibrosis, more than 95% of hepatocytes exhibited a signal for VEGF (C), while a signal for FGF-2 was identified in 49% of hepatocytes (intense in 9%, moderate in 40%). At 7 weeks after BDL (E, F), at the stage of biliary cirrhosis, a signal for VEGF was detected in 100% of hepatocytes, while a signal for FGF-2 was detected in more than 95% of hepatocytes (intense in 35% of hepatocytes unevenly distributed within the lobule). Immunoperoxidase technique with hematoxylin counterstain. Magnification, ×100 (A–D) and ×200 (E, F).
Since different molecular species of rat VEGF (120, 164, and 188 amino acids) and human VEGF (121, 165, 189, and 206 amino acids) have been identified and reported to be produced by alternative splicing of mRNA, 18,19 we investigated whether specific isoform transcripts were induced by cholestatic liver injury. We characterized the kinetics of expression of these different transcripts by RT-PCR 2, 4, and 6 weeks after BDL. Sham-operated rats were used as controls. Three bands at 434, 565, and 687 bp were amplified in the different liver samples. Sequence analysis of these bands showed that they corresponded to the 120-, 164- and 188-amino-acid isoforms of VEGF, respectively. The band at 687 bp corresponding to the 188-amino-acid isoform was the predominant form in the sham-operated animals and remained unchanged after BDL (Figure 4, A and B) ▶ . In contrast, the bands at 434 and 565 bp, corresponding to the 120- and 164-amino-acid isoforms respectively, increased by 1.5 to 2-fold 4 weeks after BDL. Moreover, the transcript of 164-amino acid isoform became predominant within 2 weeks after BDL (Figure 4, A and B) ▶ .
Figure 4.
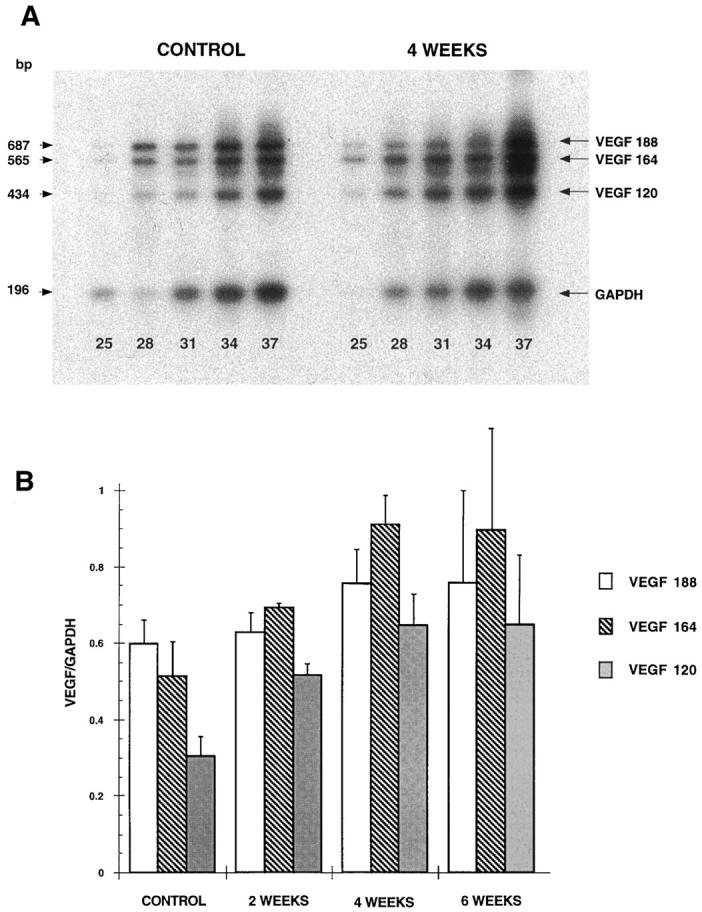
BDL-induced expression of VEGF transcripts. Whole liver RNA extracts were prepared from normal rats (control) rats and 2 weeks, 4 weeks, and 6 weeks after BDL. Total RNAs (5 μg) were subjected to RT-PCR for VEGF and GAPDH as described under Materials and Methods. Aliquots were withdrawn from the PCR mixture after the indicated numbers of cycles (25, 28, 31, 34, and 37) and analyzed by Southern blotting. The signal intensities of bands corresponding to the 120-, 164-, and 188-amino acid VEGF isoforms and to GAPDH were determined by scanning densitometry. A: representative autoradiograms obtained from a control animal and 4 weeks after BDL. B: Relative abundance of the three transcripts was determined after 31 PCR cycles in control and BDL rats at 2, 4, and 6 weeks (results are expressed as means ± SEM, n = 3).
Unlike VEGF isoforms, the different molecular forms of FGF-2 represent alternative translation products derived from a single mRNA 20,21 and were therefore analyzed by immunoblot. Consistent with immunohistochemistry, Western blot analysis showed that up-regulation of FGF-2 expression was evident after the fourth week following BDL and increased progressively up to week 7 (Figure 5) ▶ . Three isoforms of 18, 21, and 22 kd were detected (Figure 5) ▶ . The former corresponds to an AUG codon initiated form while the 21- and 22-kd peptides are initiated at codons CUG3 and CUG2, respectively. 21 The 22-kd FGF-2 was the main isoform expressed in all samples and the 31-kd FGF-2 initiated at CUG1 codon 22 was undetectable even after long time exposures.
Figure 5.

BDL-induced expression of FGF-2 isoforms. Total proteins from whole liver were subjected to Western blot analysis as described under Materials and Methods. The time after BDL is indicated at the top of the lanes. The control consists of total proteins extracted from a normal rat liver. The bands corresponding to the 18-kd (AUG), 21-kd (CUG3), and 22-kd (CUG2) isoforms are indicated. FGF-2 isoforms were quantified by scanning densitometry and the total amount of the different isoforms are represented on the histogram at the bottom of the figure.
We concluded from these data that cholestatic liver injury induces within 2 weeks a shift in VEGF isoform transcripts associated with an increase in VEGF immunoreactivity in hepatocytes and a delayed increase in FGF-2 expression, also mainly in hepatocytes.
Induction of Liver Hypoxia
The demonstration of an intense hepatocellular overexpression of VEGF following BDL prompted us to investigate the role of liver hypoxia as a triggering event. In normal rats (Figure 6A ▶ , top) pimonidazole adducts were undetectable in the liver. One week after BDL, a patchy staining for pimonidazole adducts was observed (data not shown). Two weeks and 4 weeks after surgery (Figure 6, B and C ▶ , respectively; top), pimonidazole adducts were detected in more than 95% of hepatocytes. In normal rats (Figure 6A ▶ , bottom) and at 1 week (data not shown), VEGF was detected in perivenular hepatocytes. Pimonidazole adducts and VEGF expression displayed the same pattern on adjacent liver sections 2 weeks (Figure 6B ▶ , bottom) as well as 4 weeks after BDL (Figure 6C ▶ , bottom). Determination of PO2 in the peripheral arterial blood from the same animals revealed no significant change in the oxygen tension of rats 3 weeks, 4 weeks as well as 6 weeks after BDL, as compared with normal rats.
Figure 6.

BDL-induced hypoxia of the liver. Top: In normal rats (A) pimonidazole adducts were not detected in the liver. Two weeks (B) and 4 weeks (C) after surgery, pimonidazole adducts were detected in more than 95% of hepatocytes. Bottom: In normal rats (A), VEGF was detected in perivenular hepatocytes. Two weeks (B) and 4 weeks (C) after BDL, VEGF expression displayed the same pattern as pimonidazole adducts on adjacent liver sections. Immunoperoxidase technique with hematoxylin counterstain. Magnification, ×100 (A) and ×200 (B, C).
We conclude from these data indicate that hypoxia selectively occurs in hepatocytes and immediately precedes the induction of VEGF in these cells after BDL.
Discussion
Our study provides first evidence for the induction of angiogenic factors VEGF and FGF-2 leading to vascular proliferation during experimental liver fibrogenesis. In addition, we demonstrate that hypoxia occurs in hepatocytes before the onset of cirrhosis and immediately precedes VEGF induction. Our results therefore suggest that hypoxia-induced expression of VEGF in hepatocytes might be the triggering event in the development of microvascular proliferation associated with liver fibrogenesis and might thereby contribute to the remodeling of liver architecture .
It has been established that sinusoidal perfusion is impaired in cirrhosis, whatever its cause 12,13 and regenerative nodules in human and experimental cirrhosis are constantly surrounded by a dense perinodular vascular plexus. 1-3 These numerous and tortuous microvessels originate from intrahepatic vascular branches, progress together with the fibrous repair process and bypass the obstructed normal route. 1 These observations suggest that an impaired oxygen delivery to the hepatocytes may occur in cirrhosis as a result of intrahepatic shunts or capillarization of the sinusoids, leading to hepatocyte hypoxia. 23 In agreement with this view, we identified angiogenesis and hypoxia in cirrhotic tissues. However, our data indicate that hypoxia, VEGF induction, and angiogenesis precede the onset of cirrhotic lesions. Early hypoxia is compatible with the occurrence of liver blood supply impairment long before cirrhosis 13.
The immunochemistry data showed an early induction of VEGF in hepatocytes. Furthermore, this VEGF expression paralleled an increase in the level of transcripts coding for the secreted isoforms VEGF120 and VEGF164 which act directly on the proliferation and migration of vascular endothelial cells. These isoforms also increase the permeability of microvessels to circulating macromolecules. 19 In contrast to VEGF121 and VEGF165, human VEGF189 binds to the extracellular matrix and requires hydrolysis by proteases like plasmin to be activated. 24 Of note, plasma urokinase-type plasminogen activator increases in liver cirrhosis 25 and myofibroblastic hepatic stellate cells synthesize components of the plasminogen-activating system, generating plasmin that plays a key role in matrix remodeling. 26 In addition, VEGF has other biological activities (such as induction of the expression of different proteases by endothelial cells 27,28 and stimulation of endothelial cells and monocyte procoagulant activity 29 ) that might also indirectly induce microvascular remodeling in the liver by promoting monocyte migration and adhesion of activated neutrophil. 13,29 The time course of vessel proliferation after BDL was entirely consistent with an angiogenic response to VEGF induction.
By immunochemistry, we also found an up-regulation of FGF-2 was delayed by comparison with VEGF expression after BDL. Western blot analysis indicated that the 22-kd FGF-2 was the main isoform expressed in this experimental model. FGF-2 acts as a potent mitogen and an inducer of cell migration in different cell types, including endothelial cells and fibroblasts. 30 Low and high molecular weight isoforms of human FGF-2 generated by alternative initiation of translation have been described. 21,31 It has been suggested that the low molecular weight form (18 kd) might modulate cell motility and proliferation through interaction with its cell surface receptor while the high molecular weight isoforms (22 to 24 kd) might only act as a mitogen through an intracellular mechanism. 20 FGF-2 expression has been shown to be associated with fibrous septa in both human and experimental chronic liver diseases. 32 In addition, a synergism between FGF-2 and VEGF in the induction of angiogenesis and activated hepatic stellate cell proliferation has been demonstrated 33. Finally, FGF-2 has been shown to inhibit endothelial cell apoptosis. 34 Altogether, these data suggest that FGF-2 might contribute to maintain a vascular proliferative reaction previously induced by VEGF.
Our results strongly argue for the role of hepatocyte hypoxia as an early triggering event in the induction of VEGF in this experimental model. It has been previously demonstrated that hypoxia induces VEGF at both mRNA and protein level. 35,36 Furthermore, hypoxia-induced up-regulation of VEGF expression has been shown to involve both a transcriptional activation 37 and a stabilization of transcripts. 38 However, we cannot definitively exclude an additional role of factors produced by activated inflammatory cells, 39,40 since certain cytokines or growth factors (ie, EGF, HGF, PDGF, TGF-β) are able to stimulate VEGF expression in specific cell types. 41-44 Nevertheless, infiltration by inflammatory cells remained moderate in our experiments. In addition, the induction of VEGF in hepatocytes was associated with the concomitant occurrence of hypoxia in the same areas. In contrast, the expression of FGF-2, which has been shown to be insensitive to hypoxia, 43,45 was induced later and did not respond to the same distribution pattern suggesting that the inducing factors involved in the expression of the two angiogenic factors are different.
In conclusion, our results demonstrate for the first time the sequential induction of two major angiogenic factors, VEGF and FGF-2, during biliary-type liver fibrogenesis. They suggest that hypoxia might be a major factor implicated in the induction of VEGF and in the marked angiogenesis occurring at an early stage before the onset of cirrhotic lesions. Further studies are now required to determine the importance of these factors in liver diseases and whether their modulation might influence the progression of liver tissue repair.
Acknowledgments
We thank Colette Rey, Véronique Barbu, and Marielle Baudrimont for expert assistance.
Footnotes
Address reprint requests to Olivier Rosmorduc, M.D., Ph.D., Service d’Hepatogastroentérologie, Hôpital Saint-Antoine, 184 rue du Faubourg Saint-Antoine, 75571 Paris Cedex 12, France. E-mail: olivier.rosmorduc@sat.ap-hop-paris.fr.
Supported by grants from the Delegation à la Recherche Clinique of Assistance Publique-Hôpitaux de Paris (project CRC96181) and U.S. National Cancer Institute Grant R42 CA68826.
References
- 1.Rappaport AM, MacPhee PJ, Fisher MM, Phillips MJ: The scarring of the liver acini (cirrhosis): tridimensional and microcirculatory consideration. Virchows Arch (Pathol Anat) 1983, 402:107-137 [DOI] [PubMed] [Google Scholar]
- 2.Yamamoto T, Kobayashi T, Phillips M: Perinodular arteriolar plexus in liver cirrhosis: scanning electron microscopy of microvascular casts. Liver 1984, 4:50-54 [DOI] [PubMed] [Google Scholar]
- 3.Haratake J, Hisaoka M, Yamamoto O, Horie A: Morphological changes of hepatic microcirculation in experimental rat cirrhosis: a scanning electron microscopic study. Hepatology 1991, 13:952-956 [PubMed] [Google Scholar]
- 4.Folkman J: Clinical applications of research on angiogenesis. N Engl J Med 1995, 333:1757-1763 [DOI] [PubMed] [Google Scholar]
- 5.Shweiki D, Itin A, Soffer D, Keshet E: Vascular endothelial growth factor induced by hypoxia may mediate hypoxia-initiated angiogenesis. Nature 1992, 359:843-845 [DOI] [PubMed] [Google Scholar]
- 6.Maxwell PH, Dachs GU, Gleadle JM, Nicholls LG, Harris AL, Stratford IJ, Hankinson O, Pugh CW, Ratcliffe PJ: Hypoxia-inducible factor-1 modulates gene expression in solid tumors and influences both angiogenesis and tumor growth. Proc Natl Acad Sci USA 1997, 94:8104-8109 [DOI] [PMC free article] [PubMed] [Google Scholar]
- 7.Folkman J: Tumor angiogenesis. Mendelsohn J Howley PM Israel MA Liotta LA eds. The Molecular Basis of Cancer. 1995, :pp 206-232 WB Saunders, Philadelphia [Google Scholar]
- 8.Rosmorduc O, Wendum D, Galy B, Huez I, Prat H, de Saint-Maur PP, Poupon R: Expression of the angiogenic factors basic FGF and VEGF in human cirrhosis and hepatocellular carcinoma (Abstract). Hepatology 1996, 24:341A [Google Scholar]
- 9.El-Assal ON, Yamanoi A, Soda Y, Yamaguchi M, Igarashi M, Yamamoto A, Nabika T, Nagasue N: Clinical significance of microvessel density and vascular endothelial growth factor expression in hepatocellular carcinoma and surrounding liver: possible involvement of vascular endothelial growth factor in the angiogenesis of cirrhotic liver. Hepatology 1998, 27:1554-1562 [DOI] [PubMed] [Google Scholar]
- 10.Huet P-M, Goresky C, Villeneuve J-P, Marleau D: Assessment of liver microcirculation in human cirrhosis. J Clin Invest 1982, 70:1234-1244 [DOI] [PMC free article] [PubMed] [Google Scholar]
- 11.Varin F, Huet P-M: Hepatic microcirculation in the perfused cirrhotic rat liver. J Clin Invest 1985, 76:1904-1912 [DOI] [PMC free article] [PubMed] [Google Scholar]
- 12.Villeneuve J-P, Dagenais M, Huet P-M, Roy A, Lapointe R, Marleau D: The hepatic microcirculation in the isolated perfused human liver. Hepatology 1996, 23:24-31 [DOI] [PubMed] [Google Scholar]
- 13.Koeppel TA, Trauner M, Baas JC, Thies JC, Schlosser SF, Post S, Gebhard M-M, Herfarth C, Boyer JL, Otto G: Extrahepatic biliary obstruction impairs microvascular perfusion and increases leukocyte adhesion in rat liver. Hepatology 1997, 26:1085-1091 [DOI] [PubMed] [Google Scholar]
- 14.Alpini G, Lenzi R, Sarkozi L, Tavoloni N: Biliary physiology in rats with bile ductular cell hyperplasia: evidence for a secretory function of proliferated bile ductules. J Clin Invest 1988, 81:569-578 [DOI] [PMC free article] [PubMed] [Google Scholar]
- 15.Arteel GE, Thurman RG, Yates JM, Raleigh JA: Evidence that hypoxia markers detect oxygen gradients in liver: pimonidazole and retrograde perfusion of rat liver. Br J Cancer 1995, 72:889-895 [DOI] [PMC free article] [PubMed] [Google Scholar]
- 16.Arteel GE, Iimuro Y, Yin M, Raleigh JA, Thurman RG: Chronic enteral ethanol treatment causes hypoxia in rat liver tissue in vivo. Hepatology 1997, 25:920-926 [DOI] [PubMed] [Google Scholar]
- 17.Nakano S, Haratake J, Hashimoto H: Alterations in bile ducts and peribiliary microcirculation in rats after common bile duct ligation. Hepatology 1995, 21:1380-1386 [PubMed] [Google Scholar]
- 18.Cullinan-Bove K, Koos R: Vascular endothelial growth factor/vascular permeability factor expression in the rat uterus: rapid stimulation by estrogen correlates with estrogen-induced increases in uterine capillary permeability and growth. Endocrinology 1993, 133:829-837 [DOI] [PubMed] [Google Scholar]
- 19.Dvorak HF, Brown LF, Detmar M, Dvorak AM: Vascular permeability factor/vascular endothelial growth factor, microvascular hyperpermeability and angiogenesis. Am J Pathol 1995, 146:1029-1039 [PMC free article] [PubMed] [Google Scholar]
- 20.Bikfalvi A, Klein S, Pintucci G, Quarto N, Mignatti P: Differential modulation of cell phenotype by different molecular weight forms of basic fibroblast growth factor: possible intracellular signaling by the high molecular weight forms. J Cell Biol 1995, 129:233-243 [DOI] [PMC free article] [PubMed] [Google Scholar]
- 21.Prats H, Kaghad M, Prats AC, Klagsbrun M, Lélias JM, Liauzun P, Chalon P, Tauber JP, Amalric F, Smith JA: High molecular mass forms of basic fibroblast growth factor are initiated by alternative CUG codons. Proc Natl Acad Sci USA 1989, 86:1836-1840 [DOI] [PMC free article] [PubMed] [Google Scholar]
- 22.Kevil C, Carter P, Hu B, DeBenedetti A: Translational enhancement of FGF-2 by eIF-4 factors, and alternate utilization of CUG and AUG codons for translation initiation. Oncogene 1995, 11:2339-2348 [PubMed] [Google Scholar]
- 23.Morgan D, McLean A: Therapeutic implications of impaired hepatic oxygen diffusion in chronic liver disease. Hepatology 1991, 14:1280-1282 [PubMed] [Google Scholar]
- 24.Plouet J, Moro F, Bertagnolli S, Coldeboeuf N, Mazarguil H, Clamens S, Bayard F: Extracellular cleavage of the vascular endothelial growth factor 189-amino acid form by urokinase is required for its mitogenic effect. J Biol Chem 1997, 272:13390-13396 [DOI] [PubMed] [Google Scholar]
- 25.Sato S, Higashi T, Ougushi S, Hino N, Tsuji T: Elevated urokinase-type plasminogen activator plasma levels are associated with deterioration of liver function but not with hepatocellular carcinoma. J Gastroenterol 1994, 29:745-750 [DOI] [PubMed] [Google Scholar]
- 26.Leyland H, Gentry J, Arthur M, Benyon R: The plasminogen-activating system in hepatic stellate cells. Hepatology 1996, 24:1172-1178 [DOI] [PubMed] [Google Scholar]
- 27.Unemori E, Ferrara N, Bauer E, Amento E: Vascular endothelial growth factor induces interstitial collagenase expression in human endothelial cells. J Cell Physiol 1992, 153:557-562 [DOI] [PubMed] [Google Scholar]
- 28.Pepper M, Ferrara N, Orci L, Montesano R: Vascular endothelial growth factor (VEGF) induces plasminogen activators and plasminogen activator inhibitor-1 in microvascular endothelial cells. Biochem Biophys Res Commun 1991, 181:902-906 [DOI] [PubMed] [Google Scholar]
- 29.Clauss M, Gerlach M, Gerlach H, Brett J, Wang F, Familletti P, Pan Y-C, Olander J, Connoly D, Stern D: Vascular permeability factor: a tumor-derived polypeptide that induces endothelial cell and monocyte procoagulant activity, and promotes monocyte migration. J Exp Med 1990, 172:1535-1545 [DOI] [PMC free article] [PubMed] [Google Scholar]
- 30.Basilico C, Moscatelli D: The FGF family of growth factors, and oncogenes. Adv Cancer Res 1992, 59:115-165 [DOI] [PubMed] [Google Scholar]
- 31.Bugler B, Amalric F, Prats H: Alternative initiation of translation determines cytoplasmic or nuclear localization of basic fibroblast growth factor. Mol Cell Biol 1991, 11:573-577 [DOI] [PMC free article] [PubMed] [Google Scholar]
- 32.Charlotte F, Win K, Préaux A, Dhumeaux D, Zafrani E, Mavier P: Immunolocalization of heparin-binding growth factors (HBGF) types 1 and 2 in rat liver: selective hyperexpression of HBGF-2 in carbon tetrachloride-induced fibrosis. J Pathol 1993, 169:471-476 [DOI] [PubMed] [Google Scholar]
- 33.Ankoma-Sey V, Matli M, Chang K, Lalazar A, Donner D, Wong L, Warren R, Friedman S: Coordinated induction of VEGF receptors in mesenchymal cell types during rat hepatic wound healing. Oncogene 1998, 17:115-121 [DOI] [PubMed] [Google Scholar]
- 34.Karsan A, Yee E, Poirier G, Zhou P, Craig R, Harlan J: Fibroblast growth factor-2 inhibits endothelial cell apoptosis by Bcl-2-dependent and independent mechanisms. Am J Pathol 1997, 151:1775-1784 [PMC free article] [PubMed] [Google Scholar]
- 35.Hayashi T, Abe K, Susuki H, Itoyama Y: Rapid induction of vascular endothelial growth factor gene expression after transient middle cerebral artery occlusion in rats. Stroke 1997, 28:2039-2044 [DOI] [PubMed] [Google Scholar]
- 36.Vasir B, Aiello L, Yoon K, Quickel R, Bonner-Weir S, Weir G: Hypoxia induces vascular endothelial growth factor gene and protein expression in cultured rat islet cells. Diabetes 1998, 47:1894-1903 [DOI] [PubMed] [Google Scholar]
- 37.Forsythe J, Jiang B-H, Iyer N, Agani F, Leung S, Koos R, Semenza G: Activation of vascular endothelial growth factor gene transcription by hypoxia-inducible factor 1. Mol Cell Biol 1996, 16:4604-4613 [DOI] [PMC free article] [PubMed] [Google Scholar]
- 38.Stein I, Neeman M, Shweiki A, Itin A, Keshet E: Stabilization of vascular endothelial factor mRNA by hypoxia and hypoglycemia and coregulation with other ischemia-induced genes. Mol Cell Biol 1995, 15:5363-5368 [DOI] [PMC free article] [PubMed] [Google Scholar]
- 39.Saperstein LA, Jirtle RL, Farouk M, Thompson HJ, Chung KS, Meyers W: Transforming growth factor-β1 and mannose 6-phosphate/insulin-like growth factor-II receptor expression during intrahepatic bile duct hyperplasia and biliary fibrosis in the rat. Hepatology 1994, 19:412-417 [PubMed] [Google Scholar]
- 40.Napoli J, Prentice D, Niinami C, Bishop A, Desmond P, McCaughan GW: Sequential increases in the intrahepatic expression of epidermal growth factor, basic fibroblast growth factor and transforming growth factor-β in a bile duct ligated rat model of cirrhosis. Hepatology 1997, 26:624-633 [DOI] [PubMed] [Google Scholar]
- 41.Dolecki GJ, Connoly DT: Effects of a variety of cytokines and inducing agents on vascular permeability factor mRNA level in U937 cells. Biochem Biophys Res Commun 1991, 180:572-578 [DOI] [PubMed] [Google Scholar]
- 42.Finkenzeller G, Technau A, Marme D: Hypoxia-induced transcription of the vascular endothelial growth factor gene is independent of functional AP-1 transcription factor. Biochem Biophys Res Commun 1995, 208:432-439 [DOI] [PubMed] [Google Scholar]
- 43.Brogi E, Wu T, Namiki A, Isner JM: Indirect angiogenic cytokines upregulate VEGF and bFGF gene expression in vascular smooth muscle cells, whereas hypoxia upregulates VEGF expression only. Circulation 1994, 90:649-652 [DOI] [PubMed] [Google Scholar]
- 44.Pertovaara L, Kaipainen A, Mustonen T, Orpana A, Ferrara N, Saksela O, Alitalo K: Vascular endothelial growth factor is induced in response to transforming growth factor-β in fibroblastic and epithelial cells. J Biol Chem 1994, 269:6271-6274 [PubMed] [Google Scholar]
- 45.Levy AP, Levy NS, Wegner S, Goldberg MA: Transcriptional regulation of vascular endothelial growth factor by hypoxia. J Biol Chem 1995, 270:13333-13340 [DOI] [PubMed] [Google Scholar]