

Abstract
Admixture mapping is an economical and powerful approach for localizing disease genes in populations of recently mixed ancestry and has proven successful in African Americans. The method holds equal promise for Latinos, who typically inherit a mix of European, Native American, and African ancestry. However, admixture mapping in Latinos has not been practical because of the lack of a map of ancestry-informative markers validated in Native American and other populations. To address this, we screened multiple databases, containing millions of markers, to identify 4,186 markers that were putatively informative for determining the ancestry of chromosomal segments in Latino populations. We experimentally validated each of these markers in at least 232 new Latino, European, Native American, and African samples, and we selected a subset of 1,649 markers to form an admixture map. An advantage of our strategy is that we focused our map on markers distinguishing Native American from other ancestries and restricted it to markers with very similar frequencies in Europeans and Africans, which decreased the number of markers needed and minimized the possibility of false disease associations. We evaluated the effectiveness of our map for localizing disease genes in four Latino populations from both North and South America.
Admixture mapping is an economical and theoretically powerful approach for localizing disease genes in populations of recently mixed ancestry in which the ancestral populations have differing genetic risk.1–3 The development of African American admixture maps has already led to several admixture scans of that population.4–8 For example, admixture mapping identified a 3.8-Mb risk locus on chromosome 8q24 at which African Americans with prostate cancer (MIM 176807) have increased African ancestry relative to their genomewide average,7 which led to the discovery of multiple risk alleles for the disease.9
Latino populations provide an equally promising opportunity for admixture mapping, because of their mixture of ancestry from different continents as well as their large population size: there are >40 million Latinos in the United States and hundreds of millions more in Latin America.10 “Latino” can have a wide range of meanings, but, here, we refer to individuals of Latin American ancestry in the Americas who do not identify themselves as Native American, African American, or European American. Latinos defined in this way have a mix of European, Native American, and West African ancestry because of a history of population mixture initiated at the time of European colonial rule (15th–19th centuries). The ancestry of Latino populations varies across regions, depending on local factors, such as the Native American population density at the time when immigrants arrived and the amount of European and African immigration in specific regions.11,12 Disease incidence in Native American and Latino populations compared with populations of European ancestry is much higher for type 2 diabetes (MIM 125853), obesity (MIM 601665), gallbladder disease (MIM 600803), and rheumatoid arthritis (MIM 180300) and is lower for asthma (MIM 600807) and prostate cancer, which makes all these phenotypes promising candidates for admixture mapping in Latino populations.13–18
The main barrier to admixture mapping in Latinos has been the lack of a practical Latino admixture map for inferring the ancestry of chromosomal segments at each location in the genome. A previous study characterized a set of microsatellite markers for potential use in admixture mapping and predicted that SNP markers would soon lead to a practical Latino admixture map.19 Four technical challenges needed to be overcome before a practical admixture map for Latinos could be built:
-
1.
The first challenge is the lack of a large database of markers with frequencies known in Native Americans. (By contrast, large databases of markers with frequencies known in European and African populations have been available for several years.20) We addressed this by mining multiple databases, particularly a proprietary database of 1.5 million markers with frequencies known in European and Mexican populations. Marker selection was performed under the assumption that allele-frequency differences in Europeans and Mexicans are due primarily to the Native American–ancestry contribution in Mexicans. The usefulness of all markers was assessed by new genotyping in 4 Latino and 15 putative ancestral populations.
-
2.
The second challenge is the history of three-way mixture in Latinos.11,12,21,22 To build an appropriate admixture map, one can identify markers that distinguish among all three ancestral populations,3 but this requires a very high density of markers and complex statistical machinery and is inefficient, since African ancestry in Latinos is usually small (<10%), and such a small proportion is not expected to contribute power to an admixture scan.1 We instead favor performing an admixture scan in which one distinguishes between Native American and European/African ancestry. This requires special care to avoid false-positive disease associations; for example, if a marker in the map has an allele frequency of 10% in Europeans, 70% in Native Americans, and 90% in Africans, then genomic segments of African ancestry could erroneously be assigned to Native American ancestry, which would produce an apparent increase in Native American ancestry in disease cases at this locus. We were careful to build a map that contains only markers that have very similar allele frequencies in Europeans and Africans. Although this eliminated many potentially informative markers from the map, the panel that we produced is more robust, allowing us to use Europeans as a reliable ancestral population to estimate the European/African segments and to avoid false-positive results.
-
3.
The third challenge is the genetic heterogeneity across Native American populations, in contrast to the relative homogeneity across European or across West African populations.4,23,24 This can lead to false-positive associations in admixture scans if markers with different frequencies across Native American populations are used. We addressed this by sampling 12 diverse Native American populations, choosing a subset of 4 Native American populations that best represent the Native American–ancestry contribution of Latinos, and by eliminating markers that are substantially different in frequency across these populations. We show that, for markers in our admixture map, these four Native American populations provide a suitable ancestral population for the Native American segments of Latino chromosomes.
-
4.
The fourth challenge is the considerably greater linkage disequilibrium (LD) in Native American populations compared with that in other populations.25 The inclusion, in a map construction, of markers that are in LD in the ancestral populations can lead to false-positive associations in admixture scans if nonindependent signals are treated as independent.1 We addressed this during map construction by excluding pairs of markers found to be in LD in the Native American samples we genotyped (with a similar LD exclusion for European and African samples).
For the construction of our admixture map, we ascertained 4,186 markers from databases containing millions of markers and validated these markers by genotyping them in at least 232 samples from Latino, European, Native American, and African populations. We used results of this validation genotyping to select a final set of 1,649 markers for a 1st-generation Latino admixture map. We evaluated the robustness of this map for disease mapping in representative Latino populations from across the Americas and showed that its informativeness is comparable to the first African American admixture map.4
Material and Methods
Population Samples for Validating Ancestry-Informative Markers
We analyzed 142 Latino individuals: 38 self-identified Latino Americans from Los Angeles (whom we call “LA Latinos”), 37 from Mexico City (whom we call “Mexicans”), 37 from Rio Grande do Sul, Brazil (Gauchos collected in the cities of Bage and Alegrete, whom we call “Brazilians”), and 30 from Antioquia, Colombia (collected in the city of Medellín, whom we call “Colombians”). We also analyzed 327 samples from putative ancestral populations: 57 samples of European ancestry (31 from Valencia, Spain, and 26 from Baltimore), 28 Africans from Ghana, 147 Native North Americans, and 95 Native South Americans. The 147 Native North Americans included 31 Zapotec, 29 Mixe, and 23 Mixtec from the central region of the State of Oaxaca, 21 Maya from the Yucatan, 22 Mazahuas from central Mexico, and 21 Purépechas from Michoacán. The 95 Native South Americans included 24 Kogi, 16 Ticuna, 9 Embera, 8 Quechua, 9 Waunana, and 29 Zenú. Informed consent was obtained from all human subjects by the investigators who collected the samples. The anonymized samples were all genotyped at the Broad Institute of the Massachusetts Institute of Technology and Harvard.
SNP Databases
The most important source of ancestry-informative markers was a database of ∼1.5 million markers genotyped in pooled European and pooled Mexican samples,26 part of a disease-mapping study performed by Perlegen Sciences (“POOLED”). Other sources included >100,000 Affymetrix 100K markers genotyped in European, Japanese, African American, Latino, and native Hawaiian populations in the Multiethnic Cohort27 (“MEC”); ∼3.8 million markers whose frequencies in European, East Asian, and African populations were reported by The International HapMap Consortium28 (“HAPMAP”); ∼1.6 million markers whose frequencies in European American, Asian American, and African American populations were reported by Hinds et al.29 (“HINDS”); 238,000 markers that we genotyped in 19 Native Americans (11 Zapotec and 8 Mixe) on the Affymetrix Sty 250K chip (“250K”); and small sets of ancestry-informative markers whose frequencies in European, African, and Native American populations were published by Smith et al.4 (“SMITH”), Parra et al.30 (“PARRA”), Collins-Schramm et al.31 (“COLLINS”), Sawyer et al.32 (“SAWYER”), and Martinez-Marignac et al.15 (“MARTINEZ”). There was no overlap between the samples used to build these databases of SNP frequencies and the samples we used for validation genotyping.
Ascertainment of Candidate Ancestry-Informative Markers
A total of 4,186 markers were selected in three successive stages: 1,536 markers in each of the first two stages and 1,114 in the third stage. Expected Shannon information content (SIC) between European and Native American populations was computed for each marker on the basis of observed frequencies in European and Latino, Native American, or East Asian populations.4 (In the absence of frequencies from Latino or Native American populations, East Asians provide a useful surrogate for Native Americans, because they diverged from Native Americans more recently than the divergence of both populations from Europeans.30) Markers were chosen by an algorithm that iteratively selected the candidate marker that was most incrementally informative, on the basis of the SIC prediction, after taking into account information already captured by markers selected elsewhere.4 (For the second and third ascertainment stages, markers from earlier stages were included in the input to the algorithm, with SIC computed from validation genotyping results.) To minimize the likelihood of choosing markers in LD in Native American or other populations, we selected only markers with a genetic distance at least 0.3 cM from each previously selected marker, according to the Oxford genetic map.33
Validation of Candidate Ancestry-Informative Markers
The first set of 1,536 markers was genotyped in all available samples from Latino populations and their putative ancestral populations (a total of 142 and 327 samples, respectively). For validation of the second and third stages, we genotyped a subset of DNA samples: 68 Latinos (29 LA Latinos, 24 Brazilians, and 15 Colombians), 54 Europeans (31 from Spain and 23 from Baltimore), 84 Native North Americans (22 Zapotec, 28 Mixe, 21 Mixtec, and 13 Mazahuas), and 26 Africans from Ghana. A total of 23 Zenú samples from South America were also genotyped but were not used in construction of our admixture map. To study samples with maximum informativeness for admixture mapping, Latino samples with >20% African ancestry or <10% European or Native American ancestry were excluded from the second and third stages, and Native American samples with >10% non–Native American admixture were also excluded. Genotyping was performed using the Illumina GoldenGate platform for the first two stages and the iPLEX assay of the Sequenom MassARRAY platform for the third stage.34,35
Genomewide Ancestry Inference with Use of Mixture-of-Binomials Model
Given a Latino population with counts ai0 and Ni0-ai0 of two alleles at marker i, and given M ancestral populations with counts aij and Nij-aij at marker i in population j (l⩽j⩽M), we inferred the underlying frequencies αij, together with ancestry proportions ξj. We used a mixture-of-binomials model in which the likelihood is proportional to
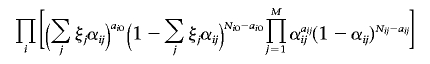 |
for each admixed population, and we estimated the parameters of this model by a Markov Chain–Monte Carlo algorithm.36 The accuracy of these estimates is limited by the fact that we do not, in fact, know the true ancestral populations. This model naturally generalizes to simultaneous inference of ancestry proportions of multiple Latino populations. Ancestry of individual Latino samples can also be inferred by viewing each Latino sample as a separate population.
Calculation of the Number of Samples Needed to Detect an Admixture Association
Suppose that there exists a disease locus at which 0, 1, or 2 chromosomal segments with Native American ancestry confer relative risks of 1, R, or R2, respectively. If we define θ as the percentage of Native American ancestry, the probability of 0, 1, or 2 segments with Native American ancestry at the disease locus is equal to pθ,0=(1-θ)2, pθ,1=2θ(1-θ), or pθ,2=θ2, respectively, for controls and qθ,0=(1-θ)2/σ, qθ,1=2θ(1-θ)R/σ, or qθ,2=θ2R2/σ, respectively, for disease cases, where σ=(1-θ)2+2θ(1-θ)R+θ2R2. The contribution of each disease sample to the overall LOD score is then equal to  , where k is the actual number of chromosomal segments with Native American ancestry. Given N disease samples with genomewide ancestries θ1,…,θN, the expected LOD score is
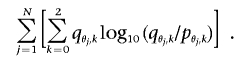 |
To compute the power of an admixture scan for a population distribution of θ values, we calculate the number of disease samples needed, so that the expected LOD score is at least 5, which is significant genomewide. (For real disease scans involving a map with imperfect information, the number of samples required to achieve significance needs to be scaled by relative informativeness at the locus.)
Selection of Markers for the Admixture Map
Marker selection was performed in several steps. (i) First, we excluded markers with an SIC >0.05 between Europeans and Africans and excluded markers with an SIC >0.05 between Zapotec (the Native American population of highest utility; see below) and other Native Americans. (ii) Second, we excluded pairs of markers in LD in the ancestral populations, on the basis of the validation genotyping data for Native Americans, Europeans, and Africans. In each population, we determined whether a pair of markers was in LD, using a threshold of P<.01, for markers located 1 cM apart, with a changing threshold inversely proportional to genetic distance. (iii) Third, marker selection for the map was based on the SIC between Europeans and Native Americans, as determined by validation genotyping in 54 Europeans and 84 Native North Americans. With use of these SIC values, 1,649 markers were selected by an algorithm that iteratively chose the marker (not in LD with a previously selected marker) that was most incrementally informative after taking into account information already captured by previously selected markers. This is similar to the algorithm we described elsewhere for building an African American admixture map.4 We imposed a minimum cutoff of 0.05 for incremental information content, after which no additional markers were chosen for the map. Sources of markers in the final admixture map are listed in table 1.
Table 1. .
Sources of Markers Included in Validation Genotyping and in the Final Admixture Map
| No. of Markers from Included Source |
||||
| Marker Category |
Stage 1 |
Stage 2 |
Stage 3 |
Admixture Map |
| POOLED | 1,223 | 125 | 544 | 858 |
| SMITH | 276 | 0 | 0 | 0 |
| PARRA | 8 | 0 | 0 | 0 |
| COLLINS | 29 | 0 | 0 | 6 |
| HAPMAP | 0 | 1,021 | 49 | 347 |
| HINDS | 0 | 92 | 0 | 21 |
| MEC | 0 | 297 | 45 | 151 |
| SAWYER | 0 | 1 | 0 | 0 |
| 250K | 0 | 0 | 469 | 259 |
| MARTINEZ | 0 |
0 |
7 |
5 |
| Total | 1,536 | 1,536 | 1,114 | 1,649 |
Percentage of Maximum-Informativeness Computation
We used Shannon entropy as a measure of the uncertainty in genomewide ancestry or ancestry at a given locus. For a given locus i and individual j, we define Gj as the entropy of the genomewide ancestry estimate of individual j and let Xij be the entropy of the ancestry estimate of individual j at locus i. We define the relative power at locus i as ri=1-ΣjXij/ΣjGj. For example, if Xij=Gj for all j, then there is no information about local ancestry (except for what is known about genomewide ancestry), so ri=0. On the other hand, if Xij=0 for all j, then there is perfect information about local ancestry, so ri=1. We define ravg as the average of ri across loci. A rough interpretation of ravg is that 1/ravg times as many samples must be genotyped, relative to a study with perfect information about local ancestry (ravg=1), to achieve comparable power. The computation of ravg accounts for uncertainty in the frequencies of the alleles in the ancestral populations and thus corresponds to the estimate of ∼50% of maximum informativeness reported in the first African American admixture map.4 The computation of ravg is now part of ANCESTRYMAP software1 (D.R. Lab Web site). We excluded one LA Latino and two Colombian individuals with >10% missing data from our computation of ravg, since such individuals would typically be dropped from a disease scan.
Simulated Disease Studies
We simulated Mexican, Colombian, and Puerto Rican populations, using European, Native American, and African ancestry proportions described in the present study and elsewhere.21,22 Chromosomal segments were created under the assumption of λ=9 generations since admixture and were assigned ancestries by use of those proportions. Genotypes were sampled from the 54 European, 84 Native American, and 26 African samples used to build our admixture map. We also simulated Latino populations with Native American genotypes sampled from only 22 Zapotec samples or 23 Zenú samples. We call these Latino populations “LAT-ZAPO” and “LAT-ZENU,” respectively. To simulate disease cases, we chose 10 disease loci at which our ravg statistic most closely matched its genomewide average (0.47 for LA Latinos and 0.50 for Brazilians and Colombians), and we used one of these disease loci in each of 10 simulations. We assumed increased disease risk of 1.5 for each chromosome with Native American ancestry at the disease locus, thus raising the proportion of Native American ancestry at that locus and chromosomal segments containing it. In control-only runs, controls were used to generate both 1,000 “case” samples and 1,000 “control” samples. In case-control runs, 1,000 cases and 1,000 controls were used. Simulations were run using ANCESTRYMAP software1 (D.R. Lab Web site), which produces a local LOD (log10 odds) score and a genomewide LOD score on the basis of a locus-genome statistic that compares ancestry of cases at a candidate locus with genomewide ancestry of cases. In this computation, controls are used only to improve allele-frequency estimates of ancestral populations, which aids inference of local ancestry in disease cases.
Results
Ancestry Proportions of Four Latino Populations
To evaluate the likely performance of Latino admixture mapping, we characterized the ancestry proportions and admixture history of the four Latino populations examined here. For this analysis, we analyzed data only from the first set of 1,536 markers, which were genotyped in the largest number of populations (see the “Material and Methods” section). We focused primarily on autosomal markers. Analyses were performed using (i) the EIGENSOFT principal components analysis software package37 (D.R. Lab Web site), which also computes analysis of variance (ANOVA) and FST statistics; (ii) a mixture-of-binomials model (see the “Material and Methods” section); and (iii) the ANCESTRYMAP software package1 (D.R. Lab Web site). Native American ancestries reported by each of these methods and by the STRUCTURE program38 were highly concordant with pairwise correlations >99% across samples (data not shown).
The top two axes of variation from principal components analysis are displayed in figure 1. The top axis distinguishes European/African from Native American ancestry, and the second axis distinguishes African from non-African ancestry. There is a wide variation in Native American ancestry among Latino individuals. There is a relatively small contribution of African ancestry in all Latino populations, except for a small number of outlying samples (also see mixture-of-binomials results in table 2). In addition, there was clear evidence of admixture in many Native American samples. ANOVA found no significant population differences between LA Latinos and Mexicans or between Brazilians and Colombians along the top 10 axes (P values >.10). Differences between Native North Americans and Native South Americans were marginal along the top two axes (P values >.03) but were highly significant along the third axis (P value <1×10-12).
Figure 1. .

Top two axes of variation of Latinos, Europeans, Native Americans, and Africans. Coordinates along the top two axes of variation (eigenvectors) are dimensionless but roughly correspond to percentage of Native American ancestry for the first axis and percentage of African ancestry for the second axis. LA Latino (n=38), MEX=Mexican (n=37), BRA=Brazilian (n=37), COL=Colombian (n=30), EUR=European (n=57), NAM=Native North American (n=147), SAM=Native South American (n=95), and AFR=African (n=28).
Table 2. .
Ancestry Estimates of Four Latino Populations[Note]
| Ancestry by Population(%) |
||||
| Ancestry | LA Latino | Mexican | Brazilian | Colombian |
| European | 48 | 52 | 71 | 71 |
| Native North American | 40 | 43 | 10 | 7 |
| Native South American | 4 | 2 | 8 | 12 |
| African | 8 | 4 | 11 | 10 |
Note.— Estimates are conditioned on data from the European, Native North American, Native South American, and African populations that we sampled, with the assumption that these are the correct ancestral populations. For each Latino population analyzed, SEs of population ancestries are <1% for European, total Native American, and African ancestry and are <2% for Native North American and Native South American ancestry. African ancestry estimates decrease to 5% for LA Latinos and to 8% for Brazilians if one LA Latino outlier and three Brazilian outliers with unusually high African ancestry are omitted (fig. 1).
We used the mixture-of-binomials model to infer Latino ancestry proportions from European, Native North American, Native South American, and African ancestral populations; this computation approximates each Latino population as entirely descended from the ancestral populations we sampled. Results are reported in table 2 and indicate higher total Native American ancestry for LA Latinos and Mexicans (45% and 44%, respectively) than for Brazilians and Colombians (18% and 19%, respectively), which is in line with previous studies.21,22 We also observed uniformly higher Native American ancestry on the X chromosome (57% for LA Latinos, 54% for Mexicans, 33% for Brazilians, and 27% for Colombians), which is consistent with evidence of predominantly European patrilineal and Native American matrilineal ancestry in Latino populations.22 As expected, LA Latinos and Mexicans are well modeled as having all their Native American ancestry from North America (table 2). Interestingly, the Native American ancestry of Brazilians and Colombians is modeled equally well by Native North American and Native South American populations. We hypothesize that this is because of the higher levels of genetic drift that occurred in Native South American populations23,39—consistent with their migration from North to South America and relative isolation within South America—so that none of the Native South American populations we sampled provides a good match for the true Native American ancestral populations of Brazilians and Colombians. In support of this view, values of FST (measuring genetic drift) reported by EIGENSOFT (D.R. Lab Web site) averaged 0.09 among the six Native South American populations but only 0.03 among the six Native North American populations and only 0.06 between Native North American and Native South American populations (table 3). All of the sampled populations had African ancestry percentages between 4% and 11% (table 2). Because markers with large frequency differences between Europe and Africa were included in this analysis, there is little uncertainty in the estimates of ancestry proportions (table 2).
Table 3. .
FST Estimates for Each Pair of Native American Populations[Note]
|
FST Estimate |
|||||||||||
| Mixe | Mixtec | Maya | Mazahuas | Purepechas | Kogi | Ticuna | Embera | Quechua | Waunana | Zenú | |
| Zapotec | .02 | .03 | .03 | .03 | .03 | .09 | .07 | .07 | .03 | .07 | .05 |
| Mixe | .05 | .06 | .05 | .06 | .10 | .07 | .08 | .05 | .10 | .07 | |
| Mixtec | .04 | .03 | .04 | .11 | .08 | .07 | .04 | .08 | .05 | ||
| Maya | .02 | .02 | .10 | .08 | .05 | .03 | .04 | .03 | |||
| Mazahuas | .02 | .10 | .08 | .06 | .03 | .06 | .04 | ||||
| Purepechas | .11 | .08 | .06 | .03 | .06 | .04 | |||||
| Kogi | .13 | .11 | .11 | .13 | .10 | ||||||
| Ticuna | .09 | .08 | .11 | .08 | |||||||
| Embera | .06 | .07 | .05 | ||||||||
| Quechua | .05 | .04 | |||||||||
| Waunana | .07 | ||||||||||
Note.— FST estimates are based on data from 147 Native North American samples (31 Zapotec, 29 Mixe, 23 Mixtec, 21 Maya, 22 Mazahuas, and 21 Purepechas) and 95 Native South American samples (24 Kogi, 16 Ticuna, 9 Embera, 8 Quechua, 9 Waunana, and 29 Zenú). For each pair of populations, the SE of the FST estimate is <0.01. These results are intended to provide a qualitative picture of allele-frequency differentiation among populations, but we caution that the markers used in this analysis were chosen to be highly differentiated between Native American and European populations, which may lead to bias compared with analysis of randomly chosen markers.
We repeated this calculation, using 15 distinct ancestral populations, instead of grouping ancestral populations into four continents (table 4). Among European-derived populations, the Spanish appear more closely related to the European ancestors of all the Latino populations than self-identified European Americans, who are likely to be primarily of northern European descent. This is consistent with the history of Spanish and Portuguese colonization in Latin America. Among Native American populations, the Zapotec from Oaxaca in southern Mexico provide the best predictor for the Native American ancestry of LA Latinos (19%) and Mexicans (18%). The Mixe also provide a substantial contribution to LA Latinos (9%) and Mexicans (7%), which is not surprising, since they are genetically close to the Zapotec (table 3). None of the Native American populations we sampled contributed >3% to Brazilian or Colombian ancestry. On the basis of these results, we favored Native North American populations for modeling the Native American ancestry of each Latino population in subsequent analyses, with the Zapotec as the single most useful population for the purpose of building a map. From a historical point of view, it is important to recognize that these results do not mean the Zapotec are the true ancestors of these Latino populations. Our sampling of Native American populations is incomplete (e.g., there are many unsampled Native American populations in northern Mexico), and it could easily be the case that an unsampled population is a better match to the true ancestors of each Latino population.
Table 4. .
Ancestry Estimates of 4 Latino Populations from 15 Ancestral Populations Sampled[Note]
| Ancestry by Population(%) |
||||
| Ancestral Population |
LA Latino | Mexican | Brazilian | Colombian |
| EUR: Spanish | 34 | 36 | 35 | 48 |
| EUR: Baltimore | 15 | 17 | 37 | 24 |
| NAM: Zapotec | 19 | 18 | 2 | 2 |
| NAM: Mixe | 9 | 7 | 1 | 1 |
| NAM: Mixtec | 2 | 2 | 1 | 1 |
| NAM: Maya | 1 | 4 | 2 | 2 |
| NAM: Mazahuas | 3 | 4 | 0 | 1 |
| NAM: Purepechas | 3 | 4 | 1 | 1 |
| SAM: Kogi | 3 | 2 | 2 | 3 |
| SAM: Ticuna | 2 | 2 | 1 | 1 |
| SAM: Embera | 1 | 0 | 1 | 2 |
| SAM: Quechua | 1 | 1 | 3 | 1 |
| SAM: Waunana | 1 | 1 | 1 | 1 |
| SAM: Zenú | 1 | 0 | 1 | 3 |
| AFR: Ghana | 7 | 4 | 11 | 10 |
Note.— For each Latino population analyzed, SEs are <1% for total European, total Native American, and African ancestry; <4% for ancestry from each European population; and <2% for ancestry from each Native American population. African ancestry estimates decrease to 5% for LA Latinos and 8% for Brazilians when one LA Latino outlier and three Brazilian outliers with unusually high African ancestry are omitted (fig. 1).
We next used the ANCESTRYMAP (D.R. Lab Web site) admixture-mapping software to infer the percentage of Native American ancestry (θ) and average number of generations since admixture (λ) of each Latino sample. We restricted our analysis to SNPs genotyped in the first stage, which we genotyped in all 142 Latinos. For the ancestral populations, we used 54 samples of European ancestry and 84 Native North Americans (see the “Map Construction” section). The distribution of θ for samples from each Latino population is displayed in figure 2. Percentage of Native American ancestry varies widely across populations and individuals within populations: average estimates of individual ancestry (±SD) are θ=43%±20% for LA Latinos, θ=42%±22% for Mexicans, θ=19%±10% for Brazilians, and θ=21%±13% for Colombians. The ancestry estimates are concordant with those obtained by other methods (fig. 1 and table 2), despite the different set of ancestral samples. Our estimates of the average number of generations since admixture are λ=8.5±0.9 for LA Latinos, λ=8.8±1.2 for Mexicans, λ=8.4±1.0 for Brazilians, and λ=9.2±0.9 for Colombians. These values are somewhat higher than the λ=6.3±1.1 we reported elsewhere for African Americans,4 which implies that segments of ancestry in Latinos will be shorter on average than in African Americans and that admixture genome scans for Latinos will require more markers than for African Americans to achieve a similar level of informativeness.
Figure 2. .

Histogram of percentage of Native American ancestry in samples from four Latino populations
Expected Power of Admixture Mapping in Four Latino Populations
To estimate the number of cases that would be needed to detect an admixture association in the Latino populations examined here, we used the distribution of ancestries of individual samples and assumed perfect information about ancestry at each locus in the genome (see the “Material and Methods” section). For this analysis, LA Latinos were merged with Mexicans, and Brazilians were merged with Colombians, because of their similar ancestry distributions within the limits of our resolution (fig. 2). We included in this analysis our previous results for African Americans.4 Figure 3 shows that LA Latinos and Mexicans provide the highest statistical power per sample for admixture mapping (fewest samples needed), because of the large proportions of both European and Native American ancestry in these populations. In contrast, Brazilians and Colombians provide the lowest power, because of their low percentage of Native American ancestry. To illustrate the difference in power across populations because of varying Native American ancestry proportion, we calculate that, to detect a locus with 50% of the maximum information content where Native American ancestry on average confers 1.5-fold increased risk for disease, 724 cases are needed for detection in LA Latinos and Mexicans, and 846 cases are needed for detection in Brazilians and Colombians (these numbers are obtained by dividing the values in fig. 3 by 50%).
Figure 3. .

Number of samples needed to detect a disease locus with use of admixture mapping. For each population, this quantity is computed under the ideal assumption of perfect information about ancestry, as a function of the relative disease risk conferred by each copy of a particular ancestry at the disease locus. To convert from this to the actual number of samples required for detecting a disease locus with the map, it is necessary to multiply by 1/ravg; that is, the reciprocal of the information extraction at the locus (estimated in fig. 5).
Map Construction
On the basis of our empirical observations about population structure from the first stage of validation genotyping, we made several decisions for subsequent map construction. First, we decided to focus on distinguishing only between European/African ancestry and Native American ancestry and thus eliminated all markers with an SIC >0.05 between Europeans and Africans. Second, we decided to model the Native American ancestry component of Latinos by using Native North Americans only. Third, we restricted the second and third stages of validation genotyping to a subset of samples that we believed would most efficiently provide information relevant to assessing the quality of the admixture map. We analyzed 54 European and 26 African samples. For Native North Americans, we excluded samples with >10% non–Native American admixture. Because roughly half of Maya and Purepechas samples showed significant admixture, we restricted sample selection to the Zapotec, Mixe, Mixtec, and Mazahuas populations, which yielded 84 samples. For Latinos, we did not include Mexicans, because the LA Latinos appeared to have similar admixture history. We also excluded samples that had been estimated in the first stage to have high African ancestry (>20%) or low European or Native American ancestry (<10%). Fourth, to exclude markers with heterogeneous allele frequencies across populations, we eliminated all markers with an SIC >0.05 between the Zapotec (the most useful Native American ancestral population in practice) and the remaining Native American populations (Mixe, Mixtec, and Mazahuas).
Of the 4,186 markers genotyped in three stages, 3,130 markers were genotyped successfully in all populations and had an SIC <0.05 between Europeans and Africans and an SIC <0.05 between Zapotec and the remaining Native American populations. We used the genotyping results to construct a map of 1,649 markers (see the “Material and Methods” section). As shown in table 1, the POOLED database contributed the greatest number of markers to the map, because of its large number of markers and directly relevant populations (Europeans and Mexicans). We note that no markers from our African American admixture map (SMITH) were chosen, because of the decision to exclude markers that are substantially different in frequency between Europeans and Africans. A scatter plot of frequencies of the 1,649 markers in Europeans and Native Americans, as determined by validation genotyping, is displayed in figure 4. Because most markers were ascertained from data sets that included European but not Native American ancestral populations, more markers are fixed (or nearly fixed) in Europeans than in Native Americans. A complete list of markers and their frequencies in Europeans and Native Americans is available online (see the Latino admixture map Web site). The average frequency difference between Europeans and Native Americans in validation genotyping was 52%, yielding an FST between these populations of 0.50 for this set of markers. In contrast, the FST between Europeans and Africans was <0.05, and the average FST between the Zapotec and the other three Native American populations we retained was <0.01.
Figure 4. .

European and Native American allele frequencies for the 1,649 markers in the final map, which are based on the results of validation genotyping.
Assessment of Possible Overfitting
Because the same set of samples was used to select a subset of 1,649 markers (from the 4,186 candidate markers) for our admixture map and to subsequently evaluate the map, there exists the possibility of overfitting. We assessed the extent of overfitting by splitting the samples into four quartiles. For each quartile, we built an admixture map of 1,649 markers, using only samples from the other three quartiles to prioritize markers. We compared the informativeness of these markers in each of three in-sample quartiles and in one out-of-sample quartile. When we averaged across four choices of the out-of-sample quartile, the frequency difference between Europeans and Native Americans averaged 52.4% for in-sample quartiles and 51.5% for out-of-sample quartiles, an extremely small difference. Thus, there is no substantial overestimation of the informativeness of our map due to overfitting.
Informativeness of Our Admixture Map
We computed a percentage of maximum-informativeness statistic (ravg) that evaluates the informativeness of the admixture map for inferring ancestry of chromosomal segments in Latino populations (see the “Material and Methods” section). We modeled the ancestral populations with 54 European and 84 Native American samples (see the “Map Construction” section). We obtained ravg=0.47 for LA Latinos and ravg=0.50 for a combined analysis of Brazilians and Colombians. The computation of ravg fully accounts for uncertainty in the frequencies of ancestral populations; thus, these results are comparable to the estimate of ∼50% of maximum informativeness for admixture mapping reported in the first African American admixture map, as well as in the Marshfield microsatellite-based maps for linkage mapping.4 The lower ravg for LA Latinos (vs. Brazilians and Colombians or vs. the first African American admixture map) is more than offset by the higher theoretical power of LA Latinos for admixture mapping (fig. 3). For each population, the informativeness at each locus in the genome is displayed in figure 5.
Figure 5. .

Informativeness of the Latino admixture map as a percentage of the maximum, assessed empirically by the ravg statistic in LA Latinos (dark blue) and in Colombians and Brazilians (light blue). The X-axis gives genetic position, with each of 1,649 markers shown using hash marks. Informativeness of the map is slightly less at the edge of chromosomes, since we cannot use markers from both sides to infer ancestry. For comparison, in gray, we also show the power of our 1st-generation African American admixture map (1,166 markers used in a multiple sclerosis study6). chr=Chromosome.
Empirical Evaluation of How Well Ancestral Populations Approximate Latino-Ancestry Segments
We evaluated whether the 54 Europeans and 84 Native Americans provide suitable ancestral populations for segments of European/African and Native American ancestry in the Latino samples we analyzed. This was assessed using the parameter τ reported by ANCESTRYMAP (D.R. Lab Web site), which is asymptotically equal to 0.5/FST for large τ.1 For each Latino population, we estimated that τ>500 (FST<0.001) for European/African segments and τ>100 (FST<0.005) for Native American segments. These results are encouraging: they imply that European samples provide an accurate proxy for European/African ancestry segments, because our construction of a map includes only markers with low differentiation between European and African populations (and because of the fact that only a small proportion of segments of European/African ancestry are actually African). The 84 Native American samples from four populations provide a somewhat less accurate ancestral population, reflecting the underlying population history of population fragmentation and drift in the Americas. Nevertheless, τ>100 is practical for admixture scans.4
Simulated Disease Studies
To evaluate how our admixture map would perform in an actual disease study, we simulated samples from five hypothetical Latino populations with various European, Native American, and African ancestry proportions and various choices of the population contributing Native American ancestry (see the “Material and Methods” section). In control-only runs, 1,000 “case” samples and 1,000 “control” samples were drawn from simulated Latino controls, to check that no false-positive results were reported. As expected, ANCESTRYMAP reported maximum local LOD scores <3 and genomewide LOD scores <0, indicating no disease association (table 5). In case-control runs, 1,000 cases and 1,000 controls were used, with cases simulated on the basis of Native American ancestry risk of 1.5 at the disease locus (see the “Material and Methods” section). For each Latino population simulated, ANCESTRYMAP reported local LOD scores at the disease locus >5 and genomewide LOD scores >2, correctly identifying the disease locus (table 5). We particularly emphasize the success of the simulations in a simulated Latino population (LAT-ZENU) in which Native American ancestry was modeled using data from the Zenú population, which was not used to choose markers or generate counts for our admixture map and which is substantially different from the Zapotec, Mixe, Mixtec, and Mazahuas populations used to build our map (table 3). We also note the success of the simulations in a simulated Puerto Rican population with 20% African ancestry. Together, these results imply that our map will be useful in a wide range of Latino populations.
Table 5. .
Results of Simulated Disease Studies in Five Simulated Latino Populations[Note]
| Control-Only LOD |
Case-Control LOD |
||||
| Population | EUR/NA/AFR Ancestry (%) |
Local | Global | Local | Global |
| MEX | 50/45/5 | .5 | −2.3 | 8.0 | 4.9 |
| COL | 70/20/10 | .9 | −1.8 | 7.0 | 4.0 |
| PR | 60/20/20 | 1.3 | −1.5 | 6.4 | 3.4 |
| LAT-ZAPO | 50/45/5 | .4 | −2.3 | 10.4 | 7.3 |
| LAT-ZENU | 50/45/5 | 1.1 | −1.7 | 6.7 | 3.7 |
Note.— We list the ancestry proportions used to simulate each population and the local and global LOD scores averaged across 10 control-only simulations and 10 case-control simulations. MEX=Mexican; COL=Columbian; PR=Puerto Rican. LAT-ZAPO and LAT-ZENU differ from MEX in that Native American ancestry was simulated using only 22 Zapotec samples and 23 Zenú samples, respectively.
To evaluate the local ancestry estimates produced by ANCESTRYMAP, for each possible pair of ancestries (European, Native American, or African) represented on a pair of chromosomes, we computed the average estimated probability of 0, 1, or 2 Native American chromosomes at that locus and the proportion of loci at which the true number of Native American chromosomes was correctly assigned a probability of at least 50%. Results for Mexican control-only simulations are reported in table 6. (Other simulations produced similar results; data not shown). Overall, ancestry assignments were correct for 77% of all loci, with European versus African ancestry having little effect on accuracy.
Table 6. .
Accuracy of Local-Ancestry Assignments in Simulated Latinos[Note]
| Probability of |
||||
| Ancestries | 0 NA | 1 NA | 2 NA | Loci with True NA Probability >.5 |
| EUR/EUR | .71 | .27 | .02 | .77 |
| EUR/AFR | .70 | .28 | .02 | .76 |
| AFR/AFR | .70 | .28 | .02 | .76 |
| EUR/NA | .17 | .70 | .13 | .81 |
| AFR/NA | .17 | .69 | .14 | .81 |
| NA/NA | .03 | .33 | .64 | .67 |
Note.— For each possible pair of ancestries represented on a pair of chromosomes, we report the average estimated probability of 0, 1, or 2 Native American (NA) chromosomes at this locus, with the probability corresponding to the true number of Native American chromosomes shown in bold. We also report the proportion of loci at which the true number of Native American chromosomes was correctly assigned a probability of at least 50%. Results are reported only for Mexican control-only simulations. EUR=European; AFR=African.
Discussion
We have constructed a Latino admixture map whose power for inferring ancestry of chromosomal segments in Latino samples is comparable to the power of the first African American admixture map4 and thus constitutes a practical resource for admixture mapping in Latinos. Although there are a few gaps in the map and the information extraction is only 47%–50% of the maximum, the quality of panels for admixture mapping can be improved further by genotyping populations with Native American ancestry on whole-genome scanning arrays that are complementary to the data sources we used here. We emphasize that validation of all the markers in new samples of European, Native American, and African ancestry is crucial for construction of a practical map. Of the 4,186 markers we ascertained, only 1,649 markers survived all our filters and proved incrementally informative for disease mapping. We expect that similar reductions will occur with any marker-ascertainment strategy used to generate a robust resource for disease mapping in Latinos, because of the complex admixture history of these populations, which generates many potential pitfalls for disease mapping.
An advantage of our map-building strategy is that we have reduced the complexities inherent in admixture mapping in Latinos. Because we eliminated markers with very different frequencies between European and African populations, the data from this map can be usefully analyzed by existing admixture-mapping software for mapping in two ancestral populations.1,2 As a consequence, our map can be applied to identify risk loci for any disease in which Native American ancestry increases or reduces genetic risk, but it is not able to detect loci with different risks for Europeans versus African ancestry; such loci can be more powerfully mapped in African Americans. We have also improved the robustness of the map by removing markers for which there is evidence of frequency heterogeneity across Native American populations and by restricting the map to markers that are not in LD in the ancestral populations.
Our results also reveal substantial variability in the proportion of Native American ancestry across Latino populations.11,12,21,22 Native American ancestry is close to 50% in LA Latinos and in Mexicans; despite the wide variability within a population (fig. 2), this means that admixture mapping should be 15%–30% more powerful per sample in these populations than in Colombians or Brazilians, who have lower proportions of Native American ancestry (fig. 3). We emphasize that our empirical assessment of Latino populations is by no means comprehensive; there are many Latino populations that have substantially different histories from the populations we studied, including multiple populations in each of the four countries from which our Latino populations were drawn. Nonetheless, our simulations indicate that our admixture map will be useful across a wide range of Latino populations, including Latino populations whose Native American ancestry is substantially different from the Native American populations used to build our map and including Latino populations with up to 20% African ancestry. A caveat is that there exist many Latino populations with a larger contribution of African ancestry, for which our map is not well suited.
An important question is whether admixture mapping will be a useful methodology in the age of dense whole-genome scans with hundreds of thousands of markers. The advantages of admixture mapping include (i) the potentially much lower genotyping cost, which we estimate remains ∼5 times lower per sample for genotyping the ∼1,600 markers in our map, compared with the cost of a dense whole-genome scan; (ii) the use of a locus-genome statistic that considers local ancestry estimates of disease cases only, with no noise introduced from controls, leading to an improvement in power1 by a factor of 2; and (iii) the coarse granularity of the admixture signal, which reduces the number of hypotheses tested (or, in Bayesian terms, increases the prior probability of each causal hypothesis) versus the hundreds of thousands of hypotheses tested in dense whole-genome scans. Disadvantages of admixture mapping include (i) the imperfect proxy that local ancestry will provide for a disease allele, even in the case of a disease allele that differs substantially between ancestral populations; (ii) the imperfect power to estimate local ancestry, which, for our map, is 47%–50%; and (iii) the need for additional fine mapping of <1% of the genome in the fraction of admixture scans that successfully identify a disease locus. Weighing these advantages and disadvantages, we believe that admixture mapping will continue to be a useful methodology for disease mapping, particularly because of the reduction in the number of hypotheses tested and the increase in power that results from not introducing noise from controls.
Acknowledgments
We thank Itsik Peer for assistance with the MEC 100K data, The Broad Institute Center for Genotyping and Analysis, George Ayodo and Courtney Montague for assistance with genotyping, Andrew Kirby for assistance with figure 5, and Maribel Rodriguez, Phabiola Herrera, Giovanni Poletti, Sijia Wang, and David E. Ruiz for assistance with DNA samples. A.L.P. is supported by a Ruth Kirschstein K-08 award from the National Institutes of Health (NIH). A.V. is supported by Colciencias grant 111504012986. M.C.B. and F.M.S. are supported by the Institutos do Milenio and Apoio a Nucleos de Excelencia Programs, Conselho Nacional de Desenvolvimento Cientifico e Tecnologico, and Fundacao de Amparo a Pesquisa do Estado do Rio Grande do Sul. D.R. is supported by a Burroughs Wellcome Career Development Award in the Biomedical Sciences. Support for this project was provided by the Broad-Novartis-Lund Type 2 Diabetes Initiative, discretionary funding from Harvard Medical School (to D.R.), NIH grants NS043538 (to A.R.-L.) and DK073818 (to D.R.), and federal funds from the National Cancer Institute, NIH, under contract N01-CO-12400. C.W. is supported by the Intramural Research Program of the Center for Cancer Research, National Cancer Institute, NIH, but the content of this publication does not necessarily reflect the views or policies of the Department of Health and Human Services, nor does mention of trade names, commercial products, or organizations imply endorsement by the U.S. Government. The Broad Institute Center for Genotyping and Analysis is supported by National Center for Research Resources grant U54 RR020278-01.
Web Resources
The URLs for data presented herein are as follows:
- D.R. Lab Web site, http://genepath.med.harvard.edu/~reich/Software.htm (for ANCESTRYMAP and EIGENSOFT software)
- Latino admixture map, http://genepath.med.harvard.edu/~reich/Latinomap.htm (for the list of 1,649 markers)
- Online Mendelian Inheritance in Man (OMIM), http://www.ncbi.nlm.nih.gov/Omim/ (for prostate cancer, type 2 diabetes, obesity, gallbladder disease, rheumatoid arthritis, and asthma)
References
- 1.Patterson N, Hattangadi N, Lane B, Lohmueller KE, Hafler DA, Oksenberg JR, Hauser SL, Smith MW, O’Brien SJ, Altshuler D, et al (2004) Methods for high-density admixture mapping of disease genes. Am J Hum Genet 74:979–1000 [DOI] [PMC free article] [PubMed] [Google Scholar]
- 2.Hoggart CJ, Shriver MD, Kittles RA, Clayton DG, McKeigue PM (2004) Design and analysis of admixture mapping studies. Am J Hum Genet 74:965–978 [DOI] [PMC free article] [PubMed] [Google Scholar]
- 3.Montana G, Pritchard JK (2004) Statistical tests for admixture mapping with case-control and cases-only data. Am J Hum Genet 75:771–789 [DOI] [PMC free article] [PubMed] [Google Scholar]
- 4.Smith MW, Patterson N, Lautenberger JA, Truelove AL, McDonald GJ, Waliszewska A, Kessing BD, Malasky MJ, Scafe C, Le E, et al (2004) A high-density admixture map for disease gene discovery in African Americans. Am J Hum Genet 74:1001–1013 [DOI] [PMC free article] [PubMed] [Google Scholar]
- 5.Zhu X, Luke A, Cooper RS, Quertermous T, Hanis C, Mosley T, Gu CC, Tang H, Rao DC, Risch N, et al (2005) Admixture mapping for hypertension loci with genome-scan markers. Nat Genet 37:177–181 10.1038/ng1510 [DOI] [PubMed] [Google Scholar]
- 6.Reich D, Patterson N, De Jager PL, McDonald GJ, Waliszewska A, Tandon A, Lincoln RR, DeLoa C, Fruhan SA, Cabre P, et al (2005) A whole-genome admixture scan finds a candidate locus for multiple sclerosis susceptibility. Nat Genet 37:1113–1118 10.1038/ng1646 [DOI] [PubMed] [Google Scholar]
- 7.Freedman ML, Haiman CA, Patterson N, McDonald GJ, Tandon A, Waliszewska A, Penney K, Steen RG, Ardlie K, John EM, et al (2006) Admixture mapping identifies 8q24 as a prostate cancer risk locus in African-American men. Proc Natl Acad Sci USA 103:14068–14073 10.1073/pnas.0605832103 [DOI] [PMC free article] [PubMed] [Google Scholar]
- 8.Tian C, Hinds DA, Shigeta R, Kittles R, Ballinger DG, Seldin MF (2006) A genomewide single-nucleotide–polymorphism panel with high ancestry information for African American admixture mapping. Am J Hum Genet 79:640–649 [DOI] [PMC free article] [PubMed] [Google Scholar]
- 9.Haiman CA, Patterson N, Freedman ML, Myers SR, Pike MC, Waliszewska A, Neubauer J, Tandon A, Schirmer C, McDonald GJ, et al (2007) Multiple regions within 8q24 independently affect risk for prostate cancer. Nat Genet (electronically published ahead of print April 1, 2007; accessed April 11, 2007) [DOI] [PMC free article] [PubMed] [Google Scholar]
- 10.Gonzalez Burchard E, Borrell LN, Choudhry S, Naqvi M, Tsai HJ, Rodriguez-Santana JR, Chapela R, Rogers SD, Mei R, Rodriguez-Cintron W, et al (2005) Latino populations: a unique opportunity for the study of race, genetics, and social environment in epidemiological research. Am J Public Health 95:2161–2168 10.2105/AJPH.2005.068668 [DOI] [PMC free article] [PubMed] [Google Scholar]
- 11.Sans M (2000) Admixture studies in Latin America: from the 20th to the 21st century. Hum Biol 72:155–177 [PubMed] [Google Scholar]
- 12.Salzano FM, Bortolini MC (2002) The evolution and genetics of Latin American populations. Cambridge University Press, Cambridge, United Kingdom [Google Scholar]
- 13.Weiss KM, Ferrell RE, Hanis CL (1984) A new world syndrome of metabolic diseases with a genetic and evolutionary basis. Am J Phys Anthropol Suppl S5 27:153–178 10.1002/ajpa.1330270508 [DOI] [Google Scholar]
- 14.Williams RC, Long JC, Hanson RL, Sievers ML, Knowler WC (2000) Individual estimates of European genetic admixture associated with lower body-mass index, plasma glucose, and prevalence of type 2 diabetes in Pima Indians. Am J Hum Genet 66:527–538 [DOI] [PMC free article] [PubMed] [Google Scholar]
- 15.Martinez-Marignac VL, Valladares A, Cameron E, Chan A, Perera A, Globus-Goldberg R, Wacher N, Kumate J, McKeigue P, O’Donnell D, et al (2007) Admixture in Mexico City: implications for admixture mapping of type 2 diabetes genetic risk factors. Hum Genet 120:807–819 10.1007/s00439-006-0273-3 [DOI] [PubMed] [Google Scholar]
- 16.Silman AJ, Pearson JE (2002) Epidemiology and genetics of rheumatoid arthritis. Arthritis Res Suppl 3 4:S265–S272 10.1186/ar578 [DOI] [PMC free article] [PubMed] [Google Scholar]
- 17.Salari K, Choudhry S, Tang H, Naqvi M, Lind D, Avila PC, Coyle NE, Ung N, Nazario S, Casal J, et al (2005) Genetic admixture and asthma-related phenotypes in Mexican American and Puerto Rican asthmatics. Genet Epidemiol 29:76–86 10.1002/gepi.20079 [DOI] [PubMed] [Google Scholar]
- 18.Crawford ED (2003) Epidemiology of prostate cancer. Urology Suppl 6A 62:3–12 10.1016/j.urology.2003.10.013 [DOI] [PubMed] [Google Scholar]
- 19.Smith MW, Lautenberger JA, Shin HD, Chretien J-P, Shrestha S, Gilbert DA, O’Brien SJ (2001) Markers for mapping by admixture linkage disequilibrium in African American and Hispanic populations. Am J Hum Genet 69:1080–1094 [DOI] [PMC free article] [PubMed] [Google Scholar]
- 20.The International HapMap Consortium (2003) The International HapMap Project. Nature 426:789–796 10.1038/nature02168 [DOI] [PubMed] [Google Scholar]
- 21.Choudhry S, Coyle NE, Tang H, Salari K, Lind D, Clark SL, Tsai HJ, Naqvi M, Phong A, Ung N, et al (2006) Genetics of asthma in Latino Americans GALA Study: population stratification confounds genetic association studies among Latinos. Hum Genet 118:652–664 10.1007/s00439-005-0071-3 [DOI] [PubMed] [Google Scholar]
- 22.Bedoya G, Montoya P, Garcia J, Soto I, Bourgeois S, Carvajal L, Labuda D, Alvarez V, Ospina J, Hedrick PW, et al (2006) Admixture dynamics in Hispanics: a shift in the nuclear genetic ancestry of a South American population isolate. Proc Natl Acad Sci USA 103:7234–7239 10.1073/pnas.0508716103 [DOI] [PMC free article] [PubMed] [Google Scholar]
- 23.Cavalli-Sforza LL, Menozzi P, Piazza A (1994) The history and geography of human genes. Princeton University Press, Princeton, NJ [Google Scholar]
- 24.Collins-Schramm HE, Chima B, Operario DJ, Criswell LA, Seldin MF (2003) Markers informative for ancestry demonstrate consistent megabase-length linkage disequilibrium in the African American population. Hum Genet 113:211–219 10.1007/s00439-003-0961-1 [DOI] [PubMed] [Google Scholar]
- 25.Conrad DF, Jakobsson M, Coop G, Wen X, Wall JD, Rosenberg NA, Pritchard JK (2006) A worldwide survey of haplotype variation and linkage disequilibrium in the human genome. Nat Genet 38:1251–1260 10.1038/ng1911 [DOI] [PubMed] [Google Scholar]
- 26.Hinds DA, Stokowski RP, Patil N, Konvicka K, Kershenobich D, Cox DR, Ballinger DG (2004) Matching strategies for genetic association studies in structured populations. Am J Hum Genet 74:317–325 [DOI] [PMC free article] [PubMed] [Google Scholar]
- 27.Haiman CA, Stram DO, Pike MC, Kolonel LN, Burtt NP, Altshuler D, Hirschhorn J, Henderson BE (2003) A comprehensive haplotype analysis of CYP19 and breast cancer risk: the Multiethnic Cohort. Hum Mol Genet 12:2679–2692 10.1093/hmg/ddg294 [DOI] [PubMed] [Google Scholar]
- 28.The International HapMap Consortium (2005) A haplotype map of the human genome. Nature 437:1299–1320 10.1038/nature04226 [DOI] [PMC free article] [PubMed] [Google Scholar]
- 29.Hinds DA, Stuve LL, Nilsen GB, Halperin E, Eskin E, Ballinger DG, Frazer KA, Cox DR (2005) Whole-genome patterns of common DNA variation in three human populations. Science 307:1072–1079 10.1126/science.1105436 [DOI] [PubMed] [Google Scholar]
- 30.Parra EJ, Marcini A, Akey J, Martinson J, Batzer MA, Cooper R, Forrester T, Allison DB, Deka R, Ferrell RE, et al (1998) Estimating African American admixture proportions by use of population-specific alleles. Am J Hum Genet 63:1839–1851 [DOI] [PMC free article] [PubMed] [Google Scholar]
- 31.Collins-Schramm HE, Chima B, Morii T, Wah K, Figueroa Y, Criswell LA, Hanson RL, Knowler WC, Silva G, Belmont JW, et al (2004) Mexican American ancestry-informative markers: examination of population structure and marker characteristics in European Americans, Mexican Americans, Amerindians and Asians. Hum Genet 114:263–271 10.1007/s00439-003-1058-6 [DOI] [PubMed] [Google Scholar]
- 32.Sawyer SL, Mukherjee N, Pakstis AJ, Feuk L, Kidd JR, Brookes AJ, Kidd KK (2005) Linkage disequilibrium patterns vary substantially among populations. Eur J Hum Genet 13:677–686 10.1038/sj.ejhg.5201368 [DOI] [PubMed] [Google Scholar]
- 33.Myers S, Bottolo L, Freeman C, McVean G, Donnelly P (2005) A fine-scale map of recombination rates and hotspots across the human genome. Science 310:321–324 10.1126/science.1117196 [DOI] [PubMed] [Google Scholar]
- 34.Fan JB, Oliphant A, Shen R, Kermani BG, Garcia F, Gunderson KL, Hansen M, Steemers F, Butler SL, Deloukas P, et al (2003) Highly parallel SNP genotyping. Cold Spring Harb Symp Quant Biol 68:69–78 10.1101/sqb.2003.68.69 [DOI] [PubMed] [Google Scholar]
- 35.Tang K, Fu D, Julien D, Braun A, Cantor CR, Koster H (1999) Chip-based genotyping by mass spectrometry. Proc Natl Acad Sci USA 96:10016–10020 10.1073/pnas.96.18.10016 [DOI] [PMC free article] [PubMed] [Google Scholar]
- 36.Chen M, Shao Q, Ibrahim JG (2000) Monte Carlo methods in Bayesian computation. Springer, New York [Google Scholar]
- 37.Patterson N, Price AL, Reich D (2006) Population structure and eigenanalysis. PLoS Genet 2:e190 10.1371/journal.pgen.0020190 [DOI] [PMC free article] [PubMed] [Google Scholar]
- 38.Pritchard JK, Stephens M, Donnelly P (2000) Inference of population structure using multilocus genotype data. Genetics 155:945–999 [DOI] [PMC free article] [PubMed] [Google Scholar]
- 39.Bortolini MC, Salzano FM, Bau CH, Layrisse Z, Petzl-Erler ML, Tsuneto LT, Hill K, Hurtado AM, Castro-De-Guerra D, Bedoya G, et al (2002) Y-chromosome biallelic polymorphisms and Native American population structure. Ann Hum Genet 66:255–259 10.1046/j.1469-1809.2002.00114.x [DOI] [PubMed] [Google Scholar]