Abstract
Admixture mapping (AM) is a promising method for the identification of genetic risk factors for complex traits and diseases showing prevalence differences among populations. Efficient application of this method requires the use of a genomewide panel of ancestry-informative markers (AIMs) to infer the population of origin of chromosomal regions in admixed individuals. Genomewide AM panels with markers showing high frequency differences between West African and European populations are already available for disease-gene discovery in African Americans. However, no such a map is yet available for Hispanic/Latino populations, which are the result of two-way admixture between Native American and European populations or of three-way admixture of Native American, European, and West African populations. Here, we report a genomewide AM panel with 2,120 AIMs showing high frequency differences between Native American and European populations. The average intermarker genetic distance is ∼1.7 cM. The panel was identified by genotyping, with the Affymetrix GeneChip Human Mapping 500K array, a population sample with European ancestry, a Mesoamerican sample comprising Maya and Nahua from Mexico, and a South American sample comprising Aymara/Quechua from Bolivia and Quechua from Peru. The main criteria for marker selection were both high information content for Native American/European ancestry (measured as the standardized variance of the allele frequencies, also known as “f value”) and small frequency differences between the Mesoamerican and South American samples. This genomewide AM panel will make it possible to apply AM approaches in many admixed populations throughout the Americas.
Admixture mapping (AM) is a promising approach for mapping complex diseases.1–9 In populations descended from the admixture of two or more previously isolated populations, chromosomes are composed of segments derived from each of the parental populations, with proportions related to the relative parental contributions. The lengths of these blocks are dependent on the number of generations since admixture. The more time that has elapsed since the admixture event, the shorter the blocks of shared ancestry, because of the action of recombination. In admixed individuals with a disease, chromosomal segments harboring susceptibility variants will show an excess of ancestry from the parental population in which the risk alleles are more frequent. AM works by identifying chromosomal regions that show an excess of ancestry from the high-risk parental population in individuals with the disease. This is accomplished by testing for association between the disease and locus ancestry, with use of either an affected-only design that compares observed and expected ancestry proportions or a case-control comparison. The past 5 years have witnessed impressive developments in statistical and computational methods in this area. Currently, there are three Bayesian programs for AM: ADMIXMAP,3,8 ANCESTRYMAP,4 and STRUCTURE/MALDSoft.5 In addition to these, classic likelihood-based approaches have also been developed.6,10 AM offers important advantages over alternative mapping methods. AM (1) does not require recruitment of families with multiple affected members, in contrast with traditional linkage studies; (2) has higher power to detect variants of modest effect than do linkage studies; (3) requires far fewer genetic markers (1,500–3,000) than do haplotype or direct association studies (>300,000); (4) is not as affected by allelic heterogeneity as are linkage disequilibrium (LD)–based approaches, and (5) can be implemented in case-only study designs.3,4 Efficient application of AM requires the use of a genomewide panel of ancestry-informative markers (AIMs) to infer the ancestry of the chromosomal regions of admixed individuals. Such panels are already available for disease-gene discovery in African Americans. In 2004, Smith et al.11 described a high-density admixture map comprising 3,011 markers showing high frequency differences between European and West African populations, with an average intermarker distance of 1.2 cM. More recently, Tian et al.12 described an even more informative panel, with 4,222 AIMs. Advances in computational methods and the availability of these genomewide panels have made it possible to apply AM in African American populations. To date, there have been three genomewide AM scans of African Americans that have identified significant linkage signals for different diseases. Zhu et al.13 used a panel of microsatellites designed for linkage analysis in families to perform an AM genomewide scan in a sample comprising African American hypertensive subjects and normotensive control individuals, and they identified two regions on chromosomes 6 and 21 that may harbor genes influencing hypertension risk. Reich et al.14 identified, using a dense panel with >1,100 AIMs, a region on chromosome 1 that is significantly associated with multiple sclerosis. More recently, Freedman et al.15 identified, using a high-density admixture map, a linkage signal for prostate cancer at 8q24.
The application of AM is currently possible for populations resulting from the recent admixture process between West African and European populations. However, the same cannot be said about other admixed populations in the Americas, which primarily result from two-way admixture between Native American and European populations or three-way admixture among Native American, European, and West African populations. This group of populations includes the largest population minority in the United States, commonly known as “Hispanic” or “Latino,” as well as many other admixed populations from Central and South America and the Caribbean. Brutsaert et al.,16 Collins-Schramm et al.,17 Bonilla et al.,18 Choudhry et al.,19 and Martinez-Marignac et al.,20 among others, have described limited collections of AIMs for Hispanic populations, but genomewide panels of markers informative for Native American/European ancestry and Native American/West African ancestry are not currently available. Recent large-scale projects to characterize SNP variation in human populations, such as the International HapMap Project, have not included Native American populations, so it has not been possible to select informative AIMs for AM applications from the millions of SNPs available in those databases.
We report here a high-density admixture map for Hispanic/Latino populations. Our genomewide panel comprises 2,120 AIMs that are informative for Native American/European ancestry, with an average intermarker genetic distance of 1.74 cM. To build this admixture map, we used the Affymetrix GeneChip Human Mapping 500K array to genotype >500,000 markers in four population samples from the Americas (Native Americans): a sample of Maya from the Yucatan Peninsula, Mexico (N=25); a sample of Nahua from the state of Guerrero, Mexico (N=30); a sample of primarily Aymara individuals, also including some Quechua individuals from La Paz (N=25); and a sample of Quechua from Cerro de Pasco, Peru (N=25). For data analysis, we grouped the Nahua and Maya individuals into a “Mesoamerican” sample, and we also combined the Quechua and Aymara individuals into a “South American” sample. All the Native American samples were characterized for admixture proportions in previously published16,18 or the authors' unpublished anthropological studies, by use of a panel of AIMs. The individuals who were analyzed in the present study were selected to represent a subgroup of individuals with low non–Native American ancestry. Data about genotype frequencies for the 500K array were also available for a sample of U.S. residents of European ancestry, which will be abbreviated “Europeans” throughout the text (N=60), a West African sample (Yoruba from Ibadan, Nigeria [N=60]), and an East Asian sample (Chinese [N=45] and Japanese [N=45]), all from the International HapMap Project. The 500K array is the latest SNP-genotyping platform developed by Affymetrix. It comprises two arrays (the Nsp and Sty arrays) capable of genotyping ∼262,000 and ∼238,000 SNPs, respectively, and it uses the same whole-genome sampling assay first introduced in the 10K array. Detailed information about the 500K array is available at the Affymetrix Web site. Population samples were all collected with the approval of local ethics committees and with receipt of informed consent for human genetic–variation research. This study was also approved by the Ethics Review Office at the University of Toronto and by the Institutional Review Board at The Pennsylvania State University.
The selection of markers was performed in three stages, which are summarized in figure 1. In the first stage, a preliminary genomewide panel of markers informative for Native American/European ancestry was selected on the basis of the following criteria:
-
1.
Genotype quality. Markers with <40 genotype calls in the European, Mesoamerican, or South American samples were excluded from the analysis, to minimize the effect of small sample size on the estimation of allele frequencies. Additionally, markers showing strong deviations from Hardy-Weinberg proportions (P<.005, by a G test) in any of the five groups (Nahua, Maya, Quechua, Aymara, and European American) were excluded from the analysis.
-
2. Ancestry-information content. Marker-information content for ancestry was measured using the standardized variance of allele frequencies, or f value.1 For a diallelic marker,

where ux and uy are the allele frequencies in population x and population y and
 |
is the average allele frequency.
Figure 1. .
Outline of the screening procedure for identification of AIMs
To select markers in this first stage, the following cutoffs for the f values were used.
-
1.
f⩾0.3 between the European and Mesoamerican samples and between the European and South American samples. The main goal was to ensure that the genomewide panel will be applicable to admixed populations throughout the Americas.
-
2.
f⩽0.1 between the Nahua and Maya, between Aymara and Quechua, and between Mesoamerican (Nahua and Maya) and South American (Aymara and Quechua) samples. The purpose of this limit was to ensure that the AIMs show low heterogeneity between Native American parental populations.
In the first stage of the project, 6,703 markers were selected on the basis of the criteria defined above. In the second stage of the selection process, the presence of LD between all possible pairs of AIMs located <1 Mb apart was evaluated in each of the three groups (Mesoamericans, South Americans, and European Americans) with use of a Fisher exact test based on phased haplotypes estimated using the program PHASE.21 In this second stage, the preliminary list of AIMs was further screened by implementing an algorithm to select markers on the basis of intermarker distance, linkage equilibrium, and ancestry-information content. Because of the complexity of the problem caused by the above constraints, a divide-and-conquer algorithm was implemented. In this stage, chromosomes were divided into consecutive bins such that the distance between the last marker in any given bin and the first marker in the next bin was at least 1 Mb. In each of these bins, the largest possible number of AIMs covering the genomic region was selected, with the constraint that markers be at least 300 kb apart and not show strong LD (P>.005, by Fisher's exact test). When several combinations of AIMs were possible in any given bin because two or more AIMs were within 300 kb, the combination of AIMs with the highest average f value (estimated as the average f values between the Mesoamerican and European American and between the South American and European American samples) was selected, to maximize information content for ancestry.
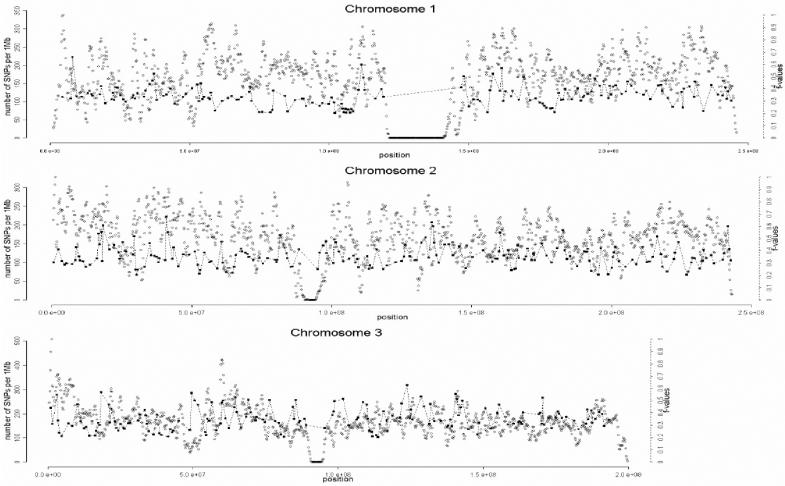
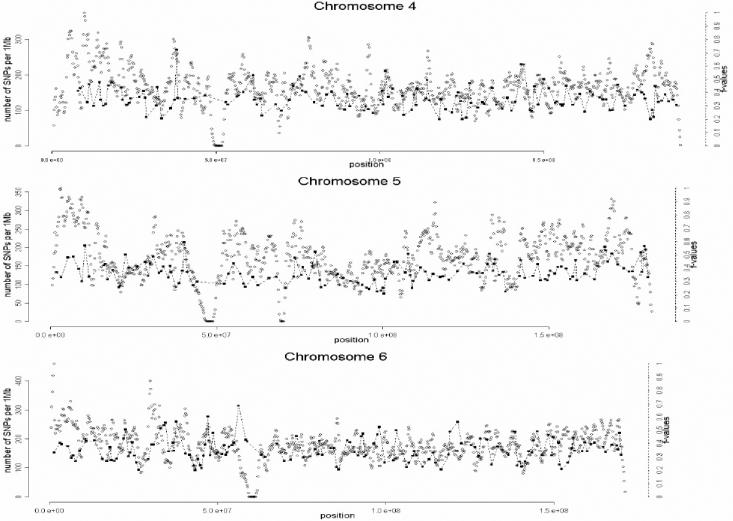
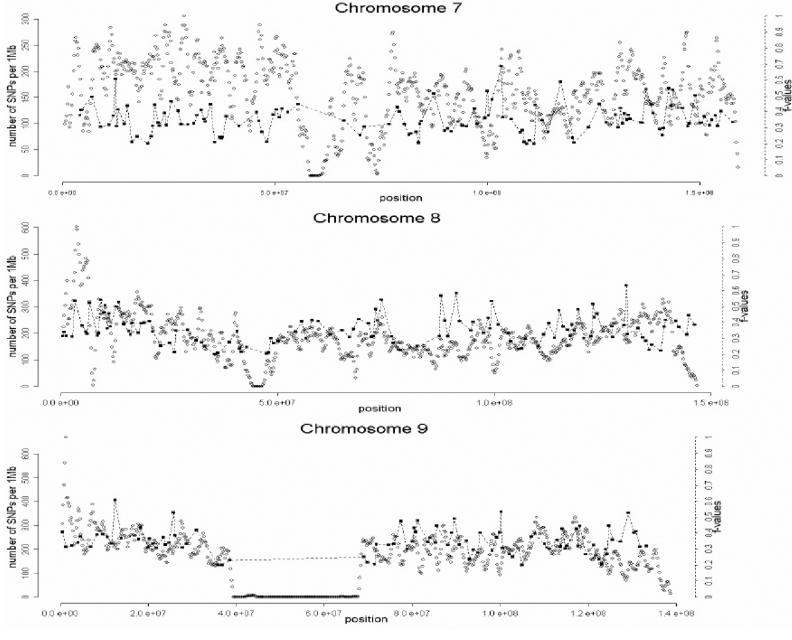
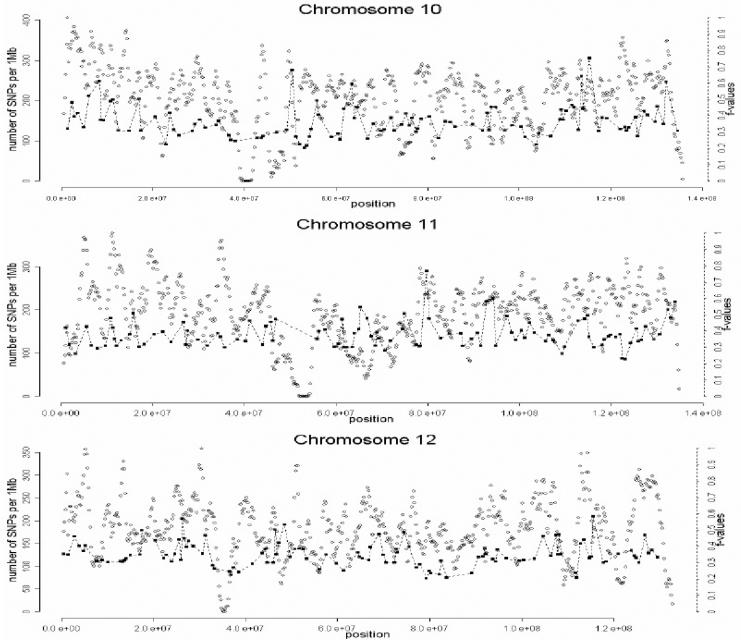
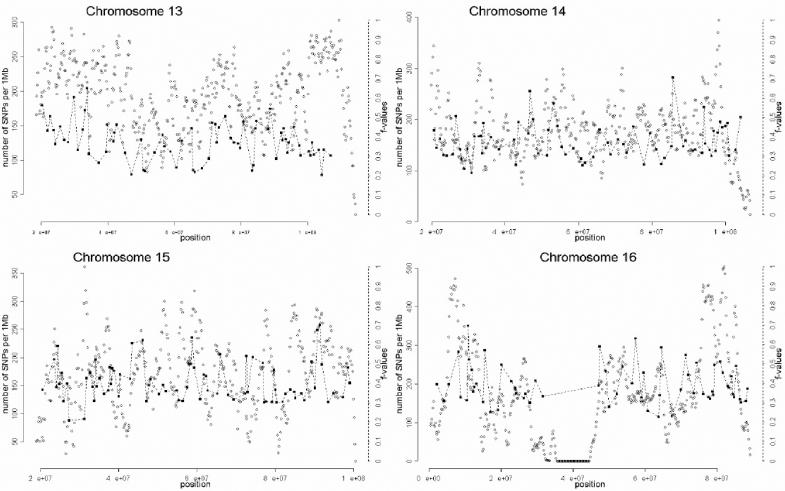
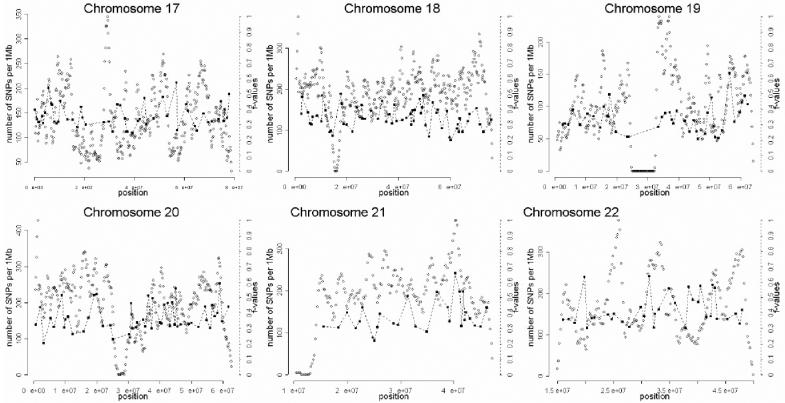
A total of 1,642 AIMs were selected in this second stage. In the third and final stage of the selection process, the genome coverage of our genomewide panel was maximized by relaxing the f cutoff for European/Mesoamerican and European/South American samples from 0.3 to 0.2, while keeping the constraints regarding genotype quality, intermarker distance, and LD. The final number of AIMs included in the genomewide AM panel was 2,120 markers. Table 1 provides details on the main characteristics of the genomewide panel. The average (SD) intermarker physical distance (excluding known gaps for which sequence information is not available) is 1.22 Mb (832 kb). The genetic map position of each AIM was estimated using the Rutgers Combined Linkage-Physical Map,22 which implements a smoothing calculation to estimate genetic map positions, including those markers that have not been mapped directly. See the SNP Genetic Mapping Web site for an online resource for calculating smoothed estimates of map positions. The average (SD) intermarker genetic distance is 1.74 cM (1.8 cM). The average (SD) European/Mesoamerican f value is 0.361 (0.088), and the average European/South American f value is 0.374 (0.094). In contrast, the average Mesoamerican/South American f value is 0.007 (0.01). When ancestry-information content is expressed in terms of allele-frequency differences (Δ), the average for European/Mesoamerican ancestry is Δ=0.57, the average for European/South American ancestry is Δ=0.58, and the average for Mesoamerican/South American ancestry is Δ=0.047. When ancestry information is expressed in terms of Weir and Cockerham’s FST,23 the average European/Mesoamerican FST is 0.52, the average European/South American FST is 0.53, and the average Mesoamerican/South American FST is 0.0086. Detailed information for each marker in the final AM panel—including rs number, physical distance, genetic distance, European allele frequency, Mesoamerican allele frequency, South American allele frequency, West African allele frequency, European/Mesoamerican f value, European/South American f value, and Mesoamerican/South American f value—is available as a txt file. The complete information for the 500K array data set can be obtained from the authors. Figure 2 shows scatterplots for each chromosome, indicating, in the X-axis, the genome coverage of the panel of AIMs, and, in the two Y-axes, the density of SNPs in the 500K array and the ancestry-information content for each AIM measured as the f value. Note that, although the genome coverage of the panel is quite good, there are some chromosomal regions showing significant gaps. These regions can be easily identified in the scatterplots as regions showing large distances between consecutive AIMs and high marker densities in the 500K array. Therefore, in these regions, we could not identify European/Native American AIMs, even though they show good coverage by the markers of the 500K array. There are 46 gaps in the map for which intermarker distances are >3 Mb (excluding gaps due to poor genome coverage of the 500K chip). Further efforts will be necessary to identify AIMs in these chromosomal regions.
Table 1. .
Characteristics of the Hispanic/Latino AM Map[Note]
| Value on Map | |
| No. of loci | 2,120 |
| Average (SD) intermarker distance: | |
| Physical | 1.22 Mb (832 kb) |
| Genetic | 1.743 cM (1.795 cM) |
| Average f value (SD) between: | |
| South American and European American | .374 (.094) |
| Mesoamerican and European American | .361 (.088) |
| Mesoamerican and South American | .007 (.011) |
| Average Δa (SD) between: | |
| South American and European American | .580 (.088) |
| Mesoamerican and European American | .569 (.084) |
| Mesoamerican and South American | .047 (.045) |
Figure 2. .
Scatterplots showing, for each chromosome, the physical location of the AIMs selected for the genomewide AM panel (X-axis) and the f values indicating the ancestry-information content for each marker (blackened squares). Scale is indicated on the right Y-axis. We also indicate the SNP density of the Affymetrix 500K mapping array (unblackened circles). Scale is indicated on the left Y-axis. The plotted f values are the averages of the f values between Europeans and Mesoamericans and the f values between Europeans and South Americans. The SNP density is measured using a sliding-window method with a 1-Mb window size and 200-kb offset.
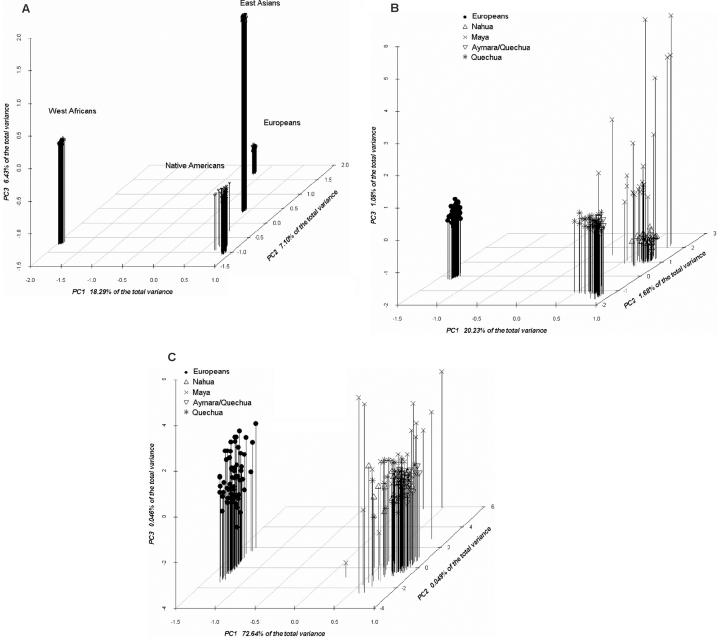
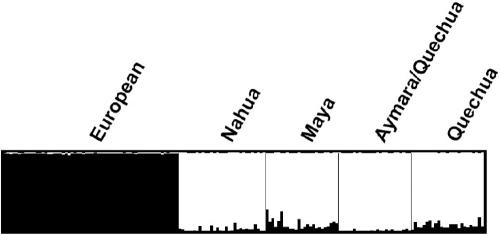
Figure 3 shows principal coordinates (PCO) representations of the samples included in this study that are based on genetic distances between individuals estimated using the allele-sharing distance.24 Figure 3A depicts the 3D plot for the seven population samples included in this study (Europeans, Nahua from Mexico, Maya from Mexico, Quechua from Peru, Aymara/Quechua from Bolivia, West Africans, and East Asians), which is based on the full set of autosomal SNPs from the Affymetrix 500K array. The variance explained by the first three axes is 31.8%. The autosomal markers of the 500K array (∼490,000) provide clear discrimination of the four major continental groups included in the analysis: West Africans, Europeans, East Asians, and Native Americans. In accordance with anthropological, genetic, and archaeological evidence indicating an East Asian origin of Native Americans, the East Asian sample is the closest to the four Native American samples. All the Native American individuals cluster together in the PCO plot. Figure 3B shows the 3D plot of the European and Native American samples with use of all the autosomal markers of the 500K array. The variance explained by the first three axes is 23.0%. The first axis separates the European and Native American groups, and the second axis discriminates the Mesoamerican (Nahua and Maya) and South American groups. Note that all the Europeans, the Nahua from Mexico, the Aymara/Quechua from Bolivia, and, to a lesser extent, the Quechua from Peru cluster quite tightly in the plot. This is in sharp contrast to the Maya, who show a considerable dispersion in the plot. Some of the Mayan individuals seem to show European admixture, judging by their position toward the European cluster (the same can be said about some Quechua individuals). However, European admixture does not appear to be a sufficient explanation of the pattern of dispersion of the Mayans in the PCO plot, which is apparent not only in the first axis but also in the second and third axes. The Mayan sample shows substantially more heterogeneity than do any of the other samples characterized in this study. Figure 3C shows a PCO representation of the European and Native American samples with use of the 2,120 AIMs selected for the Hispanic/Latino AM map. The variance explained by the first three axes is 73.6%. As expected from the high ancestry-information content of the panel, the first axis, which explains most of the variance, discriminates the European and Native American individuals. However, the panel does not discriminate between the Mesoamerican and South American groups. This is the result of the criteria used for the selection of markers in this study; we included markers in the final panel only if they showed high information content for European/Native American ancestry but low variance between the Mesoamerican and South American samples. The reasons for this are explained in more detail below. Given the patterns observed in the PCO plots, the presence of European ancestry in the Native American samples was further evaluated with the program STRUCTURE,25 through use of the genotype data for the 2,120 markers of the AM panel (fig. 4). In agreement with the distribution of individuals in the PCO plots, the results obtained with STRUCTURE indicate that the Nahua from Mexico and the Aymara/Quechua from Bolivia have very low European contributions (2.3% and 1.4%, respectively), whereas the Quechua from Peru and the Mayans from Mexico show higher European contributions (8.5% and 9.2%, respectively).
Figure 3. .
A, 3D PCO plot of the seven population samples included in this analysis (Europeans, Nahua from Mexico, Maya from Mexico, Quechua from Peru, Aymara/Quechua from Bolivia, West Africans, and East Asians), based on the allele-sharing distances between individuals estimated using 490,032 autosomal SNPs genotyped with the Affymetrix 500K Mapping Array. B, 3D PCO plot of the European and Native American populations, based on the allele-sharing distances between individuals estimated using 490,032 autosomal SNPs genotyped with the Affymetrix 500K Mapping Array. C, 3D PCO plot of the European and Native American populations, based on the allele-sharing distances between individuals estimated using the 2,120 AIMs selected for the Hispanic/Latino map. The proportion of variance explained by the first axis is indicated in each plot.
Figure 4. .
Plot showing results of the analysis of the European and Native American samples with use of the program STRUCTURE, based on the genotype data for the 2,120 AIMs selected for the genomewide AM panel. The program was run using the linkage model, with 10,000 iterations for the burn-in phase and 50,000 iterations to collect parameter data. The model with two parental populations is the model that best fits the data.
We provide additional justification about the criteria used for marker selection, because alternative strategies were possible. Our goal was to develop a genomewide AM panel that could be applicable to admixed populations throughout the Americas. Therefore, in addition to selecting markers showing large frequency differences between the European and the two Native American samples (Mesoamericans and South Americans), we imposed as an additional criterion the presence of low heterogeneity between the two Native American groups (f values <0.1), in the hope that the panel would be informative irrespective of which Native American population was the actual parental population for the particular admixed population under consideration. This implied the rejection of a number of markers that are informative for European/Mesoamerican comparisons but not for European/South American comparisons, and vice versa. Although this selection strategy implies a reduction in the number of markers, it increases the portability of the AM panel and also has advantages, in terms of a reduced effect of sampling bias, because the markers selected are based on comparisons of the European sample with two independent Native American samples. It is important to mention that we detected the presence of some non–Native American contribution to the Native American samples included in this study. In particular, there is evidence of some European contribution to the Quechua and Maya samples. This European ancestry component is relatively small (<10%) and its effect in marker selection is minor. The expected effect of this small European contribution to the Native American samples is to underestimate the f values and Δ values reported here. Additionally, we tried to minimize sampling bias by excluding markers for which the number of genotype calls was <40 (80 alleles) in any of the three population samples being compared. Therefore, the SE of the frequency estimates should be ⩽0.055, depending on the allele frequencies.
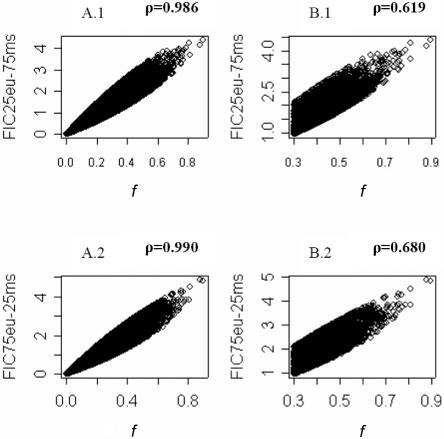
To select AIMs for our genomewide AM panel, we used the statistic f, which is equivalent to Fisher’s information when the admixture fraction is 0.5. Therefore, this panel of markers is optimal for admixed populations showing equal Native American and European admixture proportions. Some admixed populations in the Americas, such as Mexican Americans,17,19,26–28 fit this model quite well, and this panel will be particularly informative for these populations. However, this panel may not be optimal when admixture fractions are very different from 0.5. We evaluated the correlation of ancestry-information content of the markers of the 500K microarray using the f statistic and the Fisher information content (FIC), an alternative measure of ancestry information that can be calculated for different admixture scenarios.29 Figure 5 shows the relationship of f values (with the assumption of 50% Native American and 50% European contributions) and FIC values with the assumption of two alternative admixture scenarios: 75% Native American and 25% European ancestry and 25% Native American and 75% European ancestry. Figure 5 shows Spearmann’s rank correlation coefficients (ρ) for the whole set of markers of the 500K chip and the subset of markers with f values >0.3. Although the correlations are strong (ρ>0.98 for the full set of markers and ρ>0.61 for the set of markers with f values >0.3), implementation of our algorithm for marker selection with use of FIC values instead of the f statistic results in limited overlap between the AIMs selected in each panel. Genomewide panels with AIMs selected on the basis of FIC (75%:25% Native American:European and 25%:75% Native American:European) are available on request. It should be noted that many populations in the Americas, including those in the Caribbean region (e.g., Cuba and Puerto Rico),19,30–32 depart significantly from a two-way admixture model and have substantial West African components in addition to Native American and European components. The availability of the 500K data that include information about allele frequencies in a West African sample, a European sample, and four Native American samples will make it possible to design a genomewide AM panel for populations resulting from three-way admixture from European, West African, and Native American populations, dramatically expanding the number of admixed populations that can be studied using AM.
Figure 5. .
Plot showing the relationship of f values and FIC values for the full panel of markers of the 500K array (A.1 and A.2) and the subset of markers with f values >0.3 (B.1 and B.2). Panels A.1 and B.1 show f values and FIC values with the assumption of a model with 75%:25% Mesoamerican:European ancestry, and panels A.2 and B.2 represent f values and FIC values with the assumption of a model with 25%:75% Mesoamerican:European ancestry. Spearman’s rank correlation coefficients (ρ) are indicated in bold above each panel. eu=European; ms=Mesoamerican.
In terms of the practical application of AM with use of this panel, although we have identified markers showing large frequency differences between European and Native American populations and reduced heterogeneity between Mesoamerican and South American groups, in any AM study, it is always advisable to characterize samples of unadmixed individuals that best represent the parental populations involved in the admixture process for the admixed population under study. There are two possible strategies to implement AM studies: affected-only and case-control designs. In the affected-only design, local mean ancestries are compared with the genomewide mean ancestry, and significant deviations indicate the presence of disease genes. In the case-control design, local mean ancestries are compared in the case and the control group, and the statistical tests of significance take into account potential differences in genomewide mean ancestry between the cases and controls. Although the affected-only design is, in principle, more powerful than the case-control design,3–5 it is more prone to false-positive results due to misspecification of ancestral allele frequencies. To minimize these potential problems, characterization of a sample of unadmixed individuals representative of the parental populations, if available, and inclusion of a sample of a few hundred controls are recommended. As described above, the effective number of generations back to unadmixed ancestors is also relevant for AM, because that number determines the density of the markers required to extract information about ancestry and the resolution of the AM study. Both historical and genetic data20 indicate that, in populations of Mexican ancestry, the number of generations since admixture (with the assumption of a single pulse of admixture) is slightly higher than that for African American populations and therefore will require maps with relatively higher density for the initial AM scans. Our estimates indicate that ∼2,000 AIMs will suffice for performing an AM scan in Mexican and Mexican American populations, with a >100-fold reduction in genotyping effort with respect to whole-genome association methods.
In summary, we describe a genomewide panel of AIMs for AM applications in populations resulting from the recent admixture process between European and Native American populations. The panel comprises >2,100 AIMs with intermarker genetic distances of ∼1.74 cM. Although this panel was selected primarily for populations following a biparental admixture model, the availability of allele-frequency data for half a million markers in West African, European, and Native American samples from Mesoamerica and South America (available on request) will pave the way for the application of AM in admixed populations throughout the Americas.
Supplementary Material
Acknowledgments
We thank all the research subjects for their cooperation. This work was supported in part by grants from the Canadian Institutes of Health Research (to E.J.P.), Canada Foundation for Innovation (to E.J.P.), Ontario Innovation Trust (to E.J.P.), The Banting and Best Diabetes Institute of the University of Toronto (to E.J.P.), the Wenner-Gren Foundation (to K.M.W.), and National Institutes of Health grants HG02154 (to M.D.S.), TN01188 (to L.G.M.), HL60131 (to L.G.M.), and HL07171 (to L.G.M.).
Web Resources
The URLs for data presented herein are as follows:
- Affymetrix, http://www.affymetrix.com/
- International HapMap Project, http://www.hapmap.org/
- SNP Genetic Mapping, http://actin.ucd.ie/cgi-bin/rs2cm.cgi (for the online resource to determine genetic map positions for SNPs)
References
- 1.McKeigue PM (1998) Mapping genes that underlie ethnic differences in disease risk: methods for detecting linkage in admixed populations, by conditioning on parental admixture. Am J Hum Genet 63:241–251 [DOI] [PMC free article] [PubMed] [Google Scholar]
- 2.Halder I, Shriver MD (2003) Measuring and using admixture to study the genetics of complex diseases. Hum Genomics 1:52–62 [DOI] [PMC free article] [PubMed] [Google Scholar]
- 3.Hoggart CJ, Shriver MD, Kittles RA, Clayton DG, McKeigue PM (2004) Design and analysis of admixture mapping studies. Am J Hum Genet 74:965–978 [DOI] [PMC free article] [PubMed] [Google Scholar]
- 4.Patterson N, Hattangadi N, Lane B, Lohmueller KE, Hafler DA, Oksenberg JR, Hauser SL, Smith MW, O’Brien SJ, Altshuler D, et al (2004) Methods of high-density admixture mapping of disease genes. Am J Hum Genet 74:979–1000 [DOI] [PMC free article] [PubMed] [Google Scholar]
- 5.Montana G, Pritchard JK (2004) Statistical tests for admixture mapping with case-control and case-only data. Am J Hum Genet 75:771–789 [DOI] [PMC free article] [PubMed] [Google Scholar]
- 6.Zhang C, Chen K, Seldin MF, Li H (2004) A hidden Markov modeling approach for admixture mapping based on case-control data. Genet Epidemiol 27:225–239 10.1002/gepi.20021 [DOI] [PubMed] [Google Scholar]
- 7.Zhu X, Cooper RS, Elston RC (2004) Linkage analysis of a complex disease through use of admixed populations. Am J Hum Genet 74:1136–1153 [DOI] [PMC free article] [PubMed] [Google Scholar]
- 8.McKeigue PM (2005) Prospects for admixture mapping of complex traits. Am J Hum Genet 76:1–7 [DOI] [PMC free article] [PubMed] [Google Scholar]
- 9.Nievergelt CM, Schork NJ (2005) Admixture mapping as a discovery approach for complex human traits and diseases. Curr Hypertens Rep 7:31–37 [DOI] [PubMed] [Google Scholar]
- 10.Zhu X, Zhang S, Tang H, Cooper R (2006) A classical likelihood based approach for admixture mapping using EM algorithm. Hum Genet 120:431–445 10.1007/s00439-006-0224-z [DOI] [PubMed] [Google Scholar]
- 11.Smith MW, Patterson N, Lauternberger JA, Truelove AL, McDonald GJ, Waliszewska A, Kessing BD, Malasky MJ, Scafe C, Le E, et al (2004) A high-density admixture map for disease gene discovery in African Americans. Am J Hum Genet 74:1001–1013 [DOI] [PMC free article] [PubMed] [Google Scholar]
- 12.Tian C, Hinds DA, Shigeta R, Kittles R, Ballinger DG, Seldin MF (2006) A genomewide single-nucleotide–polymorphism panel with high ancestry information for African American admixture mapping. Am J Hum Genet 79:640–649 [DOI] [PMC free article] [PubMed] [Google Scholar]
- 13.Zhu X, Luke A, Cooper RS, Quertermous T, Hanis C, Mosley T, Gu CC, Tang H, Rao DC, Risch N, et al (2005) Admixture mapping for hypertension loci with genome-scan markers. Nat Genet 37:177–181 10.1038/ng1510 [DOI] [PubMed] [Google Scholar]
- 14.Reich D, Patterson N, De Jager PL, McDonald GJ, Waliszewska A, Tandon A, Lincoln RR, DeLoa C, Fruhan SA, Cabre P, et al (2005) A whole-genome admixture scan finds a candidate locus for multiple sclerosis susceptibility. Nat Genet 37:1113–1118 10.1038/ng1646 [DOI] [PubMed] [Google Scholar]
- 15.Freedman ML, Haiman CA, Patterson N, McDonald GJ, Tandon A, Waliszewska A, Penney K, Steen RG, Ardlie K, John EM, et al (2006) Admixture mapping identifies 8q24 as a prostate cancer risk locus in African-American men. Proc Natl Acad Sci USA 103:14068–14073 10.1073/pnas.0605832103 [DOI] [PMC free article] [PubMed] [Google Scholar]
- 16.Brutsaert TD, Parra EJ, Shriver MD, Gamboa A, Palacios JA, Rivera M, Rodriguez I, Leon-Velarde F (2003) Spanish genetic admixture is associated with larger VO2max decrement from sea level to 4338 in Peruvian Quechua. J Appl Physiol 95:519–528 [DOI] [PubMed] [Google Scholar]
- 17.Collins-Schramm HE, Chima B, Morii T, Wah K, Figueroa Y, Criswell LA, Hanson RL, Knowler WC, Silva G, Belmont JW, et al (2004) Mexican American ancestry-informative markers: examination of population structure and marker characteristics in European Americans, Mexican Americans, Amerindians and Asians. Hum Genet 114:263–271 10.1007/s00439-003-1058-6 [DOI] [PubMed] [Google Scholar]
- 18.Bonilla C, Gutierrez G, Parra EJ, Kline C, Shriver MD (2005) Admixture analysis of a rural population of the state of Guerrero, Mexico. Am J Phys Anthropol 128:861–869 10.1002/ajpa.20227 [DOI] [PubMed] [Google Scholar]
- 19.Choudhry S, Coyle NE, Tang H, Salari K, Lind D, Clark SL, Tsai HJ, Naqvi M, Phong A, Ung N, et al (2006) Population stratification confounds genetic association studies among Latinos. Hum Genet 118:652–664 10.1007/s00439-005-0071-3 [DOI] [PubMed] [Google Scholar]
- 20.Martinez-Marignac VL, Valladares A, Cameron E, Chan A, Perera A, Globus-Goldberg R, Wacher N, Kumate J, McKeigue P, O’Donnell D, et al (2007) Admixture in Mexico City: implications for admixture mapping of type 2 diabetes genetic risk factors. Hum Genet 120:807–819 10.1007/s00439-006-0273-3 [DOI] [PubMed] [Google Scholar]
- 21.Stephens M, Smith NJ, Donnelly P (2001) A new statistical method for haplotype reconstruction from population data. Am J Hum Genet 68:978–989 [DOI] [PMC free article] [PubMed] [Google Scholar]
- 22.Kong X, Murphy K, Raj T, He C, White P, Matise T (2004) A combined linkage-physical map of the human genome. Am J Hum Genet 75:1143–1148 (erratum 76:373) [DOI] [PMC free article] [PubMed] [Google Scholar]
- 23.Weir BS, Cockerham CC (1984) Estimating F-statistics for the analysis of population structure. Evolution 38:1358–1370 10.2307/2408641 [DOI] [PubMed] [Google Scholar]
- 24.Chakraborty R, Jin L (1993) A unified approach to study hypervariable polymorphisms: statistical considerations of determining relatedness and population distances. In: Pena SDJ, Jeffreys AJ, Epplen J, Chakraborty R (eds) DNA fingerprinting: current state of the science. Vol 67. Birkhauser, Basel, Switzerland, pp 153–175 [DOI] [PubMed] [Google Scholar]
- 25.Pritchard JK, Stephens M, Donnelly PJ (2000) Inference of population structure using multilocus genotype data. Genetics 155: 945–959 [DOI] [PMC free article] [PubMed] [Google Scholar]
- 26.Bonilla C, Parra EJ, Pfaff CL, Dios S, Marshall JA, Hamman RF, Ferrell RE, Hoggart CL, McKeigue PM, Shriver MD (2004) Admixture in the Hispanics of the San Luis Valley, Colorado, and its implications for complex trait gene mapping. Ann Hum Genet 28:139–153 10.1046/j.1529-8817.2003.00084.x [DOI] [PubMed] [Google Scholar]
- 27.Tang H, Jorgenson E, Gadde M, Kardia SL, Rao DC, Zhu X, Schork NJ, Hanis CL, Risch N (2006) Racial admixture and its impact on BMI and blood pressure in African and Mexican Americans. Hum Genet 119:624–633 10.1007/s00439-006-0175-4 [DOI] [PubMed] [Google Scholar]
- 28.Tseng M, Williams RC, Maurer KR, Schanfield MS, Knowler WC, Everhart JE (1998) Genetic admixture and gallbladder disease in Mexican Americans. Am J Phys Anthropol 106:361–371 [DOI] [PubMed] [Google Scholar]
- 29.Pfaff CL, Barnholtz-Sloan J, Wagner JK, Long JC (2004) Information on ancestry from genetic markers. Genetic Epidemiol 26:305–315 10.1002/gepi.10319 [DOI] [PubMed] [Google Scholar]
- 30.Hanis CL, Hewett-Emmett D, Bertin TK, Schull WJ (1991) Origins of U.S. Hispanics: implications for diabetes. Diabetes Care 14:618–627 10.2337/diacare.14.7.618 [DOI] [PubMed] [Google Scholar]
- 31.Bonilla C, Shriver MD, Parra EJ, Jones A, Fernandez JR (2004) Ancestral proportions and their association with skin pigmentation and bone mineral density in Puerto Rican women from New York City. Hum Genet 115:57–68 10.1007/s00439-004-1125-7 [DOI] [PubMed] [Google Scholar]
- 32.Bertoni B, Budowle B, Sans M, Barton SA, Chakraborty R (2003) Admixture in Hispanics: distribution of ancestral population contributions in the continental United States. Hum Biol 75:1–11 10.1353/hub.2003.0016 [DOI] [PubMed] [Google Scholar]
Associated Data
This section collects any data citations, data availability statements, or supplementary materials included in this article.


