

Abstract
Laser capture microdissection (LCM) is now well established as a tool for facilitating the enrichment of cells of interest from tissue sections, overcoming the problem of tissue heterogeneity. LCM has been used extensively in combination with analysis at the DNA and RNA levels, but only a small number of studies have employed LCM with subsequent protein analysis, albeit with promising results. This study focuses on the potential of LCM in combination with two-dimensional polyacrylamide gel electrophoresis. The effects of tissue section preparation and sample type were evaluated to fully determine the suitability of using LCM in global protein profiling. The effects of several histochemical stains (hematoxylin and eosin, methyl green and toluidine blue) and immunolabeling on subsequent two-dimensional polyacrylamide gel electrophoresis were investigated. Quantitative analysis was performed to establish the extent of changes in the relative intensity of protein species and their reproducibility. All staining protocols tested were found to be compatible with protein analysis although there was variation in protein recovery and the quality of the protein profiles obtained. LCM of renal and cervix samples indicated that protein yield after dissection was acceptable, although the extent of enrichment and dissection time was tissue-dependent, which may preclude the use of this approach with some tissue types. These results indicate that LCM has potential as a tool in proteomic research.
Tissue heterogeneity and the consequent need for enrichment before sample analysis presents a major problem in the study of disease. Several strategies have been used to facilitate selective purification of relevant cell types. Antibody-based approaches have frequently been used, 1-3 but often require the use of short-term cell culture or enzymatic digestion to produce a single cell suspension as a starting material which may introduce in vitro artifacts. A number of manual and laser-assisted microdissection techniques have also been used 4-8 with laser capture microdissection (LCM) emerging as one of the methods of choice. The fast and precise dissection possible with LCM, combined with the ability to readily confirm the nature of the captured material are obvious advantages of this approach. As with other microscope-based dissection techniques however, LCM is dependent on previous fixation and staining of tissue sections and consequently there is a risk of artifacts. The effects of sample processing for LCM on nucleic acids have been thoroughly investigated 9-12 and a large number of studies have described analysis of DNA and RNA extracted from laser-captured material. 5 These include global analyses of gene expression at the mRNA level using cDNA microarrays 13-16 and construction of cDNA libraries. 17,18
Proteomics provides a complementary approach to the study of gene expression, allowing additional information regarding the effects of post–translational modifications and post–transcriptional controls to be explored. Technological advances, particularly in two-dimensional polyacrylamide gel electrophoresis (2D-PAGE) and mass spectrometry, have facilitated the study of gene expression at the protein level leading to the recent expansion of proteomics-based research. 19,20 This is well illustrated by examples from the field of tumor biology, with bladder cancer being one of the tumors most extensively studied. 21 The use of LCM in combination with protein analysis is now also increasing with study of specific proteins of interest by immunoassays 22-25 as well as global profiling by 2D-PAGE 26-29 and surface-enhanced laser desorption/ionization mass spectrometry, 30-32 being used to analyze captured material. However, the effects of tissue section preparation on the protein profile have not been thoroughly evaluated and the scope of LCM as a tool in proteomics research remains to be determined.
Here we describe in detail the effects of hematoxylin and eosin (H&E) staining of frozen sections on subsequent 2D-PAGE. In addition we examine the use of alternative histochemical stains and a rapid immunolabeling protocol as alternative methods for sample processing. We also compare the protein recovery and enrichment obtained after dissection of two contrasting tissue types to evaluate the potential and limitations of LCM as a tool in global protein expression profiling.
Materials and Methods
Materials
General chemicals were obtained from BDH (Poole, UK) or Sigma (Poole, UK) unless stated otherwise. Ammonium persulfate, Tris, and urea were from ICN (Basingstoke, UK), glycine from Genomic Solutions (Cambridge, UK), CHAPS from Calbiochem (Nottingham, UK), Pharmalyte pH 3–10 from Amersham Pharmacia (Little Chalfont, UK), Protogel acrylamide (30% acrylamide:0.8% bis-acrylamide) from Flowgen (Sittingbourne, UK), LMP agarose from Gibco Life Technologies (Paisley, UK), Complete protease inhibitor cocktail tablets and trypsin (modified, sequencing grade) from Roche (Lewes, UK), Pefabloc, hematoxylin and eosin (1% aqueous solution) from BDH, toluidine blue O and methyl green from Sigma, and trifluoroacetic acid from Pierce (Rockford, IL). Milli-Q grade water was used for all solutions.
Tissues
Samples of normal renal cortex, renal cell carcinoma (RCC), and normal cervix were obtained immediately after surgery and areas of tissue selected by a pathologist. Tissue was cut into blocks, washed briefly with ice-cold phosphate-buffered saline (pH 7.2) followed by ice-cold isotonic (0.25 mol/L) sucrose, embedded in OCT compound, snap-frozen in liquid nitrogen and stored at −80°C.
Section Fixation/Staining and LCM
Eight-μm frozen tissue sections were cut onto ethanol-dipped glass slides using a Leica Cryocut 1800 microtome and slides placed on dry ice until subsequent fixation and staining. For experiments in which several sample processing conditions were examined in parallel, sections were cut alternately for each condition to minimize changes resulting from alterations in the composition of the tissue block.
H&E staining was performed using a modified rapid protocol for LCM as previously described. 26 Slides were defrosted, fixed (70% ethanol for 1 minute), H&E stained (Mayer’s hematoxylin for 30 seconds, Scott’s tap water for 10 seconds, eosin for 10 seconds), and dehydrated (70% ethanol for 30 seconds, 100% ethanol for 1 minute, xylene for 2 × 5 minutes). H&E solutions contained Complete protease inhibitor cocktail. For processing experiments investigating the effect of different stages of the staining protocol on the protein profile, individual steps were omitted and replaced with mock incubations in water.
For alternative histochemical stains rapid-staining protocols based on those available at the Arcturus web site (www.arctur.com) were adopted. Slides were defrosted, fixed (70% ethanol for 1 minute), stained (1% w/v aqueous methyl green for 1 minute or 0.025% w/v toluidine blue O in 50 mmol/L sodium phosphate buffer, pH5.5, for 5 seconds), and then dehydrated (70% ethanol for 30 seconds, 100% ethanol for 1 minute, and xylene for 2 × 5 minutes). All stains contained Complete protease inhibitor cocktail.
Immunolabeling was performed using a rapid-staining method that used gold-conjugated secondary antibodies and silver enhancement as a detection system. This was chosen as it does not include an enzymatic step that could potentially induce protein modifications. In initial experiments, parameters such as time of incubation and reagent concentration were optimized to yield the final protocol. Slides were defrosted, fixed (acetone for 2 minutes or 70% v/v ethanol for 1 minute) and labeled (primary antibody for 5 minutes and gold-conjugated secondary antibody for 5 minutes). Labeling steps were performed in Tris-buffered saline (pH 7.6) containing Complete protease inhibitor cocktail and followed by brief washes with Tris-buffered saline. Gold particles were visualized by silver enhancement (British BioCell International, Cardiff, UK) according to the manufacturer’s instructions. Mouse anti-human CD13 (clone WM-47; DAKO, Cambridge, UK) was diluted 1 in 25 for acetone fixation or 1 in 5 for ethanol fixation and gold conjugated F(ab)2 anti-mouse IgGs for light microscopy (British BioCell International) was diluted 1 in 25.
Sections were dissected using a Pixcell II LCM system (Arcturus Engineering Inc., Mountain View, CA) with a 15-μm diameter laser beam being used for cervix and RCC samples and a 7.5-μm diameter laser beam for normal renal cortex.
Preparation of Protein Extracts
In experiments examining fixation and staining effects, tissue sections subjected to the different fixation, staining, or immunolabeling protocols were scraped into lysis buffer using a sterile disposable scalpel. Control samples were prepared from sections cut directly into lysis buffer. Laser-captured material was directly solubilized from successive caps into lysis buffer.
Tissue was solubilized in a urea/thiourea-based lysis buffer 33 (7 mol/L urea, 2 mol/L thiourea, 4% w/v CHAPS, 1% w/v dithiothreitol, 0.8% Pharmalyte pH 3–10, 1 mg/ml Pefabloc) for 30 minutes at room temperature. Samples were vigorously mixed then centrifuged (42,000 × g, 1 hour, 15°C) and extracts stored at −80°C.
Protein extracts were assayed using a modified Bradford method (Protein Assay; Bio-Rad, Hemel Hempstead, UK). It should be noted that protein recovery figures given for processing experiments would be affected by loss of material during scraping of sections, so although the values can be directly compared, in absolute terms they will be underestimations.
2D-PAGE
Isoelectric focusing was performed on 18-cm immobilized pH gradient strips (pH 3-10NL, Amersham Pharmacia) using an IPGphor (Amersham Pharmacia). Samples were applied by in-gel rehydration 34 (30 V, 13 hours) using 7 mol/L urea, 2 mol/L thiourea, 4% w/v CHAPS, 0.46% w/v dithiothreitol, 0.2% Pharmalyte pH 3 to 10 with a trace of bromophenol blue as the reswell buffer with a total sample volume of 450 μl. Thirty μg protein was generally loaded for analytical gels except for LCM samples in which the load was that procured by a specific number of laser shots as indicated in the text. For preparative gels 300 to 600 μg of protein was loaded. Focusing was performed for 65 kVh (200 V 1 hour, 500 V 1 hour, 1000 V 1 hour, 1000 to 8000 V 1 hour, 8000 V to end).
SDS-PAGE was performed using 10% T or 12% T gels with a 4% T stack using the ISO-DALT system (Amersham Pharmacia). Immobilized pH gradient strips were incubated in equilibration buffer (6 mol/L urea, 30% v/v glycerol, 2% w/v sodium dodecyl sulfate, 0.05 mol/L Tris-HCl, pH 6.8) containing 1% w/v dithiothreitol for 15 minutes followed by equilibration buffer containing 4% w/v iodoacetamide for 10 minutes and then rinsed with gel running buffer. Strips were placed on top of the second dimension gels and overlaid with 1% w/v low melting point (LMP) agarose in Tris-glycine gel running buffer (24 mmol/L Tris, 0.2 mol/L glycine, 0.1% w/v sodium dodecyl sulfate). Electrophoresis was performed at 15 to 20 mA per gel at 12.5°C.
For analytical purposes, gels were fixed (50% v/v methanol, 10% v/v acetic acid) and proteins detected by silver staining using OWL silver stain (OWL Separation Systems, Portsmouth, NH). For subsequent protein sequencing, preparative gels were fixed (40% v/v ethanol, 10% v/v acetic acid) and silver stained using the PlusOne silver staining kit (Amersham Pharmacia) as described in the manufacturer’s instructions but omitting glutaraldehyde from the sensitizing step and formaldehyde from the silver reaction and adding only 100 μl of formaldehyde to the developer. 35
Gels were scanned using a Personal Densitometer (Molecular Dynamics, Chesham, UK). Analysis was performed using Melanie 3 software (GeneBio, Geneva, Switzerland).
Peptide Mass Fingerprinting
Protein spots were excised from the gel, destained in 15 mmol/L potassium ferricyanide (III) and 50 mmol/L sodium thiosulfate for 10 to 20 minutes then incubated in MilliQ-H2O for 2 × 20 minutes. Gel pieces were cut into small pieces and incubated with 25 mmol/L ammonium bicarbonate for 3 × 20 minutes and sonicated for 5 minutes in an ultrasonic bath. After centrifugation at 13,000 rpm in a microfuge for 5 minutes, gel pieces were dried by incubation with acetonitrile (3 × 15 minutes) during which they were vortexed regularly to prevent clumping. After removal of the last acetonitrile wash, tubes were left to air dry for 30 to 60 minutes then cooled on ice for 10 minutes. Ice-cold trypsin (33 μg/ml in 25 mmol/L of ammonium bicarbonate) was added to rehydrate the gel pieces and samples were incubated on ice for 30 minutes. A further twenty-five μl of ice-cold 25 mmol/L ammonium bicarbonate was added and samples were incubated overnight at 37°C. Supernatants were transferred into Slick Seal tubes (Bioquote, York, UK). Peptides were extracted twice with 50% v/v acetonitrile and 0.1% v/v trifluoroacetic acid for 15 minutes in an ultrasonic bath. These extracts were pooled and samples were dried in a centrifugal evaporator.
Samples were analyzed using a TofSpec2E MALDI-TOF mass spectrometer (Micromass, Manchester, UK). Peptide masses were screened against the NCBI database using MASCOT software. 36 Alternatively samples were subjected to nano-lc tandem mass spectrometry using a Q-TOF mass spectrometer (Micromass) and data collected and analyzed using MS-TAG or MS-PATTERN (/Protein Prospector).
Results
Tissue Preparation for LCM
H&E is the most commonly used general histochemical stain. Good protein recovery (60 to 80%) was obtained after H&E staining, and as previously described, there was no gross effect on the resulting protein profile of cervix or kidney cortex (Figure 1A) ▶ . 26 Although the spot patterns were very similar qualitatively, there were a number of specific changes and quantitative analysis showed that a significant number of proteins changed their relative abundance after fixation and staining. Comparison of two independent processing experiments indicated that these changes were generally reproducible. The ratio of spot intensities in the control and processed samples was calculated for 580 spots in each experiment (Figure 1B) ▶ . Comparison of these values showed a significant correlation (r = 0.700, P < 0.001), confirming that consistent protein profiles were obtained after processing. A second consequence of H&E staining that was also apparent was a general detrimental effect on protein focusing, especially at the basic end of the gel (see Figures 1 and 2 ▶ ▶ ). Dissection of the staining procedure by omitting each step in turn indicated that the specific protein changes could not be totally attributed to a particular stage. However, the effect on focusing resulted, at least in part, from eosin staining as samples prepared from hematoxylin-stained tissue sections (that is, with the omission of eosin) were not affected (Figure 2) ▶ . This is unlikely to be a serious problem with the much smaller amounts of sample available after LCM.
Figure 1.

The effect of H&E staining on 2D-gel profiles. A: 2D-gels of samples prepared from sections cut directly into lysis buffer (left) or onto slides and processed by H&E staining before protein extraction (right) are shown. B: The relative changes in intensity of 580 protein species in two independent processing experiments are shown. The ratio of percent volume of a spot in the control sample to percent volume of a spot in the H&E-stained sample was calculated after processing of two normal kidney cortex samples. The two ratios obtained for each spot were then plotted and a Spearman correlation coefficient was calculated for the data sets using SPSS for Windows.
Figure 2.

The effect of eosin staining on 2D-PAGE. Two-dimensional gels of samples prepared from sections cut onto slides and stained with hematoxylin alone (left) or H&E (right) are shown. It should be noted that the effect of H&E staining on separation of proteins by 2D-PAGE was more pronounced in some experiments.
The use of alternative histochemical stains was also investigated. Methyl green was found to be compatible with subsequent 2D-PAGE, with no effect on the quality of protein separation being apparent (Figure 3A) ▶ . Again changes in the relative intensity of many proteins were evident after processing but there was acceptable correlation between two independent processing experiments. Toluidine blue also gave satisfactory results (Figure 3B) ▶ , although a detrimental effect on protein recovery and focusing was clearly apparent and increased markedly with the relative intensity of staining of tissue sections. Generation of good quality protein profiles and subsequent gel analysis were therefore more problematic and the changes visible in the gel pattern were slightly less well conserved.
Figure 3.
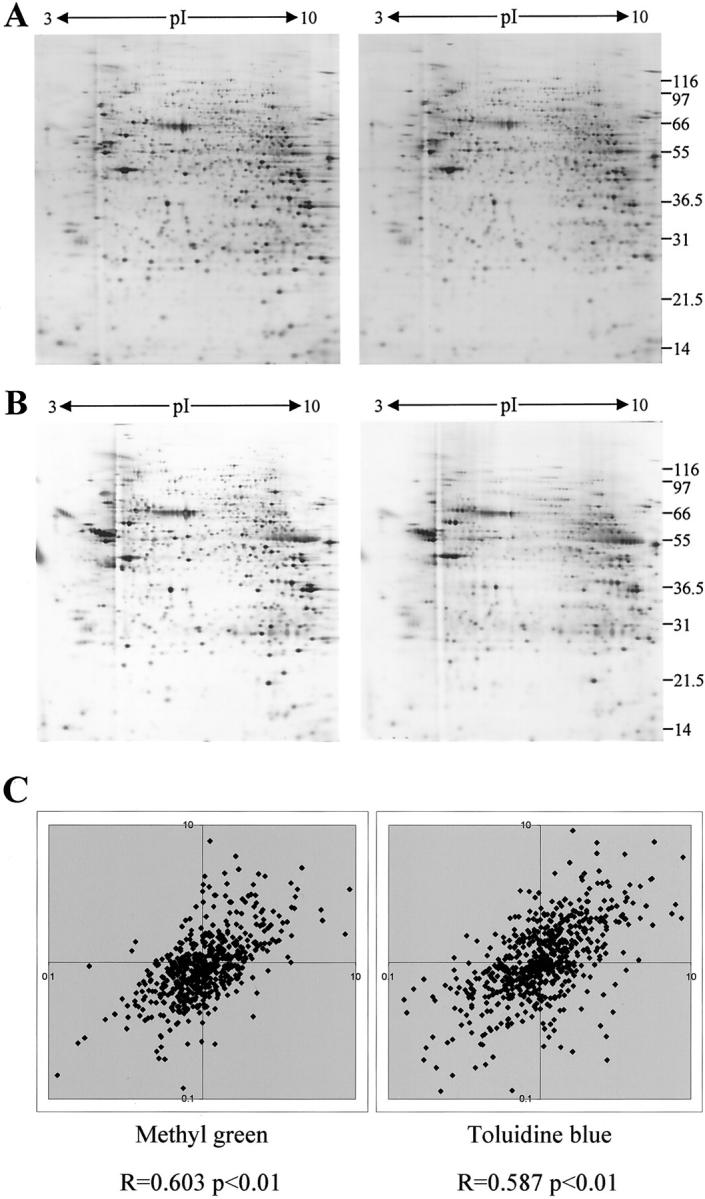
The effect of methyl green and toluidine blue staining on 2D-PAGE. Two-dimensional gels of samples prepared from sections cut directly into lysis buffer (left) or onto slides and processed (right) are shown for methyl green (A) and toluidine blue (B) staining. C: Scatter plots showing the conservation of relative change in intensity of protein species after processing are presented (for details see Figure 1 ▶ ).
Antibodies can be useful tools to identify specific subpopulations of cells. A rapid immunolabeling method developed using detection of gold-conjugated secondary antibodies by silver enhancement allowed the successful visualization of proximal tubules in normal kidney cortex sections after anti-CD13 labeling (Figure 4) ▶ . Both acetone and ethanol fixation were investigated as the reactivity of many antibodies is dependent on choice of fixative. The overall yield of protein from acetone-fixed and immunolabeled sections was poor (20%) and although good separation of proteins by 2D-PAGE was achieved there was clearly a selective loss of proteins occurring during fixation and staining (Figure 5A) ▶ . Ethanol fixation in combination with immunolabeling was more successful. Total protein recovery was improved compared to acetone fixation (40%) and changes in the protein profile were less pronounced (Figure 5B) ▶ .
Figure 4.

Immunolabeling of proximal tubules in normal kidney cortex. Normal kidney cortex sections were labeled with anti-CD13 antibodies using a rapid-staining protocol that uses silver enhancement of gold labeling as the detection system.
Figure 5.
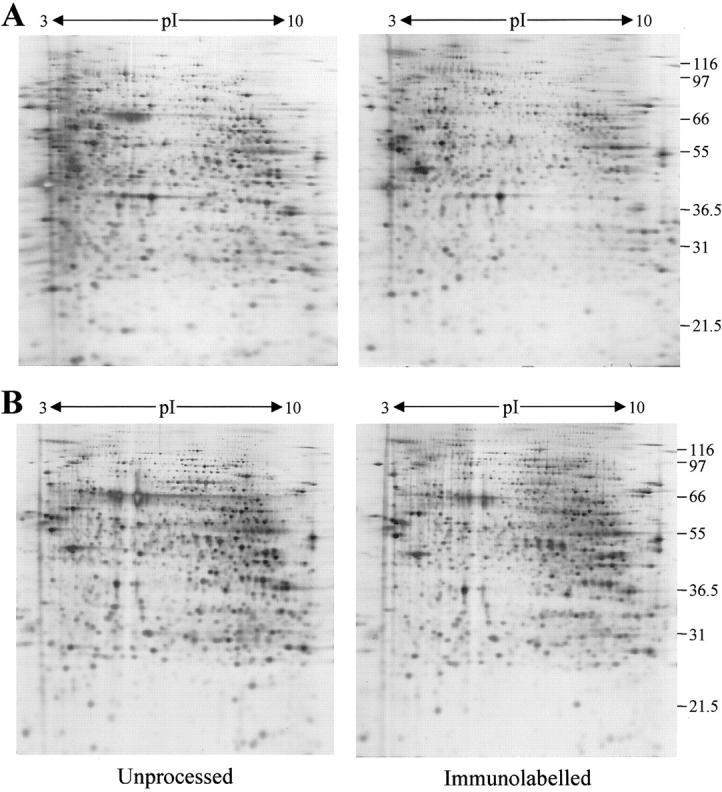
Immunolabeling and 2D-gel analysis. Two-dimensional gels of samples prepared from sections of normal kidney cortex cut directly into lysis buffer (left) or onto slides and processed by immunolabeling before protein extraction (right) are shown. Immunolabeling was performed after acetone fixation (A) or ethanol fixation (B). Immunoglobulin heavy and light chains are not evident in the 2D-gel pattern, probably because the amount of bound antibody is below the detection limit.
LCM and Proteome Analysis
A number of dissections of H&E-stained tissues were performed and the yield of protein assessed in terms of the number of spots detected in the 2D-gel profiles (Table 1) ▶ . Not surprisingly this was tissue-dependent, however in all cases an acceptable number of proteins were detected although this should be compared to gels of whole-tissue extracts that routinely contain upwards of 1200 protein species.
Table 1.
Recovery of Proteins after LCM
| Tissue type dissected | 15-μm laser shots (equivalents) | Gel features | Time taken |
|---|---|---|---|
| Proximal tubules from normal | 7,000 | 470 | 2 days |
| kidney cortex* | 18,000 | 660 | 4 days |
| Tumor cells from renal cell | 10,000 | 520 | 0.5 days |
| carcinoma (grade 3) | 55,000 | 800 | 1.5 days |
| Epithelium from cervix | 7,500 | 590 | 3 hours |
| 20,000 | 750 | 6 hours | |
| 30,000 | 930 | 9 hours |
*Proximal tubules were dissected using a 7.5-μm-diameter laser beam and the number of 15-μm laser shots calculated accordingly.
To assess enrichment, 2D-gel profiles of dissected samples were compared to separations of an equivalent amount of total tissue lysate. With the kidney samples analyzed, no substantial enrichment was produced by dissection of proximal tubules from normal renal cortex or tumor cells from RCC tissue (data not shown). In contrast, dissection of normal stratified cervical epithelium from the underlying stroma resulted in very obvious enrichment in the 2D-gel pattern (Figure 6) ▶ with many proteins being restricted to or enriched in either the epithelial or stromal sample. The identity of a selection of these proteins was determined by mass spectrometry or by comparison to other 2D maps (Figure 6 ▶ and Table 2 ▶ ).
Figure 6.

LCM of normal cervical epithelium. Two-dimensional gels of dissected cervical epithelium (left), material remaining after dissection (stroma; right), and whole tissue sections (total; middle) are shown. A number of proteins with differential expression patterns are highlighted on the gels of stroma and epithelium. The numbered proteins are those for which identities have been determined (see text and Table 2 ▶ ). The gel load was normalized to the LCM sample that contained protein recovered from 7500 15-μm laser shots of epithelium from H&E-stained sections. Representative micrographs of the tissue samples are shown.
Table 2.
Identities of Epithelial and Stromal Proteins
| Gel reference | Identity | Localization | Mapping |
|---|---|---|---|
| 1 | Albumin | Stroma | Gel matching |
| 2 | IgG heavy chain | Stroma | Gel matching |
| 3 | Cytokeratin 5 | Epithelium | Mass spectrometry |
| 4/5 | Cytokeratin 6F | Epithelium | Mass spectrometry |
Gel matching was done using in-house gels and gels available at SWISS 2D-PAGE. Gel references refer to Figure 6 ▶ .
Discussion
Normal and diseased tissues are complex mixtures of different cell types, containing cells at different stages of differentiation, and many kinds of infiltrating cells. An understanding of the changes in nucleic acid and protein expression and function that occur in disease requires the ability to define and select particular cell populations. Collection of the relevant cell population in sufficient quantity and quality is a substantial challenge. One of the methods that is being increasingly used to circumvent this problem is LCM. Two criteria that can be used to judge the suitability of LCM in combination with 2D-PAGE are protein yield and degree of enrichment in the dissected sample compared to the starting material. These must be balanced against any protein modifications or degradation and the time taken for dissection.
In the experiments described here we have used cryopreserved tissue samples, with sections being fixed with ethanol or acetone immediately before staining. Formalin fixation was not examined because of its known cross-linking effects on proteins. Three histochemical stains and immunolabeling have been examined as alternative staining protocols for LCM prior to preparation of protein extracts for 2D-PAGE.
The preservation of protein profiles after ethanol fixation and H&E staining was encouraging. Good correlation was observed between two independent experiments and although a number of significant changes were visible, these were generally reproducible making direct comparisons of samples prepared in parallel a valid approach. However, tissue processing may introduce an increased level of noise to any analysis of differential protein expression. In the two comparative studies published to date the authors selected protein species whose expression was specific for a particular sample class 27,28 thereby overcoming this problem. For identification of disease markers this poses no real problem but it may be more significant when considering more minor protein expression changes important in disease pathogenesis.
Methyl green and toluidine blue staining were also compatible with the analysis of proteins by 2D-PAGE. However, the results with toluidine blue indicated that there was a direct link between intensity of tissue section staining and problems with generation of good quality protein separations. It has been reported that protein solubilization in a modified lysis buffer lacking dithiothreitol and carrier ampholytes can assist protein solubilization for 2D-PAGE after toluidine blue staining. 29 Although this gave slightly improved gels in some cases, we found this to be at the expense of protein recovery (unpublished data), which was adversely affected.
Taken together these experiments illustrate the need to assess and optimize tissue section processing to ensure the generation of superior and representative protein profiles. However, protein extraction and separation could be achieved after all staining protocols tested. Although the stains have a differing impact on protein recovery and isoelectric focusing, many of the specific changes that are seen in the protein profile result from incubation of tissue sections in aqueous solutions rather than staining per se and are seen in all processing experiments. The results with H&E staining, which generally gives the best discrimination of tissue morphology, were not surpassed in terms of protein recovery and separation produced.
Immunolabeling was also found to be compatible with protein profiling by 2D-PAGE. Protein loss during staining was a more significant problem, especially after acetone fixation, which obviously has an impact on an approach that is already subject to the problems of limited material for downstream analysis. Acetone fixation was also associated with very marked changes in the protein profile. Again these results illustrate the need to evaluate tissue processing but indicate that immunolabeling can be used as an alternative staining method for protein-based studies.
The use of LCM in combination with 2D-PAGE is clearly tissue-dependent. The dissection of cervical epithelium from underlying stroma was successful and demonstrated how a clean and rapid dissection can be accomplished. Selective loss of serum proteins (such as albumin and IgG heavy chains) in the epithelial sample together with enrichment of cytokeratins 5 and 6F, proteins known to be expressed in cervical epithelium, 37 further validates the use of LCM in this type of approach. Similar enrichment has been reported for dissection of prostate and esophageal tumor samples. 27,28 For tissues in which the cell type of interest is in the minority and relatively easy to dissect, LCM will have a very important role in combination with proteomic analysis.
However, in normal kidney samples this approach failed to demonstrate evidence of significant enrichment despite extensive dissection. This may be because normal kidney has a much more complex structure that makes it difficult to cleanly dissect large amounts of particular tissue compartments such as the proximal tubules. Also proximal tubules are a major component of the cortical tissue and therefore less contaminating material would be removed by dissection. Finally, there may be a less distinct difference between the protein profiles of proximal tubules and the surrounding cell types. Enrichment may therefore not be revealed by examination of only the most abundant proteins detected in the limited amount of material available after LCM. The RCC samples were selected from areas where there was no macroscopic evidence of necrosis or fibrosis, and the relative purity of these samples may account for the lack of enrichment in the dissected sample. Therefore, the use of whole-tissue extracts is a more suitable approach for comparison of RCC samples with their presumed normal counterpart, the proximal tubules, to identify putative disease markers.
The inability to obtain large amounts of protein for analysis is the most obvious limitation of strategies involving LCM. This inevitably means that in global profiling by 2D-PAGE, only the most abundant proteins can be studied and the majority of these may be ubiquitously expressed gene products with housekeeping functions. The use of alternative profiling strategies such as surface-enhanced laser desorption/ionization mass spectrometry or phage display antibody libraries may reveal enrichment after LCM that is not detected at the level of 2D-PAGE. In instances in which study of less abundant proteins is desired, LCM still has a potential role in downstream validation of markers using alternative protein-based techniques.
In conclusion, LCM is likely to be a valuable complement to proteomic-based approaches and the study of disease pathogenesis. However care must be taken to ensure that the combination of LCM and 2D-PAGE is used appropriately, which will be dependent on the tissue type, the tissue preparation, and the question being addressed.
Acknowledgments
We thank Richard Unwin for helpful discussions and critical reading of the manuscript, and Lynne Hill for technical assistance.
Footnotes
Address reprint requests to Dr. Rosamonde E. Banks, ICRF Cancer Medicine Research Unit, St. James’s University Hospital, Beckett St., Leeds, LS9 7TF, UK. E-mail: r.banks@leeds.ac.uk.
Supported by the Imperial Cancer Research Fund.
References
- 1.Page MJ, Amess B, Townsend RR, Parekh R, Herath A, Brusten L, Zvelebil MJ, Stein RC, Waterfield MD, Davies SC, O’Hare MJ: Proteomic definition of normal human luminal and myoepithelial breast cells purified from reduction mammoplasties. Proc Natl Acad Sci USA 1999, 96:12589-12594 [DOI] [PMC free article] [PubMed] [Google Scholar]
- 2.Reymond MA, Sanchez JC, Hughes GJ, Günther K, Riese J, Tortola S, Peinado MA, Kirchner T, Hohenberger W, Hochstrasser DF, Köckerling F: Standardized characterization of gene expression in human colorectal epithelium by two-dimensional electrophoresis. Electrophoresis 1997, 18:2842-2848 [DOI] [PubMed] [Google Scholar]
- 3.Sarto C, Marocchi A, Sanchez JC, Giannone D, Frutiger S, Golaz O, Wilkins MR, Doro G, Cappellano F, Hughes G, Hochstrasser DF, Mocarelli P: Renal cell carcinoma and normal kidney protein expression. Electrophoresis 1997, 18:599-604 [DOI] [PubMed] [Google Scholar]
- 4.Sirivatanauksorn Y, Drury R, Crnogorac-Jurcevic T, Sirivatanauksorn V, Lemoine NR: Laser-assisted microdissection: applications in molecular pathology. J Pathol 1999, 189:150-154 [DOI] [PubMed] [Google Scholar]
- 5.Fend F, Raffeld M: Laser capture microdissection in pathology. J Clin Pathol 2000, 53:666-672 [DOI] [PMC free article] [PubMed] [Google Scholar]
- 6.Emmert-Buck MR, Bonner RF, Smith PD, Chuaqui RF, Zhuang Z, Goldstein SR, Weiss RA, Liotta LA: Laser capture microdissection. Science 1996, 274:998-1001 [DOI] [PubMed] [Google Scholar]
- 7.Gillespie JW, Ahram M, Best CJ, Swalwell JI, Krizman DB, Petricoin EF, Liotta LA, Emmert-Buck MR: The role of tissue microdissection in cancer research. Cancer J 2001, 7:32-39 [PubMed] [Google Scholar]
- 8.Schütze K, Lahr G: Identification of expressed genes by laser-mediated manipulation of single cells. Nature Biotechnol 1998, 16:737-742 [DOI] [PubMed] [Google Scholar]
- 9.Burton MP, Schneider BG, Brown R, Escamilla-Ponce N, Gulley ML: Comparison of histologic stains for use in PCR analysis of microdissected, paraffin-embedded tissues. Biotechniques 1998, 24:86-92 [DOI] [PubMed] [Google Scholar]
- 10.To MD, Done SJ, Redston M, Andrulis IL: Analysis of mRNA from microdissected frozen tissue sections without RNA isolation. Am J Pathol 1998, 153:47-51 [DOI] [PMC free article] [PubMed] [Google Scholar]
- 11.Fend F, Emmert-Buck MR, Chuaqui R, Cole K, Lee J, Liotta LA, Raffeld M: Immuno-LCM: laser capture microdissection of immunostained frozen sections for mRNA analysis. Am J Pathol 1999, 154:61-66 [DOI] [PMC free article] [PubMed] [Google Scholar]
- 12.Goldsworthy SM, Stockton PS, Trempus CS, Foley JF, Maronpot RR: Effects of fixation on RNA extraction and amplification from laser capture microdissected tissue. Mol Carcinog 1999, 25:86-91 [PubMed] [Google Scholar]
- 13.Luo L, Salunga RC, Guo H, Bittner A, Joy KC, Galindo JE, Xiao H, Rogers KE, Wan JS, Jackson MR, Erlander MG: Gene expression profiles of laser-captured adjacent neuronal subtypes. Nat Med 1999, 5:117-122 [DOI] [PubMed] [Google Scholar]
- 14.Sgroi DC, Teng S, Robinson G, LeVangie R, Hudson Jr JR, Elkahloun AG: In vivo gene expression profile analysis of human breast cancer progression. Cancer Res 1999, 59:5656–5661 [PubMed]
- 15.Leethanakul C, Patel V, Gillespie J, Pallente M, Ensley JF, Koontongkaew S, Liotta LA, Emmert-Buck M, Gutkind JS: Distinct pattern of expression of differentiation and growth-related genes in squamous cell carcinomas of the head and neck revealed by the use of laser capture microdissection and cDNA arrays. Oncogene 2000, 19:3220-3224 [DOI] [PubMed] [Google Scholar]
- 16.Kitahara O, Furukawa Y, Tanaka T, Kihara C, Ono K, Yanagawa R, Nita ME, Takagi T, Nakamura Y, Tsunoda T: Alterations of gene expression during colorectal carcinogenesis revealed by cDNA microarrays after laser-capture microdissection of tumor tissues and normal epithelia. Cancer Res 2001, 61:3544-3549 [PubMed] [Google Scholar]
- 17.Leethanakul C, Patel V, Gillespie J, Shillitoe E, Kellman RM, Ensley JF, Limwongse V, Emmert-Buck MR, Krizman DB, Gutkind JS: Gene expression profiles in squamous cell carcinomas of the oral cavity: use of laser capture microdissection for the construction and analysis of stage-specific cDNA libraries. Oral Oncol 2000, 36:474-483 [DOI] [PubMed] [Google Scholar]
- 18.Emmert-Buck MR, Strausberg RL, Krizman DB, Bonaldo MF, Bonner RF, Bostwick DG, Brown MR, Buetow KH, Chuaqui RF, Cole KA, Duray PH, Englert CR, Gillespie JW, Greenhut S, Grouse L, Hillier LW, Katz KS, Klausner RD, Kuznetzov V, Lash AE, Lennon G, Linehan WM, Liotta LA, Marra MA, Munson PJ, Ornstein DK, Prabhu VV, Prange C, Schuler GD, Soares MB, Tolstoshev CM, Vocke CD, Waterston RH: Molecular profiling of clinical tissue specimens: feasibility and applications. Am J Pathol 2000, 156:1109-1115 [DOI] [PMC free article] [PubMed] [Google Scholar]
- 19.Chambers G, Lawrie L, Cash P, Murray GI: Proteomics: a new approach to the study of disease. J Pathol 2000, 192:280-288 [DOI] [PubMed] [Google Scholar]
- 20.Banks RE, Dunn MJ, Hochstrasser DF, Sanchez JC, Blackstock W, Pappin DJ, Selby PJ: Proteomics: new perspectives, new biomedical opportunities. Lancet 2000, 356:1749-1756 [DOI] [PubMed] [Google Scholar]
- 21.Celis JE, Wolf H, Ostergaard M: Bladder squamous cell carcinoma biomarkers derived from proteomics. Electrophoresis 2000, 21:2115-2121 [DOI] [PubMed] [Google Scholar]
- 22.Simone NL, Remaley AT, Charboneau L, Petricoin III EF, Glickman JW, Emmert-Buck MR, Fleisher TA, Liotta LA: Sensitive immunoassay of tissue cell proteins procured by laser capture microdissection. Am J Pathol 2000, 156:445–452 [DOI] [PMC free article] [PubMed]
- 23.Natkunam Y, Rouse RV, Zhu S, Fisher C, van De RM: Immunoblot analysis of CD34 expression in histologically diverse neoplasms. Am J Pathol 2000, 156:21–27 [DOI] [PMC free article] [PubMed]
- 24.Ornstein DK, Englert C, Gillespie JW, Paweletz CP, Linehan WM, Emmert-Buck MR, Petricoin EF: Characterization of intracellular prostate-specific antigen from laser capture microdissected benign and malignant prostatic epithelium. Clin Cancer Res 2000, 6:353-356 [PubMed] [Google Scholar]
- 25.Paweletz CP, Ornstein DK, Roth MJ, Bichsel VE, Gillespie JW, Calvert VS, Vocke CD, Hewitt SM, Duray PH, Herring J, Wang QH, Hu N, Linehan WM, Taylor PR, Liotta LA, Emmert-Buck MR, Petricoin EF: Loss of annexin 1 correlates with early onset of tumorigenesis in esophageal and prostate carcinoma. Cancer Res 2000, 60:6293-6297 [PubMed] [Google Scholar]
- 26.Banks RE, Dunn MJ, Forbes MA, Stanley A, Pappin D, Naven T, Gough M, Harnden P, Selby PJ: The potential use of laser capture microdissection to selectively obtain distinct populations of cells for proteomic analysis—preliminary findings. Electrophoresis 1999, 20:689-700 [DOI] [PubMed] [Google Scholar]
- 27.Ornstein DK, Gillespie JW, Paweletz CP, Duray PH, Herring J, Vocke CD, Topalian SL, Bostwick DG, Linehan WM, Petricoin III EF, Emmert-Buck MR: Proteomic analysis of laser capture microdissected human prostate cancer and in vitro prostate cell lines. Electrophoresis 2000, 21:2235–2242 [DOI] [PubMed]
- 28.Emmert-Buck MR, Gillespie JW, Paweletz CP, Ornstein DK, Basrur V, Appella E, Wang QH, Huang J, Hu N, Taylor P, Petricoin III EF: An approach to proteomic analysis of human tumors. Mol Carcinog 2000, 27:158–165 [PubMed]
- 29.Lawrie LC, Curran S, McLeod HL, Fothergill JE, Murray GI: Application of laser capture microdissection and proteomics in colon cancer. Mol Pathol 2001, 54:253-258 [DOI] [PMC free article] [PubMed] [Google Scholar]
- 30.Wright GL, Cazares LH, Leung S-M, Nasim S, Adam B-L, Yip T-T, Schellhammer PF, Gong L, Vlahou A: ProteinchipR surface enhanced laser desorption/ionization (SELDI) mass spectrometry: a novel protein biochip technology for detection of prostate cancer biomarkers in complex protein mixtures. Prostate Cancer Prostatic Dis 1999, 2:264-276 [DOI] [PubMed] [Google Scholar]
- 31.Paweletz CP, Gillespie JW, Ornstein DK, Simone NL, Brown MR, Cole KA, Wang QH, Huang J, Hu N, Yip T-T, Rich WE, Kohn EC, Linehan WM, Weber T, Taylor P, Emmert-Buck M, Liotta LA, Petricoin EF: Rapid protein display profiling of cancer progression directly from human tissue using a protein biochip. Drug Dev Res 2000, 49:34-42 [Google Scholar]
- 32.von Eggeling F, Davies H, Lomas L, Fiedler W, Junker K, Claussen U, Ernst G: Tissue-specific microdissection coupled with ProteinChip array technologies: applications in cancer research. Biotechniques 2000, 29:1066-1070 [DOI] [PubMed] [Google Scholar]
- 33.Rabilloud T, Adessi C, Giraudel A, Lunardi J: Improvement of the solubilization of proteins in two-dimensional electrophoresis with immobilized pH gradients. Electrophoresis 1997, 18:307-316 [DOI] [PMC free article] [PubMed] [Google Scholar]
- 34.Sanchez JC, Rouge V, Pisteur M, Ravier F, Tonella L, Moosmayer M, Wilkins MR, Hochstrasser DF: Improved and simplified in-gel sample application using reswelling of dry immobilized pH gradients. Electrophoresis 1997, 18:324-327 [DOI] [PubMed] [Google Scholar]
- 35.Yan JX, Wait R, Berkelman T, Harry RA, Westbrook JA, Wheeler CH, Dunn MJ: A modified silver staining protocol for visualization of proteins compatible with matrix-assisted laser desorption/ionization and electrospray ionization-mass spectrometry. Electrophoresis 2000, 21:3666-3672 [DOI] [PubMed] [Google Scholar]
- 36.Perkins DN, Pappin DJ, Creasy DM, Cottrell JS: Probability-based protein identification by searching sequence databases using mass spectrometry data. Electrophoresis 1999, 20:3551-3567 [DOI] [PubMed] [Google Scholar]
- 37.Smedts F, Ramaekers FC, Vooijs PG: The dynamics of keratin expression in malignant transformation of cervical epithelium: a review. Obstet Gynecol 1993, 82:465-474 [PubMed] [Google Scholar]