

Abstract
Repeated exposures to the Clara cell cytotoxicant naphthalene (NA) result in target cell populations that become refractory to further injury. To determine whether tolerance occurs from specific adaptations favoring glutathione (GSH) resynthesis without broad shifts in cellular phenotype, mice were administered NA for 21 days. We found that γ-glutamylcysteine synthetase (γ-GCS) was induced in tolerant Clara cells by repeated exposures to NA. Treating tolerant mice with buthionine sulfoximine, a γ-GCS inhibitor, eliminates resistance acquired by repeated exposures to NA. Broad phenotypic shifts were not present. Marker proteins of differentiation declined over the first 3 days in the development of tolerance, but returned to control levels at 14 and 21 days. Epithelial organizational structure and internal organelle composition in Clara cells from tolerant mice were similar compared to corn oil-treated controls, while subtle shifts in organelle distribution were present. We conclude that induction of γ-GCS expression is coordinated with the development of NA tolerance, but induction of NA tolerance does not markedly alter Clara cell differentiation, epithelial organization, or organelle composition in bronchiolar epithelium.
Due to direct contact with the environment, the respiratory system is particularly vulnerable to acute injury by airborne pollutants. Many of these contaminants, including aromatic and chlorinated hydrocarbons, are bioactivated to cytotoxic electrophilic intermediates by catalytic enzymes, such as cytochrome P-450 monooxygenases. 1,2 Previous studies have established that single parenteral administrations of naphthalene cause acute epithelial necrosis in bronchioles of mice and hamsters and cytotoxicity in the olfactory epithelium of rats, hamsters, and mice. 3 Non-ciliated, or Clara, cells in distal airway bronchiolar epithelium of mice are particularly susceptible to injury from a single naphthalene (NA) exposure. 3 In contrast, when mice are administered repeated exposures of NA, the previous susceptible Clara cells become refractory to further injury. 4 Concern regarding the effects of frequent human exposure have arisen because naphthalene has been found in body fat, 5 as well as mother’s milk 6 in conjunction with the findings that NA is carcinogenic in mice 7 and rats. 8 Despite the widespread prevalence of this compound, understanding the effects of repeated exposures on the respiratory system is not complete.
The ubiquitous antioxidant glutathione (GSH) has various intracellular roles, including the maintenance of enzyme structure, activity, and intracellular redox state. Acting as a cycle, enzymes involved in the synthesis, conjugation, and transport of GSH, collectively called the γ-glutamyl cycle, are important in detoxification. 9,10 Of critical importance is the role of GSH in the detoxification of xenobiotics such as naphthalene. Mouse lung microsomes metabolize naphthalene to glutathione conjugates 11 which deplete Clara cell glutathione in a dose dependent fashion. 12,13 Toxicity is augmented by the treatment of mice with diethyl maleate, an agent which depletes cellular glutathione. 12 In addition, it is becoming clear that the γ-glutamyl cycle is a dynamic system with the ability to change under stress to protect cells from additional toxic exposures. 14,15 We have demonstrated that the reduced susceptibility to NA injury by repeated exposure is directly related to increased airway glutathione resynthesis. 16 However, it is possible that the changes in susceptibility to naphthalene injury result from temporal shifts in the repair process or the differentiation state of the cells in the target site of injury, the bronchiolar epithelium.
Clara cell injury from bioactivated cytotoxicants such as naphthalene and dichloroethylene is followed by a repair phase that spans up to 30 days. 2,3 During this time frame, distinct periods of proliferation are followed by maturation of undifferentiated cells back to a steady population containing both mature Clara and ciliated cells. 17 In parallel to this differentiation process fluctuations in the expression of enzymes involved in the bioactivation of NA occur. 17 Protein levels of cytochrome P-4502f2 protein drop dramatically after a single injurious administration of NA, but return to control levels after 14 days of repair. 17 With respect to tolerance, the balance between bioactivation and detoxification appears to be critical. While after repeated exposures to NA protein levels of cytochrome P-450 appear to be decreased, 18 our previous studies indicate that increased airway GSH was critical in the development of tolerance. 16 Determining if the differentiation state and the ability of airways to repair while under constant stress from daily toxicant exposure is an important step in understanding how cells adapt to a state of tolerance to bioactivated xenobiotics, especially if the compounds are known carcinogens. This prompted us to ask the question whether changes in the differentiation state of Clara cells contributed to the development of NA tolerance.
This study was designed to test the hypothesis that changes in the detoxification potential, in response to repeated exposures to NA, result from a stable adaptation that favors maintenance of the GSH pool without broad changes in cellular phenotype. To test this hypothesis we addressed three questions: is induction of γ-glutamylcysteine synthetase (γ-GCS) coordinated with the development of Clara cell tolerance to long term exposures (21 days) of NA; do these cells in tolerant mice express differentiation marker proteins characteristic of normal Clara cells from naive mice and, do Clara cells from tolerant mice retain the morphological and organelle structural characteristics of the controls after repeated exposures of NA. Determining whether Clara cells undergo specific alterations to maintain increased GSH pools without drastic phenotypic shifts will provide insight into the in vivo mechanism by which cells adapt to resist injury from daily exposures to environmental pollutants.
Materials and Methods
Reagents
Naphthalene was purchased from Fischer, Fairlawn, NJ. dl-buthionine-[L,R]-sulfoximine (99.0% purity) (BSO) was purchased from Sigma Biochemical, St. Louis, MO. All fixatives and embedding reagents were purchased from Electron Microscopy Sciences (Fort Washington, PA.) All other solvents were reagent grade or better.
Experimental Protocol
Male Swiss Webster mice (6 to 7 weeks) were purchased from Charles River (Wilmington, MA.) Animals were allowed free access to food and water and were housed in an AAALAC accredited facility in HEPA filtered cage racks at the University of California, Davis for at least 5 days before use in an experiment. Mice were administered NA (0 or 200 mg/kg) daily for 21 days. To determine whether GSH is critical in the development NA tolerance, mice receiving repeated exposures (4, 7, 14, and 21 days) were treated with BSO (0 or 800 mg/kg), and challenged with an additional NA dose then processed for high-resolution histopathology. To determine whether Clara cells retain normal phenotypic characteristics, mice were administered (i.p.) NA (0 or 200 mg/kg) daily for 21 days. Mice were killed and lungs fixed by tracheal infusion at 12 and 24 hours after a single exposure and 2, 3, 4, 7, 14, and 21 days after repeated daily exposures and processed for immunohistochemistry, scanning electron microscopy (SEM), or transmission electron microscopy (TEM).
Buthionine Sulfoximine Treatment
Previous studies have demonstrated that BSO can cause a rebound 19 or increases in GSH levels due to the feedback inhibition of γ-GCS. We conducted several preliminary experiments to determine the optimal timing of the BSO and NA doses and have previously reported this data. 16 The following protocol was used for all mice in the results presented here. Mice receiving repeated exposures of NA were treated with BSO (0 or 800 mg/kg), a GSH resynthesis inhibitor, 24 hours after doses 4, 7, 14, and 21. One hour later mice were challenged with an additional NA dose (0 or 200 mg/kg), killed 3 hours after the NA challenge, and then processed for histopathological assessment.
High-Resolution Histopathology
All mouse lungs for histopathological assessment were prepared by inflation via tracheal cannula with 1% glutaraldehyde/1% paraformaldehyde in 0.1 mol/L cacodylate buffer 335 mOsm for 1 hour at 30 cm H2O pressure. The entire fixed middle (cardiac) lobe was postfixed with osmium tetraoxide and incubated overnight in uranyl acetate. 20 The postfixed tissue was embedded in Araldite-502 (Electron Microscopy Sciences), and embedded tissue was then grossly sectioned parallel to the long axis of the mainstem bronchi. Sections (0.5 μmol/L) were cut with glass knives using a Zeiss Microm HM340E microtome and stained with 1% toluidine blue (Electron Microscopy Sciences, Fort Washington, PA). Slides were imaged with a 330 CCD Dage camera on a Zeiss Axiakop MC80 microscope using Scion 1.59 imaging software.
Immunohistochemistry
Lung tissue from mice was fixed with 4% paraformaldehyde for 2 hours then placed in phosphate-buffered saline (PBS) until processing for embedding. Tissue were embedded in paraffin and sectioned at 6-μm thickness. The presence of the marker proteins for differentiated Clara cells was detected using specific antibodies: rabbit anti-rat Clara cell secretory protein (CC10) and rabbit anti-mouse cytochrome P4502f2 (CYP2f2). 21,22 Antigenic proteins were identified by the avidin-biotin horseradish-peroxidase method as outlined by Plopper et al. 23 Controls for non-specific binding were performed by substituting primary antibody with PBS. The antibody for CC10 was a generous gift for Dr. Gurmukh Singh (Veterans Affairs Medical Center, Pittsburgh, PA) and the antibody for cytochrome P-4502f was a generous gift from Dr. Henry Sasame (National Institutes of Health, Bethesda, MD). A 19-amino-acid peptide was synthesized according to the published rat γ-GCS heavy subunit amino acid sequence (at position 295–313: NH2-CRWGVISASVDDRTREERG-COOH). 24 This peptide was conjugated to carrier keyhole limpet hemocyanin (KLH) and used as an antigen to raise rabbit antisera against rat γ-GCS-HS. The polyclonal antibodies against γ-GCS-HS were used in the subsequent Western blot analysis.
Western Blot Analysis
To determine the relative expression of Cyp4502f2 and γ-GCS, the distal lung region was a isolated via microdissection of agarose inflated lungs. Briefly, tolerant mice were killed with a overdose of pentobarbital 24 hours after the last dose of naphthalene. The trachea of these animals was cannulated and lungs were infused with a 1% agarose solution containing Waymouths media deficient of sulfur-containing amino acids. Appropriate regions of lung were microdissected as previously described. 25 Microdissected airways were placed in an ice cold lysis buffer (Tris 0.1 mol/L (pH 8.2), KCl 150 mmol/L, MgCl2 20 mmol/L, and EDTA 2 mmol/L) containing protease inhibitors and homogenized. Homogenized proteins were centrifuged at 9000 × g for 20 minutes. Soluble protein content was determined by the microBradford method 26 and samples were frozen at −80°C until analysis. Soluble protein were diluted in a 10% sodium dodecyl sulfate (SDS) sample buffer containing β-mercaptoethanol and separated by gel electrophoresis using a Bio-Rad Tris-HCl-buffered 10% polyacrylamide Minigel (Hercules, CA). Gels were transferred on to a polyvinylydifluoroacetate membrane (NEN, Inc., Boston, MA) and probed with the rabbit antibody produced against the cytochrome P4502f (1:10,000) or the catalytic subunit of γ-glutamylcysteine synthetase (1:5000). Bands were detected by chemilumenescence using a horseradish peroxidase-linked secondary goat antibody produced against rabbit IgG.
Scanning Electron Microscopy
Briefly, the airway tree of the cranial lobe was exposed by microdissection, dehydrated through a graded ethanol series, immersed in hexamethyldisilazine for 5 minutes, and air dried overnight. Desiccated lungs were then gold-coated with a Polaron II E5100 sputter coater at 2.5 kV acceleration voltage in argon with a 10 mA current for 2 minutes. Airways were imaged using a Phillips SEM 501 microscope.
Transmission Electron Microscopy
Terminal airways from mice receiving repeated daily injections of NA (0 or 200 mg/kg) were selected from araldite sections used for high-resolution histopathology. Using the original blocks these airways were isolated and sectioned at 70 nm with a Sorvall MT 5000 utlramicrotome. These sections were stained with uranyl acetate and lead citrate then examined using a Zeiss EM-10 electron microscope at 60 kV. Complete profiles (including basal lamina, nucleus, and apical projections) of a minimum of 10 Clara cells per animal were categorized blindly by one investigator for differences in size, mitochondrial conformation, and secretory granule distribution and abundance.
Results
Tolerance to Acute Injury Reduced by BSO Treatment
Terminal airways of mice receiving repeated corn oil injections were lined by a simple cuboidal epithelium (Figure 1A) ▶ . The majority of the cells were non-ciliated. Many of these non-ciliated, or Clara cells, had apical projections into the airway lumen. Three hours after control mice were administered 200 mg/kg NA, Clara cells were swollen (Figure 1B) ▶ , formed large clear cytoplasmic vacuoles, and had discrete apical blebs (**). No signs of toxicity were detected in control mice treated with BSO alone without NA (data not shown).
Figure 1.
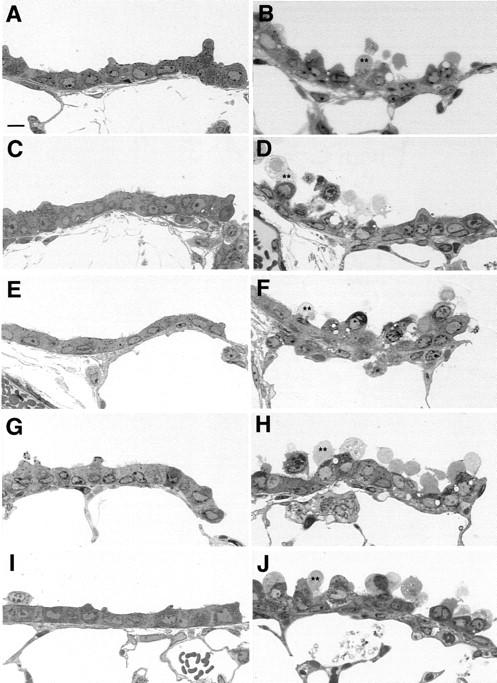
Histopathological assessment of tolerant mice administered BSO and challenged with NA. Mice were administered up to 21 repeated daily NA injections (0 or 200 mg/kg,). Twenty-four hours after the last injection mice were administered BSO then 1 hour later given an additional NA challenge dose (200 mg/kg). Mice were killed 3 hours later for histopathological assessment of terminal airway epithelium. A: Corn oil × 7; B: Corn oil × 7 + NA; C: NA × 4 + NA; D: NA × 4 + BSO + NA; E: NA × 7 + NA; F: NA × 7 + BSO + NA; G: NA × 14 + NA; H: NA × 14 + BSO + NA; I: NA × 21 + NA; J: NA × 21 + BSO + NA.
In contrast to control mice, as previously described, 4 repeated daily exposures to NA resulted in epithelium that appeared to be resistant to further injury. Twenty-four hours after the last of 4, 7, 14, or 21 daily injections of NA, mice were divided into four groups, administered BSO (0 or 800 mg/kg), then further subdivided and challenged with NA (0 or 200 mg/kg). Tolerant animals, at all time points (4, 7, 14, and 21 days), challenged with a 200 mg/kg NA dose showed no detectable morphological differences from control (Figure 1, C, E, G, I) ▶ . In contrast, 3 hours after administration of the NA challenge dose, tolerant animals from the same time points treated with BSO had severe airway injury similar to challenged non-tolerant mice (Figure 1, D, F, H, J) ▶ . After four repeated exposures to NA, the resulting injury from pretreatment with BSO before NA challenge failed to injure all of the cells in the distal airways (Figure 1D) ▶ , there was consistent sparing of the most terminal population of Clara cells. The injured cells appeared to be clustered together, while large areas of cells remained unaffected by the combined treatment. After 7, 14, and 21 days of repeated injections, pretreatment with BSO caused significant NA-induced injury. The response in the distal airways of these mice was less variable than mice receiving four repeated injections of NA. Injury extended down to involve the most terminal Clara cells, in contrast to those spared after four repeated injections of NA. Occasional Clara cells were exfoliated and most had discrete swollen apical membrane blebs (**), similar to NA-challenged controls. Overall, the airway epithelium from the tolerant mice was similar to NA-challenged non-tolerant mice. No signs of toxicity were detected in tolerant mice treated with BSO alone without NA (data not shown).
Cellular Expression of γ-GCS
In control mice, detectable γ-GCS was present throughout the airways and lung parenchyma as diffuse lightly positive staining within the cells (Figure 2B) ▶ compared to control sections with PBS substituted for primary antibody (Figure 2A) ▶ . This corresponded to a faint band detectable by Western blot analysis (Figure 3) ▶ . Clara cells in control mice appeared to have protein localized to the cytoplasm of the basal half of the cell (Figure 2B ▶ , inset). Twenty-four hours after a single injection of NA, immunoreactive protein appeared to be induced in bronchioles isolated by microdissection as assessed by Western blot (Figure 3) ▶ , and appeared in cells exfoliated from the basal lamina in terminal bronchioles (Figure 2C) ▶ . After two repeated injections, γ-GCS protein was clearly elevated in microdissected bronchioles from tolerant mice (Figure 3) ▶ and immunohistochemically evident in both the apical and basal regions of Clara cells (Figure 2D) ▶ . A similar expression pattern was present after 7, 14, and 21 repeated daily injections of NA (Figure 2, G–I) ▶ . After 14 and 21 repeated daily injections, Western blot analysis revealed that γ-GCS expression declined but remained elevated from control (Figure 3) ▶ , while the epithelium in terminal airways retained a strong immunoreactive signal (Figure 2, H and I) ▶ .
Figure 2.
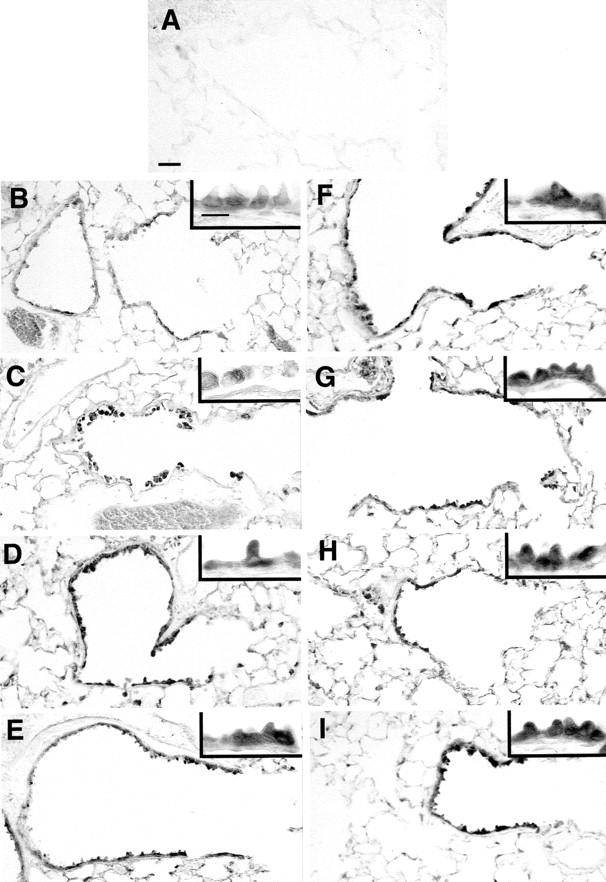
Expression of γ-GCS in terminal airways of tolerant mice. 6-μm paraffin sections were probed with rabbit α γ-GCS antibody. A: Substituting 10 antibody with phosphate-buffered saline eliminated γ-GCS labeling. In Clara cells of the terminal airways γ-GCS expression appears low in control mice (B), and was found in exfoliating cells after a single NA exposure (C), but induced in Clara cells above control after 2 (D), 3 (E), 4 (F), 7 (G), 14 (H), and 21 (I) repeated daily injections. Scale bar in A, 30 μm; scale bar in B (inset), 10 μm.
Figure 3.

Western blot of γ-GCS in distal lung homogenates of tolerant mice. Western blot analysis revealed that γ-GCS expression was induced above control (CON) after 1 (24 hours); 2 (48 hours), 3 (72 hours), 4 (96 hours), and 7 (7 days) daily repeated injections. After 14 (14 days) and 21 (21 days) daily repeated NA injections γ-GCS appeared to decrease slightly, but remained elevated from control.
Cellular Expression of Clara Cell Secretory Protein
Immunoreactive CC10 was only detected in Clara cells, and was expressed throughout the airways of control mice (Figure 4A) ▶ . Twelve hours after receiving one NA exposure (200 mg/kg) CC10 positive cells were exfoliating into the airway lumen (Figure 4B) ▶ . Twenty-four hours after a single NA injection immunoreactive CC10 was detected, but reduced in the terminal airways, and was not prominent in the squamated cells after exfoliation (Figure 4C) ▶ . After two daily injections of NA the most distal airways were largely devoid of immunoreactive CC10 (Figure 4D) ▶ and this pattern of expression remained after 4 repeated daily exposures (Figure 4E) ▶ . After 7 daily exposures to NA, (Figure 4F) ▶ the number of CC10 immunoreactive cells increased, but the overall intensity was less than controls. After 14 and 21 daily injections, the expression of CC10 became indistinguishable from control animals.
Figure 4.
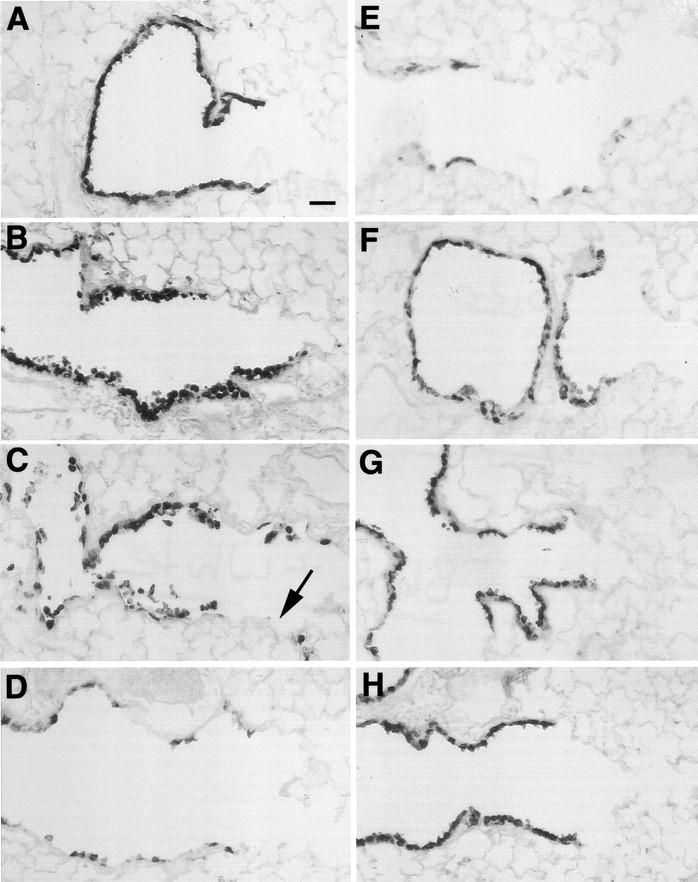
Expression of CC10 secretory protein in terminal airways of tolerant mice. 6-μm paraffin sections were probed with rabbit α CC10 antibody (1:10,000). In Clara cells of the terminal airways CC10 expression is confined to the epithelium of the airways in control mice (A), 12 hours after a single exposure CC10 positive had exfoliated from the terminal airways (B). After 24 hours the most terminal airways were devoid (→) of CC10 positive cells (C) . After 2 repeated exposures CC10 expression remained low in the terminal airways (D). Mice administered 4 repeated injections had multifocal expression of CC10 (E), which after 7 repeated exposures had become a diffuse signal throughout most Clara cells (F). Mice receiving 14 (G), and 21 repeated injections (H) had CC10 expression which was comparable to control mice. Scale bar in A, 30 μm.
Cellular Expression of Cytochrome P4502f2
The expression of immnunoreactive Cyp2f2 protein in control animals was only detected in Clara cells (Figure 5A) ▶ and was detected as a single band by Western blot analysis (Figure 6) ▶ in mice receiving repeated corn oil injections. The overall pattern of changes in CYP2f2 parallels that of CC10. Twelve hours after a single dose of NA (200 mg/kg) cells with immunoreactive Cyp2f2 were exfoliated into the airway lumen (Figure 5B) ▶ . After 24 hours, immunoreactive Cyp450 was not detectable by Western blot (Figure 6) ▶ and, like CC10, at this time was absent from the most terminal airway Clara cells (Figure 5C) ▶ . Terminal airways of mice receiving two or three daily exposures of NA also expressed greatly reduced Cyp2f2 based on Western blot analysis (Figure 6) ▶ or immunohistochemistry (Figure 5D) ▶ . After four daily injections of NA, a faint, but detectable band was present in Western blots (Figure 6) ▶ , which was coordinated with focal expression of immunoreactive protein in bronchiolar epithelial cells (Figure 5E) ▶ . After 1 week of repeated daily exposures to NA, Cyp2f2 expression continued to increase (Figure 6) ▶ ; most Clara cells in the terminal airways now expressed a diffuse signal for immunoreactive for CYP2f2 (Figure 5F) ▶ . While these marker proteins differed at 7 days, after 14 and 21 repeated exposures of NA the expression of Cyp2f2 appeared similar to control animals when assessed by both Western blot analysis (Figure 6) ▶ or immunohistochemistry (Figure 5, G and H) ▶ .
Figure 5.
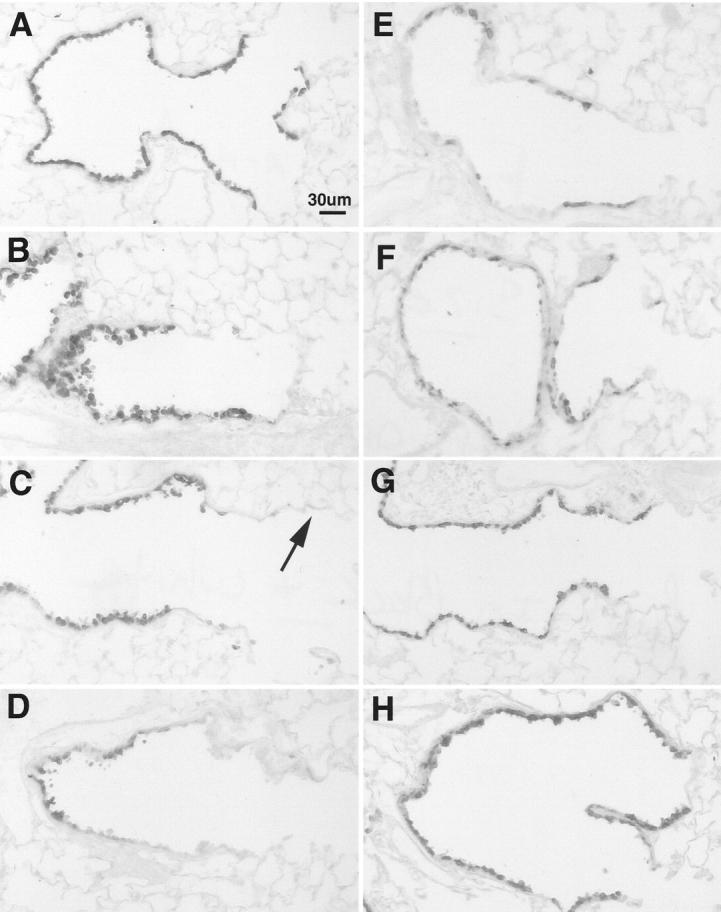
Expression of cytochrome P4502f2 in terminal airways of tolerant mice. 6-μm paraffin sections were probed with rabbit α cytochrome P4502f2 antibody (1:10,000). In Clara cells of the terminal airways P4502f2 expression is confined to the epithelium of the airways in control mice (A). P4502f2 positive had exfoliated from the terminal airways 12 hours after a single exposure (B). After 24 hours the most terminal airways were devoid (→) of P4502f2 positive cells (C). After 2 repeated exposures P4502f2 expression remained low in the terminal airways (D). Mice administered 4 repeated injections had multifocal expression of P4502f2 (E), which after 7 repeated exposures had become a diffuse signal throughout most Clara cells (F). Mice receiving 14 (G), and 21 (H) repeated injections had P4502f2 expression which was comparable to control mice. Scale bar in A, 30 μm.
Figure 6.

Western blot of cytochrome P4502f2 in distal lung homogenates of tolerant mice. Western blot analysis revealed that CYP2f2 decreased from control (CON) after a single injection of NA (24 hours); and after 2 injections (48 hours), and 3 injections (72 hours). After 4 (96 hours) and 7 (7 days) repeated injections CYP2f2 began to increase, eventually returning back to control levels after 14 (14 days) and 21 (21 days) repeated injections of NA.
Clara Cell Surface Structure in Tolerant Mice
Terminal airways from control mice were lined by two predominant cell types, non-ciliated (Clara) cells and ciliated cells (Figure 7A) ▶ . The non-ciliated cells had apical projections that extended into the lumen and were organized in linear rows down the main axial path of the airways. Ciliated cells were less numerous and interspersed among these rows. The apical portion of the Clara cells was a defined dome-like region in the center of the cells. The cilia covered the entire lumenal surface of the ciliated cells (Figure 7A) ▶ . Twenty-four hours after an intraperitoneal injection of NA, the terminal airways were devoid of intact Clara cells (Figure 7B) ▶ which had exfoliated and overlaid the subadjacent layer of attenuated ciliated cells (Figure 7B) ▶ . The cilia of these cells was now restricted to the center of the cell as a discrete tuft (Figure 7B) ▶ . After two or three repeated injections of NA, cilia appear shorter and less prominent and non-ciliated cells again are apparent but are poorly differentiated and unorganized (Figure 7, C and D) ▶ . The cilia are difficult to distinguish and often absent after mice have received three daily NA exposures (Figure 7D) ▶ . After four repeated exposures clusters of cells with small apical projections begin to appear in the distal airways (Figure 7E) ▶ . After seven daily injections of NA these clusters of Clara cells have coalesced to the majority of the terminal airway surface (Figure 7F) ▶ and infrequently appeared as nodules. The presence of these nodules as seen with high-resolution histopathology has been previously reported elsewhere. 16 Ciliated cells were now more easily identifiable (Figure 7F) ▶ , but few appeared to have cilia comparable in length to those in control mice (Figure 7A) ▶ . After 14 days of daily injections of NA, the epithelium of terminal airways appeared more organized, the cells were more evenly dispersed and morphologically similar to control animals (Figure 7G) ▶ . After 21 daily exposures to NA, the individual cell types of the epithelium of the terminal airways are clearly recognizable, although both Clara and ciliated cells appear to be larger with more distinct cell borders, such that fewer cells are seen per field (Figure 7H) ▶ .
Figure 7.
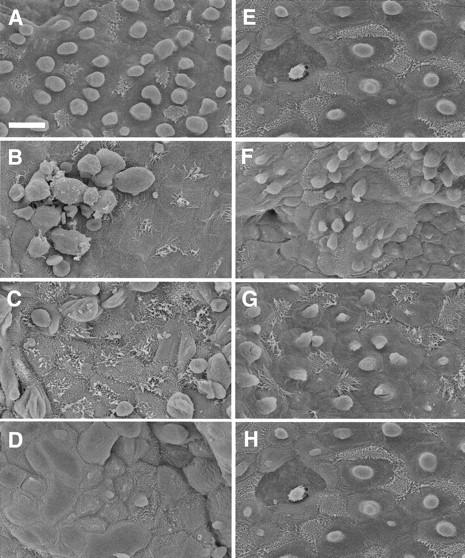
Surface structure of bronchiolar epithelium after repeated injections of NA. Scanning electron microscopy of mouse terminal airways revealed differences between mice receiving daily exposures of corn oil or NA. Mice were administered repeated injections of corn oil (A), or 1 (B), 2 (C), 3 (D), 4 (E), 7 (F), 14 (G), or 21 (H) repeated daily NA injections. Scale bar in A, 10 μm.
Clara Cell Ultrastructure in Tolerant Mice
When compared to Clara cells of carrier-treated control animals, there were considerable variations in the ultrastructure of Clara cells in terminal bronchioles of animals exposed to NA for 21 days (Figure 8) ▶ . Mitochondria in control animals were a mixture of large circular profiles with electron dense matrix and few cristae (Figure 8B) ▶ and smaller mitochondria with elongated profiles and more abundant cristae. All Clara cells evaluated from control animals had an abundance of large mitochondria (Figure 8A) ▶ . By contrast, most of the mitochondria present in treated animals had long, narrow profiles with large abundant cristae (Figure 8D) ▶ . In very few of the Clara cells evaluated in tolerant animals (7%) were large mitochondria present. In comparison to control animals, smooth endoplasmic reticulum (SER) in tolerant mice appeared to be more abundant, very tightly packed, and distributed throughout the cytoplasm (Figure 8, C and F) ▶ . The Golgi apparatus also appeared to be more abundant. In control animals, Golgi was not apparent in every ultrastructural profile (Figure 8A) ▶ , while in profiles of Clara cells from tolerant mice, there were more (minimum of two) Golgi profiles (Figure 8C) ▶ , and each Golgi profile had more lamellae whose cisternal content was more dense. In tolerant animals, secretory granules were less abundant, more varied in size, and more widely dispersed around all aspects of the nucleus (Figure 8C) ▶ . In Clara cells from control mice the granules were restricted to the apical portion of the cytoplasm, generally in the lumenal projection (Figure 8A) ▶ . However, when compared quantitatively, fewer cells in tolerant animals (21%) had a wide dispersion of granules than was the case for the controls (36%). Rough endoplasmic reticulum (RER) was much more abundant in Clara cells of tolerant mice, and was widely distributed dorsal, basal, and lateral to the nucleus (Figure 8G) ▶ . In Clara cells of control animals, RER was restricted to a few cisternae on the basal-lateral side of the nucleus (Figure 8A) ▶ . In none of the Clara cells evaluated was there any sign of injury or other cytopathology. In Clara cells of animals exposed to NA for a shorter time (4 to 14 days), there was a wide range of ultrastructural features varying between that of the 21-day exposed and carrier-treated controls. This mixture was found within the Clara cell population of the lining the individual bronchiole. All of the treated animals exhibited this range to varying degrees. In animals exposed for 7 days, some of the Clara cells had SER more tightly packed and more abundant than was observed in control animals and also had evidence of the large mitochondria with few cristae. A small population was not discernibly different from that which lined the bronchioles of 21-day exposed animals and another which was essentially indistinguishable from Clara cells from control animals. In 21-day exposed mice most of the Clara cell profiles (73%) were larger in size and had broader apical projections (compare Figure 8, A and C ▶ ). None of the Clara cells evaluated in control animals exhibited profile sizes within the range found in tolerant animals. At the apical surface of Clara cells in 21-day exposed mice (Figure 8F) ▶ , SER was packed closer to the plasmalemma and reduced the subplasmalemma zone of organelle-free cytoplasm compared to Clara cells in controls (Figure 8E) ▶ .
Figure 8.
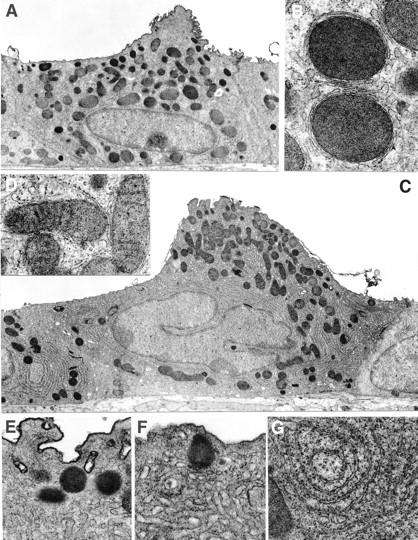
Comparison of Clara cell ultrastructure in carrier-treated mice (A, B, E) with Clara cells of mice treated with NA (200 mg/kg) for 21 days (C, D, F, G). In Clara cells of tolerant mice, the overall size increased (A, C) and there was an increase in SER, RER (E–G), and small mitochondria with cristae (D) with a reduction in large mitochondria without cristae (B). Scale bars: A, 1 μm; B, 0.25 μm; C, 1 μm; D, 0.25 μm; E, 0.25 μm; F, 0.25 μm; G, 0.25 μm.
Discussion
The purpose of this study was to determine whether the development of tolerance to bioactivated cytotoxicants, such as naphthalene, was related to fundamental changes in the phenotype of the target cell population. Our results indicate that the development of tolerance to NA occurs in Clara cells through specific adaptations to favor maintenance of GSH pools and occurs without broad cellular phenotypic shifts because: 1) tolerance to NA at several different time points (4 to 21 days) was in fact dependent on GSH synthesis; 2) GSH dependence was coordinated with induced γ-GCS protein, the rate limiting step of glutathione synthesis; 3) differences in expression of proteins considered markers of differentiated Clara cells were not discernable between tolerant or control mice after 21 days of repeated exposures; and 4) Clara cells of tolerant mice retained three-dimensional conformation and mixtures of organelles similar to control mice, but appear to have increased cell size and increased content of organelles.
Previous studies have indicated that the development of tolerance to NA results from shifts in the balance between NA bioactivation 4,18 and detoxification. 16 In this study we found even longer exposure regimens result in a subtle alterations that favor increased detoxification of naphthalene in the resistant or tolerant cells of target airways. Our studies indicate that mice receiving up to 14 and 21 repeated injections, have CYP2f2 expression that is no different from control, while γ-glutamyl cysteine synthetase remains induced during continued exposure. These data indicate that increases in γ-GCS expression plays a critical role in the maintenance of NA tolerance even as the exposure duration continues over a period of weeks.
Our previous studies demonstrated that the development of NA tolerance was critically dependent on the thiol status. 16 In those studies we determined that repeated exposures of NA result in Clara cell populations that had elevated the steady state GSH level to become tolerant to further injury. We also found in tolerant animals the maximal activity of γ-GCS, the rate limiting step of GSH biosynthesis, had increased significantly above control. Further, when we inhibited the activity of this enzyme, using BSO, in tolerant mice, the induced resistance was eliminated and Clara cells again became susceptible to injury. 16 While important in addressing the actual mechanism of NA tolerance, the previous studies did not determine whether the GSH dependence of NA tolerance was merely a result of temporal shifts in the repair process. In the current study, the fact that we were able to eliminate tolerance with BSO at 4, 7, 14, or 21 days indicates that tolerance is dependent on maintenance of the thiol status from at least day 4 and continues for long-term exposure periods. Further, using an antibody for γ-GCS we found protein expression of this enzyme, which catalyzes the rate-limiting step of glutathione synthesis is induced early and remains elevated in tolerance. Overall, the present studies indicate the ability to induce and maintain an elevated GSH pool to protect Clara cells from NA cytotoxicity was critical in mice that had become tolerant, whether they had received as few as 4 or as many as 21 repeated injections of naphthalene.
Of particular interest, was the variable pattern of injury that occurred when tolerant mice from different time points (4, 7, 14, and 21 days) were administered BSO and NA in combination. When mice receiving 4 daily repeated NA injections were challenged with the combination of BSO and NA, not all cells were injured. This was also the case for tolerant mice receiving 7 repeated NA injections. Mice receiving up to 14 and 21 injections appeared to have a more uniform response to the combined challenge with BSO and NA. These differences are highlighted by shifts in the cellular content of cytochrome CYP2f2. Mice receiving 4 repeated daily injections had localized expression of CYP2f2, which appeared to be expressed in a group of four or five cells on a section. The changes were mirrored by expression of CC10, as well as the formation of morphologically distinct clusters of Clara cells as seen by SEM. After receiving 7 repeated exposures, these clusters of cells appeared to be more abundant in the distal airways as did the expression of CC10 and CYP2f2. This was also coordinated with a more consistent injury pattern. After 2 and 3 weeks of repeated NA exposures, Clara cells appeared morphologically similar to control both surface structure and expression of CC10 and CYP2f2. The injury pattern in these tolerant mice from combined treatment with BSO and NA appeared similar in severity and extent to control mice. These results taken together indicate that, as the bronchiolar epithelium returns to a normal phenotypic state, the balance between phase I (cyp2f2) and phase II (GSH conjugation) metabolism appears to be shifted to favor detoxification of NA during prolonged exposure. Moreover, this data combined with our previous studies 16 indicate that the induced expression of γ-glutamyl cysteine synthetase plays an increasing role in the defense of cellular cytotoxicity from bioactivated cytotoxicants as the exposure protocol extends from days to weeks.
Shifts in the thiol status have been seen in other models of tolerance. Similar to NA tolerance in mice, rats exposed to ozone for prolonged periods have increased levels of reduced GSH. 27 However, in contrast to NA tolerance, the development of tolerance to ozone includes phenotypic shifts in cells of the centriacinar region, 28 including elevation of CC10, a cytoprotective protein considered a marker of differentiated Clara cells. 29 This elevation of CC10 is in part due to the bronchiolarization of the alvealor ducts, where Clara cells appear to replace type II cells in the centriacinar region. The present study of NA tolerance, indicates that broad phenotypic shifts do not appear to play a role in NA-induced Clara cell tolerance. Using both SEM and TEM we found that cell size and organelle distribution had shifted in tolerant Clara cells. However, in contrast to ozone tolerance, Clara cells appeared to maintain overall structural and differentiation characteristics associated with Clara cells from carrier-treated animals, including normal expression of CC10 of mice receiving 14 and 21 days of repeated NA exposures.
Our hypothesis was that the development of tolerance to bioactivated cytotoxicants was based on a specific set of phenotypic changes. Using phenotypic markers of differentiation in Clara cells, we found that cell phenotype, instead of altering to a less metabolically active state, appeared to regain characteristics of the controls. Based on the relatively long clearance time for inhaled bioactivated carcinogenic compounds 30 it seems reasonable to suggest that during repeated exposures to lipophilic volatile compounds, such as naphthalene, the return of P450 metabolism would favor the clearance of these compounds from the respiratory tract. Because phase I metabolism of these compounds, like naphthalene, is often the obligate step in the formation of the toxic intermediate, the system has evolved in two parts, bioactivation and detoxification. The second step, detoxification, in this case uses a ubiquitous tripeptide, GSH, to alleviate the toxicity of these often inhaled compounds while allowing for them to be removed from the body.
Because inhalation is the major route of exposure for NA in humans the next issues to be addressed by our studies will be whether Clara cells become tolerant by inhalation exposures and whether the mechanism for tolerance for repeated systemic exposures is shared by tolerance to repeat inhalation exposures. Additionally, while we saw no broad shifts in the phenotype of Clara cell in our long-term studies, the importance of other cytoprotective mechanisms such as heat shock proteins cannot be excluded. Combining techniques such tissue microdissection with cDNA microarray to identify changes in expression of genes will lead to more focused studies of the mechanisms of resistance to bioactivated xenobiotics. Of paramount importance is the link between the development of tolerance and the formation of tumors. While electrophilic intermediates of naphthalene do not appear to form DNA adducts (unpublished data), recent studies indicate that the compound is carcinogenic in mice and rats. 7,8 It is possible that the development of tolerance, while conferring the ability of the cellular microenvironment to avoid acute injury, predisposes these cells to neoplastic transformation. The continuation of long-term studies and the characterization of changes in gene expression identified by microarray and applied to such techniques as in situ hybridization, with immunohistochemistry using reliable reagents, to identify changes in single cells will be required to identify the mechanism of tumor formation.
Footnotes
Address reprint requests to Dr. Jay A. A. West, Microfluidics Department, Sandia National Laboratories, P.O. Box 969 MS 9951, Livermore, CA 94551-0969. E-mail: jawest@sandia.gov.
Supported by National Institute of Health grants ES04311, ES06700, ES04699, ES05511 and NHLBI WL07013. The University of California at Davis is a NIEHS Center for Environmental Health Sciences (ES05707) and support for core facilities used in this work is gratefully acknowledged.
References
- 1.Mahvi D, Bank H, Harley R: Morphology of a naphthalene-induced bronchiolar lesion. Am J Pathol 1977, 86:558-572 [PMC free article] [PubMed] [Google Scholar]
- 2.Forkert PG, Reynolds ES: 1,1-Dichloroethylene-induced pulmonary injury. Exp Lung Res 1982, 3:57-68 [DOI] [PubMed] [Google Scholar]
- 3.Plopper CG, Macklin J, Nishio SJ, Hyde DM, Buckpitt AR: Relationship of cytochrome P450 activity to Clara cell cytoxicity: III. morphometric comparisons of changes in the epithelial populations of the terminal bronchioles and lobar bronchi in mice, hamsters, and rats after parenteral adminisration of naphthalene. Lab Invest 1992, 67:553-565 [PubMed] [Google Scholar]
- 4.O’Brien K, Suverkropp C, Kanekal S, Plopper CG, Buckpitt AR: Tolerance to multiple doses of the pulmonary toxicant, naphthalene. Toxicol Appl Pharmacol 1989, 99:487-500 [DOI] [PubMed] [Google Scholar]
- 5.Stanley JS: Broad Scan Analysis of the FY82 National Adipose Tissue Survey Specimens: Volume 1-Executive Summary. 1986. DC, U.S. Environmental Protection Agency, Office of Toxic Substances, Washington
- 6.Pellizzari ED, Hartwell TD, Harris BSd, Waddell RD, Whitaker DA, Erickson MD: Purgeable organic compounds in mother’s milk. Bulletin of Environmental Contamination and Toxicology 1982, 28:322–328 [DOI] [PubMed]
- 7.Abdo KM, Eustis SL, MacDonald M, Jokinen MP, Adkins JB, Haseman JK: Napthalene: a respiratory tract toxicant and carcinogen for mice. Inhal Toxicol 1992, 4:393-409 [Google Scholar]
- 8.National Toxicology Program: Toxicology and Carcinogenesis Studies of Naphthalene (No. 91–20-3) in F344/N Rats. Washington, DC, U.S. Department of Health and Human Services. National Institutes of Health, Public Health Service, 2000
- 9.Meister A, Anderson M: Glutathione. Annu Rev Biochem 1983, 52:711-760 [DOI] [PubMed] [Google Scholar]
- 10.Reed DJ: Glutathione: toxicological implications. Annu Rev Pharmacol Toxicol 1990, 30:603-631 [DOI] [PubMed] [Google Scholar]
- 11.Buckpitt AR, Castagnoli N, Jr, Nelson SD, Jones AD, Bahnson LS: Stereoselectivity of naphthalene epoxidation by mouse, rat, and hamster pulmonary, hepatic, and renal microsomal enzymes. Drug Metab Dispos 1987, 15:491-498 [PubMed] [Google Scholar]
- 12.Warren DL, Brown JR, Buckpitt AR: Evidence for cytochrome P450 mediated metabolism in the bronchiolar damage by naphthalene. Chem Biol Interact 1982, 40:287-303 [DOI] [PubMed] [Google Scholar]
- 13.West JAA, Chichester CH, Buckpitt AR, Tyler NK, Brennan P, Helton C, Plopper CG: Heterogeneity of Clara cell glutathione: a possible basis for differences in response to pulmonary cytotoxicants. Am J Respir Cell Mol Biol 2000, 23:27-36 [DOI] [PubMed] [Google Scholar]
- 14.Jenkinson SG, Lawrence RA, Zamora CA, Deneke SM: Induction of intracellular glutathione in alveolar type II pneumocytes following BCNU exposure. Am J Physiol 1994, 266:L125-L130 [DOI] [PubMed] [Google Scholar]
- 15.Liu RM, Hu H, Robison TW, Forman HJ: Increased gamma-glutamylcysteine synthetase and gamma-glutamyl transpeptidase activities enhance resistance of rat lung epithelial L2 cells to quinone toxicity. Am J Respir Cell Mol Biol 1996, 14:192-197 [DOI] [PubMed] [Google Scholar]
- 16.West JAA, Buckpitt AR, Plopper CG: Elevated airway glutathione (GSH) resynthesis confers protection to Clara cells from naphthalene (NA) injury in mice made tolerant by repeated exposures. J Pharmacol Exp Ther 2000, 294:516-523 [PubMed] [Google Scholar]
- 17.Van Winkle LS, Buckpitt AR, Nishio SJ, Isaac JM, Plopper CG: Cellular response in naphthalene-induced Clara cell injury and bronchiolar epithelial repair in mice. Am J Physiol 1995, 269:L800-L818 [DOI] [PubMed] [Google Scholar]
- 18.Lakritz J, Chang A, Weir A, Nishio S, Hyde D, Philpot R, Buckpitt A, Plopper C: Cellular and metabolic basis of Clara cell tolerance to mutiple doses cytochrome P450-activated cytotoxicants. I: bronchiolar epithelial reorganization and expression of cytochrome P450 monooxygenases in mice exposed to multiple doses of naphthalene. J Pharmacol Exp Ther 1996, 278:1408-1418 [PubMed] [Google Scholar]
- 19.Griffith OW, Meister A: Glutathione: interorgan translocation, turnover, and metabolism. Proc Natl Acad Sci USA 1979, 76:5606-5610 [DOI] [PMC free article] [PubMed] [Google Scholar]
- 20.Plopper CG: Structural methods for studying bronchiolar epithelial cells. Gil J eds. Model of Lung Disease, Microscopy and Structural Methods. 1990, :pp 537-559 Marcel Dekker, New York [Google Scholar]
- 21.Nagata K, Martin BM, Gillette JR, Sasame HA: Isozymes of cytochrome P-450 that metabolize naphthalene in liver and lung of untreated mice. Drug Metab Dispos 1990, 18:557-564 [PubMed] [Google Scholar]
- 22.Singh G, Katyal SL: An immunologic study of the secretory products of rat Clara cells. J Histochem Cytochem 1984, 32:49-54 [DOI] [PubMed] [Google Scholar]
- 23.Plopper CG, Dungworth DL: Structure, function, cell: injury and cell renewal of bronciholar and aveolar epithilium. McDowwell EM eds. Lung Carcinomas. 1987, :pp 94-128 Churchill Livingstone, London [Google Scholar]
- 24.Shi MM, Kugelman A, Iwamoto T, Tian L, Forman HJ: Quinone-induced oxidative stress elevates glutathione and induces gamma-glutamylcysteine synthetase activity in rat lung epithelial L2 cells. J Biol Chem 1994, 269:26512-26517 [PubMed] [Google Scholar]
- 25.Plopper CG, Chang AM, Pang A, Buckpitt AR: Use of microdissected airways to define metabolism and cytotoxicity in murine bronchiolar epithelium. Exp Lung Res 1991, 17:197-212 [DOI] [PubMed] [Google Scholar]
- 26.Bradford MM: A rapid and sensitive method for the quantitation of microgram quantities of protein utilizing the principle of protein-dye binding. Anal Biochem 1976, 72:248-254 [DOI] [PubMed] [Google Scholar]
- 27.Duan X, Buckpitt AR, Pinkerton KE, Ji C, Plopper CG: Ozone-induced alterations in glutathione in lung subcompartments of rats and monkeys. Am J Respir Cell Mol Biol 1996, 14:70-75 [DOI] [PubMed] [Google Scholar]
- 28.Eustis SL, Schwartz LW, Kosch PC, Dungworth DL: Chronic bronchiolitis in non-human primates, after prolonged ozone exposure. Am J Pathol 1981, 105:121-137 [PMC free article] [PubMed] [Google Scholar]
- 29.Dodge DE, Rucker RB, Pinkerton KE, Haselton CJ, Plopper CG: Dose dependent tolerance to ozone: III. elevation of intracellular Clara cell 10-kDa protein in central acini of rats exposed for 20 months. Toxicol Appl Pharmacol 1994, 127:109-123 [DOI] [PubMed] [Google Scholar]
- 30.Gerde P, Muggenburg BA, Henderson RF: Disposition of polycyclic aromatic hydrocarbons in the respiratory tract of the beagle dog: III. mechanisms of the dosimetry. Toxicol Appl Pharmacol 1993, 121:328-334 [DOI] [PubMed] [Google Scholar]