

Abstract
Decorin, a small dermatan-sulfate proteoglycan, participates in extracellular matrix assembly and influences directly and indirectly cell behavior via interactions with signaling membrane receptors and transforming growth factor (TGF)-β. We have therefore compared the development of tubulointerstitial kidney fibrosis in wild-type (WT) and decorin−/− mice in the model of unilateral ureteral obstruction. Without obstruction, kidneys from decorin−/− mice did not differ in any aspect from their WT counterparts. However, already 12 hours after obstruction decorin−/− animals showed lower levels of p27KIP1 and soon thereafter a more pronounced up-regulation and activation of initiator and effector caspases followed by enhanced apoptosis of tubular epithelial cells. Later, a higher increase of TGF-β1 became apparent. After 7 days, there was an up to 15-fold transient up-regulation of the related proteoglycan biglycan, which was mainly caused by the appearance of biglycan-expressing mononuclear cells. Other small proteoglycans showed no similar response. Because of enhanced degradation of type I collagen, end-stage kidneys from decorin−/− animals were more atrophic than WT kidneys. These data suggest that decorin exerts beneficial effects on tubulointerstitial fibrosis, primarily by influencing the expression of a key cyclin-dependent kinase inhibitor and by limiting the degree of apoptosis, mononuclear cell infiltration, tubular atrophy, and expression of TGF-β1.
Glomerulosclerosis and tubulointerstitial fibrosis are common pathological features of most end-stage kidneys irrespective of the underlying etiology. 1,2 The importance of tubulointerstitial fibrosis is underscored by the striking correlation between the morphological severity of matrix deposition and the progression of renal insufficiency culminating in eventual organ failure. 3 Infiltration of blood mononuclear cells, proliferation of interstitial mesenchymal cells, and apoptosis of tubular epithelial cells are considered to be important processes influencing renal inflammation and fibrosis. 1-3 Among the many profibrotic factors transforming growth factor (TGF)-β1 plays a pivotal role in the development of the disease. 4
In light of this complexity, the experimental model of unilateral ureteral obstruction (UUO) has been widely used to study the pathogenesis of tubulointerstitial fibrosis 5,6 because the evolution of fibrosis after ureteral obstruction is highly reproducible and reflects the sequence of pathogenetic events in an accelerated manner. As in human interstitial fibrosis there is rapid infiltration by mononuclear cells that finally leads to hypocellular fibrotic scarring and tubular atrophy without primary glomerular damage. 7 Although important insights into the mechanisms of interstitial fibrosis have been obtained in these investigations, long-term studies are scarce, and some aspects of tissue remodeling have not yet been addressed at all. In this investigation we were interested in the sequence of pathogenetic events and in the mechanisms leading to fibrosis in the absence of the small leucine-rich proteoglycan (SLRP) 8,9 decorin in obstructive nephropathy for the following reasons. First, decorin, and other SLRPs (eg, biglycan and fibromodulin) have been shown to form complexes with TGF-β 10 leading to inhibition and/or sequestration of the cytokine within the extracellular matrix. 11-14 Second, decorin, biglycan, and fibromodulin as well as a fourth member of this family, lumican, interact with fibrillar collagens, 15-17 thereby modulating fibril formation and stability. Ablation of each of the four SLRP genes results in grossly disturbed type I collagen-containing fibrils 18-21 indicating the need for an orchestrated action of all four proteoglycans during fibril assembly. The presence of all four SLRPs in the kidney has been reported previously. 22 Third, biglycan has been shown to stimulate growth and differentiation of monocytic lineage cells from various lymphatic organs 23,24 and may, hence, support acute inflammation in obstructive nephropathy. Fourth, decorin expression enables endothelial cells to escape apoptosis. 25,26 Furthermore, decorin expression is followed by an up-regulation of cyclin-dependent kinase inhibitors, 27 probably via interaction with an epidermal growth factor-receptor family member, 28 and is therefore also involved in cell cycle control. Here we show that the course of obstructive nephropathy becomes greatly altered in mice with an inactivated decorin gene because of a decrease in p27KIP1 expression, caspase induction, and tissue remodeling affecting primarily tubular epithelia. Differences between normal and decorin−/− mice in the extent of apoptosis, in TGF-β levels, and the number of biglycan-expressing macrophages appear as major determinants for this type of end-stage kidney disease.
Materials and Methods
Animals
All animal work was done in accordance with the German Animal Protection Law. Decorin-deficient mice were generated as described previously. 18 The kidneys studied were from wild-type (WT) (n = 43), decorin−/− (Dcn−/−) (n = 78), and decorin+/− (Dcn+/−) (n = 4) mice of the same inbred strain background. 18 Obstruction of the left ureter was performed in 2-month-old male mice. The contralateral and sham-operated kidney served as control. Kidneys (at least n = 4 per group) were analyzed up to 70 days after ligation.
Northern Blot Analysis and in Situ Hybridization
Total RNA was extracted from whole kidneys as described. 29 The cDNA probes for decorin and biglycan were those used previously in the rat. 29 cDNA probes for rat fibromodulin and lumican, which are also homologous to the respective murine sequences, were generated by reverse transcriptase-polymerase chain reaction (PCR) from total rat tail RNA with Super Script II reverse transcriptase (Life Technologies, Eggenstein, Germany) and random hexanucleotide cDNA primers. Double-stranded cDNAs were generated by using primers that contained additionally appropriate sequences with restriction sites for SmaI and HindIII, respectively. For fibromodulin the primer pair was 5′-TCCCCCGGGGATGCAGTGGGCCTCCATC-3′, and 5′-GCTCCAGATCTCGATGAGGCT-3′, thus yielding a rat fibromodulin cDNA encompassing bp 54 to 1184 (GenBank X82152). For lumican, the respective primer pair was 5′-TCCCCCGGGGATGAATGTATGTACGTTCAC-3′ and 5′-CCCAAGCTTTAATTAACCGTGATTTCA-3′ yielding lumican cDNA between bp 46 to 1062 (GenBank X84039). Endonuclease-treated PCR products were cloned into pGEM 3Z (Promega, Madison, WI) and verified by DNA sequencing. Mouse caspase-3 and caspase-8 were generated with the primer pairs 5′-TGTCATCTCGCTCTGGTACG-3′, 5′-AGCATGGACACAATACACGG-3′ (245 to 869 bp, GenBank NM009810) and 5′-CCGAGAGGAGATGGTGAGAG-3′, 5′-TCGGTAGGAAACGCAGTTCT-3′ (292 to 1291 bp, GenBank AJ007749), respectively, and cloned into pCRII (Invitrogen, Groningen, The Netherlands). cDNAs for α1(I) collagen, TGF-β1, and GAPDH were from ATCC (Rockville, MD). Northern blots were performed and analyzed as described previously. 13 In situ hybridization of renal sections from WT and Dcn−/− mice was performed with the sense and antisense probes in parallel and under the same conditions. 13
Real-Time Semiquantitative PCR
cDNA synthesis from total RNA extracted from whole kidneys and amplification were performed as described previously 13 using the primers for the sequences of p21CIP1/WAF1: 5′-CTGCCCAAGCTCTACCTTCC-3′ and 5′-CAGGTCCACATGGTCTTCCT-3′ (123 bp); p27KIP1: 5′-CCGGCTAACTCTGAGGACAC-3′ and 5′-AGAAGAATCGTCGGTTGCAG-3′ (120 bp); GAPDH: 5′-GTCAGTGGTGGACCTGACCT-3′ and 5′-ACCTGGTGCTCAGTGTGCC-3′ (123 bp). Melting curves and agarose gel electrophoresis were used to verify the quality of the PCR products. The data obtained were referred to standard curves where plasmids with authentic cDNAs were analyzed analogously. Finally, the values were normalized to the results of GAPDH-reverse transcriptase-PCR. Statistical analysis was performed with Prism, version 3 (GraphPad Software, San Diego, CA).
Morphological and Immunohistochemical Studies
Serial sections (2 to 6 μm) of paraffin-embedded samples were stained with periodic acid-Schiff reaction (PAS) and processed for immunohistochemical studies or in situ hybridization.
Morphometric evaluation of tubulointerstitial damage (defined as the occurrence of dilated or collapsed tubules with flattened and vacuolated epithelia), glomerular volumes, interstitial fibrosis, and infiltration of mononuclear cells was performed by a computer-aided image analysis system. 30
Paraffin sections were stained by immunoperoxidase or APAAP techniques. 29 Primary antibodies included LF-113 (a rabbit anti-murine decorin antiserum 31 kindly provided by Dr. L.W. Fisher, National Institute of Dental and Craniofacial Research, National Institutes of Health, Bethesda, MD), a chicken antibody against the Ser67 to Gln78 peptide of rat biglycan, 29 rabbit anti-rat type I collagen (Biogenesis, Berlin, Germany) and the marker for murine monocytes/macrophages: rat anti-mouse F4/80 (Serotec, Eching, Germany). After blocking endogenous peroxidase and incubation with respective antibodies, sections were developed with the Diaminobenzidine Substrate Kit (Vector Laboratories, Burlingame, CA). Antibodies against proliferating cell nuclear antigen were visualized with the EPOS-horseradish peroxidase-coupled system (DAKO, Hamburg, Germany). Counterstaining was with methyl green. Mouse anti-fibronectin extradomain A (FN-EDA+), clone OST-9 (kindly provided by Dr. L. Zardi, Genova, Italy), was conjugated with digoxigenin. The active form of caspase-3, the proform of caspase-8, and its active p20 subunit were visualized with digoxigenin-conjugated affinity-purified antibodies (R&D Systems, Wiesbaden, and Santa Cruz, Heidelberg, Germany, respectively) in paraffin and frozen sections. Early apoptosis was evaluated in frozen sections by a digoxigenin-conjugated monoclonal antibody to single-stranded DNA (F7-26: Alexis, Grünberg, Germany). Antibody-treated tissue sections were incubated with alkaline phosphatase-conjugated Fab fragments of anti-digoxigenin antibodies. 29 The specificity of immunostaining was tested by omitting the primary antibody, by using nonimmune serum/unspecific IgG, and by preabsorption of antisera with antigens (decorin, biglycan).
To evaluate individual kidneys, 20 randomly selected nonoverlapping fields of renal cortex were examined under higher magnification (×400) and the number of biglycan-positive cells, proliferating cell nuclear antigen-labeled nuclei, and apoptotic nuclei in tubular and interstitial cells were evaluated. Mean values of at least four kidneys per group were averaged. Morphometrical evaluation of FN-EDA+ was performed as described previously. 32 In brief, a grid containing 117 (13 × 9) sampling points was superimposed on images of cortical high-power fields (×400) and FN-EDA+ deposits were counted and expressed as percentage of all sampling points. All morphometric evaluations were performed by a blinded observer.
Confocal Microscopy
For the characterization of biglycan-positive cells double-labeling of 6-μm frozen sections was performed with antibodies against biglycan (1:500) and F4/80 (1:10) for identification of macrophages. Unspecific staining was blocked with phosphate-buffered saline/1% bovine serum albumin/20% goat serum. For visualization 1:200 dilutions of Texas Red-conjugated donkey anti-chicken IgG and fluorescein-conjugated goat anti-rat IgG (Dianova, Hamburg, Germany) were used. Laser scan microscopy was performed with a Nikon confocal microscope PCM 2000 (Nikon, Duesseldorf, Germany). Nonspecific staining was determined by the use of secondary antibodies alone.
Assay of Caspase-3 Activity
Caspase-3 activity was determined in homogenates of sham-operated, obstructed, and contralateral kidneys by the Caspase-3/CPP32 Colorimetric Assay Kit (BioCat, Heidelberg, Germany). In this assay, active caspase-3 cleaves the chromophore p-nitroanilide (pNA) from the labeled substrate DEVD-pNA. Enzyme activity was measured as described previously. 33 Briefly, whole kidneys were homogenized in 2 ml of cell lysis buffer at 4°C for 15 minutes. After centrifugation at 10,000 × g, proteins were measured in the supernatants (cytosolic extractions) and adjusted to a concentration of 200 μg/50 μl. After incubation with substrate for 2 hours at 37°C, the optical density was determined using a microplate reader at 405 nm. Data were calculated as the average of duplicates for each sample and per whole kidney. Mean values of three kidneys per group were averaged.
Other Procedures
Thin section electron microscopy was performed as described. 15 Serum urea and creatinine levels were measured using a Hitachi 747 autoanalyzer and urinary and tissue protein by the BCA Protein Assay Reagent (Pierce, Rockford, IL). Western blots were performed and quantified as described previously 13 using rabbit anti-p21CIP1/WAF1, anti-p27KIP1, and anti-β-tubulin as primary antibodies (all from Santa Cruz). Type I collagen was determined after exhaustive pepsin digestion of whole minced kidneys followed by 4 to 12.5% sodium dodecyl sulfate-polyacrylamide gel electrophoresis under reducing and nonreducing conditions and quantification (IQ Solutions Image Quant Software: Molecular Dynamics, Uppsala, Sweden) of Coomassie Blue-stained bands of α1(I)- and α2(I)-chains of collagen I. 34 A high- and low-molecular weight mixture of proteins (Life Technologies) and pepsin-digested purified type I, III, and IV collagens were used as standards. For Western blotting and type I collagen quantification the results from three kidneys per group were averaged.
Statistics
Results are expressed as means ± SEM. Statistical analysis was performed by the unpaired Student’s t-test. Significance was accepted at the 5% level.
Results
Different End-Stage Features of Kidneys after UUO in Dcn−/− and WT Mice
UUO was performed in WT and Dcn−/− animals, and the development of hydronephrosis was followed throughout a period of 70 days (Figure 1A) ▶ . No macroscopical differences in the development of hydronephrosis between WT and Dcn−/− mice were evident for up to 35 days after UUO. However, thereafter (42, 53, and 70 days) obstructed kidneys from Dcn−/− mice became progressively smaller in size and weight. After aspiration of fluid from the dilated pyelon the weight of Dcn−/− kidneys was 123 ± 11 mg versus 201 ± 17 mg in WT animals at day 53 (n = 4, P < 0.05) and 87 ± 9 mg versus 152 ± 14 mg at day 70 (n = 6, P < 0.05). These differences have to be interpreted in light of the finding that weights of normal kidneys were comparable in age- and sex-matched WT and Dcn−/− mice. No differences were observed in body weight or in the weight of contralateral kidneys between both groups at any time point.
Figure 1.
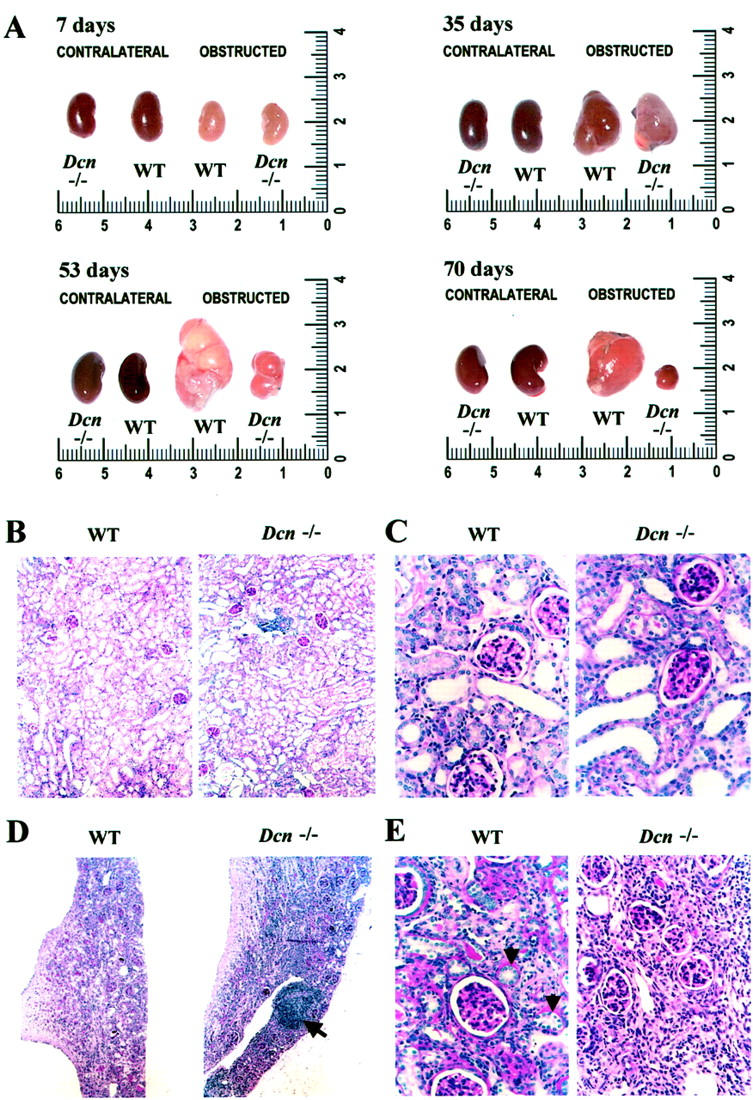
Appearance of kidneys from WT and Dcn−/− mice after UUO (7 to 70 days). A: After UUO both WT and Dcn−/− mice developed hydronephrosis (obstructed kidneys). There were no differences in the size of the obstructed and contralateral kidneys between WT and Dcn−/− mice up to 35 days. Genotype-specific differences became evident at days 53 and 70. The scale is given in cm. PAS-stained sections from obstructed kidneys at day 7 (B and C) demonstrated a higher percentage of dilated tubules in Dcn−/− than in WT mice. At day 53, the extent of infiltration by mononuclear cells in Dcn−/− was more pronounced (D, arrow). Tubules with segment-specific differentiation were no longer recognizable in obstructed kidneys from Dcn−/− mice whereas in WT animals such tubules could still be detected (E, arrowhead). Sections are only shown at time points where genotype-specific differences were especially pronounced. Original magnifications: ×100 (B and D); ×400 (C and E).
PAS-stained sections of nonligated kidneys from 43 WT and 78 Dcn−/− mice were similar in terms of renal morphology and matrix deposition. There were no genotype-specific differences in survival, serum urea and creatinine levels, or urinary protein excretion both in unaffected mice as well as in animals after UUO throughout the whole experimental period.
Histomorphological Changes in Obstructed Kidneys
Already at day 7 quantitative histomorphometry of PAS-stained sections (Figure 1, B and C) ▶ from obstructed kidneys revealed a significantly higher percentage (P < 0.05) of damaged tubules in Dcn−/− (58 ± 10%, n = 6) than in WT mice (20 ± 6%, n = 4). During the subsequent course of the disorder this difference increased further, and at day 53 tubules with segment-specific differentiation were no longer recognizable in decorin-deficient mice whereas in obstructed kidneys from WT animals such tubules could still be occasionally detected (Figure 1, D and E) ▶ . Another striking difference in end-stage fibrosis concerned the extent of infiltration by mononuclear cells. At day 53 an area covering 34 ± 3% of the tissue sections was occupied by infiltrating mononuclear cells, frequently in the form of lymphoid follicles, in Dcn−/− animals (Figure 1, D and E) ▶ whereas the corresponding value in WT animals was 2.3 ± 0.4% (n = 4 for each group, P < 0.05). Similar data were obtained from kidneys on day 70. The majority of these cells were positive for monocyte/macrophage markers. At days 53 and 70, the volumes of glomeruli in obstructed kidneys from WT were 1.8-fold to 2.9-fold higher as compared to Dcn−/− animals. Early tubular damage and enhanced infiltration of macrophages were the two most prominent histomorphological differences observed in obstructed kidneys from Dcn−/− as compared to WT mice. In contrast, semiquantitative evaluation of interstitial fibrosis showed no difference in the extent of fibrosis in obstructed kidneys from WT and Dcn−/− animals. In addition, there were no differences in PAS-stained sections from contralateral and sham-operated kidneys in either genotype.
Enhanced Early Tubular Apoptosis in Obstructed Kidneys from Dcn−/− Mice
The earliest detectable difference between WT and Dcn−/− kidneys concerned the expression of p27KIP1. Overexpression of p27KIP1 in obstructed kidneys from WT both on the mRNA (Figure 2A) ▶ and protein level (Figure 2, C and D) ▶ was detected at 12 hours, whereas in Dcn−/− kidneys p27KIP1 started to increase at 36 hours after UUO. Lower levels of p27KIP1 were detected in obstructed Dcn−/− than in WT kidneys until day 4. In later stages of UUO levels of p27KIP1 did not differ between WT and Dcn−/− kidneys. In agreement with earlier reports, 6 p21CIP1/WAF1 mRNA (Figure 2B) ▶ was up-regulated in obstructed kidneys starting at 36 hours. However, no genotype-specific differences were observed (Figure 2 ▶ ; B, C, and E) at any experimental time point (12 hours to 70 days). Because a lack of p27KIP1 has been shown to enhance tubular epithelial cell apoptosis in UUO 35 and because decorin exhibits an anti-apoptotic effect in vitro, 25 we wondered, whether the extensive tubular damage in Dcn−/− mice described above might have been the consequence of an earlier and/or more pronounced induction of apoptotic pathways in these animals. Hence, we quantified the mRNAs for caspase-8 and caspase-3, performed immunostainings for the active forms of these enzymes, measured caspase-3 activity, and stained single-stranded DNA.
Figure 2.

Expression of cyclin-dependent kinase inhibitors p27KIP1 and p21CIP1/WAF1 in obstructed (O), contralateral (C), and sham-operated kidneys from Dcn−/− and WT mice. The relative changes of mRNA expression of p27KIP1 (A) and p21CIP1/WAF1 (B) obtained by real-time PCR and of the respective proteins (D, p27; E, p21) obtained by Western blots of three sample pairs from obstructed and contralateral kidneys from Dcn−/− and age-matched WT mice after normalization to GAPDH or β-tubulin are given as means ± SEM. C: Example of a Western blot of p27 and p21 in obstructed and contralateral kidneys from Dcn−/− and age-matched WT mice. Open bars represent WT mice and filled bars represent Dcn−/− mice. Significant differences for UUO versus sham-operated animals are indicated by an asterisk positioned directly over the respective bar. The asterisk between open and filled bars indicates statistical differences between WT and Dcn−/− animals, P < 0.05.
Overexpression of caspase-8 was detected by Northern blot analysis already 12 hours after UUO in the kidneys of both WT and Dcn−/− animals. At 36 hours after UUO, however, a greater degree of overexpression of caspase-8 was observed in Dcn−/− mice. Maximal induction of caspase-8 expression was found at day 4, resulting in a 1.9-fold increase in WT animals and a 2.9-fold increase in Dcn−/− mice (Figure 3A) ▶ . Besides the overexpression of caspase-8, there was also an up-regulation of caspase-3. After 36 hours, enhanced mRNA levels for caspase-3 were observed only in obstructed kidneys from Dcn−/− mice (Figure 3B) ▶ . At day 4, induction of caspase-3 mRNA was observed also in obstructed kidneys from WT animals. However, the expression of caspase-3 was 1.4-fold higher in Dcn−/− mice. The active form of caspase-3 as well as the proform of caspase-8 and its active subunit were found at days 4 and 7 mainly in tubular epithelial cells (Figure 3, C and D) ▶ . Both caspases were not detectable by immunohistochemistry in contralateral kidneys. In agreement with earlier reports, 33 a quantitative assay for caspase-3 activity in homogenates of whole kidneys showed increased activity of this enzyme in obstructed kidneys between days 4 and 35 after ligation (Table 1) ▶ . However, similar to the mRNA results for caspase-3, the caspase-3 activity was higher in obstructed kidneys from Dcn−/− versus WT mice only at days 4 and 7 (Table 1) ▶ . From day 14 onward, no genotype-specific differences were observed in the expression of caspase-3 and caspase-8 mRNAs and in the caspase-3 activity.
Figure 3.
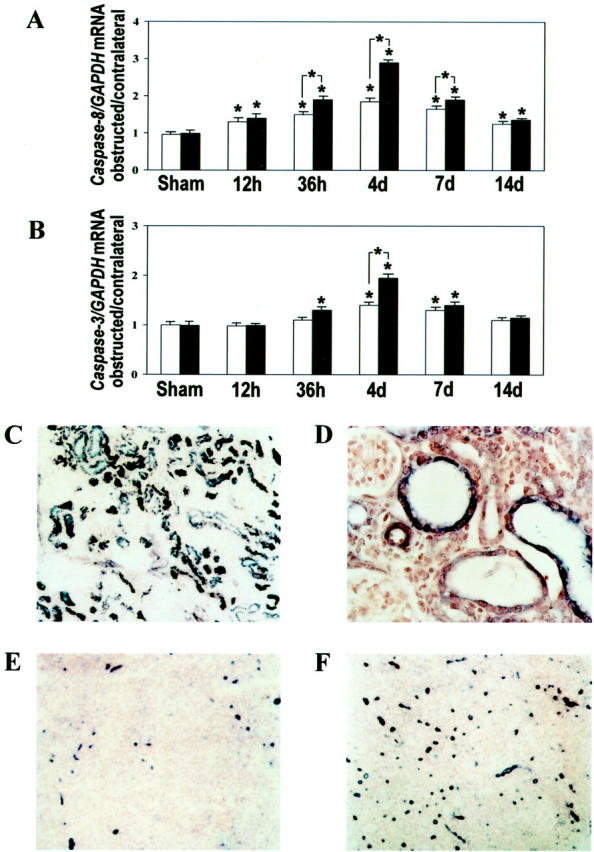
Enhanced early tubular apoptosis in obstructed kidneys from Dcn−/− mice. The relative changes of the expression of caspase-8 (A) and caspase-3 (B) mRNAs in Northern blots of the four sample pairs from obstructed and contralateral kidneys from Dcn−/− and age-matched WT mice after normalization to GAPDH are given as mean ± SEM. Open bars represent WT mice and filled bars Dcn−/− mice. Significance is indicated as described in the legend of Figure 2 ▶ . Precursor and active forms of caspase-8 (C; original magnification, ×200) and active form of caspase-3 (D; original magnification, ×400) were found as dark violet staining of tubular epithelial cells of obstructed kidneys from WT and Dcn−/− (shown here as an example) mice. The degree of apoptosis (single-stranded DNA) was higher in obstructed kidneys from Dcn−/− (F) than from WT (E) mice at day 7 after UUO (original magnifications, ×100).
Table 1.
Quantification of Caspase-3 Activity and Apoptotic Tubular Epithelial and Interstitial Cells in Obstructed Kidneys from WT and Dcn−/− Mice
| Caspase-3 activity (OD/obstructed kidney) | Apoptotic tubular cells (obstructed kidney/hpf) | Apoptotic interstitial cells (obstructed kidney/hpf) | ||||
|---|---|---|---|---|---|---|
| WT | Dcn−/− | WT | Dcn−/− | WT | Dcn−/− | |
| Sham-operated | 1.2 ± 0.2 | 1.1 ± 0.1 | 0.10 ± 0.02 | 0.10 ± 0.02 | 0.10 ± 0.02 | 0.10 ± 0.02 |
| 0.5 days | 1.2 ± 0.3 | 1.3 ± 0.4 | 0.10 ± 0.03 | 0.10 ± 0.02 | 0.10 ± 0.02 | 0.10 ± 0.02 |
| 1.5 days | 1.5 ± 0.4 | 1.7 ± 0.4 | 0.30 ± 0.05* | 0.41 ± 0.07* | 0.23 ± 0.03* | 0.21 ± 0.04* |
| 4 days | 5.2 ± 0.5* | 7.7 ± 0.6*† | 1.5 ± 0.3* | 3.8 ± 0.4*† | 1.2 ± 0.3* | 1.3 ± 0.2* |
| 7 days | 8.5 ± 0.7* | 12.9 ± 1.1*† | 2.3 ± 0.3* | 7.1 ± 0.6*† | 1.8 ± 0.3* | 1.9 ± 0.3* |
| 14 days | 7.8 ± 0.7* | 9.1 ± 0.8* | 3.9 ± 0.4* | 5.3 ± 0.4*† | 5.2 ± 0.4* | 4.9 ± 0.4* |
| 21 days | 6.5 ± 0.6* | 6.6 ± 0.6* | 3.0 ± 0.3* | 3.3 ± 0.3* | 5.6 ± 0.5* | 5.8 ± 0.6* |
| 35 days | 6.9 ± 0.6* | 6.7 ± 0.6* | 2.5 ± 0.2* | 2.4 ± 0.3* | 5.9 ± 0.6* | 5.4 ± 0.6* |
Caspase-3 activity was measured as optical density (OD) at 405 nm. Data were calculated as the average of duplicates for each sample and per whole kidney. Mean values of three kidneys per group were averaged.
Values of apoptosis are given as mean cell number (±SEM) per high-power field (hpf, ×400). Twenty randomly selected nonoverlapping fields of cortex from each kidney (n = 4 animals per group) were evaluated.
*, P < 0.05 for UUO versus sham-operated mice.
†, P < 0.05 for Dcn−/− versus WT animals.
The degree of apoptosis shown by staining of single-stranded DNA was enhanced between days 4 and 14 after ligation in obstructed kidneys from Dcn−/− mice as compared to WT animals (Figure 3, E and F ▶ ; Table 1 ▶ ). Enhanced apoptosis in Dcn−/− mice was exclusively observed in tubular epithelial cells. In contrast, the degree of apoptosis in interstitial cells was not different in obstructed kidneys from WT and Dcn−/− mice throughout the whole experimental period (Table 1) ▶ . The rather moderate increases of caspase-3 mRNA and activity in Dcn−/− compared to WT animals were probably because of the fact that both parameters were measured in homogenates of whole kidneys. In contrast, the differences in the degree of apoptosis were limited to tubular epithelial cells and quantified there in situ.
In obstructed kidneys from Dcn−/− animals there was not only an augmentation in induced cell death but also a moderate increase in cell proliferation. This was particularly evident between days 4 and 14, when the number of proliferating cell nuclear antigen-positive cells, which were mostly of epithelial origin, was 1.2-fold to 1.9-fold higher.
Increased TGF-β1 Expression in Decorin-Deficient Kidneys
Based on the finding that decorin forms complexes with TGF-β and thereby modulates the activity of this cytokine, we investigated the expression of TGF-β1 during the course of UUO. Although UUO led to increased TGF-β1 mRNA expression in both WT and Dcn−/− kidneys, this up-regulation was up to twofold higher in decorin-deficient tissue (Figure 4A) ▶ .
Figure 4.

Expression of TGF-β1 mRNA in obstructed, contralateral, and sham-operated kidneys from Dcn−/− and WT mice between 12 hours and 70 days after UUO (A and B) and immunolocalization of FN-EDA+ in obstructed kidneys from Dcn−/− and WT mice (C). A: The relative changes of Northern blots for TGF-β1 expression from Dcn−/− and age-matched WT mice (four pairs) are given as ratio of TGF-β1 mRNA in obstructed kidneys to the contralateral kidneys, normalized to GAPDH. Data are given as mean ± SEM. The open bars represent WT mice and filled bars Dcn−/− mice. Significance is indicated as described in the legend of Figure 2 ▶ . B: In situ hybridization of TGF-β1 in sham-operated and obstructed kidneys from Dcn−/− mice (7 to 70 days after UUO). TGF-β1 was preferentially expressed at day 7 (original magnification, ×400) in tubular epithelial cells from obstructed kidneys whereas in later stages (21 and 70 days; original magnification, ×1000) the cytokine was expressed predominantly by infiltrating and peritubular interstitial cells. In sham-operated kidneys TGF-β1 mRNA was expressed occasionally in peritubular mesenchymal cells. Renal sections from Dcn−/− animals are shown here as an example. C: Immunolocalization of FN-EDA+ in obstructed kidneys from WT and Dcn−/− 21 days after UUO (original magnification, ×400). FN-EDA+ (blue staining) was present predominantly in the peritubular space and in atrophic tubuli.
In situ hybridization revealed preferential expression of TGF-β1 in tubular epithelial cells from affected kidneys during early phases of obstruction whereas at later time points the cytokine was expressed predominantly by infiltrating and peritubular interstitial cells (Figure 4B) ▶ . The localization of TGF-β1 mRNA did not differ in obstructed kidneys from WT and Dcn−/− mice, but the number of TGF-β1-positive cells was higher in ligated kidneys from Dcn−/− mice. In sham-operated kidneys TGF-β1 mRNA was expressed only sporadically in some peritubular mesenchymal cells without genotype-specific differences.
Staining for fibronectin extradomain A (FN-EDA+), an indicator of active TGF-β, became evident at day 7 in obstructed kidneys from Dcn−/− mice, whereas in WT animals FN-EDA+ positivity was first detectable at day 14. FN-EDA+ was immunolocalized predominantly in the peritubular space and in atrophic tubuli (Figure 4C) ▶ . When quantified morphometrically, the staining was significantly more enhanced in obstructed kidneys from Dcn−/− mice (day 21: Dcn−/−: 22 ± 3%, n = 6 versus WT: 13 ± 2%, n = 8; day 70: Dcn−/−: 27 ± 3%, n = 6 versus WT: 19 ± 2%, n = 8, P < 0.05).
Expression and Immunolocalization of SLRPs
In mice with ablated individual SLRP genes the possibility of a partial compensation by related SLRP members has been described. 18-20 We compared, therefore, the expression of decorin, biglycan, lumican, and fibromodulin in whole kidneys before and after ligation.
Renal RNA from WT animals contained a decorin transcript of 1.8 kb. The expected second decorin transcript of 1.6 kb was detectable only in heavily overloaded gels. In Dcn+/− mice the normalized decorin mRNA levels were reduced by only 40%, and they were absent in Dcn−/− mice. In obstructed kidneys from WT animals enhanced expression of decorin became evident 36 hours after ligation, and decorin mRNA remained up-regulated throughout the experiment. Overexpression of decorin was especially pronounced at earlier stages with a more than sevenfold up-regulation of decorin mRNA between days 4 and 7 (Figure 5, A and D) ▶ . Differences between sham-operated and contralateral kidneys were not observed.
Figure 5.

Expression of decorin (Dcn), biglycan (Bgn), and fibromodulin (Fmod) mRNAs in obstructed (O), contralateral (C), and sham-operated kidneys from Dcn−/− and WT mice between 12 hours and 70 days after UUO. Northern blots for decorin (A), biglycan (B), and fibromodulin (C) of one of the four sample pairs from obstructed and contralateral kidneys from Dcn−/− and age-matched WT mice are only shown at time points in which alterations of mRNA levels were especially pronounced. The relative changes of all four pairs are given as the ratio of decorin (D), biglycan (E), and fibromodulin (F) mRNA in obstructed kidneys to the contralateral kidneys after normalization to GAPDH. Data are given as mean ± SEM from four animals at each time point. Open bars represent WT and filled bars Dcn−/− mice. Significance is indicated as described in the legend of Figure 2 ▶ .
Overexpression of biglycan was detected by Northern blot analysis 36 hours after UUO in obstructed kidneys from both WT and Dcn−/− animals. In WT animals maximal induction resulting in a fivefold increase of biglycan expression was observed at day 7 (Figure 5, B and E) ▶ . However, in Dcn−/− mice this up-regulation was much more pronounced, resulting in a 15-fold increase at day 7. The greater degree of overexpression of biglycan in Dcn−/− mice persisted throughout the whole experimental period (Figure 5E) ▶ . Differences between sham-operated and contralateral kidneys or age-dependent changes were not observed.
Other SLRPs were not up-regulated similarly during the course of UUO. The expression of fibromodulin remained unchanged for 21 days (Figure 5, C and F) ▶ . Thereafter, a slight overexpression (up to twofold) was found by Northern blot analysis in the obstructed kidneys from both WT and Dcn−/− mice. Genotype-specific differences did not become evident. The renal expression of lumican was very weak and remained unchanged in obstructed kidneys from WT and Dcn−/− mice throughout the experiment.
In situ hybridization and immunohistochemical stainings indicated that in unaffected kidneys decorin mRNA and core protein were detectable predominantly in the adventitia of blood vessels. Beginning at day 7 after UUO, decorin mRNA could be found in peritubular mesenchymal cells where it remained visible until the end of the experimental period. Immunostainings for decorin also showed an accumulation of decorin protein in the peritubular space (Figure 6) ▶ .
Figure 6.
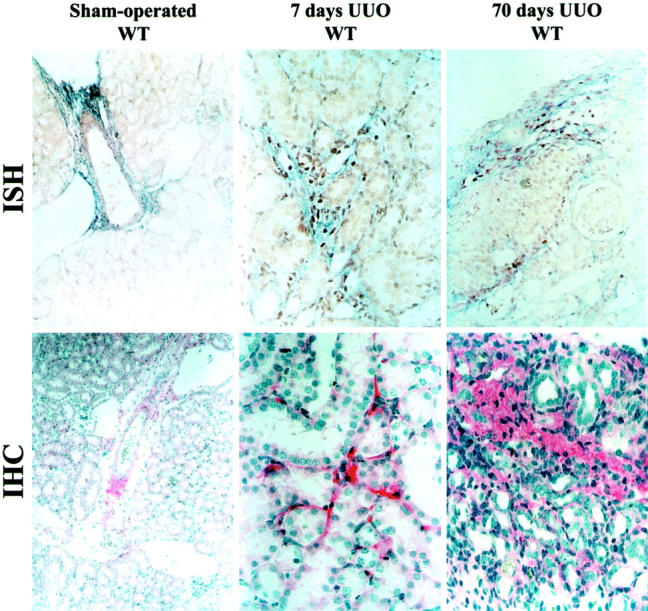
In situ hybridization (ISH) and immunolocalization (IHC) of DCN in sham-operated and obstructed kidneys from WT mice (7 and 70 days after UUO). In sham-operated kidneys DCN mRNA and protein were detectable only in the adventitia of blood vessels (ISH, IHC; original magnifications, ×100). Beginning at day 7 after UUO, DCN mRNA was detectable in peritubular mesenchymal cells and remained clearly visible until day 70 (ISH; original magnification, ×400). IHC stainings (original magnification, ×400) were in agreement with the ISH data and showed an accumulation of DCN in the peritubular space.
In situ hybridization for biglycan in control kidneys revealed expression in the media of blood vessels and in some glomerular endothelial and mesangial cells (Figure 7A) ▶ . Genotype-specific differences were not evident. At day 4 after ureteral ligation, the expression of biglycan was detected in some epithelial cells of dilated tubules. At day 7, however, tubular epithelial expression of biglycan became already weaker, whereas infiltrating and interstitial cells strongly expressed biglycan. At later stages, the expression of biglycan in obstructed kidneys was almost exclusively because of infiltrating and interstitial cells. A similar switch in the cellular source of biglycan was observed at the protein level. Initially, staining for biglycan protein was detected only in some tubular epithelial cells (day 4), whereas at day 7 infiltrating and interstitial cells became positive (Figure 7A) ▶ . At day 70, the majority of infiltrating and interstitial cells stained for biglycan (Figure 7A) ▶ . The localization of biglycan mRNA and protein did not differ in the obstructed kidneys from WT and Dcn−/− mice, but the number of biglycan-positive cells was higher in ligated kidneys from Dcn−/− mice.
Figure 7.
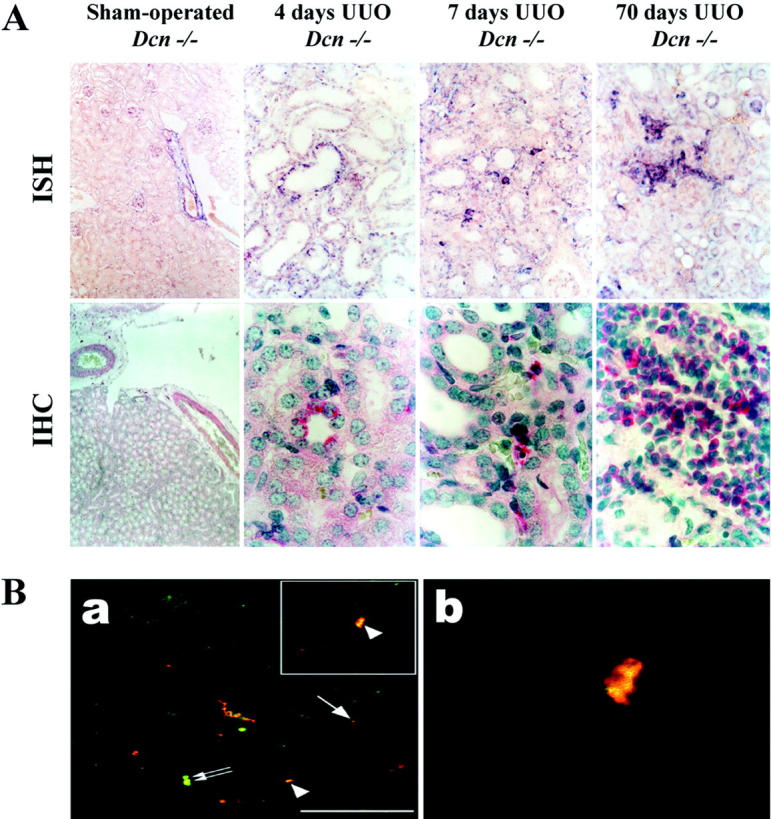
A: In situ hybridization (ISH) and immunolocalization (IHC) of biglycan in sham-operated and obstructed kidneys from Dcn−/− mice (4 to 70 days after UUO). B: Identification of biglycan-positive macrophages in obstructed kidneys by double-immunofluorescence staining and confocal microscopy. A: Biglycan was expressed in sham-operated kidneys mainly in the media of blood vessels (ISH; original magnification, ×100). At day 4 after UUO, the expression of biglycan was detected in some epithelial cells of dilated tubules. At day 7, tubular epithelial expression of biglycan became already weaker, whereas infiltrating and interstitial cells strongly expressed biglycan (ISH, days 4–70; original magnification, ×400). A similar staining pattern for biglycan core protein was observed by IHC (sham: original magnification, ×100; days 4–70: original magnification, ×1000; APAAP). Renal sections from Dcn−/− animals are shown here as an example. B: Biglycan staining in kidney sections of Dcn−/− mice 21 days after UUO is shown in red (arrow) and staining with the marker F4/80 for macrophages (a) is shown in green (small double arrows). Co-localization (yellow staining, arrowhead) (a and b) was obtained in a subset of macrophages. A higher magnification of a selected area of a is shown in b. Scale bar, 50 μm.
These cells were quantified in 10 nonoverlapping fields from each kidney. The number of biglycan-positive infiltrating and interstitial cells (tubular cells were excluded) was enhanced in obstructed kidneys from Dcn−/− mice from day 14 throughout the experiment (day 14: Dcn−/−: 25 ± 3, n = 4 versus WT: 15 ± 2, n = 4; day 70: Dcn−/−: 84 ± 7, n = 6 versus WT: 50 ± 5, n = 8; P < 0.05).
The nature of the biglycan-positive infiltrating cells was evaluated by double-immunofluorescence staining for biglycan and F4/80 (a marker of murine macrophages). Confocal microscopy indicated that a subset of macrophages expressed both the F4/80 antigen and biglycan (Figure 7B) ▶ .
Discrepancy Between Increased mRNA Expression of α1(I) Collagen and Collagen Accumulation in Decorin-Deficient Kidneys
In light of the enhanced TGF-β1 activity and the differences in the long-term development of kidney fibrosis some aspects of type I collagen metabolism were studied. An overexpression of α1(I) collagen was noted in obstructed kidneys from both WT and Dcn−/− animals beginning at day 4 after ligation. In WT and Dcn−/− animals maximal induction of α1(I) collagen, resulting in a 12-fold and 21-fold increase, respectively, was observed at day 7 (Table 2) ▶ . In agreement with these data deposition of type I collagen, assessed by quantification of extractable collagens by sodium dodecyl sulfate-polyacrylamide gel electrophoresis and densitometry (sum of α1(I)- and α2(I)-chains), was higher (180%) at day 7 in obstructed kidneys from Dcn−/− mice (Figure 8 ▶ and Table 2 ▶ ). However, although α1(I) collagen mRNA approached similar levels in WT and Dcn−/− kidneys after prolonged periods of time, the content of type I collagen became remarkably reduced in decorin-deficient organs, achieving only 20% of the quantity present in WT organs at day 70 (Figure 8 ▶ and Table 2 ▶ ). Immunostaining for type I collagen confirmed these differences in renal accumulation of collagen between WT and Dcn−/− animals (data not shown). As described for the dermis 18 collagen fibrils in obstructed kidneys of Dcn−/− mice had irregular-shaped cross-sections on electron microscopic examination.
Table 2.
Quantification of mRNA Expression of α1(I) Collagen and of the Content of Type I Collagen Protein in Obstructed Kidneys
| α1(I) collagen/GAPDH obstructed/contralateral | Type I collagen protein μg/obstructed kidney | |||
|---|---|---|---|---|
| WT | Dcn−/− | WT | Dcn−/− | |
| Sham-operated | 1.0 ± 0.1 | 1.0 ± 0.1 | 0.7 ± 0.1 | 0.6 ± 0.1 |
| 7 days | 12 ± 2* | 21 ± 2*† | 21 ± 2* | 38 ± 3*† |
| 21 days | 6.2 ± 0.4* | 6.6 ± 0.5* | 143 ± 11* | 95 ± 6*† |
| 70 days | 1.8 ± 0.2* | 1.7 ± 0.2* | 110 ± 10* | 22 ± 3*† |
α1(I) collagen and GAPDH mRNAs were evaluated by Northern blot analysis using an automated detector system. Data are expressed as ratio of α1(I) collagen mRNA in obstructed to the contralateral kidneys after normalisation to GAPDH.
Content of type I collagen was determined after pepsin digestion of whole minced kidneys by quantification of Coomassie Blue-stained α(I) collagen bands.
*, P < 0.05 for UUO versus sham-operated mice.
†, P < 0.05 for Dcn−/− versus WT animals.
Data are given as means ± SEM from three animals at each time point.
Figure 8.

Coomassie Blue-stained bands of α1-, α2-, and β-chains of type I collagen from obstructed (O) and contralateral (C) kidneys of WT and Dcn−/− mice 7, 21, and 70 days after UUO in sodium dodecyl sulfate-polyacrylamide gels (4 to 12.5%) under reducing conditions of pepsin-digested whole minced kidneys as well as pepsin-digested purified types I, III, and IV collagen standards. The figure shows one of three sample pairs from obstructed and contralateral kidneys from Dcn−/− and age-matched WT mice at days 7, 21, and 70 after UUO. Arrows indicate Coomassie Blue-stained bands of α1(I)-, α2(I)-, and β(I)-chains of type I collagen. At day 70, the content of type I collagen was remarkably reduced in decorin-deficient organs, yielding only 20% of the quantity present in WT kidneys.
Discussion
The results of this study show that the development and the final outcome of tubulointerstitial damage in fibrotic kidney disease is greatly influenced by decorin expression and that decorin plays a protective role via TGF-β-dependent and TGF-β-independent mechanisms. We derived this conclusion from a nonimmune-mediated animal model of renal fibrosis. In agreement with earlier reports WT mice responded to UUO with cellular infiltration, increased proliferation combined with increased apoptosis, and up-regulation of TGF-β1 5,6 and of the SLRPs decorin, 36 biglycan and fibromodulin. Hydronephrosis with tubular atrophy and considerable mononuclear cell infiltration were typical end-stage features. Kidneys from Dcn−/− mice, however, exhibited a greater degree of tubular damage because of enhanced apoptosis, became more heavily infiltrated by macrophages, and showed a considerably greater loss of tissue weight during the long-term course of the disease. At the molecular level these differences are caused by several mechanisms. The following considerations seem to be of special importance.
First, the earliest detectable difference between WT and Dcn−/− kidneys was a lower expression of p27KIP1 followed by a more rapid and extensive activation of both the initiator caspase-8 and effector caspase-3 and the induction of programmed cell death in the absence of decorin. Virus-mediated decorin induction has previously been shown to be sufficient for allowing endothelial cells to escape apoptosis. 25 In vivo differences in the extent of apoptosis that could be related to the availability of decorin have not been reported before. Signaling via decorin is a novel area of research and may differ between various cell types. They may involve binding to members of the epidermal growth factor receptor family, 28 and up-regulation of p21CIP1/WAF1 27 and p27KIP1. 37,38 p27KIP1 strongly represses tubular epithelial cell apoptosis and proliferation after ureteral obstruction, 34 whereas p21CIP1/WAF1 limits interstitial cell proliferation in this model. 39 Our findings suggest that anti-apoptotic and anti-proliferative effects of decorin are primarily focused on tubular epithelial cells and seem to be mediated by activation of p27 whereas p21 seems not to be involved. It is interesting to note that, at least in endothelial cells, decorin-mediated up-regulation of p21CIP1/WAF1 and p27KIP1 occurs by different signaling pathways, 38 which may explain that in UUO the expression of only one of the two cyclin-dependent phosphatase inhibitors is specifically altered in Dcn−/− mice.
The second explanation is based on the capability of decorin to form complexes with TGF-β1 10 and on its ability to down-regulate the cytokine’s activity in the kidney. 40 Until now, this mechanism was the only one taken into account for explaining the effects of decorin on renal fibrosis. Increased TGF-β levels in Dcn−/− kidneys readily account for the up-regulation of biglycan and collagen α1(I) mRNAs. However, biglycan also forms high-affinity complexes with TGF-β, 10 and one wonders why it may not exhibit a beneficial effect in fibrotic diseases. 41 It might be speculated that either the role of decorin in diminishing the degree of apoptosis is of greater importance than complex formation with TGF-β in preventing tissue fibrosis, or that TGF-β/biglycan complexes are still able to activate the signaling receptors of the cytokine.
Third, biglycan, like decorin, may also be a signaling molecule. It has been suggested that it acts as a growth factor in certain cell types, eg, for microglial/monocytic cells. 23,24 This possibility may be relevant for interpreting the difference between WT and Dcn−/− animals with respect to the larger number of biglycan-expressing macrophages in decorin-deficient obstructed kidneys. If biglycan exhibits growth factor activity for these infiltrating cells, a self-perpetuating cycle could be envisaged in which the overexpression of biglycan leads to growth stimulation of immature macrophages with induced biglycan synthesis and production of an inflammation-supporting cytokine pattern.
A fourth possible explanation for the different courses of UUO in WT and Dcn−/− animals is based on the observation that Dcn-deficient kidneys become more atrophic and contain considerably lower quantities of type I collagen despite an initially higher collagen expression, both on the mRNA and on the protein level. Greater quantities of extracellular matrix would be expected as a consequence of TGF-β overproduction. 5 It is tempting to speculate that the presence or absence of decorin may have influenced the turnover of collagen fibrils. Decorin decorates collagen in a regular manner along the c1-band of the collagen fibril D period. 42 It is conceivable that the proteoglycan thereby protects fibrils from collagen-degrading enzymes. The absence of decorin would then result in a greater susceptibility of fibrils toward proteolytic degradation. Another possible explanation for the lower type I collagen content in the absence of decorin might be that the activity of collagen-degrading enzymes was increased for example because of secretion of the respective metalloproteinases by a higher number of infiltrating macrophages.
In summary, the present study provides evidence that targeted disruption of the decorin gene exerts profound effects on the course and final outcome of ureteral kidney obstruction. These differences could be explained by specific effects of decorin on apoptosis via p27KIP1 signaling, TGF-β activity, and collagen turnover.
Acknowledgments
We thank Dr. J. Berger for the morphometric evaluation of PAS-stained kidney sections, and Thomas Terrahe and Wilhelm Kramer for their professional support with the photographical work.
Footnotes
Address reprint requests to Dr. Liliana Schaefer, Med. Klinik und Poliklinik D, Albert-Schweitzer-Str. 33, 48149 Muenster, Germany. E-mail: schaefl@uni-muenster.de.
Supported by a Lise-Meitner stipend (to L. S.); the Interdisciplinary Center for Clinical Research (IZKF-Project D18); the Medical Faculty, University of Muenster; the Deutsche Forschungsgemeinschaft (SFB 492, project A6; SFB 293, project A7, and SFB 405, project B10); and the National Institutes of Health (grant RO1 CA-39481).
References
- 1.Eddy AA: Molecular insights into renal interstitial fibrosis. J Am Soc Nephrol 1996, 7:2495-2508 [DOI] [PubMed] [Google Scholar]
- 2.Norman JT, Fine LG: Progressive renal disease: fibroblasts, extracellular matrix, and integrins. Exp Nephrol 1999, 7:167-177 [DOI] [PubMed] [Google Scholar]
- 3.Müller GA, Zeisberg M, Strutz F: The importance of tubulointerstitial damage in progressive renal disease. Nephrol Dial Transplant Suppl 2000, 6:S76-S77 [DOI] [PubMed] [Google Scholar]
- 4.Border WA, Noble NA: Targeting TGF-β for treatment of disease. Nat Med 1995, 1:1000-1001 [DOI] [PubMed] [Google Scholar]
- 5.Diamond JR, Ricardo SR, Klahr S: Mechanisms of interstitial fibrosis in obstructive nephropathy. Semin Nephrol 1998, 18:594-602 [PubMed] [Google Scholar]
- 6.Klahr S, Morrissey JJ: The role of growth factors, cytokines, and vasoactive compounds in obstructive nephropathy. Semin Nephrol 1998, 18:622-632 [PubMed] [Google Scholar]
- 7.Diamond JR: Macrophages and progressive renal disease in experimental hydronephrosis. Am J Kidney Dis 1995, 26:133-140 [DOI] [PubMed] [Google Scholar]
- 8.Iozzo RV: Matrix proteoglycans: from molecular design to cellular function. Annu Rev Biochem 1998, 67:609-652 [DOI] [PubMed] [Google Scholar]
- 9.Iozzo RV: The biology of the small leucine-rich proteoglycans. Functional network of interactive proteins. 1884, :3-18846 274: J Biol Chem 1999 [DOI] [PubMed] [Google Scholar]
- 10.Hildebrand A, Romaris M, Rasmussen LM, Heinegård D, Twardzik DR, Border WA, Ruoslahti E: Interaction of the small interstitial proteoglycans biglycan, decorin and fibromodulin with transforming growth factor-β. Biochem J 1994, 302:527-534 [DOI] [PMC free article] [PubMed] [Google Scholar]
- 11.Border WA, Noble NA, Yamamoto T, Harper JR, Yamaguchi Y, Pierschbacher MD, Ruoslahti E: Natural inhibitor of transforming growth factor-β protects against scarring in experimental kidney disease. Nature 1992, 360:361-364 [DOI] [PubMed] [Google Scholar]
- 12.Markmann A, Hausser H, Schönherr E, Kresse H: Influence of decorin on transforming growth factor-β-mediated collagen retraction and biglycan induction. Matrix Biol 2000, 19:631-636 [DOI] [PubMed] [Google Scholar]
- 13.Schaefer L, Raslik I, Gröne HJ, Schönherr E, Macakova K, Ugorcakova J, Budny S, Schaefer RM, Kresse H: Small proteoglycans in human diabetic nephropathy: discrepancy between glomerular expression and protein accumulation of decorin, biglycan, lumican and fibromodulin. FASEB J 2001, 15:559-561 [DOI] [PubMed] [Google Scholar]
- 14.Massague J, Chen YG: Controlling TGF-beta signaling. Genes Dev 2000, 14:627-644 [PubMed] [Google Scholar]
- 15.Schönherr E, Witsch-Prehm P, Harrach B, Robenek H, Rauterberg J, Kresse H: Interaction of biglycan with type I collagen. J Biol Chem 1995, 270:2776-2783 [DOI] [PubMed] [Google Scholar]
- 16.Scott JE, Haigh M: Identification of specific binding sites for keratan sulphate proteoglycans and chondroitin-dermatan sulphate proteoglycans on collagen fibrils in cornea by the use of cupromeronic blue in ‘critical-electrolyte-concentration’ techniques. Biochem J 1998, 253:607-610 [DOI] [PMC free article] [PubMed] [Google Scholar]
- 17.Hedbom E, Heinegård D: Binding of fibromodulin and decorin to separate sites on fibrillar collagens. J Biol Chem 1993, 268:27307-27312 [PubMed] [Google Scholar]
- 18.Danielson KG, Baribault H, Holmes DF, Graham H, Kadler KE, Iozzo RV: Targeted disruption of decorin leads to abnormal collagen fibril morphology and skin fragility. J Cell Biol 1997, 136:729-743 [DOI] [PMC free article] [PubMed] [Google Scholar]
- 19.Chakravarti S, Magnuson T, Lass JH, Jepsen KJ, LaMantia C, Carroll H: Lumican regulates collagen fibril assembly: skin fragility and corneal opacity in the absence of lumican. J Cell Biol 1998, 141:1277-1286 [DOI] [PMC free article] [PubMed] [Google Scholar]
- 20.Svensson L, Aszodi A, Reinholt FP, Fässler R, Heinegård D, Oldberg Å: Fibromodulin-null mice have abnormal collagen fibrils, tissue organization, and altered lumican deposition in tendon. J Biol Chem 1999, 274:9636–9647 [DOI] [PubMed]
- 21.Corsi A, Bianco P, Fisher LW, Chen X-D, Xu T, Iozzo RV, Danielson KG, Gehron Robey P, Young MF: Biglycan and decorin deficiency interferes with collagen assembly and structure and results in diverse Ehlers-Danlos-like phenotypes. J Bone Miner Res1999, 14:134A
- 22.Schaefer L, Gröne H-J, Raslik I, Robenek H, Ugorcakova J, Budny S, Schaefer RM, Kresse H: Small proteoglycans of normal adult human kidney: distinct expression pattern of decorin, biglycan, fibromodulin and lumican. Kidney Int 2000, 58:1557-1568 [DOI] [PubMed] [Google Scholar]
- 23.Kamo I, Kikuchi A, Nonaka I, Yamada E, Kondo J: Haemopoietic activity associated with biglycan like proteoglycan. Biochem Biophys Res Commun 1993, 195:1119-1126 [DOI] [PubMed] [Google Scholar]
- 24.Kikuchi A, Tomoyasu H, Kido I, Takahashi K, Tanaka A, Nonaka I, Iwakami N, Kamo I: Haemopoietic biglycan produced by brain cells stimulates growth of microglial cells. J Neuroimmunol 2000, 106:78-86 [DOI] [PubMed] [Google Scholar]
- 25.Schönherr E, O’Connell BC, Schittny J, Robenek H, Fastermann D, Fisher LW, Plenz G, Vischer P, Young MF, Kresse H: Paracrine or virus-mediated induction of decorin expression by endothelial cells contributes to tube formation and prevention of apoptosis in collagen lattices. Eur J Cell Biol 1999, 78:44-45 [DOI] [PubMed] [Google Scholar]
- 26.Schönherr E, Schaefer L, O’Connell BC, Kresse H: Matrix metalloproteinase expression by endothelial cells in collagen lattices changes during co-culture with fibroblasts and upon induction of decorin expression. J Cell Physiol 2001, 187:37-47 [DOI] [PubMed] [Google Scholar]
- 27.DeLuca A, Santra M, Baldi A, Giordano A, Iozzo RV: Decorin-induced growth suppression is associated with up-regulation of p21Cip1/Waf1, an inhibitor of cyclin-dependent kinases. J Biol Chem 1996, 271:18961-18965 [DOI] [PubMed] [Google Scholar]
- 28.Moscatello DK, Santra M, Mann DM, McQuillan DJ, Wong AJ, Iozzo RV: Decorin suppresses tumor cell growth by activating the epidermal growth factor receptor. J Clin Invest 1998, 101:406-412 [DOI] [PMC free article] [PubMed] [Google Scholar]
- 29.Schaefer L, Hausser H, Altenburger M, Ugorcakova J, August C, Fisher LW, Schaefer RM, Kresse H: Decorin, biglycan and their endocytosis receptor in rat renal cortex. Kidney Int 1998, 54:1529-1541 [DOI] [PubMed] [Google Scholar]
- 30.Scheuer H, Gwinner W, Hohbach J, Gröne EF, Brandes RP, Malle E, Olbricht CJ, Walli AK, Gröne HJ: Oxidant stress in hyperlipidemia-induced renal damage. Am J Physiol 2000, 278:F63-F74 [DOI] [PubMed] [Google Scholar]
- 31.Fisher LW, Stubbs JT, Young MF: Antisera and cDNA probes to human and certain animal model bone matrix noncollagenous proteins. Acta Orthop Scand 1995, 266:S61-S65 [PubMed] [Google Scholar]
- 32.Kaneto H, Morrissey J, McCracken R, Reyes A, Klahr S: Enalapril reduces collagen type IV synthesis and expansion of the interstitium in the obstructed rat kidney. Kidney Int 1994, 45:1637-1647 [DOI] [PubMed] [Google Scholar]
- 33.Truong LD, Choi YJ, Tsao CC, Ayala G, Sheikh-Hamad D, Nassar G, Suki WN: Renal cell apoptosis in chronic obstructive uropathy: the roles of caspases. Kidney Int 2001, 60:924-934 [DOI] [PubMed] [Google Scholar]
- 34.Bruckner P, Hörler I, Mendler M, Houze Y, Winterhalter KH, Eich-Bender SG, Spycher MA: Induction and prevention of chondrocyte hypertrophy in culture. J Cell Biol 1989, 109:2537-2545 [DOI] [PMC free article] [PubMed] [Google Scholar]
- 35.Ophascharoensuk V, Fero ML, Hughes J, Roberts JM, Shankland SJ: The cyclin-dependent kinase inhibitor p27Kip1 safeguards against inflammatory injury. Nat Med 1998, 4:575-580 [DOI] [PubMed] [Google Scholar]
- 36.Diamond JR, Levinson M, Kreisberg R, Ricardo SD: Increased expression of decorin in experimental hydronephrosis. Kidney Int 1997, 51:1133-1139 [DOI] [PubMed] [Google Scholar]
- 37.Fischer JW, Kinsella MG, Levkau B, Clowes AW, Wight TN: Retroviral overexpression of decorin differentially affects the response of arterial smooth muscle cells to growth factors. Arterioscler Thromb Vasc Biol 2001, 21:777-784 [DOI] [PubMed] [Google Scholar]
- 38.Schönherr E, Levkau B, Schaefer L, Kresse H, Walsh K: Decorin-mediated signal transduction in endothelial cells: involvement of Akt/protein kinase B in up-regulation of p21WAF1/CIP1 but not p27KIP1. J Biol Chem 2001, 44:40687-40692 [DOI] [PubMed] [Google Scholar]
- 39.Hughes J, Brown P, Shankland SJ: Cyclin kinase inhibitor p21CIP1/WAF1 limits interstitial cell proliferation following ureteric obstruction. Am J Physiol 1999, 277:F948-F956 [DOI] [PubMed] [Google Scholar]
- 40.Isaka Y, Brees DK, Ikegaya K, Kaneda Y, Imai E, Noble NA, Border WA: Gene therapy by skeletal muscle expression of decorin prevents fibrotic disease in rat kidney. Nat Med 1996, 2:418-423 [DOI] [PubMed] [Google Scholar]
- 41.Kolb M, Margetts PJ, Sime PJ, Gauldie J: Proteoglycans decorin and biglycan differentially modulate TGF-β-mediated fibrotic responses in the lung. Am J Physiol 2001, 280:L1327-L1334 [DOI] [PubMed] [Google Scholar]
- 42.Keene DR, San Antonio JD, Mayne R, McQuillan DJ, Sarris G, Santoro SA, Iozzo RV: Decorin binds near the C-terminus of type I collagen. J Biol Chem 2000, 275:21801-21804 [DOI] [PubMed] [Google Scholar]