

Abstract
Presently, there is no effective treatment for glioblastoma, the most malignant and common brain tumor. Growth factors are potential targets for therapeutic strategies because they are essential for tumor growth and progression. Peptidylglycine α-amidating monooxygenase is the enzyme producing α-amidated bioactive peptides from their inactive glycine-extended precursors. The high expression of peptidylglycine α-amidating monooxygenase mRNA in glioblastoma and glioma cell lines points to the involvement of α-amidated peptides in tumorigenic growth processes in the brain. After screening of amidated peptides, it was found that human glioblastoma cell lines express high levels of adrenomedullin (AM) mRNA, and that immunoreactive AM is released into the culture medium. AM is a multifunctional regulatory peptide with mitogenic and angiogenic capabilities among others. Real-time quantitative reverse transcriptase-polymerase chain reaction analysis showed that AM mRNA was correlated to the tumor type and grade, with high expression in all glioblastomas analyzed, whereas a low expression was found in anaplastic astrocytomas and barely detectable levels in low-grade astrocytomas and oligodendrogliomas. In the present study we also demonstrate the presence of mRNA encoding the putative AM receptors, calcitonin receptor-like receptor/receptor activity-modifying protein-2 and -3 (CRLR/RAMP2; CRLR/RAMP3) in both glioma tissues and glioblastoma cell lines and further show that exogenously added AM can stimulate the growth of these glioblastoma cells in vitro. These findings suggest that AM may function as an autocrine growth factor for glioblastoma cells. One way to test the autocrine hypothesis is to interrupt the function of the endogenously produced AM. Herein, we demonstrate that a polyclonal antibody specific to AM, blocks the binding of the hormone to its cellular receptors and decreases by 33% (P < 0.001) the growth of U87 glioblastoma cells in vitro. Intratumoral administration of the anti-AM antibody resulted in a 70% (P < 0.001) reduction in subcutaneous U87 xenograft weight 21 days after treatment. Furthermore, the density of vessels was decreased in the antibody-treated tumors. These findings support that AM may function as a potent autocrine/paracrine growth factor for human glioblastomas and demonstrate that inhibition of the action of AM (produced by tumor cells) may suppress tumor growth in vivo.
Malignant glioblastomas are highly aggressive tumors with a median patient survival time of 9 to 14 months. 1 They are characterized by rapidly dividing cells, invasion into normal brain, and a high degree of vascularity. The histological grade of malignant gliomas, based on vascular proliferation, endothelial cell hyperplasia, and microvessel count, has been shown to be inversely related to prognosis. 2 Growth factors regulate cell proliferation and differentiation and are directly involved in neoplastic transformation. 3 A critical feature of many peptides (hormones, growth factors, neuropeptides) that enables them to mediate intracellular communication, is a carboxyl-terminal α-amide group. 4,5 A single enzyme complex peptidylglycine α-amidating monooxygenase (PAM; EC1.14.17.3) is responsible for the α-amidation of these peptides and hormones. 5 PAM activity has been found in a number of endocrine tumors (secreting α-amidated peptides), such as medullary thyroid carcinoma, pheochromocytoma, 6 pancreatic tumors (secreting vasoactive intestinal peptide), 7 and human pituitary tumors. 8,9 The finding that PAM immunoreactivity was also detected in several unexpected cell types, such as ependyma, choroid plexus, oligodendroglia, and Schwann cells 10 prompted us to investigate whether PAM expression could be detected in gliomas.
The presence of PAM in gliomas should suggest the active synthesis of α-amidated peptides functioning as growth factors and playing a role in the regulation of both cell proliferation and differentiation. To better define the role of PAM in human gliomas, we have sought α-amidated factors involved in tissue growth. A preliminary screening of amidated peptides present in these tumors and in derived cell lines have demonstrated that the messenger ribonucleic acid for preproadrenomedullin is by far the most predominant message encoding for two α-amidated peptides, namely proadrenomedullin N-terminal 20 peptide and adrenomedullin.
AM shows some homology with calcitonin gene-related peptide (CGRP), and has therefore been added to the calcitonin/CGRP/amylin peptide family. 11 Subsequent work revealed that AM is produced by a wide variety of tissues, most notably the adrenal medulla, lung, kidney, and heart atrium. 12 It has been shown to mediate a multifunctional response in cell culture and animal systems and these responses include growth regulation and induction of angiogenesis. 13-16 Further studies have demonstrated AM expression in a variety of human tumors of both pulmonary and neural lineage including small cell lung cancer, lung adenocarcinoma, bronchoalveolar carcinoma, squamous cell carcinoma of the lung and lung carcinoids, ganglioneuroblastoma, and neuroblastoma. 17,18 Several observations suggest that AM may be potentially involved in tumorigenesis. 13 A variety of transformed cell lines, including the glioblastoma cell lines T98G and A172 19,20 express the AM mRNA and secrete AM.
Three AM receptors with different affinities for AM [L1, RDC1, and calcitonin receptor-like receptor (CRLR)], have been cloned and sequenced. 21-23 All of them belong to the seven-transmembrane domain G protein-coupled receptor superfamily. Interestingly, CRLR requires the presence of modulating proteins with a single transmembrane domain known as receptor activity-modifying proteins (RAMPs). 24 RAMP1 presents CRLR at the plasma membrane as a terminally glycosylated, mature glycoprotein and a CGRP receptor, whereas RAMP2 and RAMP3 present CRLR as an immature, core glycosylated AM receptor. 24,25
Although the expression of AM has been demonstrated to be up-regulated in several tumors, 17-19 the exact biological effects of AM in tumorigenesis remain obscure. Proof of the role of AM in tumor growth requires the demonstration that inhibition of AM action influences tumor growth in vivo. The availability of specific polyclonal antibodies capable of blocking AM interaction with its cell surface receptors allowed us to test the hypothesis directly.
In the present study we demonstrate: 1) the presence of the appropriate posttranslational processing enzymes (PAM) in gliomas and glioma cell lines suggesting the capacity of these cells to synthesize α-amidated peptide(s); 2) the expression of AM1-52 amide, and AM-R in glioma cells implicating a possible autocrine growth mechanism; 3) that AM acts as a growth factor for glioma cells in vitro; and 4) that treatment with a polyclonal antibody specific for AM decreases the proliferation of the glioma cells in vitro, and inhibits the growth of a human glioma xenograft in vivo.
Materials and Methods
Cell Culture
Human glioblastoma cell lines were obtained from the American Type Culture Collection (Rockville, MD) and maintained in minimum essential medium (U373, U138, and U87) or in L15 medium (SW1783 and SW1088) containing penicillin (50 U/ml), streptomycin (50 μg/ml), glutamine (1 mg/ml), and supplemented with 10% fetal bovine serum. Cells were cultured under a moist 5% CO2/95% air atmosphere, and fed with fresh medium every 2 days, being routinely monitored for mycoplasma contamination (Roche Molecular Biochemicals, Meylan, France). Cells growing exponentially were harvested and prepared for RNA analysis and amidation activity measurement. All culture media components were purchased from Invitrogen Life Technologies (Paris, France).
Cell Proliferation Assay
The effects of AM1-52 amide, CGRP8-37 amide, AM22-52 amide, and rabbit anti-human AM antibody (purified IgG) on cell proliferation was examined at the indicated time points by the MTT [3,(4,5-dimethyl-thiazol-2-yl)-2,5-diphenyl tetrazolium bromide] assay. 26,27 After 2, 4, 6, and 8 days growth at 37°C in a humidified 95% air-5% CO2 atmosphere, the dye and solubilization solutions were added from the Promega proliferation assay (Promega, Lyon, France) which is a variation of the MTT assay. 26,27 The Bio-Tek Microplate Manager plate reader and software was used to determine the change in the number of viable cells from dye reduction measured by absorbance at 570 nm.
Patients and Tissue Preparation
Tumors tissues from patients operated on for glioma at the Department of Neurosurgery, CHU Timone, Marseille, France, were studied. Our series include according to the World Health Organization histopathological classification, 28 4 oligodendrogliomas grade II (low grade), 7 anaplastic oligodendrogliomas, 4 grade II astrocytomas (low grade), 4 anaplastic astrocytomas, and 14 glioblastomas (grade IV). Brain tumor samples were collected at the time of surgery and immediately stored in liquid nitrogen until used for RNA extraction. Nontumoral telencephalon was obtained from a patient submitted to a surgical procedure for epilepsy treatment. All tissue procurement protocols were approved by the relevant institutional committees (University of Aix-Marseille) and were undertaken under informed consent of each patient and participant.
Northern Blot Analysis
Total RNA was prepared from tumors tissues and cell lines using the acid guanidinium isothiocyanate/phenol/chloroform procedure. 29 Northern blot analysis was performed essentially as described previously. 30 Briefly, total RNA (20 μg) was resolved on 1% agarose-formaldehyde-denaturing gel. The denatured RNAs were transferred to Hybond-N membranes (Amersham-Pharmacia Biotech, Orsay, France) by capillary action in 10× standard saline citrate [1.5 mol/L NaCl, 0.15 mol/L sodium citrate (pH 7.0)], cross-linked by UV irradiation and hybridized to [α-32P]-labeled human 1.1-kb PAM cDNA 31 and 1.2-kb AM cDNA, 32 respectively. Filters were prehybridized, hybridized, and washed as described previously. 30 To correct for differences in loading and/or transfer, blots were stripped and hybridized to cDNA probes derived from frog rRNA. 33 The autoradiograms were analyzed by measurement of absorbance by scanner-densitometer using NIH Image 1.54 software (National Institutes of Health, Bethesda, MD). The hybridization signals of PAM and AM mRNAs were normalized to that of 18S rRNA. The results were expressed as the ratio of PAM or AM mRNAs absorbances to 18S rRNA absorbance.
Preparation of Tissue Extracts and Amidation Assay
Cells were scraped from culture wells into ice-cold phosphate-buffered saline (PBS), collected, and prepared for amidation assay as described previously. 30
Peptide Extraction and Radioimmunoassay
Cell pellets (6 × 10 6 cells) were boiled in 0.5 mol/L of acetic acid for 20 minutes (1:10, w/v). After homogenization with a Potter apparatus, cell suspensions were centrifuged at 24,000 × g for 15 minutes. The pellets were stored at −20°C until assayed for protein content using the bicinchoninic acid protein assay reagent (Pierce Chemical Co., Interchim, Paris). The supernatant was lyophilized and the resulting residues were resuspended in radioimmunoassay (RIA) buffer. 12 The RIA of AM was performed as previously reported, 12 using the anti-serum against human AM1-52 amide developed in our laboratory, and used at a final dilution of 1:30,000. To measure the immunoreactive AM (IR-AM) in the culture medium, the medium was extracted by the previously reported method 12 using Sep-PaK C18 cartridges (Waters, Milford, MA). Intra- and interassay coefficients of variation were 5% (n = 10) and 8% (n = 7), respectively.
Chromatographic characterization of IR-AM in the culture medium was performed by reverse-phase high performance liquid chromatography (HPLC) using a μBondapak C18 column (3.9 × 300 mm; Waters). The conditioned medium (80 ml) was extracted using Sep-PaK C18 cartridges. The extract was reconstituted with water containing 0.1% (v/v) trifluoroacetic acid and loaded onto the column. The HPLC analysis was performed with a linear gradient of acetonitrile containing 0.1% (v/v) trifluoroacetic acid from 10 to 60% at a flow rate of 1 ml/min/fraction throughout 50 minutes. Each fraction (1 ml) was collected, dried, and assayed for IR-AM.
Western Blot Analysis
The medium of U87, U373, or SW1088 cultures was replaced with serum-free defined medium. After 24 hours of cell culture, this conditioned medium was harvested and concentrated 70-fold using a SpeedVac concentrator (Savant Instruments, Inc.). An equal quantity (30 μl) was prepared for electrophoresis by making them 2% in sodium dodecyl sulfate and 5% in 2-mercaptoethanol and heated to 95°C for 5 minutes. Samples of medium were fractionated on slab gels containing 12% acrylamide and 0.25% N,N-bis-acrylamide using the buffer system of Laemmli. 34 Proteins were electrophoretically transferred to Hybond-C membranes (Amersham Pharmacia Biotech) for 1 hour at 210 mA and visualized with Ponceau S (Sigma). Molecular weights were estimated by comparison with the prestained protein molecular weight standards (Invitrogen Life Technologies). Hybond-C strips were blocked in PBS buffer containing 5% nonfat dry milk and incubated overnight in 1:1000 dilution of rabbit anti-serum anti-human AM, and washed three times in PBS. Signals were revealed using an enhanced chemiluminescence kit (ECL kit, Amersham Pharmacia Biotech). Specificity control consisted of a duplicate membrane incubated in antigen-preabsorbed (10 nmol/ml anti-AM) anti-serum.
Quantitative Reverse Transcriptase-Polymerase Chain Reaction (RT-PCR)
Real-time quantitative PCR was used to accurately detect the changes of AM and GAPDH gene copies. The cycle at which the amplification plot crosses the threshold (CT) is known to accurately reflect relative mRNA values. 35,36 Total RNA (2 μg) DNA-free was reverse-transcribed into complementary DNA (cDNA) using 1 μg of hexamers (Pharmacia Biotech, Orsay, France) and M-MLV reverse transcriptase as described by the manufacturer (Invitrogen Life Technologies). Human AM and PAM and GAPDH mRNAs were amplified (AM: forward primer, 5′-TGCCCAGACCCTTATTCGG-3′ and reverse primer, 5′-AGTTGTTCATGCTCTGGCGG-3′; PAM: forward primer, 5′-CACTGATTGGACGGCAGAG-3′ and reverse primer, 5′-CATCACTAGACGTGCCACCA-3′; GAPDH: forward primer 5′-CAAATTCCATGGCACCGTC-3′ and reverse primer 5′-CCCATCTGATTTTGGAGGGA-3′), detected, and quantitated in real-time using the ABI Prism 7700 Sequence Detector System (PE Applied Biosystems, Foster City, CA) as described previously. 35,36
The Taq Man probes for AM, PAM, and GAPDH were 5′-ACATGAAGGGTGCCTCTCGAAGCCC-3′; 5′-TTTTGGTGACCTACTGGCTGCAA-3′ and 5′-CCCATCACCATCTTCCAGGAGCGAG-3′, respectively. The amplification mixture contained cDNA derived from 50 to 150 ng of total RNA, 0.2 μmol/L of primer, and 0.1 μmol/L of Taq Man probe in 50 mmol/L of salt and 5 mmol/L of MgCl2. A two-step PCR was performed for 35 cycles. Denaturation was done at 94°C for 20 seconds, and annealing/extension at 60°C for 30 seconds. The reaction produced a 115-bp PCR product for AM, one of 155 bp for PAM, and one of 101 bp for GAPDH. To determine the accuracy of the assay, total RNA was reverse-transcribed and amplified on 3 separate days. The interassay accuracy of amplification for the 3 days was 8%. For quantitation of the data, AM mRNA levels were normalized to the GAPDH mRNA levels in the same reaction. To create standard curves for each gene, RNAs were produced by in vitro transcription from linearized templates corresponding to AM, PAM, and GAPDH cDNA constructs using T7 or T3 polymerases and reverse-transcribedto cDNA.
Taq Man PCR Assay Conditions for AM, PAM, and GAPDH mRNAs
Using the fluorogenic probes for AM, PAM, and GAPDH with the experimental conditions defined above, we obtained a linear relationship between the RNA concentration (previously transcribed into cDNA) and the fluorescent signal (ΔRQ) for AM, PAM, and GAPDH RNAs in 1-to 250-pg DNA target. For each unknown sample, we determined the ΔRQ values for all three genes and the results were expressed as fg of AM or PAM per pg GAPDH.
RT-PCR of CRLR and RAMP mRNAs
Total RNA (5 μg) from human gliomas and glioma cell lines, was reverse-transcribed into cDNA using 1 μg of oligodT12-18 (Parmacia PL, Paris, France) as primer in a 20-μl reaction volume containing 50 mmol/L of Tris-HCl (pH 8.3), 75 mmol/L of KCl, 3 mmol/L of MgCl2, and each of four dNTPs (Pharmacia), 20 U of Rnasin (Promega, Lyon) and 400 U of M-MLV reverse transcriptase (Invitrogen Life Technologies) at 37°C for 60 minutes. The primers used in the PCR were designed to be specific for CRLR, RAMP2, and RAMP3 and not to cross-hybridize with any other known sequences as reported by Martinez and colleagues. 37 Human CRLR, RAMP2, and RAMP3 were amplified (CRLR: forward primer 5′-GTAATGTTAACACCCACGAGAAAG-3′ and reverse primer 5′-ATCCCCAGCCAAGAAAATAATAC-3′; RAMP2: forward primer 5′-GGATATAGGCGCCCCCACAC-3′ and reverse primer 5′-GGAAGCCCAGGTCAAACAACTCT-3′; and RAMP 3: forward primer 5′-CGCAGCAAACGCACCGACAC-3′ and reverse primer 5′-GAGCCAGGGCAGGAACCAGAGATG-3′). PCRs were performed in a 50-μl volume, with 20 mmol/L of Tris-HCL (pH 7.4, 25°C), 50 mmol/L of KCl, 1.5 mmol/L of MgCL2, 0.1% Triton X-100, 200 μmol/L each of four dNTPs, 1 μmol/L of each primer, cDNA derived from the equivalent of 300 ng of total RNA, and 2.5 U of Expand Long Template (Roche Molecular Biochemicals). Samples were subjected to 35 cycles in the MJ Research thermal cycler (MJ Research Inc., La Jolla, CA). Cycle parameters were generally as follows: the initial denaturation step was at 94°C for 4 minutes, the repeat cycle consisted of annealing at 50°C for CRLR, and 58°C for RAMP2 and RAMP3 for 40 seconds, followed by extension at 68°C for 50 seconds and denaturation at 94°C for 30 seconds; the last extension time was lengthened to 10 minutes. Samples were fractionated on a 1.2% agarose gels in 89 mmol/L of Tris, 89 mmol/L of borate, 2.5 mmol/L of ethylenediaminetetraacetic acid, pH 8.0, buffer. After staining with ethidium bromide, gels were photographed and prepared for Southern transfer by soaking for 15 minutes in 1.5 mol/L NaCl and 0.5 N NaOH and then for 30 minutes in 1 mol/L Tris-HCl, pH 8.0, and 1.5 mol/L NaCl and transferred to Hybond-N membrane as described. 30 The filters were hybridized with the internal probes for CRLR, RAMP2, and RAMP3, 5′-TGGGACATTTGCAACTAACAG-3′, 5′-GGGGACGGTGAAGAACTATGAGAC-3′, 5′-TCTAGGGCCAGTGGAGGAAAAT-3′, respectively. The filters were washed as previouslydescribed 30 and exposed to film to verify the identity ofthe bands.
Development of Anti-Human AM Antibody
The polyclonal antibody against human AM was developed by use of the synthetic peptide corresponding to the entire AM1-52 amide peptide (Bachem). Female New Zealand rabbits received injections at multiple subcutaneous sites with 120 μg of synthetic peptide emulsified with complete Freund’s adjuvant. Then the rabbits were further immunized at 3-week intervals with 100 μg of AM1-52 amide emulsified with incomplete Freund’s adjuvant. 38 The anti-sera obtained after the fourth booster injection were screened for anti-AM activity, and then affinity purified on rProtein A Sepharose Fast Flow columns (Amersham Pharmacia Biotech).
Binding of 125I-Labeled AM
Glioblastoma cells were cultured in 24-well plates for 48 hours (15 × 10 4 cells/well) and then serum-starved for 24 hours. After washing with PBS, cells were incubated in TIS medium (MEM plus 10 μg/ml transferrin, 10 μg/ml insulin, and 3 × 10⁻⁸ mol/L sodium selenite) at 25°C for 120 minutes with the radioactive tracer in the presence or absence of an excess (10−6 mol/L) of unlabeled AM as previously described. 39 Iodination of synthetic hAM was performed by the chloramine T method, 40 and purified by reverse HPLC; monoiodinated [125I] hAM (SA, 350 Ci/mmol) was used in the experiments. In binding inhibition studies, cells were incubated with tracer and increasing concentrations of the anti-AM antibody. At the end of the incubation period, cells were extensively washed with cold PBS containing 0.2% bovine serum albumin, solubilized with 0.2 mol/L of sodium hydroxide, and analyzed for bound radioactivity in a γ-spectrometer. Specific binding was obtained by subtracting nonspecific binding in the presence of excess unlabeled hAM from total binding. Data points represent the mean of three experiments, each of which was performed in triplicate.
Animal Studies
Animal work was performed in the animal facility of the school of medicine in accordance with institutional guidelines. Male 4-to-5-week-old athymic NMRI (nu/nu) mice (Janvier, Laval Le Genest, France) were used. Mice were acclimated and housed in sterile cages in groups of four or less under laminar flow hoods in a temperature-controlled room with a 12-hour light/12-hour dark schedule, and fed autoclaved chow and water ad libitum.
Treatment of Glioblastoma Tumor Xenografts
Athymic NMRI (nu/nu) nude mice were implanted with U87 glioblastoma cells. For the cell implantations, U87 cells, grown in culture, were washed with PBS, dispersed in a 0.05% solution of trypsin, and resuspended. After centrifugation (4000 rpm for 20 minutes at 8°C), the cell pellet was resuspended in PBS and the final concentration was adjusted to 3 × 10 7 cells/ml and the suspension was placed on ice. After the site was cleaned with ethanol, 0.1 ml (3 × 10 6 cells) of the suspension were subcutaneously injected in the right flanks of nude mice. Tumors were measured with a dial-caliper, and volumes were determined using the formula width × length × height × 0.52 (for ellipsoid form). After 12 days, when the primary tumors were 1350 to 1500 mm 3 in size, animals were randomly divided into three groups. One group (n = 20) received intratumoral injection of the anti-AM antibody (200 μg of purified IgG) as a suspension in PBS in a volume of 0.2 ml every 3 days. As control, one group (n = 7) received an irrelevant antibody (IgG of the same isotype) and the other group (n = 7) received comparable injections of the vehicle alone (PBS). Mice were sacrificed at the indicated time.
Immunohistochemical Analysis
Tumor specimens were embedded in Tissue-Tek and frozen on dry ice/butane, and stored at −80°C. Frozen sections (5 μm) were cut on a Leica cryostat. Sections of each specimen were stained using hematoxylin and eosin (H&E). Immunohistochemistry was performed using the Vectastain Elite ABC Kit (Vector Laboratories, Burlingame, CA). For the purpose of assessing tumor vascularity and proliferation characteristics, tissue sections were evaluated using antibodies to factor VIII-related antigen (von Willebrand factor) (DAKO, Denmark) and Ki-67 nuclear antigen (DAKO). To ensure that representative tumor tissue sections were evaluated, all tumors were sectioned through their largest diameter and then at least five thin slices were made from each half of the resected tumor. Detection was performed using a diaminobenzidine chromogen, which resulted in a positive brown staining. Sections were counterstained with hematoxylin, dehydrated in ethanol, and mounted with glass coverslips. Negative control slides were obtained by omitting the primary antibody. Ki-67 staining was quantified by counting the number of positively stained cells of all nuclei in 15 randomly chosen fields.
In situ detection of apoptosis was measured by the terminal deoxynucleotidyltransferase (Tdt)-mediated dUTP nick end-labeling (TUNEL) method using the apopTag Plus Kit (Intergen, Gaithersburg, MD) followed by counterstaining with 1% methyl green. Apoptosis was quantified by determining the percentage of positively stained cells for all nuclei in 20 randomly chosen fields per section at ×200 magnification.
Tumor Vascular Density
Quantitation of vessel count was performed by a procedure described by Wedner and colleagues. 41 The blood vessels were counted randomly from nonnecrotic areas in each tumor section in a ×200 microscope field (1.0 mm2) (Olympus BH2, Tokyo, Japan), on vWF-stained tissue sections. Vascular density was defined by averaging the number of vessels with lumen in at least eight of the most vascular areas.
Statistical Analysis
Data are expressed as mean ± SEM. Statistical analyses were performed by using the one-way analysis of variance followed by Fisher’s protected least significant difference test (Statview 512; Brain Power Inc., Calabasas, CA). The difference was considered significant if the P value was less than 0.05.
Results
Human Glioma and Glioma Cell Lines Express High Levels of PAM mRNA
Total RNA from surgically resected human glioma, human glioma cell lines, and nontumoral brain tissue was prepared to assess steady-state levels of PAM transcripts. Northern blot analysis revealed the presence of an ∼4-kb PAM mRNA visualized using a 2.2-kb human PAM cDNA probe. 31 High levels of PAM transcript were expressed in human gliomas (Figure 1A) ▶ and in the glioma cell lines (Figure 1C) ▶ as compared to nontumoral tissue (Figure 1A) ▶ . The PAM cDNA probe was removed from the blots, and the amount of ribosomal RNA present in each sample was determined by hybridization to a cDNA probe for ribosomal RNA (Figure 1, A and C) ▶ . In glioma tumors, the amount of PAM mRNA, quantified by densitometry and normalized to 18S ribosomal RNA, seemed to correlate with the tumor grade. PAM mRNA levels were 9- to 15-fold higher in malignant glioblastomas and fourfold to sixfold higher in low-grade gliomas as compared to nontumoral brain tissue (Figure 1B) ▶ . Most established cell lines derived from human glioblastoma constantly expressed high levels of PAM mRNA (Figure 1D) ▶ .
Figure 1.

Representative Northern blot analysis showing the expression of PAM mRNA in human glioma, glioblastoma cell lines, and nontumoral brain tissue. A and C: Total RNA (20 μg) was fractionated on 1% agarose gel and transferred to Hybond-N membrane. The blots were hybridized with a 2.2-kb human PAM cDNA probe and exposed to X-ray film for 24 hours at −70°C with an intensifying screen. The blots were subsequently stripped and reprobed with a cDNA probe corresponding to 18S rRNA to permit correction for the amount of sample actually transferred to Hybond-N membrane. B and D: For densitometric analysis, the amount of PAM mRNA was normalized to the amount of 18S rRNA; this arbitrary ratio was used to express relative tissue and cell line PAM mRNA levels. Results shown for glioblastoma cell lines are the mean ± SEM of four independent experiments. NB, nontumoral brain; GGIV, glioma grade IV; GGII, glioma grade II.
PAM Activity in Glioma Cell Lines
The amidation activity of extracts of each cell line was assayed using α-N-acetyl-Tyr-Val-Gly substrate at pH 5.5. 30 Total PAM activity was calculated by summing the amount of PAM activity estimated in both particulate and soluble fractions (Figure 2) ▶ . The glioblastoma cell lines U373 and SW1783 consistently displayed higher levels of PAM activity (80 ± 4 and 74 ± 4 pmol/mg protein/hour, respectively) than U87 (56 ± 4.6 pmol/mg protein/hour); U138 (57 ± 4.5 pmol/mg protein/hour) and SW1088 (54 ± 2.7 pmol/mg protein/hour) cell lines. Subsequent studies have indicated that the culture medium of these cell lines also displayed substantial amounts of secreted PAM (not shown). The amount of PAM activity in each cell line represents a balance between synthesis, storage, inactivation, and secretion of the enzyme. Therefore, the correspondence between glioma cell line PAM expression, as determined by Northern analysis (Figure 1D) ▶ , and the corresponding cell line PAM activity level may not be quantitatively equal. The expression of PAM mRNA in both gliomas and glioma cell lines and the presence of PAM activity in these glioma cell lines demonstrate their capacity to produce α-amidated peptides.
Figure 2.

PAM activity in glioblastoma cell lines. Crude particulate and soluble fractions were prepared at least three times from each cell line. Assays for PAM activity were performed in duplicate with at least two different amounts of protein. Total PAM-specific activity was calculated by taking into account the amount of protein in the two fractions. The mean total specific activities ± SEM are plotted.
AM mRNA Is Expressed in Glioma Cell Lines
To determine the substrate(s) for PAM in the glioma cell lines, we screened these cells by RT-PCR for the expression of many α-amidated peptides known to have mitogenic effects on tumor cells. A very high expression was found for AM in contrast to a weak expression of neuropeptide Y and growth hormone-releasing hormone, and no expression of calcitonin gene-related peptide (CGRP), cholecystokinin, and vasoactive intestinal peptide (not shown).
To assess the levels of AM mRNA in the glioma cell lines and human nontumoral telencephalon, total RNA was subjected to Northern blot analysis, and AM mRNA was visualized using a human AM radiolabeled cDNA. 32 The size of the messenger transcript was ∼1.6 kb (Figure 3A) ▶ , corresponding to what has been found in other AM-producing tissues. 42 The amount of AM mRNA was then normalized to the amount of 18S ribosomal RNA (Figure 3B) ▶ . The Northern blot analysis demonstrated that all glioma cell lines express AM mRNA, whereas no expression of AM mRNA was detected in nontumoral telencephalon tissue. However, the expression of AM mRNA in nontumoral brain tissue was observed by RT-PCR (unpublished data), 32 suggesting a low level of expression of AM mRNA in nontumoral human brain tissue. These results confirm previously reported data in T98G and A172 glioblastoma cell lines. 19,20
Figure 3.

Expression of AM mRNA in glioblastoma cell lines and nontumoral brain tissue. A: Total RNA (15 μg) prepared from glioblastoma cell lines and brain tissue was subjected to Northern blot analysis. The blot was hybridized with human AM cDNA probe. The membrane was subsequently stripped and hybridized with 18S ribosomal cDNA. B: The autoradiograms were densitometrically analyzed and the amount of AM mRNA was normalized to the amount of 18S rRNA. Data are presented as mean ± SEM of four independent experiments.
Production and Secretion of AM Peptide by Human Glioma Cell Lines
To investigate whether glioma cells could produce the AM protein, RIA, reverse phase-HPLC, and Western blot analysis were performed. Immunoreactive AM was detected in both the cell extracts and culture media. All of the glioma cell lines produced and secreted IR-AM. The amount of IR-AM produced and secreted by different cell lines is shown in Table 1 ▶ . Reverse-phase HPLC showed that IR-AM in the medium of U87 cells contained a single peak eluting in the position of AM1-52 amide (Figure 4A) ▶ . The conditioned medium of U87 cells also contained two minor peaks eluting earlier (Figure 4A) ▶ , which could be either a material very similar to AM1-52 amide, probably an AM precursor fragment, or AM with some minor modifications. Western blot analysis of the conditioned medium obtained from U87, U373, and SW1088 cells demonstrated an immunoreactive band of 6 kd that presumably represents the authentic peptide (Figure 4B) ▶ . In addition, immunoblot analysis of HPLC fraction containing IR-AM revealed a major 6-kd immunoreactive band (Figure 4B) ▶ . The specificity of our immune-detection assay was confirmed by an antibody absorption control that eliminated the specific bands (Figure 4C) ▶ . Taken together, these findings confirmed that cultured glioma cells themselves produce and secrete AM peptide.
Table 1.
AM Content in Cell Extracts and Culture Medium in Glioma Cell Lines
| Cellular content, fmol/mg protein | Culture medium content, fmol/ml/h | |
|---|---|---|
| U87 | 2.312 ± 0.256 | 0.415 ± 0.014 |
| U138 | 2.564 ± 0.288 | 0.248 ± 0.044 |
| SW1088 | 5.398 ± 0.127 | 0.488 ± 0.011 |
| U373 | 2.583 ± 0.250 | 0.231 ± 0.012 |
| SW1783 | 9.892 ± 0.101 | 0.104 ± 0.013 |
Figure 4.

Reverse-phase HPLC profile and Western blot analysis of glioblastoma cell-conditioned media. A: Fractionation of 100 ml of U87 (concentrated to 1 ml before injection) compared with the elution time of synthetic AM at 31 minutes (arrow). B: After the media of subconfluent U87, SW1088, and U373 cells were changed, the media 24 hours later were collected and concentrated 50-fold. Western blot analysis of these media using anti-human AM antibody showed a single immunoreactive band. The reverse phase-HPLC fraction at 31 minutes contains the 6-kd entity. The amount of synthetic AM is 10 ng. C: These immunoreactive bands disappeared when we used the preabsorbed anti-AM antibody.
Expression of AM and PAM mRNAs in Human Glioma
Total RNA from human gliomas was prepared to assess steady-state levels of AM and PAM mRNA transcripts. Real-time quantitative RT-PCR analysis was performed on tumor fragments of the 31 gliomas. Based on World Health Organization histopathological classification, the present series included 4 low-grade oligodendrogliomas (grade II), 7 anaplastic oligodendrogliomas, 4 low-grade astrocytomas (grade II), 4 anaplastic astrocytomas, and 14 high-grade gliomas (grade IV). Quantification of PAM mRNA transcripts revealed higher PAM mRNA levels in glioblastomas compared with low-grade and anaplastic astrocytomas. The mean level of PAM mRNA expression was 748 ± 87 fg/pg GAPDH mRNA in glioblastomas, whereas it was 262 ± 73 fg/pg and 189 ± 49 fg/pg for anaplastic and low-grade astrocytomas, respectively. Quantification of AM mRNA transcripts revealed a high level of AM mRNA in glioblastomas, compared to low-grade and anaplastic astrocytomas and oligodendrogliomas (Figure 5) ▶ . The individual patterns of AM mRNA expression are presented in Figure 5 ▶ . The mean level of AM mRNA expression was 55.8 ± 14.3 fg/pg GAPDH mRNA in glioblastomas, whereas it was 13.1 ± 3.2 fg/pg and 2.06 ± 0.8 fg/pg for anaplastic and low-grade astrocytomas, respectively. Among the glioblastomas, the individual pattern of expression was highly variable; in particular, five tumors (samples 1, 3, 5, 11, and 14) expressed AM mRNA levels >70 fg/pg GAPDH mRNA. Very low to null expression was detected in anaplastic oligodendrogliomas (4.12 ± 0.53 fg/pg) and low-grade oligodendrogliomas (0.34 ± 0.2 fg/pg). Omission of the reverse transcriptase eliminated the signal, which indicated that it was not attributable to contaminating genomic DNA (not shown).
Figure 5.

Real-time quantitative RT-PCR analysis of AM mRNA levels in glioma. Total DNA-free RNA from the oligodendroglioma (low grade and anaplastic), astrocytoma (low grade and anaplastic), and glioblastoma were transcribed to cDNA and subjected to quantitative RT-PCR using the ABI Prism 7700 sequence detection system for the estimation of relative AM to GAPDH mRNA ratio as described in Materials and Methods. Each column with bar shows mean ± SD (n = 3).
RAMP and CRLR mRNAs Are Expressed in Gliomas and Glioma Cell Lines
To determine whether the human brain gliomas and glioma cell lines express CRLR, RAMP2, and RAMP3, we examined the expression of their mRNA by RT-PCR. Subsequent Southern blot analysis of the RT-PCR products with the corresponding probes demonstrated in most of the gliomas and the cell lines bands of the expected sizes corresponding to the mRNA encoding CRLR as well as RAMP2 and RAMP3 (Figure 6) ▶ . No bands are seen in the controls omitting reverse transcriptase enzyme (not shown). Examination of the expression of L1 and RDC1 receptors by RT-PCR showed no expression of these two types of receptors in the glioma cell lines (unpublished data).
Figure 6.

Expression of RAMP and CRLR mRNAs. Total RNA from high- and low-grade gliomas and glioblastoma cell lines was subjected to RT-PCR using the three pairs of primers and PCR conditions were as described in Materials and Methods. The PCR products were fractionated on agarose gels, prepared for Southern blot analysis, and hybridized with the corresponding probe. The number of bp present in PCR products are indicated on the right.
Characterization of Anti-Human AM Antibody
The anti-AM polyclonal antibody (purified IgG) showed very low cross-reactivity with AM-related peptides such as AM22-52 amide, AM26-52 amide, and AM13-37. Calcitonin, CGRP1-37 amide, CGRP8-37 amide, and amylin showed insignificant anti-AM antibody binding despite some homology with AM (Table 2) ▶ . In addition, no cross-reactivities against the following peptides were observed: [ACTH (1-24), endothelin-1, AVP, CRF, TRH, substance P, and ANF]. The Western blot analysis clearly supports the antibody’s specificity for AM (Figure 4, B and C) ▶ . We next tested the ability of the antibody to block the binding of labeled 125I-AM to its cell-surface receptor on U87 cells (Figure 7) ▶ . Anti-AM antibody blocked AM-receptor interaction in a dose-related manner (Figure 7) ▶ . An indifferent rabbit anti-TRH antibody, of the same isotype as the anti-AM antibody (IgG) at 20 μg, did not significantly affect AM-receptor interaction (<1% inhibition).
Table 2.
Cross-Reactivity of the Anti-Adrenomedullin (Human) Antibody with AM-Related Peptides
| Specificity | ||
| AM (human, 1–52) | 100% | |
| AM (human, 22–52) | 10% | |
| AM (human, 26–52) | 9% | |
| AM (human, 13–37) | 1% | |
| CGRP (human, 1–37) | <0.1% | |
| CGRP (human, 8–37) | <0.1% | |
| Amylin | 0% | |
| Sensitivity | ||
| IC50 0.06 pmol/ml (antiserum dilution: ×30,000) | ||
Figure 7.

Concentration-dependent inhibition of 125I-labeled AM binding by anti-AM antibody. Glioblastoma cells (U87) were incubated for 120 minutes at 25°C in the presence of 125I-labeled AM (60 μci/μg−1, 7 × 10 4 cpm per test) and increasing concentrations of anti-AM antibody. Binding is expressed as a percentage of specific bound radioligand; each point is the mean of data from three independent experiments.
Effect of AM and Anti-AM Antibody on the Proliferation of U87 Cells in Vitro
It is now clear from a vast number of studies that the major effect on AM-stimulated cells is an elevation of cAMP, 13 a signal transduction pathway known to modulate cellular growth. 43 To investigate this aspect, we used the MTT assay technique to examine the effects of AM on the growth of glioma cell lines. U87 cells cultured in serum-free medium were exposed to 2 × 10⁻⁷ mol/L of AM for the indicated time, and the effect on the proliferation was followed by the MTT assay. As shown in Figure 8 ▶ , AM at 2 × 10⁻⁷ mol/L stimulated the proliferation of U87 by 13% (P < 0.02) and 12% (P < 0.02) after 6 and 8 days of treatment, respectively.
Figure 8.

Effect of AM and anti-AM antibody on the growth of U87 cells in vitro. For proliferation assays, tumor cells were seeded at the density of 2 × 10 3 per well in 12 multiwell plates in the presence of TIS medium (MEM plus 10 μg/ml transferrin, 10 μg/ml insulin, and 3 × 10⁻⁸ sodium selenite) or MEM supplemented with 0.5% FBS (previously treated at 58°C for 1 hour), 2 mmol/L of glutamine, and antibiotics. AM at 2 × 10⁻⁷ mol/L and anti-AM antibody (20 μg/ml) were added. As controls, a boiled anti-AM antibody and a control IgG of irrelevant specificity were used (not shown). For each treatment, six wells were prepared for MTT assays or exposed to trypsin and cells were counted in a Coulter counter (not shown). Vertical bars represent SEM of seven independent experiments. *, P < 0.05; ***, P < 0.0001.
To test the autocrine hypothesis, a polyclonal anti-AM antibody (purified IgG) was examined for its effect on the in vitro growth of a glioblastoma cell line. U87 cells cultured in vitro in serum-free medium were exposed to the anti-AM antibody at 20 μg/ml and the effect on proliferation was assessed with the MTT assay. The inhibition of proliferation reached 16% (P < 0.01), 28% (P < 0.001), and 33% (P < 0.001) by 4, 6, and 8 days of treatment, respectively, when compared to controls (Figure 8) ▶ . In contrast, 20 μg/ml of the IgG of irrelevant specificity or boiled anti-AM antibody showed no inhibition of cell growth in the same assay (not shown). Furthermore, we could demonstrate specificity by reversing the effects of the anti-AM antibody, with the addition of synthetic AM at 1 μmol/L (not shown). Taken together, these data strongly suggest that AM acts as an autocrine regulator of glioma cell proliferation. To determine whether there is a relationship between growth suppression by anti-AM antibody and the level of tumor cell AM expression, the analysis of SW1088 cell line that expresses higher levels of AM than U87 cell line was undertaken. After 6 and 8 days of treatment, anti-AM antibody at 20 μg/ml inhibited the proliferation of SW1088 cells by 16% (P < 0.002) and 23% (P < 0.0001), respectively, as compared to controls. Interestingly, the U373 cell line that secretes less AM than U87 and SW1088 cell lines showed 40% (P < 0.001) inhibition of proliferation after 8 days of anti-AM antibody treatment.
Inhibitory Effect of hAM(22-52)-NH2 on hAM-Mediated Cell Growth
To confirm that endogenous hAM produced by the glioblastoma cell lines acts as an autocrine growth factor, U87 glioma cells were incubated for up to 8 days in the absence or presence of the peptide antagonists AM22-52 amide at 10−6 mol/L and CGRP8-37 amide at 10−6 mol/L, respectively. The growth of these cells showed a slight but significant decrease 13% (P < 0.001) in the presence of AM22-52 amide as compared to control cells. However, no decrease in the basal growth rate of the cells treated with CGRP8-37 amide could be observed. These results support that AM acts as an autocrine regulator of glioma cell proliferation through a specific functional receptor present in these cells such as the CRLR/RAMP2 complex.
Effects of Anti-AM Antibody on Subcutaneous Established Human Glioma Xenografts
Mice were inoculated subcutaneous in the right flank with U87 cells. The tumors reached a size of 1350 ± 170 mm3, 12 days after inoculation. Figure 9 ▶ shows the tumor growth curves of three groups of mice bearing U87 glioma xenografts, that were treated every 3 days with the anti-AM antibody, a control IgG of irrelevant specificity, or saline vehicle, respectively. Treatment was administered by intratumoral injection and tumor growth was monitored as a function of tumor volume throughout the time of therapy. The growth of U87 glioma xenografts was significantly inhibited by the anti-AM antibody when compared to both control groups. Twenty-one days after treatment, a group of animals were sacrificed, and tumor size and vascularity were assessed. The control gliomas were large, red, and hypervascular, whereas anti-AM antibody-treated gliomas were small and white with few visible surface blood vessels. The mean tumor volumes in the controls and in the anti-AM antibody group were 2150 mm 3 and 646 mm3, respectively, at 21 days after treatment (Figure 9) ▶ , and the mean tumor weights were 4.05 and 1 g, respectively. Intratumoral injections of anti-AM antibody for 7 weeks resulted in a further suppression of tumor growth (tumor mass in all treated mice < 40 mm3) (Figure 9) ▶ . The mean tumor volume of treated tumor at the end of experiment at day 70 was 2% of the initial pretreatment mean tumor volume.
Figure 9.

The effect of anti-AM antibody on tumor growth in vivo. The human glioblastoma U87 (3 × 10 6 cells), was subcutaneously implanted in nu/nu mice. Mice bearing U87 tumors were treated with anti-AM antibody, control IgG of irrelevant specificity, or saline vehicle. The sizes of the glioblastoma xenografts were determined by measuring the volume of the tumors.
Immunohistochemistry
Tumors treated with the anti-AM antibody had less vascularization than tumors treated with control IgG or saline, as seen by H&E staining (Figure 10A) ▶ . This phenomenon was confirmed by von Willebrand factor (vWF) immunohistochemistry (Figure 10A) ▶ . In addition, the anti-AM antibody-treated tumors were significantly less vascular than the control tumors (P < 0.0001; Figure 10, A and B ▶ ). The mean vessel area was significantly higher in the control tumors as compared to the anti-AM antibody-treated tumors (P < 0.0001; Figure 10, A and B ▶ ). However, there was no significant difference in FVIII-related antigen-stained cells in the anti-AM antibody-treated tumors and the control tumors as determined by direct counting (Figure 10, A and B) ▶ . Accordingly and despite the fact that the apoptosis labeling is heterogeneous among the tumors, the apoptotic index of the anti-AM antibody-treated tumors was ∼fourfold to fivefold higher than the control tumors (P < 0.0005; Figure 10C ▶ ) and proliferative indices measured after staining for Ki-67 nuclear antigen revealed a significant decrease in tumors treated with the anti-AM antibody when compared to controls (P < 0.016; Figure 10C ▶ ).
Figure 10.
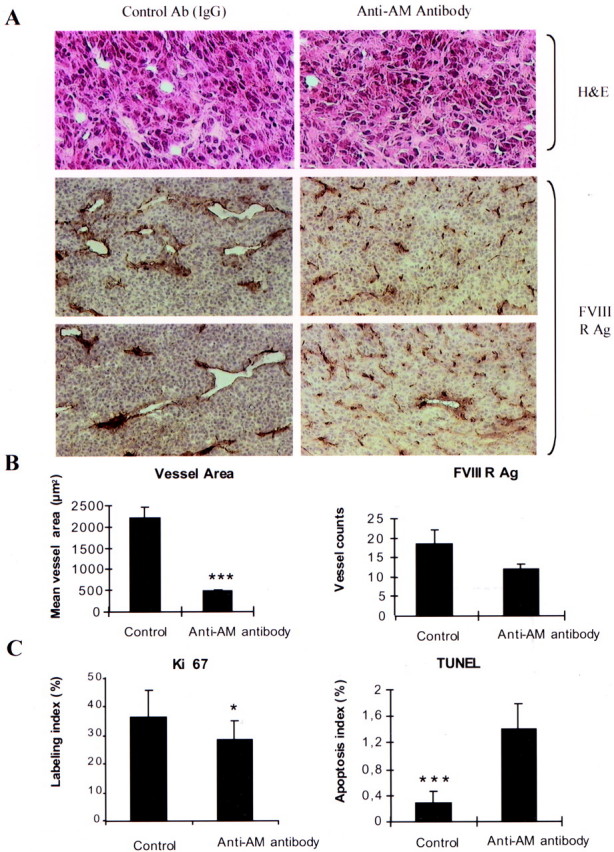
Effect of the anti-AM antibody on a human glioma xenograft. U87 cells (3 × 10⁶) were subcutaneously implanted into athymic (nu/nu) mice. After 12 days, when the primary tumors were 1350 to 1500 mm 3 in size, animals were randomly divided into three groups and treated as described in Materials and Methods. Twenty-one days later, animals were sacrificed, and the subcutaneous glioma tumors were harvested. A: Microphotographs of immunohistochemical-stained tumor sections for H&E, and FVIII antigen (FVIII RAg), in control and anti-AM antibody-treated tumors. B: Quantitative assessment of the cell density that stained positive for FVIII-related antigen (FVIII RAg), and the mean vessel area expressed in μm 2 was measured through a microscope using a NIH image 1.62 Software for analysis (n = 5; values represent the mean; bars, SD; ***, P < 0.0001). C: The percentage of cells in active cell cycle or undergoing apoptosis was determined by staining for Ki-67 nuclear antigen or TUNEL assay (see Materials and Methods), respectively (n = 5; values represent the mean; bars, SD *, P < 0.016; ***, P < 0.0005).
Discussion
Malignant gliomas are the most common primary tumors of the central nervous system. 1 At the present time the prognosis for patients with glioblastoma is poor. A better understanding of the cellular mechanisms underlying the growth and progression of glioma 1,44 may lead to improved therapy. For example, identifying factors produced in the tumor and elucidating their roles in tumor development may provide clues for improving therapy. However, greater benefit may be gained by identifying control points in the pathways of the synthesis of growth factors. In the present study, we showed an increased expression of PAM mRNA in gliomas. Levels of PAM mRNA were substantially elevated in malignant grade IV glioblastomas (9- to 15-fold) and grade II astrocytomas (4- to sixfold) compared to nontumoral brain tissue. As shown by the enzyme assays, PAM is active in all of the human glioblastoma cell lines, which indicates the capacity to α-amidate products if the appropriate prepropeptides, endoproteases, and exoproteases as well as reducing equivalents, are available. The increase in PAM biosynthesis is associated with the production of α-amidated peptides, 45 some of which could act as autocrine/paracrine factors and influence the response of neighboring neoplastic cells. A previous study on small cell lung cancer 46 has shown that bombesin/GRP, an α-amidated peptide, acts as an autocrine growth factor in these cells 47 which further supports a key role of PAM in tumor growth. A preliminary survey of amidated peptides present in glioblastoma-derived cell lines (U373, U138, U87, SW1783, and SW1088) demonstrated that AM is predominately represented both as mRNA and immunoreactive peptide in these cell lines. Similar data have been reported for the T98G and A172 glioblastoma cell lines. 19,20
The expression of AM mRNA in 31 samples of human glioma was assessed by a real-time quantitative RT-PCR. The data demonstrated that a high expression of AM was restricted to the most aggressive form of glioma, namely glioblastoma whereas it was low in anaplastic astrocytoma and barely detectable in the low-grade astrocytoma and oligodendroglioma (Figure 5) ▶ . Recently, an 11-fold overexpression of AM in one pool of five primary glioblastomas has been reported by Lal and colleagues 48 as determined by serial analysis gene expression (SAGE). Similar data were reported by Takahashi and colleagues. 19 The finding of an increased PAM expression in the lower grade tumors with no overexpression of AM at this time may suggest the possibility of synthesis of α-amidated peptide(s) other than those investigated in the present work.
The correlation of AM expression to the grade of glioma support the hypothesis that AM may participate in the progression of gliomas. Glioblastomas (World Health Organization glioma grade IV) are characterized not only by a nuclear atypia and a high mitotic rate, but also by a high vascular proliferation and necrotic foci (presumably hypoxic regions). 49 Recently, Garayoa and colleagues 50 demonstrated that the expression of AM mRNA in a variety of human cell lines is highly induced by hypoxia. Kitamuro and colleagues 51 confirmed the induction by hypoxia of AM mRNA in T98G. Recently, we demonstrated that reduced oxygen tension (1% O2) or exposure to hypoxia mimetics such as desferrioxamine mesylate (DFX) or CoCl2, induced AM mRNA expression in U87 cells (unpublished data). These results suggest that the resultant reduction in tissue oxygen tension may lead to an increased expression of AM mRNA in glioblastoma.
Previous studies have demonstrated the ability of reduced oxygen tension to mediate elevations in AM message/protein expression in several animals and cell systems. In this sense, hypoxia was shown to induce AM gene expression and secretion in cultured human umbilical vein endothelial cells; 52 focal ischemic regions of the rat brain show high AM mRNA expression, 53 and patients with chronic obstructive pulmonary disease have elevated AM plasma levels. 54
AM binding has been demonstrated in most cell types and human tissues. 13 Sone and colleagues 55 reported that specific binding sites for AM were present in every region of human brain. Herein, we demonstrate the expression of AM receptor (CRLR and RAMP2 and RAMP3) in the tumors as well as in glioma cell lines. We further demonstrate that 125I-AM binds to these cells. Moody and colleagues 39 demonstrated that a rat glioma cells line (C6) could bind human AM at high affinity (kd = 24 nmol/L), had an approximate receptor density of 36,000 sites per cell, and exogenous AM could augment intracellular cAMP/c-fos expression.
The presence of both AM and AM-R opens up for the possibility of AM being an autocrine/paracrine growth factor in gliomas. This hypothesis is supported by our work showing that AM stimulates U87, SW1088, and U373 cell growth. Although being significant, the stimulation was not strikingly high most probably because of the saturation of the receptors by the endogenous produced AM that may obscure the effects of external added AM.
Proliferation assays revealed that cell growth of U87 cells could be significantly suppressed by a neutralizing anti-AM antibody that blocks the binding of AM to cells, and this inhibition could be reversed by the addition of the exogenous AM (not shown); thus, the anti-AM antibody produced growth inhibition in vitro was most likely the result of a blocking of the autocrine/paracrine effects of AM produced by the glioma cells. These results thus suggest that AM may function as an autocrine growth factor involved in the growth control of glioblastoma cells such as U87, U373, and SW1088. Although AM22-52 amide is not an especially potent antagonist, the slight decrease in cell growth is in agreement with the data described above. This set of characteristics, together with the binding assay experiments, clearly implicates the existence of an autocrine loop mechanism that could potentially drive neoplastic growth as has been described for other peptides. 47,56 The lack of complete inhibition in vitro may be explained by the effect of additional growth factors produced by the tumor cells such as fibroblast growth factors, epidermal growth factor, platelet-derived growth factor, and transforming growth factor-β. 57,58 In further support of a functional role of AM in glioblastoma cells is the recent report by Moody and colleagues, 39 who reported that monoclonal antibody C6, which neutralizes AM, significantly inhibited the rat glioma cell line C6 proliferation in vitro and decreased the ability of AM to elevate c-fos mRNA. In addition, Miller and colleagues 20 reported that a neutralizing anti-AM monoclonal antibody was growth inhibitory in vitro to H157 (adenosquamous), H720 (lung carcinoid), MCF-7 (breast adenocarcinoma), and OVCAR-3 (ovarian adenocarcinoma) cells, which also showed both 125I-AM binding and AM-stimulated cAMP.
To extend the in vitro observations, in vivo experiments were performed. Our results demonstrated that the anti-AM antibody could be efficiently delivered in vivo and significantly suppress the growth of established glioblastoma xenografts. This effect was observed when treatment was initiated 12 days after implantation at a time when tumors had reached a significant volume. After 1 week of treatment, tumors in mice treated with control IgG, or saline grew progressively to a size that led to sacrifice, whereas the volume of the anti-AM antibody-treated tumors was stabilized and reached a 70% decrease when compared with the controls (Figure 9) ▶ . The mean tumor weights in the controls and the anti-AM antibody-treated groups were 4.05 and 1 g, respectively. A further suppression of tumor growth up to 98% was observed 70 days after treatment. The antitumor effect of the anti-AM antibody on U87 xenografts in vivo was most likely because of a direct action on the tumor through the suppression of AM:receptor interaction. Thus, the inhibition of the action of endogenous AM seems to be a key step in a complex cascade of events that result in tumor inhibition. It can, however, not be totally excluded that part of the in vivo response to the anti-AM antibody observed, is because of antibody-mediated complement activation. The inhibitory effect of the antibody in vitro speaks against this possibility because the in vitro experiments were done with serum-free medium. SW1088 and U373 cells, which showed growth inhibition after treatment with anti-AM antibody in vitro, did not grow significantly in nude mice and, thus, the antitumor activity of anti-AM antibody on these cell lines in vivo could not be evaluated.
AM has been shown to be angiogenic in the chick chorioallantoic membrane assay and to increase human umbilical vein endothelial cell number. 16 At day 21 after treatment, more than 90% of the vessels on the tumor surface disappeared after anti-AM antibody treatment. The vessel area in the controls were significantly larger than those in the antibody-treated groups (P < 0.0001; Figure 10, A and B ▶ ). Our data demonstrate that the density of vessels with lumen was decreased in the antibody-treated tumors despite the fact that there is no significant difference in cells stained positive for FVIII-related antigen (Figure 10, A and B) ▶ suggesting that AM might be involved in neovascularization and/or vessel stabilization. In accordance with these results, we could demonstrate increased apoptosis and decreased proliferation of anti-AM antibody-treated tumors (Figure 10C) ▶ .
Taken together our results suggest that the anti-AM antibody treatment exhibits an anti tumoral effect through both tumoral and endothelial cells. To establish whether the autocrine/paracrine stimulation is a general feature of primary glioblastoma, the extension of these investigations to additional cell lines and the screening of primary tumors for the production of biologically active AM are required. Although our studies used polyclonal anti-peptide antibody to inhibit AM action, it is possible that growth-suppressive effects could be obtained using anti-receptor antibodies or efficient and potent AM antagonists.
Footnotes
Address reprint requests to Dr. L’Houcine Ouafik, Laboratoire de Cancérologie Expérimentale, EA2671, University de la Mediterrangee, AIX, Boulevard Pierre Dramard, Marseille, Cedex 20, France 13916. E-mail: ouafik.h@jean-roche.univ-mrs.fr.
Supported in part by PHRC (UF 1756), the Fondation Lionel Perrier, and the Association pour la Recherche Contre le Cancer (to S. S.).
L. O. and S. S. contributed equally to this work.
References
- 1.DeAngelis LM: Brain tumors. N Engl J Med 2001, 344:114-123 [DOI] [PubMed] [Google Scholar]
- 2.Leon SP, Folkerth RD, Black PM: Microvessel density is a prognostic indicator for patients with astroglial brain tumors. Cancer 1996, 77:362-372 [DOI] [PubMed] [Google Scholar]
- 3.Aaronson SA: Growth factors and cancer. Science 1991, 254:1146-1153 [DOI] [PubMed] [Google Scholar]
- 4.Bradbury AF, Smyth DG: Peptide amidation. Trends Biochem Sci 1991, 16:112-115 [DOI] [PubMed] [Google Scholar]
- 5.Eipper BA, Stoffers DA, Mains RE: The biosynthesis of neuropeptides: peptide α-amidation. Annu Rev Neurosci 1992, 15:57-85 [DOI] [PubMed] [Google Scholar]
- 6.Gether U, Aakerlund L, Schwartz TW: Comparison of peptidylglycine α-amidation activity in medullary thyroid carcinoma cells, pheochromocytomas, and serum. Mol Cell Endocrinol 1991, 79:53-63 [DOI] [PubMed] [Google Scholar]
- 7.Maltese JY, Monge G, Giraud P, Salers P, Ouafik L’H, Pelen F, Oliver C: Characterization of an α-amidating activity in a human pancreatic tumour secreting vasoactive intestinal peptide (VIP). Clin Endocrinol 1990, 33:467-480 [DOI] [PubMed] [Google Scholar]
- 8.Wand GS, Ney RL, Baylin S, Eipper B, Mains RE: Characterization of a peptide α-amidation activity in human plasma and tissues. Metabolism 1985, 34:1044-1052 [DOI] [PubMed] [Google Scholar]
- 9.Steel JH, Martinez A, Springall DR, Treston AM, Cuttitta F, Polak JM: Peptidylglycine α-amidating monooxygenase (PAM) immunoreactivity and messenger RNA in human pituitary and increased expression in pituitary tumours. Cell Tissue Res 1994, 276:197-207 [DOI] [PubMed] [Google Scholar]
- 10.Rhodes CH, Xu R, Angeletti RH: Peptidylglycine α-amidating monooxygenase (PAM) in Schwann cells and glia as well as neurons. J Histochem Cytochem 1990, 38:1301-1311 [DOI] [PubMed] [Google Scholar]
- 11.Wimalawansa SJ: Amylin, calcitonin gene-related peptide, calcitonin, and adrenomedullin: a peptide superfamily. Crit Rev Neurobiol 1997, 11:167-239 [DOI] [PubMed] [Google Scholar]
- 12.Sakata J, Shimokubo T, Kitamura K, Nishizono M, Iehiki Y, Kangawa K, Matsuo H, Eto T: Distribution and characterization of immunoreactive rat adrenomedullin in tissue and plasma. FEBS Lett 1994, 352:105-108 [DOI] [PubMed] [Google Scholar]
- 13.Hinson JP, Kapas S, Smith DM: Adrenomedullin, a multifunctional regulatory peptide. Endocr Rev 2000, 21:138-167 [DOI] [PubMed] [Google Scholar]
- 14.Cuttitta F, Miller MJ, Montuenga LM, Garayoa M, Elsasser T, Walsh T, Unsworth E, Martinez A: Adrenomedullin: terra incognita. Martinez A Cuttitta F eds. Adrenomedullin. 1998, :pp 1-26 Tokyo, IOS Press/Ohmsha Ltd., Amsterdam [Google Scholar]
- 15.Kato H, Shichiri M, Marumo F, Hirata Y: Adrenomedullin as an autocrine/paracrine apoptosis survival factor for rat endothelial cells. Endocrinology 1997, 138:2615-2620 [DOI] [PubMed] [Google Scholar]
- 16.Zhao Y, Hague S, Manek S, Zhang L, Bicknell R, Rees MC: PCR display identifies tamoxifen induction of the novel angiogenic factor adrenomedullin by a nonestrogenic mechanism in the human endometrium. Oncogene 1998, 16:409-415 [DOI] [PubMed] [Google Scholar]
- 17.Martinez A, Miller MJ, Unsworth E, Siegfried JM, Cuttitta F: Expression of adrenomedullin in normal human lung and in pulmonary tumors. Endocrinology 1995, 136:4099-4105 [DOI] [PubMed] [Google Scholar]
- 18.Satoh F, Takahashi K, Murakami O, Totsune K, Sone M, Phneda M, Abe K, Miura Y, Hayashi Y, Sasano H, Mouri T: Adrenomedullin in human brain, adrenal glands and tumor tissues of pheochromocytoma, ganglioneuroblastoma and neuroblastoma. J Clin Endocrinol Metabol 1995, 80:1750-1752 [DOI] [PubMed] [Google Scholar]
- 19.Takahashi KF, Satoh E, Hara M, Sone O, Murakami T, Kayama T, Yoshimoto T, Shibahara S: Production and secretion of adrenomedullin from glial cell tumors and its effects on cAMP production. Peptides 1997, 18:1117-1124 [DOI] [PubMed] [Google Scholar]
- 20.Miller M-J, Martinez A, Unsworth EJ, Thiele CJ, Moody TW, Elsasser T, Cuttitta F: Adrenomedullin expression in human tumor cell lines. Its potential role as an autocrine growth factor. J Biol Chem 1996, 271:23345-23351 [DOI] [PubMed] [Google Scholar]
- 21.Kapas S, Catt KJ, Clark JL: Cloning and expression of cDNA encoding a rat adrenomedullin receptor. J Biol Chem 1995, 270:25344-25347 [DOI] [PubMed] [Google Scholar]
- 22.Kapas S, Clark JL: Identification of an orphan receptor gene as a type 1 calcitonin gene-related peptide receptor. Biochem Biophys Res Commun 1995, 217:832-838 [DOI] [PubMed] [Google Scholar]
- 23.Njuki F, Nicholl CG, Howard A, Mak JCW, Barnes PJ, Girgis SI, Legon S: A new calcitonin-receptor-like sequence in rat pulmonary blood vessels. Clin Sci 1993, 85:385-388 [DOI] [PubMed] [Google Scholar]
- 24.McLatchie LM, Fraser NJ, Main MJ, Wise A, Brown J, Thompson N, Solari R, Lee MG, Foord SM: RAMPs regulate the transport and ligand specificity of the calcitonin-receptor-like receptor. Nature 1998, 393:333-339 [DOI] [PubMed] [Google Scholar]
- 25.Fraser NJ, Wise A, Brown J, McLatchie LM, Main MJ, Foord SM: The amino terminus of receptor activity modifying proteins is a critical determinant of glycosylation state and ligand binding of calcitonin receptor-like receptor. Mol Pharmacol 1999, 55:1054-1059 [DOI] [PubMed] [Google Scholar]
- 26.Plumb JA, Milroy R, Kaye SB: Effects of the pH dependence of 3-(4,5-dimethylthiazol-2-yl)-2,5-diphenyl-tetrazolium bromide-formazan absorption on chemo-sensitivity determined by a novel tetrazolium-based assay. Cancer Res 1989, 49:4435-4440 [PubMed] [Google Scholar]
- 27.Carmichael J, DeGraff WG, Gazdar AF, Minna JD, Mitchell JB: Evaluation of a tetrazolium-based semiautomated colorimetric assay: assessment of radiosensitivity. Cancer Res 1987, 47:943-946 [PubMed] [Google Scholar]
- 28.Kleihues P, Cavenee WK: Pathology and Genetics of Tumors of the Nervous System. 2000. IARC Press, Lyon
- 29.Chomczynski P, Sacchi N: Single-step method of RNA isolation by acid guanidinium thiocyanate-phenol-chloroform extraction. Anal Biochem 1987, 162:156-159 [DOI] [PubMed] [Google Scholar]
- 30.Rocchi P, Boudouresque F, Zamora AJ, Muracciole X, Le Chevalier E, Martin PM, Ouafik L’H: Expression of adrenomedullin and peptide amidation activity in human prostate cancer and in human prostate cancer cell lines. Cancer Res 2001, 61:1196–1206 [PubMed]
- 31.Glauder J, Ragg H, Engels JW: Human peptidylglycine α-amidating monooxygenase: cDNA, cloning, and functional expression of a truncated form in COS cells. Biochem Biophys Res Commun 1990, 169:551-558 [DOI] [PubMed] [Google Scholar]
- 32.Kitamura K, Sakata J, Kangawa K, Kojima M, Matsuo H, Eto T: Cloning and characterization of cDNA encoding a precursor for adrenomedullin. Biochem Biophys Res Commun 1993, 194:720-725 [DOI] [PubMed] [Google Scholar]
- 33.Ouafik L, May V, Keutmann HT, Eipper B: Developmental regulation of peptidylglycine α-amidating monooxygenase (PAM) in rat heart atrium and ventricule: tissue-specific changes in distribution of PAM activity, mRNA levels, and protein forms. J Biol Chem 1989, 264:5839-5845 [PubMed] [Google Scholar]
- 34.Laemmli UK: Cleavage of structural proteins during assembly of the head of bacteriophage T4. Nature 1970, 227:680-685 [DOI] [PubMed] [Google Scholar]
- 35.Gibson UE, Heid CA, Williams PM: A novel method for real-time quantitative RT-PCR. Genome Res 1996, 6:995-1001 [DOI] [PubMed] [Google Scholar]
- 36.Heid CA, Stevens J, Livak KJ, Williams PM: Real-time quantitative PCR. Genome Res 1996, 6:986-994 [DOI] [PubMed] [Google Scholar]
- 37.Martinez A, Kapas S, Miller MJ, Ward Y, Cuttitta F: Coexpression of receptors for adrenomedullin, calcitonin gene-related peptide, and amylin in pancreatic β-cells. Endocrinology 2000, 141:406-411 [DOI] [PubMed] [Google Scholar]
- 38.Harlow E, Lane D (Eds): Antibodies, A Laboratory Manual. Cold Spring Harbor, Cold Spring Harbor Laboratory, 1988, pp 53–135
- 39.Moody TW, Miller MJ, Martinez E, Unsworth E, Cuttitta F: Adrenomedullin binds with high affinity, elevates cyclic AMP, and stimulates c-fos mRNA in C6 glioma cells. Peptides 1997, 18:1111-1115 [DOI] [PubMed] [Google Scholar]
- 40.Greenwood FC, Hunter WM, Glover JS: The preparation of 131I-labelled human growth hormone of high specific radioactivity. Biochem J 1963, 89:114-123 [DOI] [PMC free article] [PubMed] [Google Scholar]
- 41.Wedner N, Semple JP, Welch WR, Folkman J: Tumor angiogenesis and metastasis-correlation in invasive breast carcinoma. N Engl J Med 1991, 364:1-8 [DOI] [PubMed] [Google Scholar]
- 42.Sakata J, Shimokubo T, Nakamura S, Kangawa K, Matsuo H, Eto T: Molecular cloning and biological activities of rat adrenomedullin, a hypotensive peptide. Bichem Biophys Res Commun 1993, 195:921-927 [DOI] [PubMed] [Google Scholar]
- 43.Ishizaka Y, Tanaka M, Kitamura K, Kangawa K, Minamino N, Matsuo H, Eto H: Adrenomedullin stimulates cyclic AMP formation in rat vascular smooth muscle cells. Biochem Biophys Res Commun 1994, 200:642-646 [DOI] [PubMed] [Google Scholar]
- 44.Kleihues P, Burger PC, Plate KH, Ohgaki H, Cavenee WK: Glioblastoma. Kleihues P Cavenee WK eds. Pathology and Genetics of Tumors of the Nervous System. 1997, :pp 16-24 International Agency for Research on Cancer, Lyon [Google Scholar]
- 45.Ouafik L’H, May V, Saffen DW, Eipper BA: Thyroid hormone regulation of peptidylglycine α-amidating monooxygenase expression in anterior pituitary gland. Mol Endocrinol 1990, 4:1497-1505 [DOI] [PubMed] [Google Scholar]
- 46.Iwai N, Martinez A, Miller MJ, Bos M, Mulshine JL, Treston AM: Autocrine growth loops dependent on peptidyl α-amidating enzyme as targets for novel tumor cell growth inhibitors. Lung Cancer 1999, 23:209-222 [DOI] [PubMed] [Google Scholar]
- 47.Cuttitta F, Camey DC, Mulshine J, Moody TW, Fedorko J, Fiscler A, Minna JD: Bombesin-like peptides can function as autocrine growth factors in human small-cell lung cancer. Nature 1985, 316:823-826 [DOI] [PubMed] [Google Scholar]
- 48.Lal A, Lash AE, Altschul SF, Velculescu V, Zhang L, McLendon RE, Marra MA, Prange C, Morin PJ, Polyak K, Papadopoulos N, Vogelstein B, Kinzler K, Strausberg RL, Riggins GJ: A public database for gene expression in human cancer. Cancer Res 1999, 59:5403-5407 [PubMed] [Google Scholar]
- 49.Lopes MBS, Vandenberg SR, Scheithauer B: The World Health Organization classification of nervous system tumors in experimental neuro-oncology. Levine AJ Schmideck HH eds. Molecular Genetics of Nervous System Tumors. 1993, :pp 1-36 Wiley-Liss, New York [Google Scholar]
- 50.Garayoa M, Martinez A, Lee S, Pio R, An WG, Neckers L, Trepel J, Montuengua LM, Ryan H, Johnson R, Gassmann M, Cuttitta F: Hypoxia-inducible factor-1 (HIF-1) up-regulates adrenomedullin expression in human tumor cell lines during oxygen deprivation: a possible promotion mechanism of carcinogenesis. Mol Endocrinol 2000, 41:848-862 [DOI] [PubMed] [Google Scholar]
- 51.Kitamuro T, Takahashi K, Nakayama M, Murakami O, Hida W, Shirato K, Shibahara S: Induction of adrenomedullin during hypoxia in cultured human glioblastoma cells. J Neurochem 2000, 75:1826-1833 [DOI] [PubMed] [Google Scholar]
- 52.Ogita T, Hashimoto E, Nakaoka T, Okabe F, Kira Y, Matsuoka R, Fujita T: Hypoxia induces adrenomedullin gene expression and secretion in cultured human umbilical vein endothelial cells. Circulation 1997, 96:962 [Google Scholar]
- 53.Wang X, Yue TL, Barone FC, White RF, Clark RK, Wilette RN, Sulpizio AC, Aiyar NV, Ruffolo Jr RR, Feuerstein GZ: Discovery of adrenomedullin in rat ischemic cortex and evidence for its role in exacerbating focal brain ischemic damage. Proc Natl Acad Sci USA 1995, 92:11480–11484 [DOI] [PMC free article] [PubMed]
- 54.Cheung B, Leung R: Elevated plasma levels of human adrenomedullin in cardiovascular, respiratory, hepatic and renal disorders. Clin Sci 1997, 92:59-62 [DOI] [PubMed] [Google Scholar]
- 55.Sone M, Takahashi K, Satoh F, Murakami O, Totsune K, Ohneda M, Sasano H, Ito H, Mouri T: Specific adrenomedullin binding sites in the human brain. Peptides 1997, 18:1125-1129 [DOI] [PubMed] [Google Scholar]
- 56.Quinn KA, Treston AM, Unsworth EJ, Miller MJ, Vos C, Grimley C, Battey J, Mulshine JL, Cuttitta F: Insulin-like growth factor expression in human cancer cell lines. J Biol Chem 1996, 271:11477-11483 [DOI] [PubMed] [Google Scholar]
- 57.Libermann TA, Friesel R, Jaye M, Lyall RM, Westermark BW, Drohan W, Schmidt A, Maciag T, Schlessinger J: An angiogenic growth factor is expressed in human glioma cells. EMBO J 1987, 6:1627-1632 [DOI] [PMC free article] [PubMed] [Google Scholar]
- 58.Jensen RL: Growth factor-mediated angiogenesis in the malignant progression of glial tumors. Surg Neurol 1998, 49:189-196 [DOI] [PubMed] [Google Scholar]