

Abstract
The molecular genetic correlates of a recently proposed subclassification of papillary renal cell carcinoma (PRCC) that designates tumors as type 1 and type 2 based on histological features have not yet been established. Alterations of known genes in PRCC include missense mutations in the MET oncogene (7q31) and rare translocations fusing TFE3 at Xp11.2 with a variety of other loci. Previous cytogenetic and allelic loss studies of PRCC cases revealed gain of chromosome 3q, 7, 8, 12q, 16, 17, and 20q, and loss of 1p, 6q, 9p, 11p, 13q, 14q, 18, 21q, X, and Y. We analyzed a series of sporadic type 1 and type 2 PRCC cases for MET mutations, TFE3 rearrangements, and allelic imbalance (AI) on 3p, 6, 7q, 9p, 11, 13q, 14q, 17q, 18, 20q, and 21q and compared selected results with a series of conventional renal cell carcinomas. A somatic mutation M1149T was identified in MET exon 17 in 1 of 35 PRCC cases whereas TFE3 rearrangements were not detected in 22 PRCC cases examined. Significant differences in AI frequency between PRCCs and conventional renal cell carcinoma cases were seen on 3p (37.5% versus 77.8%, P = 0.01), 7q (42.9% versus 5.6%, P = 0.01), and 17q (54.5% versus 20.0%, P = 0.03). Significant differences in AI frequency between type 1 and type 2 PRCCs were noted on 17q (78.6% versus 12.5%, P = 0.006) and 9p (0% versus 37.5%, P = 0.02). Additional analyses suggested that the relationship between 17q AI and PRCC type may be independent of histological grade and stage. Our findings identify genetic differences between the recently proposed type 1 and type 2 PRCCs, and support the premise that these subtypes arise from distinct genetic pathways.
Papillary renal cell carcinoma (PRCC) occurs in sporadic and hereditary forms, accounting for 10 to 15% of carcinomas of the renal tubular epithelium. Current classification of a renal tumor as PRCC requires a minimum of 75% papillary or tubulopapillary architecture. 1 Delahunt and Eble 2 recently proposed subclassification of PRCCs into type 1 and type 2 tumors based on histological features. Type 1 tumors consist of papillae and tubular structures covered by small cells with scant pale cytoplasm and small nuclei, whereas type 2 tumors are characterized by papillae covered by large cells with abundant eosinophilic cytoplasm and large spherical nuclei with prominent nucleoli. These categories correspond to the chromophil basophilic and chromophil eosinophilic carcinoma subtypes, respectively, described by the previous Thoenes and colleagues classification. 3 Type 1 tumors have been shown to express cytokeratin 7 more frequently than type 2 tumors. 2 Preliminary data suggests there are clinical differences as well as prognostic utility to the division of PRCC into type 1 and type 2 categories. 2,4,5
Previous karyotyping of sporadic and hereditary papillary PRCCs demonstrated trisomy of chromosomes 3q, 7, 8, 17, and 20, and loss of the Y chromosome in men. Subsequent allelic loss and comparative genomic hybridization (CGH) studies of a limited number of PRCC cases revealed gains of chromosomes 7, 8, 12q, 16q, 17, and 20q, and losses of chromosomes 1p, 4q, 6q, 9p, 11p, 13q, 14q, 18, 21q, X, and Y, suggesting oncogene copy number gains or tumor suppressor gene losses in these chromosome regions. 5-7 Jiang and colleagues 4 used CGH to compare chromosomal alterations between type 1 and type 2 PRCCs and found the number of DNA gains per tumor, especially gains of 7p and 17p, to be significantly higher in type 1 tumors (P < 0.01).
Recent molecular analysis identified missense mutations in the tyrosine kinase domain of the MET proto-oncogene (7q31.1-34) in hereditary and 5 to 13% of sporadic PRCCs. 8 These mutant MET genes cause ligand-independent constitutive phosphorylation of the c-met protein and induce transformation in the NIH 3T3 cell assay. 9-11 The commonly observed tri- or polysomy 7 results in nonrandom duplication of the mutant MET. Lubensky and colleagues 12 have shown MET mutations to be exclusive to type 1 tumors. In their series they found five type 2 PRCC cases to be negative for MET mutations, 12 providing genetic evidence for a distinction between type 1 and type 2 tumors. Selective duplication of chromosome 7 regions distinct from the MET locus have also been described in some sporadic PRCCs. 13
In the vast majority of PRCCs, polysomy 7 is accompanied by either a full trisomy of chromosome 17, an isochromosome 17q, or duplication of the 17q21-qter region. 7,13-15 These observations suggest that increased allelic dosage and overexpression of an unknown gene in the 17q region, is also involved in PRCC development. Similarly, two nonsyntenic regions of duplication at chromosome 20q11.2 and 20q13.2 have been elucidated 16 in a subset of high-grade PRCCs with trisomy 20, suggesting that chromosome 20q also harbors several PRCC-related genes.
A small subset of PRCCs is characterized by translocations involving TFE3 at Xp11.2, which encodes a member of the basic helix-loop-helix family of transcription factors, and a variety of fusion partners. These partners include: PRCC at 1q21 (10 reported cases), 17-22 PSF at 1p34.1 (4 reported cases), 17,23 NonO at Xq12 (1 reported case), 24 10q23 (gene unknown, 1 reported case), 23 and 17q25 (ASPL; 10 reported cases). 25-27 The initial case reports were of tumors in young males with clear cell cytoplasm but distinctly papillary architecture, whereas subsequent reports included female patients and older adults. Two cases of t(X;1) in apparently nonpapillary renal tumors have also been reported. 28,29 These findings suggest an important role for altered transcriptional activity of TFE3 in PRCCs.
In this study, we sought to establish molecular genetic correlates for the type 1 and type 2 PRCCs defined histologically by Delahunt and Eble. 2 Using a series of sporadic type 1 (n = 21) and type 2 (n = 14) PRCC cases, we initially tested for TFE3 rearrangements and MET mutations. Subsequently, we examined the tumors for allelic imbalance (AI) on chromosomes 3p, 6, 7q, 9p, 11, 13q, 14q, 17q, 18, 20q, and 21q. The results were compared with similar testing of a group of conventional renal cell carcinomas (CRCCs), followed by analysis of differences between type 1 and type 2 PRCCs.
Materials and Methods
Case Selection
From the surgical pathology files at the University of Pennsylvania Medical Center, we identified 35 consecutive cases of PRCC from 1987 to 1999 with at least 3 mm3 of frozen tumor tissue imbedded in OCT medium. Twenty consecutive cases of CRCC with classic clear cell histology procured during the years 1995 to 1997 were similarly selected. In 25 of the PRCC cases and all 20 CRCC cases, corresponding frozen normal tissue was also available. All PRCC cases contained at least 75% papillary or tubulopapillary architecture. PRCCs were subcategorized as type 1 (n = 21) and type 2 (n = 14) based on previously published criteria. 2 One patient had bilateral type 1 tumors (cases 11 and 12). Tumors were graded by the Fuhrman grading system 30 and staged by American Joint Committee on Cancer (AJCC) criteria. 31 AI studies were performed only on the 25 PRCCs (type 1, n = 17 cases; type 2, n = 8 cases) and 20 CRCC cases for which corresponding frozen normal tissue was available. MET exon 16, 17, 18, and 19 sequence analysis was performed on all PRCC cases. Analysis for TFE3 rearrangements was performed on 21 PRCC cases from which at least 20 μg of DNA could be extracted from non-microdissected frozen tumor (type 1, n = 11 cases; type 2, n = 10 cases).
DNA Preparation
Microdissection of tumor and corresponding normal tissue was performed using a 26-gauge tuberculin needle under the light microscope on 10 μmol/L of hematoxylin and eosin-stained frozen sections. Normal tissue consisted of renal cortex. After 48 hours digestion of microdissected tissue in proteinase K (10 mg/ml) at 37°C, whole nucleic acid was extracted with phenol-chloroform and resuspended in 10 mmol/L of Tris and 1 mmol/L ethylenediaminetetraacetic acid, pH 7.5. This nucleic acid was used for AI and MET mutation analyses. In cases in which the frozen tumor block was judged to be of sufficient size, DNA extracted from 50 10-μmol/L sections without microdissection was used for Southern blot analysis of TFE3.
AI Analysis
The following microsatellite markers (primer sequences obtained from http://www.chlc.org and http://www.gdb.org) were used in this study: D3S2409 and D3S2387 (3p); D6S503 and D6S1281 (6q); 7D7S1807 and 7GATA44F09 (7q); D9S742 and D9S925 (9p); D11S2002, D11S1984, and TH (11pq); D13S325 (13q); D14S617 and D14S587 (14q); D17S969 and D17S1290 (17q); D18S539, D18S976, and DCC (18pq); D20S1085 (20q); and D21S1440 (21q). Primers were synthesized by Biosource International (Camarillo, CA). Temperature cycling in a thermal cycler (Perkin Elmer, Foster City, CA) consisted of 2 minutes of incubation at 94°C, followed by 35 cycles of 40 seconds of denaturation at 94°C, 30 seconds of annealing at 55°C, and 40 seconds of denaturation at 72°C, followed by a final 10-minute extension at 72°C. The forward or an internal primer was subsequently end-labeled with 32P-dATP, and then incorporated into the appropriate polymerase chain reaction product by five additional cycles. The polymerase chain reaction products were fractionated on a denaturing 6% polyacrylamide gel and visualized by autoradiography. Phosphorimage analysis (SLFluor Imager and ImageQuant software; Molecular Dynamics, Sunnyvale, CA) was used to quantify each allele. The ratio of the two alleles for each tumor sample was calculated and normalized with respect to the ratio of the corresponding normal tissue. All analyses were performed in triplicate. Based on analyses of normal renal cortex and 10 CRCC cases previously determined to demonstrate AI on chromosome 3p, samples were considered to show AI if the normalized ratio of the two alleles in the tumor was greater than or equal to 1.50. Ratios 1.25 to 1.49 were regarded as indeterminate for AI, whereas ratios less than 1.25 were regarded as demonstrating maintenance of heterozygosity.
Testing for Mutations in the MET Oncogene
Exons 16, 17, 18, and 19 of the MET oncogene were amplified from genomic DNA using previously published primers. 32 The polymerase chain reaction products were isolated from a 2% agarose gel using silica gel matrix (Qiagen, Valencia, CA) and purified on a G50 fine Sephadex column (Sigma, St. Louis, MO). Direct sequencing of the purified polymerase chain reaction products was performed by the Sanger (dideoxy) method 33 on a PE377 automated sequencer (Perkin Elmer, Foster City, CA) and results were analyzed using Prism XL collection software (Applied Biosystems, Perkin Elmer).
Analysis for TFE3 Rearrangements
Southern blot analysis was used to identify novel patterns of restriction enzyme digestion in the 5′ end of TFE3 surrounding the published t(X;1) breakpoint region. 34 Based on a published TFE3 restriction map 34 and additional mapping data, three overlapping restriction enzyme fragments, each spanning the previously published t(X;1) breakpoints and collectively spanning most of the TFE3 coding region, were chosen to screen PRCC genomic DNA. The products of SacI, HindIII, and EcoRV/XbaI digests were analyzed by 0.75% agarose gel electrophoresis and ethidium bromide staining followed by transfer to nylon membranes. Expected fragment lengths for SacI, HindIII, and EcoRV/XbaI digests were 3.8 kb, 9.4 kb, and 10 kb, respectively. Each membrane was subjected to two separate hybridizations using 32P-dCTP-labeled TFE3 cDNA probes 5′ and 3′ to the translocation point. Bands were visualized by autoradiography. The 5′-TFE3 probe consisted of a 341-bp SacI-AlwN1 cDNA fragment from TFE3 exon 1 isolated from a 5′-TFE3 cDNA provided by Dr. G. von Kessel (Department of Genetics, University Hospital Nijmegan, the Netherlands). The 3′-TFE3 probe consisted of a 263-bp Pst-HindIII cDNA fragment spanning parts of exons 2 and 3 isolated from a 3′-TFE3 cDNA provided by Dr. R. Wilson (Department of Pathology and Laboratory Medicine, the University of Pennsylvania Medical Center, Philadelphia, PA).
Statistical Analysis
The distribution of gender between type 1 and type 2 PRCC cases was examined by Fisher’s exact test. The nonparametric Mann-Whitney test was used to compare the distributions of patient age and tumor size between type 1 and type 2 tumors as well as the relationship between tumor size and AI on 9p and 17q. The exact Wilcoxon rank sum test was used to compare the distributions of tumor stage and Fuhrman grade between type 1 and type 2 tumors. The frequencies of AI between CRCC and PRCC cases, as well as between type 1 and type 2 PRCCs, were compared using Fisher’s exact test. An exact one-sided Jonckheere-Terpstra trend test 35 permitted examination of the distribution of AI frequency on 9p and 17q with increasing and decreasing levels, respectively, of Fuhrman grade and tumor stage.
Because of relationships between PRCC tumor type and Fuhrman grade or tumor stage, the tests of association between AI frequency on 9p or 17q and tumor type required adjustment for Fuhrman grade and tumor stage. We have attempted to provide an adjusted analysis. In this study we were limited by both small numbers of patients distributed across the categories of grade and stage and lack of cases demonstrating AI in certain categories of grade and stage. Thus a simple adjusted analysis that used Mantel-Haenszel or Fisher’s exact test was performed. The optimal method of analysis would have been a multivariable regression but, because of the small patient numbers and distribution characteristics mentioned above, this modeling was not possible.
Because AI on 17q was observed at all Fuhrman grades, the Mantel-Haenszel test 36 was used to examine the grade-adjusted association between AI on 17q and PRCC tumor type. Because AI on 17q was not observed at all levels of tumor stage and AI on 9p was not observed at all levels of Fuhrman grade or tumor stage, the tests of association between AI frequency on these chromosome arms and PRCC type were restricted to the Fuhrman grades or stages in which AI was observed. Only cells in which AI was observed (see the shaded cells in Figure 5 ▶ ) contributed information to the test. The statistical algorithm that tested the association between AI and PRCC type, while adjusting for grade or stage, would have automatically dropped cells in which AI was not observed. The data in the contributing cells were pooled and then Fisher’s exact test was applied in these analyses.
Figure 5.

Association between AI on 9p or 17q and PRCC tumor type adjusting for Fuhrman grade or tumor stage. Cells in which AI was not observed do not contribute information to the test and thus were excluded from analysis. H, Maintenance of heterozygosity; +, Fisher’s exact test restricted to cells outlined in bold; *, Mantel-Haenszel test applied to examine the grade-adjusted association between AI on 17q and PRCC tumor type stratified by levels of Fuhrman grade; and #, Fisher’s exact test restricted to data pooled across cells outlined in bold.
All P values are two-sided, except where noted. Significance was set at 0.05. All statistical analyses were performed using either StatXact-4 (Cytel Corp., Cambridge, MA) or SPSS (SPSS Inc., Chicago, IL) statistical software.
Results
In this study, we sought to establish molecular genetic correlates for the type 1 and type 2 subtypes of PRCC recently defined histologically by Delahunt and Eble. 2 Figure 1 ▶ shows representative photomicrographs of type 1 and type 2 PRCC cases used in this study. We compared patient demographics and tumor characteristics between type 1 and type 2 PRCCs in our series of 35 cases (Table 1) ▶ . The patients with type 1 PRCC ranged in age from 27 to 76 years with a median age of 54 years and with a male:female ratio of 3.2:1. Patients with type 2 tumors ranged in age from 29 to 76 years with a median age of 69 years and a male:female ratio of 2.5:1. Statistical analysis demonstrated patients with type 2 PRCC to be significantly older than patients with type 1 tumors (P = 0.006) but not to differ with respect to gender (P = 1.0). Type 2 tumors were not significantly larger than type 1 tumors [median (range), 4.8 cm (1.5 to 8.5) versus 3.0 cm (1.2 to 9.5); P = 0.380]. Tumors of all levels of Fuhrman grade were present in the type 1 and type 2 groups; however, as a group, type 2 PRCC were of a significantly higher Fuhrman grade than type 1 tumors (P = 0.003). In both tumor types, tumor stage was limited to stage I or II with the exception of a single type 2 PRCC case that presented as a stage III lesion. As a group, type 2 tumors were of higher stage than type 1 tumors, although this difference did not reach statistical significance (P = 0.09). A previous study by Delahunt and Eble 2 similarly found type 1 PRCC to be of lower grade and stage than type 2 PRCC. In contrast to our findings, however, Delahunt and Eble 2 found patients with type 2 PRCC to be significantly younger than patients with type 1 PRCC, but only when the patients less than 40 years (versus more than 40 years) were examined separately. In addition, they initially found type 1 tumors to be significantly smaller than type 2 tumors 2 while we found no significant difference in tumor size between tumor types. A subsequent study by the same authors found no significant difference between patient age at presentation, sex, and primary tumor size between the two tumor types. 5
Figure 1.
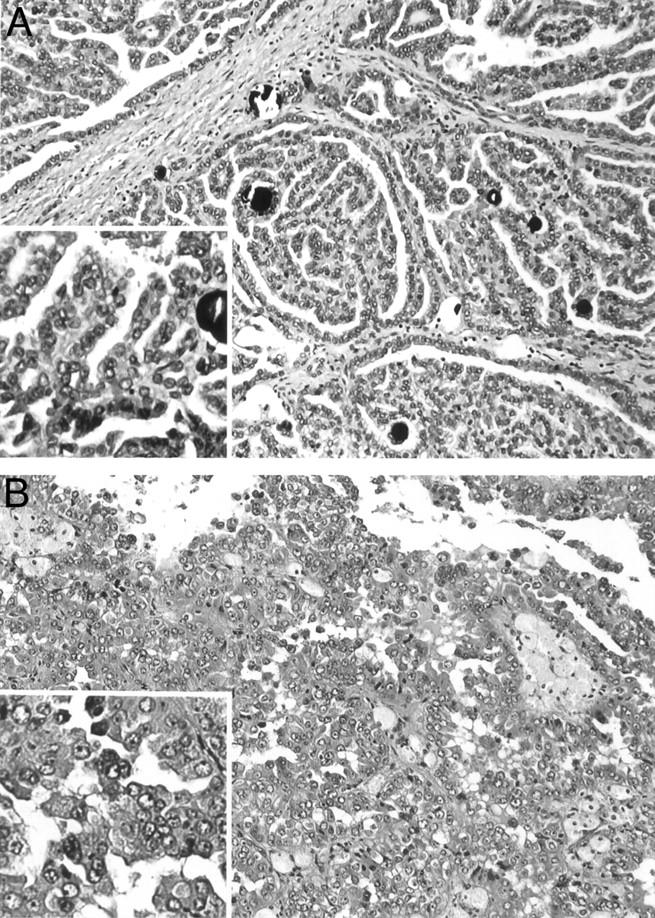
Histopathology of representative PRCC. A: Type 1 PRCC case 153 characterized by papillae covered by small tumor cells with scant pale cytoplasm and small nuclei. B: Type 2 PRCC case 173 characterized by papillae covered by large tumor cells with abundant eosinophilic cytoplasm and large nuclei with prominent nucleoli.
Table 1.
Patient and Tumor Variables by PRCC Tumor Type
| PRCC type 1 n = 21 | PRCC type 2 n = 14 | P value | |||||
|---|---|---|---|---|---|---|---|
| # | % | # | % | ||||
| Gender | |||||||
| Male | 16 | 76% | 10 | 71% | 1.000* | ||
| Female | 5 | 24% | 4 | 29% | |||
| Age, median (range) | 54 (27–76) | 69 (29–76) | 0.006† | ||||
| Tumor size, median (range) | 3.0 (1.2–9.5) | 4.8 (1.5–8.5) | 0.380† | ||||
| Fuhrman grade | |||||||
| 1 | 12 | 57% | 2 | 14% | 0.003‡ | ||
| 2 | 6 | 29% | 4 | 29% | |||
| 3 | 3 | 14% | 8 | 57% | |||
| Stage | |||||||
| I | 9 | 43% | 2 | 14% | 0.090‡ | ||
| II | 12 | 57% | 11 | 79% | |||
| III | - | 1 | 7% | ||||
*,Fisher’s exact test;
†, Mann-Whitney test; and
‡, exact Wilcoxon rank sum test.
We initially tested this series of sporadic type 1 (n = 21) and type 2 (n = 14) PRCC cases for two previously characterized alterations: TFE3 rearrangements and MET mutations. Using a Southern blot technique to assess the structure of the TFE3 locus, no TFE3 rearrangements were detected (data not shown). Sequence analysis of MET exons 16 to 19 identified a somatic mutation (M1149T) in exon 17 in 1 of 35 PRCC. This specific mutation was previously reported in PRCC. 10 Our case demonstrating M1149T was of type 1 histology, consistent with the previous report of Lubensky and colleagues 12 showing all PRCCs harboring MET mutations to be type 1. Based on our findings, we conclude that TFE3 rearrangements and MET mutations are infrequent events in sporadic PRCCs.
Subsequently, we used microsatellite analysis of 14 chromosome arms to investigate AI in the PRCC cases and to compare the results to similar testing of 20 CRCC cases with exclusively clear cell histology (Figures 3 and 4 ▶ ▶ , Table 2 ▶ ). In our study, the term AI is used to include both loss of heterozygosity and selective allelic gain/duplication. In particular, in cases in which the allele ratio in the tumor was markedly increased compared to the corresponding normal tissue (≥1.5) and both alleles were still detectable, we could not distinguish selective allelic gain/duplication from loss of heterozygosity in a sample with residual normal cellular elements.
Figure 3.

Results of microsatellite analysis in type 1 PRCC. X, Indeterminate; shaded box, AI; open boxes, retention of both alleles.
Figure 4.

Results of microsatellite analysis in type 2 PRCC. X, Indeterminate; shaded box, AI; open boxes, retention of both alleles.
Table 2.
Association Between Allelic Imbalance and Tumor Type.
| Chromosome | CCRC | PRCC | P value* | ||
|---|---|---|---|---|---|
| # | % | # | % | ||
| 3p | |||||
| H | 4 | 22.2 | 15 | 62.5 | 0.01 |
| AI | 14 | 77.8 | 9 | 37.5 | |
| 7q | |||||
| H | 17 | 94.4 | 12 | 57.1 | 0.01 |
| AI | 1 | 5.6 | 9 | 42.9 | |
| 9p | |||||
| H | 13 | 86.7 | 22 | 88.0 | 1.00 |
| AI | 2 | 13.3 | 3 | 12.0 | |
| 14q | |||||
| H | 14 | 73.7 | 20 | 90.9 | 0.22 |
| AI | 5 | 26.3 | 2 | 9.1 | |
| 17q | |||||
| H | 16 | 80.0 | 10 | 45.5 | 0.03 |
| AI | 4 | 20.0 | 12 | 54.5 | |
| 18q | |||||
| H | 16 | 84.2 | 15 | 65.2 | 0.29 |
| AI | 3 | 15.8 | 8 | 34.8 | |
| 20q | |||||
| H | 14 | 93.3 | 11 | 78.6 | 0.33 |
| AI | 1 | 6.7 | 3 | 21.4 | |
H, Maintenance of heterozygosity; AI, allelic imbalance.
*, Fisher’s exact test.
When comparing the results of AI testing between PRCCs and CRCCs, we found that PRCC cases had a significantly higher AI frequency than CRCC cases on 7q (42.9% versus 5.6%, P = 0.01) and 17q (54.5% versus 20.0%, P = 0.03) and lower AI frequency on 3p (37.5% versus 77.8%, P = 0.01). In contrast, AI on 9p, 14q, 18q, and 20q was not significantly different between PRCCs and CRCCs. These results are consistent with those reported in the literature, suggesting that the tumors in our series are representative of those assigned to these categories by other groups.
Subsequently, we compared the results of AI testing between type 1 and type 2 PRCCs (Table 3) ▶ . AI on 17q was the most frequent genetic change identified in PRCCs, and was seen in 78.6% of type 1 cases but only in a single type 2 case. AI on 9p was exclusive to type 2 tumors in our study and, therefore, the second genetic change likely to be useful in distinction of type 1 from type 2 tumors. Statistical analysis of these relationships revealed type 1 PRCC cases to have a significantly higher frequency of AI on 17q than type 2 cases (78.6% versus 12.5%, P = 0.006) and type 2 cases to have a significantly higher frequency of AI on 9p than type 1 cases (37.5% versus 0%, P = 0.02). Other notable findings include AI on 14q and 20q in 14.3% and 27.3% of type 1 tumors, respectively. These changes were not seen in any type 2 tumors. The number of cases showing AI on 14q and 20q is small, however, and a larger number of cases needs to be tested to validate the frequency and significance of these alterations in PRCCs. In contrast to the comparison of PRCC as a group to CRCC, there was no significant difference in AI frequency on 3p or 7q between type 1 and type 2 tumors. AI on 18q was of low frequency in both tumor types and differences did not reach statistical significance.
Table 3.
Association Between Allelic Imbalance and PRCC Tumor Type.
| Chromosome | PRCC type 1 | PRCC type 2 | P value* | ||
|---|---|---|---|---|---|
| # | % | # | % | ||
| 3p | |||||
| H | 10 | 58.8 | 5 | 71.4 | 0.67 |
| AI | 7 | 41.2 | 2 | 28.6 | |
| 7q | |||||
| H | 8 | 53.3 | 4 | 66.7 | 0.66 |
| AI | 7 | 46.7 | 2 | 33.3 | |
| 9p | |||||
| H | 17 | 100.0 | 5 | 62.5 | 0.02 |
| AI | 0 | 0.0 | 3 | 37.5 | |
| 14q | |||||
| H | 12 | 85.7 | 8 | 100.0 | 0.52 |
| AI | 2 | 14.3 | 0 | 0.0 | |
| 17q | |||||
| H | 3 | 21.4 | 7 | 87.5 | 0.006 |
| AI | 11 | 78.6 | 1 | 12.5 | |
| 18q | |||||
| H | 10 | 62.5 | 5 | 71.4 | 1.00 |
| AI | 6 | 37.5 | 2 | 28.6 | |
| 20q | |||||
| H | 8 | 72.7 | 3 | 100.0 | 0.55 |
| AI | 3 | 27.3 | 0 | 0.0 | |
H, Maintenance of heterozygosity; AI, allelic imbalance.
*, Fisher’s exact test.
Because of the relationship between PRCC type and Fuhrman grade or tumor stage (Table 1) ▶ , we investigated whether the relationship between AI on 17q or 9p and tumor type was independent of Fuhrman grade and tumor stage. Exact testing methods were used because of the small number of cases exhibiting AI on 17q (12 cases) and 9p (3 cases). When PRCC cases were examined as group, AI on 17q was observed in all levels of Fuhrman grade but was restricted to stage I and II tumors, whereas AI on 9p was restricted to Fuhrman grade 3 and stage II and III tumors (Table 4 ▶ and Figure 5 ▶ ). The frequency of AI on 9p increased with Fuhrman grade (P = 0.02), whereas the frequency of AI on 17q decreased with Fuhrman grade (P = 0.04). In addition, the frequency of AI on 9p increased with tumor stage (P = 0.05). Next we tested the association between AI on 9p or 17q and PRCC type across levels of Fuhrman grade and tumor stage (Figure 5) ▶ . Using the Mantel-Haenszel test to adjust for Fuhrman grade, a significant association between 17q AI and tumor type was still identified (P = 0.05). When the analysis was confined to stage I to II tumors, there was also a significant association between 17q AI and tumor type among those tumors in which AI on 17q was observed (P = 0.02). Similarly when analysis was restricted to stage II to III tumors, 9p AI remained significantly related to tumor type (P = 0.05). These findings suggest that the relationship between 17q and PRCC tumor type may also be independent of stage. The distribution of AI on 17q and 9p was also unrelated to tumor size (data not shown). The numbers of cases exhibiting AI on 17q and 9p in our study were small. Additional cases are required to perform multivariable analyses and thereby test definitively whether the association between 17q or 9p AI and PRCC tumor type is independent of Fuhrman grade or tumor stage. Because the tumors in our study are almost exclusively stages I and II, inclusion of more high-stage tumors in subsequent studies is also necessary before our findings can be considered applicable to high-stage PRCCs.
Table 4.
Association Between AI on 9p or 17q and Fuhrman Grade or Tumor Stage
| Fuhrman Grade | P value* | Stage | P value* | ||||||||||||
|---|---|---|---|---|---|---|---|---|---|---|---|---|---|---|---|
| 1 | 2 | 3 | I | II | III | ||||||||||
| # | % | # | % | # | % | # | % | # | % | # | % | ||||
| 9p | 9p | ||||||||||||||
| H | 9 | 100.0 | 8 | 100.0 | 5 | 62.5 | 0.02 | H | 8 | 100.0 | 14 | 88.0 | 0 | 0.0 | 0.05 |
| AI | 0 | 0.0 | 0 | 0.0 | 3 | 37.5 | AI | 0 | 0.0 | 2 | 12.0 | 1 | 100.0 | ||
| 17q | 17q | ||||||||||||||
| H | 2 | 25.0 | 2 | 33.0 | 6 | 75.0 | 0.04 | H | 2 | 33.0 | 7 | 47.0 | 1 | 100.0 | 0.27 |
| AI | 6 | 75.0 | 4 | 67.0 | 2 | 25.0 | AI | 4 | 67.0 | 8 | 53.0 | 0 | 0.0 | ||
H, Maintenance of heterozygosity; AI, allelic imbalance.
*, Exact one-sided Jonckheere-Terpstra trend test.
Discussion
We report the first microsatellite analysis to identify genetic differences between the proposed type 1 and type 2 PRCC subtypes, as defined by Delahunt and Eble. 2 Type 1 tumors are characterized by papillae and tubular structures covered by small cells with scant pale cytoplasm and small nuclei whereas type 2 tumors are characterized by papillae covered by large cells with abundant eosinophilic cytoplasm and large spherical nuclei with prominent nucleoli. In this study, we found AI on 17q to be almost exclusively confined to type 1 tumors and to be the genetic change most likely to distinguish type 1 from type 2 PRCCs (78.6% versus 12.5%, P = 0.006). In contrast, AI on 9p was unique to type 2 tumors (P = 0.02). Therefore, these findings indicate that most PRCCs can be characterized as type 1 or type 2 based on the AI patterns on 9p and 17q. We did note, however, that when all PRCCs were examined as a group, these AI alterations were significantly linked to Fuhrman grade and tumor stage (Table 4) ▶ . This finding was not surprising because, as defined by the histological criteria established by Delahunt and Eble, 2 type 1 tumors are generally of lower grade than type 2 tumors. However, after adjustment for Fuhrman grade and tumor stage, our findings suggest that the presence of AI on 17q in type 1 PRCC is independent of Fuhrman grade and tumor stage (Figure 5) ▶ . Because only one stage III tumor was tested in this study, the relationship between stage and AI on 17q in type 1 PRCC can be applied only to low-stage tumors at this time. Although our data further suggest AI on 9p in type 2 PRCC may also be independent of tumor stage, AI on 9p was only observed in two stage II tumors and one stage III tumor. Given this small number of cases demonstrating AI on 9p, definitive conclusions cannot be drawn with respect to AI on 9p and stage until testing of additional cases including those of higher stage can be performed. Recognizing that clinically significant differences in tumor stage reside in the division between stage II and stage III, future studies that include a wider range of tumor stages within the study population will also help determine the clinical implications of our molecular findings. These limitations withstanding, our data provide further genetic evidence that type 1 and type 2 PRCCs arise from divergent molecular genetic pathways.
An alternative hypothesis in which higher grade type 2 tumors arise from lower grade type 1 tumors is not supported by our data. According to this hypothesis, the genetic abnormalities in type 2 tumors would include those seen in type 1 tumors as well as additional alterations. In this study, we found AI on 17q in 78.6% (11 of 14) of type 1 tumors but only one type 2 tumor. Similarly, other alterations seen in type 1 tumors, including AI on 14q and 20q, were not observed in type 2 tumors. Although numbers are small, this finding is striking because AI on 14q and 20q have been previously associated with progression in several tumor types including CRCCs 37 and PRCCs, 7 respectively. If type 2 tumors arose from type 1 lesions, we would expect AI on 14q, 17q, and 20q to be more prevalent in type 2 PRCCs. Finally, if type 2 lesions arose from type 1, a spectrum of histological features spanning those of type 1 and type 2 lesions would be expected in most tumors. We did not see such a spectrum in any of our cases nor have any such cases been reported in the literature to our knowledge. The combined findings thus support the concept of divergent evolution for type 1 and type 2 PRCCs.
Our findings also suggest that alterations on chromosome 17 have an important role in the formation of a type 1 phenotype. Previous studies have demonstrated trisomy 17 to be one of the earliest genetic changes in PRCCs. Selective duplication of a gene(s) via trisomy 17 that would be detected in our study as AI on 17q may be integral to the type 1 PRCC phenotype. Balint and colleagues 38 have recently mapped a putative PRCC gene to chromosome 17q21.32 between loci D17S787 and D17S1799. They found that this 300-kb region was duplicated in 92% of 100 PRCCs with informative loci. Although this study did not report differences in histological features among cases with and without chromosome 17 duplication, we speculate that the few cases lacking 17q alterations may have been type 2. Because type 1 lesions are two to three times as frequent as type 2 tumors, the type 1 phenotype may be overrepresented in this series as in our current report. Our findings differ from those of Jiang and colleagues 4 who used a CGH approach and found gains of 17q in 100% of type 1 tumors (n = 9) and 68.8% of type 2 tumors (n = 16), respectively. In addition, they found a significant association between gains of 17p and type 1 phenotype (P < 0.01). 4 Studies of a larger number of PRCC cases using both CGH and genetic polymorphism methodologies are needed to further address these issues.
AI on 9p was exclusive to type 2 tumors in our study and the second genetic change useful in distinction of type 1 from type 2 PRCCs. In contrast, the CGH study by Jiang and colleagues 4 found no significant difference in 9p copy number changes among type 1 and type 2 tumors (44.4% versus 37.5%, P > 0.05). From our current data we cannot exclude the possibility that AI on 9p in type 2 tumors represents progression in a subset of type 2 tumors rather than an alteration that characterizes type 2 tumors collectively. Deletions at 9p21 of a currently uncharacterized gene(s) have been shown to be associated with tumor progression in other solid tumors and in PRCCs as a group. 6,39-42 Although Jiang and colleagues 4 found copy number changes on 9p to be more common in high-grade tumors, this relationship did not reach statistical significance.
There was no significant difference between type 1 and type 2 tumors with respect to AI on chromosome 7q (46.7% versus 33.3%, P = 0.66) indicating alterations of chromosome 7q are common to both PRCC types. Jiang and colleagues 4 also found no significant difference in 7q copy number changes among type 1 and type 2 tumors (66.7% versus 31.2%, P > 0.05). Although we did not examine AI on 7p, Jiang and colleagues 4 found a significant difference in 7p copy number changes among type 1 and type 2 tumors (100% versus 31.2%, P < 0.004), suggesting a relationship between 7p alterations and the type 1 phenotype. Other studies have demonstrated that AI on chromosome 7 results from selective duplication of chromosome 7 copies with mutations of the MET locus. 8 For this reason we restricted our analysis to 7q using microsatellite markers flanking the MET locus. In our series, only a single MET mutation (M1149T) was identified in a type 1 tumor. The frequency of MET (4.8% of type 1 tumors, 2.9% of all PRCCs) was slightly lower than the 5 to 13% published in previous series. 9 Our findings suggest that duplicated mutant MET is unlikely to have contributed to tumorigenesis in this sporadic series and implicate additional genes on chromosome 7q in the pathogenesis of PRCCs.
As demonstrated in other studies, we detected a higher frequency of 3p AI in CRCCs relative to PRCC tumors (77.8% versus 37.5%), respectively. Specifically, we found 3p AI in 7 of 17 (41.2%) type 1 and 2 of 7 (28.6%) type 2 tumors but did not find a significant difference between these frequencies (Table 2) ▶ . Although the percentage of cases demonstrating 3p AI in our series is slightly higher than previously published frequencies, 3p loss of heterozygosity in PRCCs has been found in ∼14% of PRCC cases published to date. 1,4,43-49 To support the premise that these tumors with AI on 3p represent true papillary tumors, we found that three such cases also showed AI on 7q and 17q (Figure 2) ▶ . Two of these tumors (tumors 11 and 12), were bilateral type 1 tumors with sarcomatoid features from a 27-year-old male. The third case (no. 153) additionally showed a MET mutation (M1149T), the only MET mutation detected in our series. To our knowledge this is the first report of the coexistence of a MET mutation and AI on 3p. In that the 3p alterations in PRCC have not been associated with VHL alterations, we hypothesize that other 3p loci may be involved in PRCC pathogenesis, as has previously been proposed for a subset of CRCC tumors.
Figure 2.

Results of AI testing in type 1 PRCC case 153. Microsatellite analysis of tumor and corresponding normal tissue demonstrated AI on chromosomes 3p (D3S 2409), 7q (not shown), and 17q (D17S 969) where T = tumor and N = normal tissue. The ratio of the two tumor alleles normalized for the corresponding ratio in normal tissue is shown below the autoradiograms.
In summary, our data provide a compelling argument that PRCC type 1 and type 2 tumors arise from divergent molecular genetic pathways. We found that most type 1 and type 2 PRCCs could be distinguished genetically based on AI patterns involving chromosome arms 17q and 9p. AI on 17q was almost exclusive to type 1 tumors whereas AI on 9p was exclusive to type 2 tumors. Although a larger number of cases is needed to perform a multivariable analysis, basic adjustments for stage and grade suggest that the relationship between 17q and PRCC tumor type is independent of Fuhrman grade and tumor stage, and that the relationship between 9p and tumor type may be independent of stage.
Footnotes
Address reprint requests to Frederic G. Barr, M. D., Ph.D., University of Pennsylvania Medical Center, Department of Pathology and Laboratory Medicine, 505 Stellar Chance Laboratories, 422 Curie Blvd., Philadelphia, PA 19104-6082. E-mail: barrfg@mail.med.upenn.edu.
Supported by grants from the American Cancer Society (PF-99-093-01-MGO to M. E. S.), National Cancer Institute Cancer Center (CA-16520-27 to R. M.), and The University of Pennsylvania Research Foundation (to M. E. S.).
Reported in part at the United States and Canadian Academy of Pathology Meeting, New Orleans, LA, March 2000.
Present address of M. E. S.: Vanderbilt University Medical Center, 1161 21st Ave. South, MCN C-3322, Nashville, TN 37232.
References
- 1.Kovacs G: Papillary renal cell carcinoma: a morphologic and cytogenetic study of 11 cases. Am J Pathol 1989, 134:27-34 [PMC free article] [PubMed] [Google Scholar]
- 2.Delahunt D, Eble JN: Papillary renal cell carcinoma: a clinicopathologic and immunohistochemical study of 105 tumors. Mod Pathol 1997, 107:537-544 [PubMed] [Google Scholar]
- 3.Thoenes W, Storkel W, Rumpelt HJ: Histopathology and classification of renal cell tumors (adenomas, oncocytomas and carcinomas). The basic cytological and histopathological elements and their use for diagnostics. Pathol Res Pract 1986, 181:125-143 [DOI] [PubMed] [Google Scholar]
- 4.Jiang F, Richter J, Schraml P, Bubendorf L, Gasser T, Sauter G, Mihatsch MJ, Moch H: Chromosomal imbalances in papillary renal cell carcinoma: genetic differences between histological types. Am J Pathol 1998, 153:1467-1473 [DOI] [PMC free article] [PubMed] [Google Scholar]
- 5.Delahunt B, Eble J, McCredie MRE, Bethwaite PB, Stewart JH, Bilous AM: Morphologic typing of papillary renal cell carcinoma: comparison of growth kinetics and patient survival in 26 cases. Hum Pathol 2001, 32:590-595 [DOI] [PubMed] [Google Scholar]
- 6.Thrash-Bingham CA, Greenberg RE, Howard S, Bruzel A, Bremer M, Goll A, Salazar H, Freed JJ, Tartof KD: Comprehensive allelotyping of human renal cell carcinomas using microsatellite DNA probes. Proc Natl Acad Sci USA 1995, 92:2854-2858 [DOI] [PMC free article] [PubMed] [Google Scholar]
- 7.Kovacs G, Fuzesi L, Emanuel A, Kung H: Cytogenetics of papillary renal cell tumors. Genes Chromosom Cancer 1991, 3:249-255 [DOI] [PubMed] [Google Scholar]
- 8.Fischer J, Palmedo G, Burgert P, Prayer-Galetti T, Pagano F, Kovacs G: Duplication and overexpression of the MET proto-oncogene in multiple hereditary papillary renal cell tumors. Oncogene 1998, 17:733-739 [DOI] [PubMed] [Google Scholar]
- 9.Schmidt L, Junker K, Weirich G, Glenn G, Choyke P, Lubensky I, Zhuang Z, Jeffers M, Vande Woude G, Neumann H, Walther M, Linehan WM, Zbar B: Two North American families with hereditary papillary renal cell carcinoma and identical novel mutations in the MET proto-oncogene. Cancer Res 1998, 58:1719-1722 [PubMed] [Google Scholar]
- 10.Schmidt L, Junker K, Nakaigawa N, Kinjerski T, Weirich G, Miller M, Lubenski I, Neumann HPH, Brauch H, Decker J, Vocke C, Brown JA, Jenkins R, Richard S, Bergerheim U, Gerrard B, Dean M, Linehan WM, Zbar B: Novel mutations of the MET proto-oncogene in papillary renal cell carcinomas. Oncogene 1999, 18:2343-2350 [DOI] [PubMed] [Google Scholar]
- 11.Jeffers M, Schmidt L, Nakaigawa N, Webb C, Weirich G, Kishida T, Zbar B, Vande Woude J: Activating mutations for the MET tyrosine kinase receptor in human cancer. Proc Natl Acad Sci USA 1997, 94:11445-11450 [DOI] [PMC free article] [PubMed] [Google Scholar]
- 12.Lubensky IA, Schmidt L, Zhuang Z, Weirich G, Pack S, Zambrano N, Walther MM, Choyke P, Linehan WM, Zbar B: Hereditary and sporadic papillary renal cell carcinomas with c-met mutations share a distinct morphological phenotype. Am J Pathol 1999, 155:517-526 [DOI] [PMC free article] [PubMed] [Google Scholar]
- 13.Glukhova L, Goguel A-F, Chudoba I, Angevin E, Pavon C, Terrier-Lacombe M-J, Meddeb M, Escudier B, Bernheim A: Overrepresentation of 7q31 and 17q in renal cell carcinomas. Genes Chromosom Cancer 1998, 22:171-178 [PubMed] [Google Scholar]
- 14.Hughson MD, Bigler S, Dickman K, Kovacs G: Renal cell carcinoma of end-stage renal disease: an analysis of chromosome 3, 7, and 17 abnormalities by microsatellite amplification. Mod Pathol 1999, 12:301-309 [PubMed] [Google Scholar]
- 15.Bentz M, Bergerheim USR, Li C, Joos S, Werner CA, Baudis M, Gnarra J, Merino MJ, Zbar B, Leinehan WM, Lichter P: Chromosome imbalances in papillary renal cell carcinoma and first cytogenetic data of familial cases analysed by comparative genomic hybridization. Cytogenet Cell Genet 1996, 75:17-21 [DOI] [PubMed] [Google Scholar]
- 16.Palmedo G, Fischer J, Kovacs G: Duplications of DNA sequences between loci D20S478 and D20S206 at 20q11.2 and between loci D20S902 and D20S480 at 20q13.2 mark new tumor genes in papillary renal cell carcinoma. Lab Invest 1999, 79:311-326 [PubMed] [Google Scholar]
- 17.Yoshida MA, Ochi-Takeuchi H, Gibas Z, Sandberg AA: Updating of chromosome changes in renal cell carcinoma. Proc Am Assoc Cancer 1985, 26:31a [Google Scholar]
- 18.De Jong B, Molenaar WM, Leeuw JA, Idenburg VJS, Oosterhuis JW: Cytogenetics of a renal cell carcinoma in a 2 year old child. Cancer Genet Cytogenet 1986, 21:165-169 [DOI] [PubMed] [Google Scholar]
- 19.Meloni AM, Dobbs RM, Pontes JE, Sandberg AA: Translocation t(X;1) in papillary renal cell carcinoma. A new cytogenetic subtype. Cancer Genet Cytogenet 1993, 65:1-6 [DOI] [PubMed] [Google Scholar]
- 20.Kardas I, Denis A, Babinska M, Gronwald J, Podolski J, Zajaczk S, Kram A, Lubenski J, Limon J: Translocation (X;1)(p11.2;q21) in a papillary renal cell carcinoma in a 14 year old girl. Cancer Genet Cytogenet 1998, 101:159-161 [DOI] [PubMed] [Google Scholar]
- 21.Shipley JM, Birdsdall S, Clark J, Crew J, Gill S, Linehan M, Gnarra J, Fischer S, Craig IW, Cooper CS: Mapping the X chromosome breakpoint in two papillary renal cell carcinoma cell lines with a t(X;1)(p11.2;q21.2) and the first reported female case. Cytogenet Cell Genet 1995, 71:280-284 [DOI] [PubMed] [Google Scholar]
- 22.Perot C, Bougaran J, Boccon-Gibod L, Storkel S, Leverger G, van den Akker J, Taillemite JL, Couturier J: Two new cases of papillary renal cell carcinoma with t(X;1)(p11.2;q21) in females. Cancer Genet Cytogenet 1999, 110:54-56 [DOI] [PubMed] [Google Scholar]
- 23.Dijuhuizen T, van den Berg E, Wilbrink M, Weterman M, Geurts van Kessel A, Storkel S, Folkers RP: Distinct Xp11.2 breakpoints in two renal cell carcinomas exhibiting X;autosome translocations. Genes Chromosom Cancer 1995, 14:43-50 [DOI] [PubMed] [Google Scholar]
- 24.Clark J, Yong-Jie L, Sidhar SK, Parker C, Gill S, Smedley D, Hamoudi R, Linehan WM, Shipley J, Cooper CS: Fusion of splicing factor genes PSF and NonO to the TFE3 gene in papillary renal cell carcinoma. Oncogene 1997, 15:2233-2239 [DOI] [PubMed] [Google Scholar]
- 25.Tomlinson GE, Nisen PD, Timmons CF, Schneider NR: Cytogenetics of a renal cell carcinoma is a 17 month old child. Evidence for Xp112 as a recurring breakpoint. Cancer Genet Cytogenet 1991, 57:11-17 [DOI] [PubMed] [Google Scholar]
- 26.Hernandez-Marti MJ, Orellana-Alonzo C, Badia-Garrabou L, Mirales AV, Paradis-Alos A: Renal cell carcinoma in an 8 year-old child with a t(X;17)(p11.2;q25). Cancer Genet Cytogenet 1995, 83:82-83 [DOI] [PubMed] [Google Scholar]
- 27.Argani P, Antonescu CR, Illei PB, Lui MY, Timmons CF, Newbury R, Reuter VE, Garvin AJ, Perez-Atayde AR, Fletcher JA, Beckwith JB, Bridge JA, Ladanyi M: Primary renal neoplasms with the ASPL-TFE3 gene fusion of alveolar soft parts sarcoma: a distinctive tumor entity previously included among renal cell carcinomas of children and adolescents. Am J Pathol 2001, 159:179-192 [DOI] [PMC free article] [PubMed] [Google Scholar]
- 28.Zattara-Cannoni H, Daniel L, Roll P, Coulange C, Vagner-Capodano A: Molecular cytogenetics of t(X;1)(p11.2;q21) with complex rearrangements in a renal cell carcinoma. Cancer Genet Cytogenet 2000, 123:61-64 [DOI] [PubMed] [Google Scholar]
- 29.Desangles F, Camparo P, Fouet C, Houlgatte A, Arborio M: Translocation (X;1) associated with a nonpapillary carcinoma in a young woman: a new definition for an Xp11.2 RCC subtype. Cancer Genet Cytogenet 1999, 113:141-144 [DOI] [PubMed] [Google Scholar]
- 30.Fuhrman SA, Lasky LC, Limas C: Prognostic significance of morphologic parameters in renal cell carcinoma. Am J Surg Pathol 1982, 6:655-663 [DOI] [PubMed] [Google Scholar]
- 31.von Eschenbach AC, Belldegrun A, Bracken RB, Brendler C, Glen JF, Graham SD, Grosman HB, Herr HW, McLeod DG, Montie JE, Murphy GP, Novick AC, Richie JP, Sardino PT, Skinner DG, Smith JA, Thompson IM, Wood DP: Kidney. Flemming ID Cooper JS Henson DE Hutter RVP Kennedy BJ Murphy GP O’Sullivan B Sobin LH Yarbro JW eds. AJCC Cancer Staging Handbook. 1998:pp 215-217 Lippincott-Raven, New York
- 32.Duh FM, Sacherer SW, Tsui LC, Lerman MI, Zbar B: Gene structure of the human MET proto-oncogene. Oncogene 1997, 15:1583-1586 [DOI] [PubMed] [Google Scholar]
- 33.Sanger F: Determination of nucleotide sequences in DNA. Science 1981, 214:1205-1210 [DOI] [PubMed] [Google Scholar]
- 34.Sidhar SK, Clark J, Gill S, Hamoudi R, Crew JA, Gwilliam R, Ross M, Linehan WM, Birdsdall S, Shipley J, Cooper CS: The t(X;1)(p112;q212) translocation in papillary renal cell carcinoma fuses a novel gene PRCC to the TFE3 transcription factor gene. Hum Mol Genet 1996, 5:1333-1338 [DOI] [PubMed] [Google Scholar]
- 35.Mehta C, Patel N: Cytel Software Corporation: Doubly ordered R × C contengency tables. StatXact 3 User Manual. 1995:pp 613-619 MA, Cytel Software Corp., Cambridge
- 36.Agresti A: Testing conditional independence. Categorical Data Analysis. 1990:pp 230-235 John Wiley and Sons, New York
- 37.Palmedo G, Fischer J, Kovacs G: Fluorescent microsatellite analysis reveals duplication of specific chromosomal regions in papillary renal cell tumors. Lab Invest 1997, 77:633-638 [PubMed] [Google Scholar]
- 38.Balint I, Fischer J, Ljungberg B, Kovacs G: Mapping the papillary renal cell carcinoma gene between loci D17S787 and D17S1799 on chromosome 17q21.32. Lab Invest 1999, 79:1713-1718 [PubMed] [Google Scholar]
- 39.Moch H, Presti JC, Jr, Sauter G, Buchholz N, Jordan P, Mihatsch MJ, Waldman FM: Genetic aberrations detected by comparative genomic hybridization are associated with clinical outcome in renal cell carcinoma. Cancer Res 1996, 56:27-30 [PubMed] [Google Scholar]
- 40.Schullerus D, Herbers J, Chudek J, Kanamura H, Kovacs G: Loss of heterozygosity at chromosomes 8p, 9p, and 14q is associated with stage and grade of non-papillary renal cell carcinomas. J Pathol 1997, 183:151-155 [DOI] [PubMed] [Google Scholar]
- 41.Kinoshita H, Yamada H, Ogawa O, Kakehi Y, Osaka M, Nakamura E, Mishina M, Habuchi T, Takahashi R, Sugiyama T: Contribution of chromosome 9p21-22 deletion to the progression of human renal cell carcinoma. Jpn J Cancer 1995, 86:795-799 [DOI] [PMC free article] [PubMed] [Google Scholar]
- 42.Schraml P, Muller D, Bednar R, Gasser T, Sauter G, Mihatsch MJ, Moch H: Allelic loss at the D9S171 locus on chromosome 9p13 is associated with progression of papillary renal cell carcinoma. J Pathol 2000, 190:457-461 [DOI] [PubMed] [Google Scholar]
- 43.Brooks JD, Bova GS, Marshall FF, Isaacs WB: Tumor suppressor gene allelic loss in human renal cancers. J Urol 1993, 150:1278-1283 [DOI] [PubMed] [Google Scholar]
- 44.El Naggar AK, Bastsakis JG, Wang G, Lee MS: PCR-based RFLP screening of the commonly deleted 3p loci in renal cortical neoplasms. Diagn Mol Pathol 1993, 2:269-276 [PubMed] [Google Scholar]
- 45.Presti J, Reuter V, Cordon-Cardo C, Mazumdar M, Fair W, Jhanwar S: Allelic deletions in renal tumors: histopathological correlations. Cancer Res 1993, 53:5780-5783 [PubMed] [Google Scholar]
- 46.Corless C, Aburatani H, Fletcher J, Houseman D, Amin M, Weinberg D: Papillary renal cell carcinoma: quantitation of chromosomes 7 and 17 by FISH, analysis of chromosome 3p for LOH, and DNA ploidy. Diagn Mol Pathol 1996, 5:53-64 [DOI] [PubMed] [Google Scholar]
- 47.Gnarra JR, Tory K, Weng Y, Schmidt L, Wei MH, Li H, Latif F, Liu S, Chen F, Duh FM, Lubensky J, Duan DR, Florence C, Potatti R, Walther MM, Bander NH, Grossman HB, Brach H, Pomer S, Brooks JD, Issacs WB, Lerman MI, Zbar B, Linehan WM: Mutations of the VHL tumor suppressor gene in renal cell carcinoma. Nat Genet 1994, 7:85-90 [DOI] [PubMed] [Google Scholar]
- 48.Hadaczek P, Podolski J, Toloczko A, Kurzawski G, Sikorski A, Rabbitts P, Huebner K, Lubenski J: Losses at 3p common deletion sites in subtypes of kidney tumors: histopathologic correlations. Virchows Arch 1996, 429:37-42 [DOI] [PubMed] [Google Scholar]
- 49.van der Hout AH, van den Berg E, van der Vlies P, Dijkhuizen T, Storkel S, Oosterhuis JW, de Jong B, Buys CH: Loss of heterozygosity at the short arm of chromosome 3 in renal cell cancer correlates with the cytological tumour type. Int J Cancer 1993, 53:353-357 [DOI] [PubMed] [Google Scholar]
- 50.Moch H, Schrami P, Bubendorf L, Richter J, Gasser T, Minhatsch M, Sauter G: Intratumoral heterogeneity of 3p deletions in renal cell carcinoma detected by fluorescence in situ hybridization. Cancer Res 1998, 58:2304-2309 [PubMed] [Google Scholar]