

Abstract
Age-related macular degeneration (AMD) is the major cause of blindness in the developed world. Its pathomechanism is unknown and its late onset, complex genetics and strong environmental components have all hampered investigations. Here we demonstrate the development of an animal model for AMD that reproduces features associated with geographic atrophy; a transgenic mouse line (mcd/mcd) expressing a mutated form of cathepsin D that is enzymatically inactive thus impairing processing of phagocytosed photoreceptor outer segments in the retinal pigment epithelial (RPE) cells. Pigmentary changes indicating RPE cell atrophy and a decreased response to flash electroretinograms were observed in 11- to 12-month-old mcd/mcd mice. Histological studies showed RPE cell proliferation, photoreceptor degeneration, shortening of photoreceptor outer segments, and accumulation of immunoreactive photoreceptor breakdown products in the RPE cells. An accelerated photoreceptor cell death was detected in 12-month-old mcd/mcd mice. Transmission electron microscopy demonstrated presence of basal laminar and linear deposits that are considered to be the hallmarks of AMD. Small hard drusen associated with human age-related maculopathy were absent in the mcd/mcd mouse model at the ages analyzed. In summary, this model presents several features of AMD, thus providing a valuable tool for investigating the underlying biological processes and pathomechanism of AMD.
Age-related macular degeneration (AMD), a disease of the area centralis or macula, is the leading cause of blindness in the elderly population of the developed world. 1,2 AMD is the final phase of age-related maculopathy and it develops either as dry AMD, geographic atrophy of the retinal pigment epithelium, or wet or neovascular AMD. 3-5 Some difficulties in studying AMD are its late onset, complex genetics, and the probable strong environmental component. 6 Recently, ABCR mutations 7 and the ApoE gene 8 were linked to AMD development, but such data require further investigation. 9-11 Although sibling studies suggest a genetic predisposition to AMD, 12 studies to date have failed to provide an indisputable link between a genetic mutation and AMD. 11,13
AMD has been proposed to be caused by a primary failure of the retinal pigment epithelial (RPE) cells because of abnormal build-up of photoreceptor outer segment (POS) breakdown products. 14 The non-renewable RPE cells form a single multifunctional cell layer responsible for phagocytosis and lysosomal digestion of the continuously growing POS. 15 Although presence of POS breakdown products in the RPE cells or its proximity cannot be directly linked to AMD development, there is compelling evidence to implicate lipofuscin, drusen and/or basal laminar and linear deposits as risk factors. 4,16 Accumulation of abnormal POS breakdown product in the RPE cells can be the result of a variety of impairments, ie, 1) RPE cell lysosomal abnormalities including loss or decrease of enzymatic activity, 17 2) changes in or related to POS structure, 18 or 3) obstruction of exocytosis because of changes in Bruch’s membrane (BM). 19 The exact role of different types of debris in AMD development is unknown but they seem to leadto a common pathway—apoptotic photoreceptor cell death. 20
In developing an animal model that might reproduce at least some features of AMD, the modulation of RPE cell lysosomal enzyme activity is an attractive approach. RPE cells have been shown to express strikingly high levels of cathepsin D (CatD), 21,22 suggesting an important role for CatD in POS digestion. Inactive proCatD accumulation seems to be an abnormal condition and has been associated with breast and ovarian cancers, 23 24 and an age-related increase in the amount of proCatD has been demonstrated in several organs. 25-27 Recently, we demonstrated in vitro and in vivo that presence of proCatD impairs POS proteolysis, resulting in POS-derived breakdown product accumulation in the RPE cells of heterozygous transgenic mice (mcd) that express a form of CatD lacking the Glu44p and Gly1 cleavage site. 28
We hypothesize that any change, genetic or environmental, that might lead to an accelerated POS breakdown product accumulation in the RPE layer will compromise RPE cell function, initiating changes similar to those observed in AMD. To test this hypothesis we produced a homozygous (mcd/mcd) transgenic mouse line and demonstrated that progressive POS-derived breakdown product accumulation could induce hypo- and hyperpigmentary changes in the fundus, the development of basal laminar and linear deposits and photoreceptor and RPE cell proliferation/loss in an age-dependent manner.
Materials and Methods
Generation of mcd/mcd Mice
Animal experimentation was performed in compliance with the Association for Research in Vision and Opthmology (ARVO) Statement for the Use of Animals in Ophthalmic and Vision Research. The 3.2-kb fragment containing the mutated CatD (CatDm1) gene with a two-amino acid deletion (Glu44p-Gly1) corresponding to the first cleavage site, and driven by the human cytomegalovirus promoter was released from pMCD. After two rounds of gel purification, the DNA fragment was microinjected into fertilized single-cell stage C57BL/6 embryos. The resultant offspring were screened for the presence of CatDm1 by polymerase chain reaction (PCR) and Southern blot analysis of mouse-tail DNA. First generation mcd mice 28 from the same founder were mated and the resultant mcd/mcd mice were bred to establish a stable line. Mcd/mcd and age-matched control C57BL/6 mice (6 to 18 months old) were used for subsequent characterization. All animals were maintained in cages at a constant temperature of 22°C and with a 12:12 hour light/dark cycle (light on at 0800 hours). Food and water were available ad libitum.
Fundus Photography
Mice were anesthetized by intraperitoneal injection of ketamine (50 mg/kg body weight) and xylazine (8 mg/kg body weight) before pupil dilation with a drop of 1.0% mydriacyl and 2.5% phenylephrine hydrochloride. Fundus photography of mice was performed using a small animal fundus camera (Kowa Genesis, Tokyo, Japan).
Electroretinography
Ten-month-old mcd/mcd and C57BL/6 mouse eyes were assessed using electroretinography as previously described, 29 but using flash stimulus at 0.25 Hz and four consecutive responses. Stimulus-response characteristics were generated by attenuating the flash intensity with neutral density filters. The a-wave amplitude was measured from the baseline to the trough of the a-wave response and the b-wave amplitude was measured from the trough of the a-wave to the peak of the b-wave. Data were expressed as the mean wave amplitude ±SEM (μV). Two-factor repeated measures analysis of variance was performed to compare the responses from retinas of mcd/mcd mice (n = 4) with those of control mice (n = 4) over the flash stimulus range. The b-wave data were fitted with a Naka-Rushton equation [R/Rmax = I/(I + K)] using SigmaPlot (SPSS, Chicago, IL.) to determine Rmax (maximum amplitude) and K (semisaturation constant) from the response amplitude (R) and the flash intensity (I) over the range of −6 to −1.2 log neutral density units.
Reverse Transcriptase (RT)-PCR
CatDm1 expression in the transgenic mice was detected by RT-PCR. Total retinal RNA from C57BL/6, mcd, and mcd/mcd were isolated using Trizol Reagent (Life Technologies, Inc., Gaithersburg, MD). A primer-specific one-step RT-PCR was performed with Qiagen One-Step RT-PCR Kit (Qiagen, Hilden, Germany) using 1 μg of total RNA plus a pair of CatDm1-specific primers, 5′-ATGCAGCCCTCCAGCCTTCT-3′ and 5′-TACTTGTGGTGGATCCAGCA-3′. A mouse hypoxanthine phosphoribosyl-transferase (HPRT) primer pair, 5′-CACAGGACTAGAACACCTGC-3′ and 5′-GCTGGTGAAAAGGACCTCT-3′, was used as positive control for quality of the RT and the amount of cDNA added to each PCR reaction. The cycles used were: 1 cycle at 50°C for 30 minutes and 95°C for 15 minutes; followed by 35 cycles of 94°C for 1 minute, 62°C for 1 minute, and 72°C for 1 minute.
Western Blot Analysis
Western blot analysis was performed as previously described. 22 Briefly, the mouse retina was homogenized in phosphate-buffered saline and loading buffer before being used for polyacrylamide gel electrophoresis. A mouse anti-human CatD mAb (Calbiochem, San Diego, CA), diluted 1/200, was used as the primary antibody and a goat anti-mouse IgG-horseradish peroxidase (Amersham, Uppsala, Sweden), diluted 1/2000, as the secondary antibody. The blots were developed with the ECL Western blotting analysis system (Amersham).
Histology and Immunohistochemistry
Enucleated mouse eyes were fixed in 4% paraformaldehyde (pH 7.4) for 4 hours and embedded in paraffin. Five-μm-thick sections of eyes from 11- to 14-month-old mcd/mcd and C57BL/6 mice were stained with hematoxylin and eosin (H&E) for light microscopy. Some eyes were embedded in OCT compound for frozen section preparation for fluorescence microscopy. For immunohistochemistry, sections were deparaffinized, rehydrated, and bleached to remove melanin by incubation of sections in 0.25% potassium permanganate for 20 minutes and in 1% oxalic acid for 5 minutes before incubation with rabbit anti-bovine rod outer segment (ROS) polyclonal IgG, rabbit anti-bovine CatD polyclonal IgG, mouse anti-human CatD mAb (Calbiochem) or control nonimmune serum (rabbit or mouse) diluted 1/200. Sections were incubated with goat anti-rabbit IgG conjugated with alkaline phosphatase (Life Technologies, Inc.) or goat anti-mouse IgG conjugated with alkaline phosphatase (Sigma, St. Louis, MO) diluted 1/100, followed by alkaline phosphatase substrate (Fast Red, Sigma). Sections were counterstained with Mayer’s hematoxylin for light microscopy.
Terminal dUTP Nick-End Labeling (TUNEL) Staining
Eyes from C57BL/6 (n = 4) and mcd/mcd (n = 4) mice were fixed in 10% neutral buffered formalin for 4 hours for paraffin embedding, followed by section preparation. The TUNEL technique was performed using ApopTag Plus Peroxidase in Situ Apoptosis Detection Kit (Intergen Discovery Products, Purchase, NY) according to the manufacturer’s protocol. From each control C57BL/6 and mcd/mcd retina, five 60-μm-long sections of the outer nuclear layer (ONL) were randomly selected under a light microscope (Leica DM RBE, Solms, Germany) using a ×100 objective lens and the images captured using an attached video camera (Olympus DP-10, Tokyo, Japan) and digitized. The total number of nuclei and total number of TUNEL-positive nuclei was counted using the Scion Image package (Scion Corp., Frederick, MA).
Electron Microscopy
Enucleated eyes from 12- to 18-month-old mcd/mcd and C57BL/6 mice were fixed in 2.5% glutaraldehyde in 0.05 mol/L of cacodylate buffer (pH 7.4). The eyes were then trimmed into 1-mm3 blocks and re-immersed into a fresh fixative for a further 24 hours. After postfixing in 1% osmium tetroxide, the tissues were processed for transmission electron microscopy by conventional methods and embedded in Araldite. Semithin sections (1 μm thick) were stained with 0.5% toluidine blue in 5% borax and examined with a light microscope. After selecting the areas of interest, the blocks were trimmed under a dissecting microscope and ultra-thin sections (70 nm thick) prepared on an ultramicrotome (LKB Nova, Sweden), stained with Reynolds lead citrate and examined in a Philips 410LS Transmission Electron Microscope at an accelerating voltage of 80 kV.
Results
Molecular Characterization of mcd/mcd Mice
Five transgenic founders, designated D2, D8, D28, D29, and D30, were generated and identified by PCR and Southern blot analysis from a total of 47 pups produced from microinjected eggs. D8, however, did not contain the cytomegalovirus promoter region, and D28, D29, and D30 failed to produce a positive transgenic offspring. Hence, only D2 was used to established stable mcd and mcd/mcd transgenic lines and only mcd/mcd mice were used in the subsequent characterization. 28 The level of CatDm1 expression in the retina was assessed by RT-PCR, immunohistochemistry, and Western blot analysis. From RT-PCR analysis using human CatDm1 transgene-specific primers, a 379-bp cDNA fragment of the human CatD was amplified in mcd/mcd mice, but not in age-matched C57BL/6 mice (Figure 1A) ▶ . The 260-bp HPRT bands had similar intensities, demonstrating equal loading of sample. As expected, the mRNA level of CatDm1 in mcd/mcd mice was higher than in mcd mice and no band was detected in the C57BL/6 mice. Western blot analysis demonstrated the presence of human proCatD, appearing at 52 kd, in mcd and mcd/mcd mice (Figure 1B ▶ , lanes 2 and 3). In addition, bands probably representing the human proCatD-opsin-like complex appeared at 75 kd in mcd and mcd/mcd mice. There were no human proCatD-immunoreactive bands present in the control C57BL/6 mice (Figure 1B ▶ , lane 1) demonstrating the lack of human CatD expression in these animals. Transgene expression was also confirmed by immunohistochemistry. Using the rabbit anti-bovine CatD polyclonal antibody, CatD-positive immunostaining was detected in the RPE cell layer of mcd/mcd and C57BL/6 mice (data not shown). However, using a mouse anti-human CatD mAb that was specific to human CatD, CatD-positive immunostaining was not observed in the C57BL/6 (Figure 1C) ▶ but was detected in mcd/mcd mice where it was localized to the cytoplasm of the RPE cells (Figure 1C) ▶ .
Figure 1.

Molecular characterization of the mcd/mcd mouse. A: RT-PCR of 12-month-old mcd/mcd, mcd, and C57BL/6 mice retinas showing presence of the 379-bp CatDm1 cDNA (arrow) and 260-bp HPRT cDNA (arrow) fragments. Lane 1, DNA marker; lane 2, C57BL/6; lane 3, mcd; lane 4, mcd/mcd. B: Western blot analysis of mouse retinae using a monoclonal anti-human CatD mAb. Lane 1, C57BL/6; lane 2, mcd; lane 3, mcd/mcd eyes. Human proCatD appeared at 52 kd in mcd and mcd/mcd eyes (arrowhead). Note: the appearance of a higher MW complex at 75 kd (arrowhead). C: Immunohistochemistry of human CatD using a monoclonal anti-human CatD mAb. CatD-positive signal was detected in the RPE cell layer (arrow) of the mcd/mcd mouse eye but not in the age-matched C57BL/6 eye. Original magnifications, ×1000.
Ophthalmological Examination
Fundus photography was performed on mcd/mcd (n = 17) and C57BL/6 (n = 17) mice every 1 to 2 months from the age of 6 months. In C57BL/6 mice, the fundus appeared normal and no changes were detected with progress in age (data not shown). In mcd/mcd mice, the fundus appeared normal up to 9 months (Figure 2A) ▶ after which light, pinkish-yellowish patches (Figure 2B) ▶ , suggestive of retinal atrophy (Figure 4, C and D) ▶ , were detected in 16 (94%) of the mcd/mcd mice. A typical atrophy emerged at the peripheral part of the retina. The size of these patches increased with age, reaching a maximum size covering between 3 to 10% of the fundus at 10 to 12 months and remaining stable thereafter (Figure 2C ▶ , Table 1 ▶ ). In addition to these patches, multiple small yellowish spots (probably pigmentary disturbance) in the periphery and at the posterior pole were also observed and their numbers increased with age around 18 months. In three 18-month-old mice, these small yellowish spots were scattered throughout the retina (Figure 2C ▶ , Table 1 ▶ ). At the same time, signs of hyperpigmentary changes were also noted (Figure 2, B and C) ▶ .
Figure 2.

Fundus photography of a typical mcd/mcd mouse retina at 9, 11, and 18 months of age. A: Normal fundus with no pigmentary changes. B: Presence of a hypopigmentary region (black thick arrow) and hyperpigmentation (white arrows) in the peripheral retina. C: No change in the size of the area of hypopigmentation (black thick arrow) but many small yellowish dots (thin black arrows) and hyperpigmentation (white arrows) were scattered throughout the retina.
Figure 4.
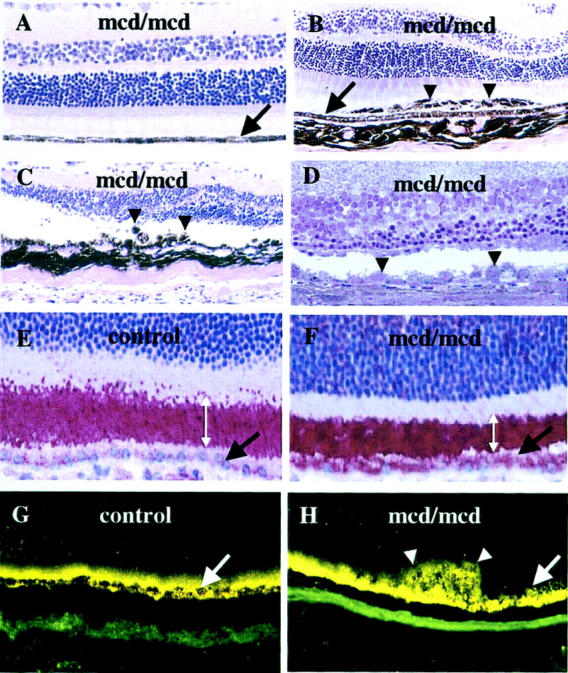
Light microscopy of 12-month-old mcd/mcd (A–C and E–H) and C57BL/6 (A–C and E–H) mouse and an 18-month-old mcd/mcd (D) retinae. The RPE layer in each figure is indicated by a black or white arrow. A: Morphology of the normal region of an mcd/mcd mouse retina. B: Morphology of mcd/mcd mouse retina showing abnormal layers of pigmented cells (arrowheads). C: Abnormal hyper- and hypopigmented RPE cells (arrowheads) in mcd/mcd mouse retina and thinning of photoreceptor layer above the abnormal RPE cells. D: Toluidine blue-stained resin section showing abnormal RPE cells (arrowheads) and thinned photoreceptor cell layers (note: the area centralis is on the left side of the micrograph) (original magnification, ×200). E: ROS-immunohistochemistry of C57BL/6 mouse retina. F: ROS-immunohistochemistry of mcd/mcd mouse retina (note the shortening of the ROS and ROS-immunoreactivity localized in the RPE cells). Width of ROS is indicated by double-headed white arrows. G: Fluorescent microscopy of retinas of C57BL/6. H: mcd/mcd mouse. Note the higher fluorescent signal in the RPE cells and in the clumped cells (white arrow) (original magnification, ×400).
Table 1.
Summary of Ophthalmic, Histological, and Immunohistochemical Analysis of mcd/mcd Mice
| Examination | Age (months) | Observation (no. of eyes) | ||||
|---|---|---|---|---|---|---|
| Fundus photography | mcd/mcd 6 | Hypopigmentation | Hyperpigmentation | Yellow Dots | ||
| 0/34 | 0/34 | 0/34 | ||||
| 10/12 | 32/34 | 32/34 | 0/34 | |||
| 18 | 6/6 | 6/6 | 4/6 | |||
| Histology | mcd/mcd 6 | RPE proliferation | RPE clumping | ONL thinning | ||
| 0/8 | 0/8 | 0/8 | ||||
| 10/12 | 10/10 | 7/10 | 4/10 | |||
| 18 | 4/4 | 4/4 | 4/4 | |||
| IHC (anti-BROS Ab) | mcd/mcd 12 | Strong staining in RPE | POS shortening | |||
| 3/3 | 3/3 | |||||
RPE; retinal pigment epithelium; ONL, outer nuclear layer; IHC, immunihistochemistry; anti-BROS Ab, bovine rod outer segment antibody; POS, photoreceptor outer segment.
Electroretinography
As a consequence of the geographic distribution of photoreceptor degeneration and the constant rod/cone ratio throughout the mcd/mcd mouse retinas, retinal function/dysfunction could be assessed easily by full-field electroretinography in this transgenic mouse model. Typical flash ERGs recorded from four dark-adapted 12-month-old mcd/mcd and four C57BL/6 eyes are shown in Figure 3A ▶ . The negative a-wave was generated by hyperpolarization of the photoreceptors and the positive b-wave resulted from depolarization of outer nuclear bipolar cells. The waveform of the experimental response was similar to that of C57BL/6 mice but the amplitude of the response was much smaller. A two-way repeated measures analysis of variance of the stimulus-response characteristics demonstrated a significant (P < 0.01) difference in the a-wave amplitude between the C57BL/6 and mcd/mcd mice. Post hoc Bonferroni tests revealed a significant (P < 0.001, n = 4) suppression of the a-wave response at all flash intensities greater than −1.2 log neutral density units (Figure 3B) ▶ . Figure 3C ▶ shows the significant difference (P < 0.01) between the stimulus intensity b-wave response characteristics of the C57BL/6 and mcd/mcd mice. The b-wave amplitude was significantly attenuated (P < 0.002, n = 4) in mcd/mcd mice at all flash intensities greater than −3 log neutral density units.
Figure 3.

Electroretinographic measurement of retinal function in 12-month-old experimental mcd/mcd and C57BL/6 mice. A: Typical scotopic ERGs recorded from C57BL/6 and mcd/mcd mice. B: Intensity response characteristics of the dark-adapted ERG a-wave amplitude recorded from four C57BL/6 and four mcd/mcd mouse eyes. Data are mean values ±SEM. *, P < 0.001. C: Intensity response characteristics of dark-adapted ERG b-wave amplitude recorded from four C57BL/6 and four mcd/mcd mouse eyes. Data are mean values ±SEM. *, P < 0.002. The inset shows a Naka-Rushton curve fit of the dark-adapted ERG b-wave stimulus-response characteristics. Data are mean values ±SEM, n = 4. R2 = 0.992 (C57BL/6), 0.930 (mcd/mcd). D: The leading edges of the normalized, dark-adapted, ERG a-waves averaged from four C57BL/6 and four mcd/mcd mouse eyes.
A Naka-Rushton equation was fitted to the b-wave stimulus response curves (Figure 3C ▶ , inset) for flash intensities up to −1.2 log neutral density units. 30 The Rmax value (±SEM) of 370 ± 29 μV for mcd/mcd mice was significantly lower than the C57BL/6 mice value of 740 ± 73 μV (P < 0.005). Similarly, a significant reduction in retinal sensitivity of 0.85 log neutral density units was seen in mcd/mcd mice. The calculated values of log K were −3.30 ± 0.08 (C57BL/6, n = 4) and −2.45 ± 0.23 neutral density units (mcd/mcd, P < 0.05, n = 4). The kinetic properties of the maximum intensity, dark-adapted a-waves recorded from four control and four mcd/mcd eyes were analyzed to assess rod phototransduction. The leading edges of the a-waves were normalized to the deepest a-wave trough 31 and the averaged responses plotted in Figure 3D ▶ . The averaged response recorded from mcd/mcd mice overlaps the averaged response recorded in control mice.
Histological Studies
Light microscopy of H&E-stained paraffin sections and toluidine blue-stained resin sections from 10- to 18-month-old mcd/mcd mice demonstrated that while the RPE cell layer appeared normal and continuous throughout the retina of C57BL/6 mice (data not shown) and most parts of the retina in mcd/mcd mice (Figure 4A) ▶ , areas of atrophy and hypertrophy were evident in mcd/mcd mice (Table 1) ▶ . These include clumps of pigmented cells in the subretinal space (Figure 4B ▶ , arrowheads) in the central or peripheral retina. The putative RPE cells beneath these pigmented cells were attenuated, enlarged, and sometimes less pigmented (Figure 4, B and C) ▶ . Obvious changes in the peripheral and central parts of the retina (Figure 4, C and D ▶ , respectively) were present. In some eyes, there were also regions where RPE cells were disorganized, swollen (Figure 4, C and D) ▶ , clumped (Figure 4C) ▶ , atrophic, or absent. The ONLs in these regions were also significantly thinner or sometimes missing (Figure 4D) ▶ with large stunted inner segments. In some parts, the outer segments were shortened or missing (Figure 4; C, D, and F) ▶ . Progressive degeneration of photoreceptors, thus sometimes aggressive thinning of the ONL became visible by 12 months with subsequent disappearance of the ONL by 18 months. In these animals some disorganization in the inner nuclear layers accompanied the disappearance of the ONL (Figure 4D) ▶ . However at 18 months of age the ganglion cell layer remained normal (data not shown).
ROS immunohistochemistry was performed to determine whether or not there was any abnormal ROS-immunoreactive breakdown product accumulation in the RPE cell layer of mcd/mcd mice. In C57BL/6 mice, ROS-positive immunostaining was localized predominantly to the ROS with weak immunostaining in the RPE (Figure 4E) ▶ . In mcd/mcd mice, the ROS were shortened (Figure 4, E and F ▶ , double-headed arrow) but they continued to demonstrate ROS-positive immunostaining (Figure 4F) ▶ . In addition, strong ROS-positive immunostaining was also detected in the cytoplasm of the RPE cells (Figure 4F ▶ , arrow). Fluorescence microscopy of frozen sections showed autofluorescent deposits resembling lipofuscin in the C57BL/6 and mcd/mcd mouse eyes (Figure 4, G and H) ▶ . Some increase in autofluorescent signal was detected in RPE cell layers of mcd/mcd mice (Figure 4H ▶ , white arrow) and the abnormal regions containing clumped, enlarged RPE cells were also autofluorescent (Figure 4H ▶ , white arrowheads).
Measurement of Photoreceptor Cell Death
There was a decrease in the average number of photoreceptor cell nuclei in mcd/mcd mice (131.33 ± 8.5) when compared to control age-matched C57BL/6 mice (145.50 ± 12.5) but this decrease was not statistically significant (P ≥ 0.05). However, compared to C57BL/6 mice (0.25 ± 0.16), there was a statistically significant increase in TUNEL-positive cells in the mcd/mcd mice (5.0 ± 0.81, P ≤ 0.001). Although the sections for counting were randomly selected, the number of TUNEL-positive cells varied between regions of normal and abnormal RPE cells in the mcd/mcd mice. The number of TUNEL-positive cells ranged from 0 to 4 in normal and 5 to 20 in abnormal RPE regions in mcd/mcd mice.
Transmission Electron Microscopy
Distinct differences between RPE cells of mcd/mcd and C57BL/6 mice were revealed by transmission electron microscopy. In unaffected areas of mcd/mcd mouse retinas, the cytoplasmic concentration and morphology of melanosomes in RPE cells was similar to those of control mice. Similarly, the convoluted border at the base of these cells did not deviate from normal. There were no deposits between the plasma membrane and the basal lamina of RPE cells while components of BM showed only minor focal undulations (Figure 5A) ▶ . The most obvious change in the RPE cells from the histologically affected areas in mcd/mcd mice was an increase in the number of cytoplasmic vacuoles, some of which possessed membranous aggregates at the periphery. Although melanosomes were more numerous in more than a few RPE cells, their concentration was obviously reduced in others when compared to those from C57BL/6 mice (data not shown). In a few instances, relatively large foci of poorly melanized granules were also found (Figure 5B) ▶ . The latter, moreover, were usually smaller than those seen in RPE cells from control mice. Lastly, several RPE cells displayed focal aggregates of lipid globules (data not shown). The most striking feature from mcd/mcd mice retinas was the presence of extensive deposits, which were situated between the plasma membrane and the basal lamina of RPE cells. These regions contained substantial subepithelial deposits whereas the basal in-foldings of the RPE cells were often distorted and the space between them expanded. These deposits, measuring from 50 nm to several μm in their maximal diameter, were often dissected by thin attenuated processes that extended from RPE cells (Figure 5C) ▶ . They contained bundles of filaments measuring 15 nm in diameter, collections of vesicles (50 to 90 nm in diameter), banded fibers with the periodicity of wide-spaced collagen (100 nm) (Figure 5D) ▶ , and membranous whorls (Figure 5, D and E) ▶ containing electron-dense granules and vesicles. Spherules of size varying from 0.2 to 9.5 μm were also seen in the central region of some of these deposits and many of these had coalesced into large aggregates and on occasion were insinuated between adjoining cells. The periphery of these spherules contained numerous electron dense spicules suggestive of calcium salts (Figure 5F) ▶ . The ultrastructural integrity of the components of BM appeared normal in most regions (Figure 5A) ▶ . The BM at the site of the basal laminar deposits, sometimes containing whorls (Figure 5E) ▶ , was often thickened because of increased collagenous matrix deposits. In these areas, vesicular structures (Figure 5E) ▶ and wide-spaced collagen were also observed.
Figure 5.
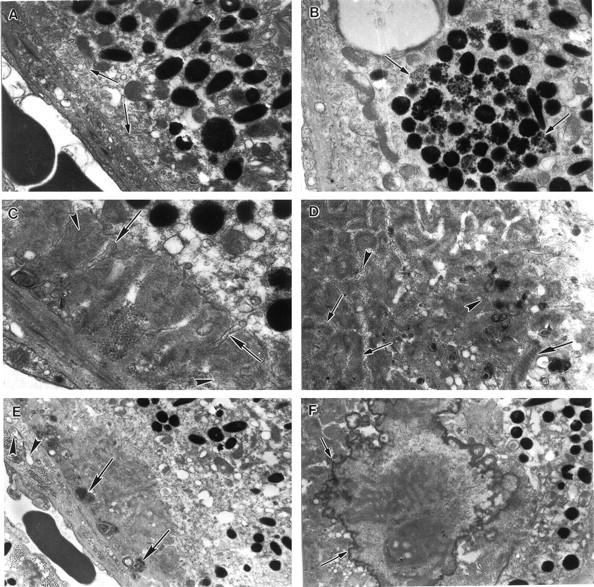
Electron micrographs of an 18-month-old mcd/mcd mouse retina. A: Electron micrograph of a relatively normal segment of the RPE cell layer in an as yet unaffected region of the mcd/mcd mouse. The basal infoldings are clearly seen (arrows). B: An RPE cell from the retina of the mcd/mcd mouse. Note the large focus of poorly melanized granules in the cytoplasm (arrows). C: An electron micrograph from an affected area of the mcd/mcd mouse. A subepithelial deposit consisting of filaments, granules, and osmiophilic matrix can be seen between the RPE plasma membrane and its basal lamina. Note the dissection of the deposit by attenuated processes from the RPE cell (arrows). Bundles of filaments can be observed within the deposit (arrowheads). D: In a similar area to C the deposit contains bundles of filaments (small arrows), vesicles (arrowheads), granules, and widely spaced collagen (large arrow). E: Another subepithelial deposit containing membranous whorls (arrows). BM appears to be slightly thickened and vacuoles can be seen beneath the basal lamina of the RPE cells (arrowheads). F: An electron micrograph of a large spherule in the mcd/mcd mouse retina. Electron dense spicules can be seen around the periphery of this inclusion (arrows). Original magnifications: ×11,600 (A); ×9900 (B); ×17,300 (C); ×12,720 (D); ×6100 (E); ×8800 (F).
In general, normal BM structures were present under normal-looking RPE cells in the mcd/mcd mouse (Figure 6A) ▶ . Detailed studies of the BM revealed a close correlation between the presence of atypical RPE cells and BM abnormalities. Some RPE cells demonstrated the beginning of debris accumulation between the plasma membrane and the basal lamina. This debris, resembling basal laminar deposit could reach a thickness up to 5 μm (Figure 5, C and E ▶ , and Figure 6B ▶ ). There were significant changes observed in the BM beneath the abnormal RPE cells demonstrating basal laminar deposits (Figure 6, B and C) ▶ . Sometimes these changes were limited to the loss of layered structure in the BM (Figure 6B ▶ , black arrows) but frequently the thickened membrane contained granular and vesicular material (Figures 5E and 6C ▶ ▶ , small arrows) resembling basal linear deposit.
Figure 6.

Electron micrograph of the Burch’s membrane in an 18-month-old mcd/mcd mouse. A: Electron micrograph of the BM beneath a normal RPE cell with the five individual layers of the membrane easily identifiable (black arrows). There is no obvious sign of debris between the plasma membrane and the basal lamina (asterisk). The thickness of the BM was 1.35 μm (black double-headed arrow). B: Demonstration of the accumulation of basal laminar deposit between the plasma membrane and the basal lamina underneath of an abnormal RPE cell. The space between the plasma membrane (black arrow) and the basal lamina (black arrow) filled with deposit, measuring 3.2 μm (black double-headed arrow). Note: the disorganization of the BM underneath the basal laminar deposit (black arrows). C: Demonstration of debris accumulation underneath the basal lamina in the BM. The thickness of the BM varies between 0.6 μm to 1.65 μm (black double-headed arrows). Note: the appearance of granular and vesicular material (black arrows) resembling of basal linear deposit. Original magnifications: ×16,300 (A); ×17,500 (B); ×23,400 (C).
Discussion
To our knowledge, this is the first study to develop a useful model for AMD, and particularly for geographic atrophy (GA), which assimilates most features of the human disease. The mcd/mcd mouse model produces a mutated form of CatD that is enzymatically inactive. The mcd/mcd mice express traits that resemble those present in AMD such as RPE pigmentary changes, attenuation, hyper- and hypoplasia, proliferation and atrophy of RPE cells, accumulation of basal laminar and linear deposits, and decreased retinal sensitivity. The AMD animal model development is particularly challenging as the causative agent, the genetic link, and the pathomechanism of AMD are unknown. In our effort to develop an AMD model, our basic hypothesis was that the primary cause of degeneration is the accumulation of abnormal quantities of photoreceptor breakdown products in RPE cells, impairing RPE function. 14 Whether or not the debris accumulation is caused by genetic mutations, aging, UV damage of the photoreceptors, failure of BM or the choroid, or a combination of these, all or any of above changes can lead to debris accumulation in the RPE cells compromising its normal function. Previous studies by this group and others suggested that compromising lysosomal enzyme function leads to undigested photoreceptor breakdown product accumulation in vitro and in vivo. 32-35 Although accumulation of inactive forms of CatD has been associated with various diseases, CatD has not been linked to any particular eye disease. Nevertheless, CatD has been shown to play an essential function in lysosomal processing of ROS. 21,36 Thus, it was expected that similar to other lysosomal enzymes, 32-34 compromising CatD activity would induce undigested photoreceptor breakdown product accumulation. Indeed in the mcd/mcd model, POS lysosomal processing was impaired 28 and AMD traits were demonstrated, suggesting that AMD is not necessarily a disease caused by a specific genetic mutation or a specific abnormality but it could be the consequence of a variety of changes associated with photoreceptor breakdown product accumulation.
There are several retinal features associated with and preceding AMD development such as RPE cell attenuation with depigmentation, hypertrophy and atrophy, 37,38 lipofuscin accumulation, 39,40 the presence of drusen, 5,41,42 basal laminar 5 and linear 4 deposits, and BM 19 and choroidal changes. 43 Recently several authors demonstrated the occurrence of debris accumulation similar to basal lamina in mice on high-fat diets. 44-46 However, these animals did not present other features of AMD such as pigmentary changes and the appearance of this debris did not result in progressive retinal degeneration. 44 One of the most significant features of the mcd/mcd model is a change in the regions of BM. Basal laminar and linear deposits have been strongly associated with AMD. 37,47 Basal laminar deposits consist of fibrillar, amorphous, and banded deposits located between the plasma membrane and the basal lamina of the RPE cells. The earliest manifestation of the disease is the appearance of fibrillar deposits. The banded form resembles long spacing collagen and it may be interspersed with membranous material. 5 Basal linear deposits are composed of vesicular material and granular material and are located between the basal lamina and the inner collagenous zone of the BM. 37 Data presented by Curcio and Millican 47 suggest that membranous debris is a lesion specific to age-related maculopathy and that soft drusen is the result of basal linear deposit build-up. There was a strong correlation between basal laminar deposit and the appearance of basal linear deposit in the mcd/mcd mouse. Both basal laminar and basal linear deposits were present in the mcd/mcd mouse model, although the BM thickening was less than that observed in human age-related maculopathy and there were no obvious changes in the choriocapillaris up to 12 months of age. To our knowledge the mcd/mcd mouse model is the first to demonstrate photoreceptor breakdown product-related development of basal laminar and linear deposits. Hence, the mcd/mcd mouse provides an excellent model to study the processes and pathways that drive the RPE cell changes seen.
In mcd/mcd mice, changes in the fundus appeared to be age-dependent. At around 10 to 12 months, pigmentary changes including mottled areas of hypopigmentation were detected in all animals, with some variation in size and location. These changes were strikingly similar to fundus changes observed in patients with GA in whom sharp areas of RPE cells atrophy were seen. 2,4 Although the presence of a few small hard drusen is not considered to be a pathological condition, it has been suggested that in large numbers they may lead to larger drusen development and subsequent complications, especially GA. 41 In our animal model, small hard drusen development did not precede the retinal changes observed with fundus photography and small hard drusen could not be detected up to the age of 18 month. In this respect the photoreceptor and RPE changes seen in the mcd/mcd mice are similar to those observed in some younger age-related maculopathy patients in whom hyperpigmentation appears without drusen (S and J Sarks, personal communication). It is thought that photoreceptor breakdown product accumulation in the RPE cells of mcd/mcd mice simply do not contain the specific materials that contribute to the formation of small hard drusen. The accumulation of autofluorescent photoreceptor-derived breakdown products, or lipofuscin, has been implicated in AMD development, 39,40 and recently a lysosomotropic amine which is a component of lipofuscin, 48 has been shown to induce the formation of cellular age pigments. In the normal RPE cells of the mcd/mcd mouse there was an increased accumulation of autofluorescent debris that was also present in abnormal RPE cells.
The wider distribution of retinal features has facilitated ERG examination of the mcd/mcd model. The relatively few studies available on ERG of AMD patients demonstrated abnormal rod-dominated ERGs. 49 Analysis of the dark-adapted electroretinogram of experimental mice revealed a significant reduction in the photoreceptor-generated a-wave amplitude. 49,50 This attenuation indicates the degeneration of photoreceptors that coincides with the increase in apoptotic photoreceptor nuclei. The presence of apoptotic photoreceptor nuclei and subsequent death of photoreceptor cells results in thinning of the ONL at 12 months. The thickness of the ONL at this age varied significantly. In one animal the ONL was completely missing whereas in some almost all layers were present. However, by the age of 18 months, the loss of photoreceptor cells was complete in the regions affected by changes in the RPE layer in all mcd/mcd eyes examined to date. Considering that fundus photography and histology did not show abnormalities in the mcd/mcd retinas up to the age of 10 to 12 months, these data tentatively support the threshold theory 14 in which it is proposed that a variety of gradual changes such as photoreceptor breakdown product accumulation, basal laminar and linear deposit formation, suddenly results in a cascading functional breakdown.
Interestingly, the similarity in the kinetics of the control and mcd/mcd a-waves suggests that the phototransduction mechanisms in the remaining photoreceptors are not affected by the accumulation of ROS debris. Similar findings have been reported in other models of mouse retinal degeneration including the nervous mutant 30 rds heterozygotes 50 and a transgenic mouse with a triple substitution in the rhodopsin molecule. 51 Figure 4C ▶ shows that a number of the outer segments of surviving photoreceptors are shortened in the mcd/mcd retina. Shortened outer segments would result in reduced photon capture. This histological observation is reflected in the decrease in retinal sensitivity (increased log K) of 0.85 log neutral density units that was seen in the experimental mice compared with the controls when a Naka-Rushton curve fit was applied to the b-wave amplitude data. Decreased rod sensitivity has also been described in abcr+/− mutant mouse model of AMD. 52 Moreover, abnormal rod-dominated electroretinograms have been reported in some patients with AMD. 49 These abnormalities include decreased b-wave amplitudes and increased log K values indicative of a reduction in retinal sensitivity similar to that observed in mcd/mcd mice.
In summary, the mcd/mcd model presents several features of AMD, including changes in the pigment epithelium and BM, which occur progressively with aging, and thus it will prove a valuable tool in the investigation of the underlying biological processes and pathomechanism of AMD.
Acknowledgments
We thank Drs. Meliha Brankov and Wei-Yong Shen (Lions Eye Institute) for their valuable comments, Ms Donna Pead (Sir Charles Gairdner Hospital) for maintaining the transgenic mouse colony, and Drs. Shirley Sarks and John Sarks (New South Wales) and Prof. Michael Boulton (Cardiff University) for their critical reading of the manuscript.
Footnotes
Address reprint requests to Prof. P. E. Rakoczy, Lions Eye Institute, 2 Verdun St., Nedlands, WA 6009, Australia. E-mail: rakoczy@cyllene.uwa.edu.au.
Supported by the National Health and Medical Research Council of Australia and Retina Australia.
The Lions Eye Institute is affiliated with The University of Western Australia.
References
- 1.Mitchell P, Smith W, Attebo K, Wang JJ: Prevalence of age-related maculopathy in Australia. The Blue Mountains Eye Study. Ophthalmology 1995, 102:1450-1460 [DOI] [PubMed] [Google Scholar]
- 2.Bressler NM, Bressler SB, Fine SL: Age-related macular degeneration. Surv Ophthalmol 1988, 32:375-413 [DOI] [PubMed] [Google Scholar]
- 3.Bird AC, Bressler NM, Bressler SB, Chisholm IH, Coscas G, Davis MD, de Jong PT, Klaver CC, Klein BE, Klein R: An international classification and grading system for age-related maculopathy and age-related macular degeneration. The International ARM Epidemiological Study Group. Surv Ophthalmol 1995, 39:367-374 [DOI] [PubMed] [Google Scholar]
- 4.Green WR: Histopathology of age-related macular degeneration. Mol Vis 1999, 5:27. [PubMed] [Google Scholar]
- 5.Sarks JP, Sarks SH, Killingsworth MC: Evolution of geographic atrophy of the retinal pigment epithelium. Eye 1988, 2:552-577 [DOI] [PubMed] [Google Scholar]
- 6.Zack DJ, Dean M, Molday RS, Nathans J, Redmond TM, Stone EM, Swaroop A, Valle D, Weber BH: What can we learn about age-related macular degeneration from other retinal diseases? Mol Vis 1999, 5:30. [PubMed] [Google Scholar]
- 7.Allikmets R, Shroyer NF, Singh N, Seddon JM, Lewis RA, Bernstein PS, Peiffer A, Zabriskie NA, Li Y, Hutchinson A, Dean M, Lupski JR, Leppert M: Mutation of the Stargardt disease gene (ABCR) in age-related macular degeneration. Science 1997, 277:1805-1807 [DOI] [PubMed] [Google Scholar]
- 8.Klaver CC, Kliffen M, Van Duijn CM, Hofman A, Cruts M, Grobbee DE, van Broeckhoven C, de Jong PT: Genetic association of apolipoprotein E with age-related macular degeneration. Am J Hum Genet 1998, 63:200-206 [DOI] [PMC free article] [PubMed] [Google Scholar]
- 9.Dryja TP, Briggs CE, Berson EL, Rosenfeld PJ, Abitbol M, Klaver CCW, Assink JJM, Bergen AAB, vanDuijn CM, Dean M, Allikmets R, Shroyer NF, Lupski JR, Lewis RA, Leppert M, Bernstein PS, Seddon JM: ABCR gene and age-related macular degeneration. Science Online 1998, 279:1107A [Google Scholar]
- 10.Stone EM, Webster AR, Vandenburgh K, Streb LM, Hockey RR, Lotery AJ, Sheffield VC: Allelic variation in ABCR associated with Stargardt disease but not age-related macular degeneration. Nat Genet 1998, 20:328-329 [DOI] [PubMed] [Google Scholar]
- 11.Yates JR, Moore AT: Genetic susceptibility to age related macular degeneration. J Med Genet 2000, 37:83-87 [DOI] [PMC free article] [PubMed] [Google Scholar]
- 12.Meyers SM: A twin study on age-related macular degeneration. Trans Am Ophthalmol Soc 1994, 92:775-843 [PMC free article] [PubMed] [Google Scholar]
- 13.de Jong PT, Bergen AA, Klaver CC, Van Duijn CM, Assink JM: Age-related maculopathy: its genetic basis. Eye 2001, 15:396-400 [DOI] [PubMed] [Google Scholar]
- 14.Hogan MJ: Role of the retinal pigment epithelium in macular disease. Trans Am Acad Ophthalmol Otolaryngol 1972, 76:64-80 [PubMed] [Google Scholar]
- 15.Bosch E, Horwitz J, Bok D: Phagocytosis of outer segments by retinal pigment epithelium: phagosome-lysosome interaction. J Histochem Cytochem 1993, 41:253-263 [DOI] [PubMed] [Google Scholar]
- 16.Bressler NM, Bressler SB, West SK, Fine SL, Taylor HR: The grading and prevalence of macular degeneration in Chesapeake Bay watermen. Arch Ophthalmol 1989, 107:847-852 [DOI] [PubMed] [Google Scholar]
- 17.Hayasaka S: Lysosomal enzymes in ocular tissues and diseases. Surv Ophthalmol 1983, 27:245-258 [DOI] [PubMed] [Google Scholar]
- 18.Cremers FP, van de Pol DJ, van Driel M, den Hollander AI, van Haren FJ, Knoers NV, Tijmes N, Bergen AA, Rohrschneider K, Blankenagel A, Pinckers AJ, Deutman AF, Hoyng CB: Autosomal recessive retinitis pigmentosa and cone-rod dystrophy caused by splice site mutations in the Stargardt’s disease gene ABCR. Hum Mol Genet 1998, 7:355-362 [DOI] [PubMed] [Google Scholar]
- 19.Starita C, Hussain AA, Pagliarini S, Marshall J: Hydrodynamics of ageing Bruch’s membrane: implications for macular disease. Exp Eye Res 1996, 62:565-572 [DOI] [PubMed] [Google Scholar]
- 20.Xu GZ, Li WW, Tso MO: Apoptosis in human retinal degenerations. Trans Am Ophthalmol Soc 1996, 94:411-430 [PMC free article] [PubMed] [Google Scholar]
- 21.Zimmerman WF, Godchaux W, III, Belkin M: The relative proportions of lysosomal enzyme activities in bovine retinal pigment epithelium. Exp Eye Res 1983, 36:151-158 [DOI] [PubMed] [Google Scholar]
- 22.Rakoczy PE, Sarks SH, Daw N, Constable IJ: Distribution of cathepsin D in human eyes with or without age-related maculopathy. Exp Eye Res 1999, 69:367-374 [DOI] [PubMed] [Google Scholar]
- 23.Bazzett LB, Watkins CS, Gercel-Taylor C, Taylor DD: Modulation of proliferation and chemosensitivity by procathepsin D and its peptides in ovarian cancer. Gynecol Oncol 1999, 74:181-187 [DOI] [PubMed] [Google Scholar]
- 24.Couissi D, Dubois V, Remacle C, Schonne E, Trouet A: Western immunoblotting and enzymatic activity analysis of cathepsin D in human breast cancer cell lines of different invasive potential. Regulation by 17beta-estradiol, tamoxifen and ICI 182,780. Clin Exp Metastasis 1997, 15:349-360 [DOI] [PubMed] [Google Scholar]
- 25.Rakoczy PE, Baines M, Kennedy CJ, Constable IJ: Correlation between autofluorescent debris accumulation and the presence of partially processed forms of cathepsin D in cultured retinal pigment epithelial cells challenged with rod outer segments. Exp Eye Res 1996, 63:159-167 [DOI] [PubMed] [Google Scholar]
- 26.Wiederanders B, Oelke B: Accumulation of inactive cathepsin D in old rats. Mech Ageing Dev 1984, 24:265-271 [DOI] [PubMed] [Google Scholar]
- 27.Wilcox DK: Vectorial accumulation of cathepsin D in retinal pigmented epithelium: effects of age. Invest Ophthalmol Vis Sci 1988, 29:1205-1212 [PubMed] [Google Scholar]
- 28.Zhang D, Lai C-M, Constable IJ, Rakoczy PE: A model for a blinding eye disease of the aged. Biogerontology 2002, 3:61-66 [DOI] [PubMed] [Google Scholar]
- 29.Shen WY, Lai MC, Beilby J, Barnett NL, Liu J, Constable IJ, Rakoczy PE: Combined effect of cyclosporine and sirolimus on improving the longevity of recombinant adenovirus-mediated transgene expression in the retina. Arch Ophthalmol 2001, 119:1033-1043 [DOI] [PubMed] [Google Scholar]
- 30.Ren JC, LaVail MM, Peachey NS: Retinal degeneration in the nervous mutant mouse. III. Electrophysiological studies of the visual pathway. Exp Eye Res 2000, 70:467-473 [DOI] [PubMed] [Google Scholar]
- 31.Pardue MT, McCall MA, LaVail MM, Gregg RG, Peachey NS: A naturally occurring mouse model of X-linked congenital stationary night blindness. Invest Ophthalmol Vis Sci 1998, 39:2443-2449 [PubMed] [Google Scholar]
- 32.Katz ML, Gao CL: Vitamin A incorporation into lipofuscin-like inclusions in the retinal pigment epithelium. Mech Ageing Dev 1995, 84:29-38 [DOI] [PubMed] [Google Scholar]
- 33.Ivy GO, Kanai S, Ohta M, Smith G, Sato Y, Kobayashi M, Kitani K: Lipofuscin-like substances accumulate rapidly in brain, retina and internal organs with cysteine protease inhibition. Adv Exp Med Biol 1989, 266:31-45 [DOI] [PubMed] [Google Scholar]
- 34.Rakoczy PE, Lai MC, Baines MG, Spilsbury K, Constable IJ: Expression of cathepsin S antisense transcripts by adenovirus in retinal pigment epithelial cells. Invest Ophthalmol Vis Sci 1998, 39:2095-2104 [PubMed] [Google Scholar]
- 35.Okubo A, Sameshima M, Unoki K, Uehara F, Bird AC: Ultrastructural changes associated with accumulation of inclusion bodies in rat retinal pigment epithelium. Invest Ophthalmol Vis Sci 2000, 41:4305-4312 [PubMed] [Google Scholar]
- 36.Regan CM, De Grip WJ, Daemen FJ, Bonting SL: Degradation of rhodopsin by a lysosomal fraction of retinal pigment epithelium: biochemical aspects of the visual process. XLI. Exp Eye Res 1980, 30:183-191 [DOI] [PubMed] [Google Scholar]
- 37.Green WR, Enger C: Age-related macular degeneration histopathologic studies. The 1992 Lorenz E Zimmerman Lecture. Ophthalmology 1993, 100:1519-1535 [DOI] [PubMed] [Google Scholar]
- 38.Bressler NM, Silva JC, Bressler SB, Fine SL, Green WR: Clinicopathologic correlation of drusen and retinal pigment epithelial abnormalities in age-related macular degeneration. Retina 1994, 14:130-142 [PubMed] [Google Scholar]
- 39.Delori FC, Goger DG, Dorey CK: Age-related accumulation and spatial distribution of lipofuscin in RPE of normal subjects. Invest Ophthalmol Vis Sci 2001, 42:1855-1866 [PubMed] [Google Scholar]
- 40.von Ruckmann A, Schmidt KG, Fitzke FW, Bird AC, Jacobi KW: Dynamics of accumulation and degradation of lipofuscin in retinal pigment epithelium in senile macular degeneration. Klin Monatsbl Augenheilkd 1998, 213:32-37 [PubMed] [Google Scholar]
- 41.Abdelsalam A, Del Priore L, Zarbin MA: Drusen in age-related macular degeneration: pathogenesis, natural course, and laser photocoagulation-induced regression. Surv Ophthalmol 1999, 44:1-29 [DOI] [PubMed] [Google Scholar]
- 42.Young RW: Pathophysiology of age-related macular degeneration. Surv Ophthalmol 1987, 31:291-306 [DOI] [PubMed] [Google Scholar]
- 43.Lutty G, Grunwald J, Majji AB, Uyama M, Yoneya S: Changes in choriocapillaris and retinal pigment epithelium in age-related macular degeneration. Mol Vis 1999, 5:35. [PubMed] [Google Scholar]
- 44.Miceli MV, Newsome DA, Tate DJ, JR, Sarphie TG: Pathologic changes in the retinal pigment epithelium and Bruch’s membrane of fat-fed atherogenic mice. Curr Eye Res 2000, 20:8-16 [PubMed] [Google Scholar]
- 45.Dithmar S, Sharara NA, Curcio Ca, Le NA, Zhang Y, Brown S, Grossniklaus HE: Murine high-fat diet and laser photochemical model of basal deposits in Bruch membrane. Arch Ophthalmol 2001, 119:1643-1649 [DOI] [PubMed] [Google Scholar]
- 46.Kliffen M, Lutgens E, Daemen MJ, de Muinck ED, Mooy CM, de Jong PT: The APO(*)E3-Leiden mouse as an animal model for basal laminar deposit. Br J Ophthalmol 2000, 84:1415-1419 [DOI] [PMC free article] [PubMed] [Google Scholar]
- 47.Curcio CA, Millican CL: Basal linear deposit and large drusen are specific for early age-related maculopathy. Arch Ophthalmol 1999, 117:329-339 [DOI] [PubMed] [Google Scholar]
- 48.Eldred GE, Lasky MR: Retinal age pigments generated by self-assembling lysosomotropic detergents. Nature 1993, 361:724-726 [DOI] [PubMed] [Google Scholar]
- 49.Holopigian K, Seiple W, Greenstein V, Kim D, Carr RE: Relative effects of aging and age-related macular degeneration on peripheral visual function. Optom Vis Sci 1997, 74:152-159 [DOI] [PubMed] [Google Scholar]
- 50.Cheng T, Peachey NS, Li S, Goto Y, Cao Y, Naash MI: The effect of peripherin/rds haploinsufficiency on rod and cone photoreceptors. J Neurosci 1997, 17:8118-8128 [DOI] [PMC free article] [PubMed] [Google Scholar]
- 51.Goto Y, Peachey NS, Ziroli NE, Seiple WH, Gryczan C, Pepperberg DR, Naash MI: Rod phototransduction in transgenic mice expressing a mutant opsin gene. J Opt Soc Am A 1996, 13:577-585 [DOI] [PubMed] [Google Scholar]
- 52.Mata NL, Tzekov RT, Liu X, Weng J, Birch DG, Travis GH: Delayed dark-adaptation and lipofuscin accumulation in abcr+/− mice: implications for involvement of ABCR in age-related macular degeneration. Invest Ophthalmol Vis Sci 2001, 42:1685-1690 [PubMed] [Google Scholar]