Abstract
Microtubule-associated proteins (MAPs) play important roles in the regulation of microtubule function in cells. We describe Arabidopsis thaliana MAP18, which binds to microtubules and inhibits tubulin polymerization in vitro and colocalizes along cortical microtubules as patches of dot-like structures. MAP18 is expressed mostly in the expanding cells. Cells overexpressing MAP18 in Arabidopsis exhibit various growth phenotypes with loss of polarity. Cortical microtubule arrays were significantly altered in cells either overexpressing MAP18 or where it had been downregulated by RNA interference (RNAi). The cortical microtubules were more sensitive to treatment with microtubule-disrupting drugs when MAP18 was overexpressed, but more resistant when MAP18 was eliminated in cells expressing MAP18 RNAi. Our study demonstrated that MAP18 may play a role in regulating directional cell growth and cortical microtubule organization by destabilizing microtubules.
INTRODUCTION
Microtubule-associated proteins (MAPs) play critical roles in controlling microtubule (MT) dynamics and organization and hence are involved in the regulation of cell expansion (Lloyd and Chan, 2002; Hussey et al., 2002; Wasteneys and Galway, 2003; Mathur, 2004; Sedbrook, 2004; Smith and Oppenheimer, 2005). Mutations in proteins interacting with MTs result in abnormal plant development and plant cell morphogenesis due to disruption of MT organization. For instance, mutations in MOR1/GEM1, which stabilizes cortical MTs, result in organ twisting and isotropic cell expansion in roots as a result of defects in MT organization and cytokinesis (Twell et al., 2001; Whittington et al., 2001). Mutation of Arabidopsis thaliana SKU6/SPIRAL1, which encodes a plus end–localized MT-interacting protein, causes right-handed axial twisting in roots, etiolated hypocotyls, leaf petioles, and strongly right-skewed root growth on inclined agar media (Sedbrook et al., 2004). The radial expansion defect is also observed in katanin mutants (Burk and Ye, 2002; Webb et al., 2002). RIC1, a novel MT binding protein interacting with ROP GTPase, promotes the organization of cortical MTs locally to inhibit outgrowth of the Arabidopsis pavement cells (Fu et al., 2005). Also, mutations in ATMAP65-1 and ATMAP65-3/PLEIADE result in expanded short root phenotypes resulting from defective cytokinesis (Muller et al., 2004; Smertenko et al., 2004).
Several MT binding domains in interacting proteins have been described. One domain is the repetitive K-K-E-E and K-K-E-I/V motifs, which were first identified in a neural MT-associated protein, MAP1B from mouse. This has no structural relationship with the MT binding domains of kinesin, MAP2, or Tau (Noble et al., 1989). Similar repetitive motifs have also been identified in plants (Figure 1). For instance, a pollen-specific expressed protein, SB401 from Solanum berthaultii, contains six repetitive domains of the sequence V-V-E-K-K-N/E-E (Liu et al., 1997) Another pollen-specific gene, ST901, isolated from a genomic library of the potato diploid species Solanum tuberosum cv Desiree, encodes a hydrophilic protein of 217 amino acid residues, which contains five imperfect repeated motifs of V-V-E-K-K-N/E-E (Hao et al., 2006). Other proteins, such as the pollen-specific Lys-rich protein SBgLR from S. tuberosum (Lang et al., 2004) and TSB from Solanum lycopersicum (Zhao et al., 2004), also contain such repetitive motifs. However, there is no evidence that these are truly plant MAPs.
Figure 1.
Comparison of the Protein Sequences of ST901 from S. tuberosum cv Desiree, SB401 from S. berthaultii, SBgLR from S. tuberosum, TSB from S. lycopersicum, and MAP18 from Arabidopsis.
All proteins contain the imperfect repeated motif of the sequence V-V-E-K-K-N/E-E (in gray).
Here, we report the identification of a plant MAP, MAP18 from Arabidopsis, which was identified by an Arabidopsis genome BLAST search using the sequence of V-V-E-K-K-N/E-E. MAP18 destabilizes MTs and plays an important role in the regulation of MT organization to determine plant directional cell growth.
RESULTS
Identification of the MAP18 Gene and Purification of the Recombinant Protein
A BLAST search of the Arabidopsis genome sequence identified a gene (At5g44610) located on chromosome 5, encoding a protein with unknown function and containing seven repeated motifs of V-E-E-K-K. The full-length cDNA sequence (CDS) encodes a predicted polypeptide of 168 amino acid residues, with an estimated molecular mass of 18.5 kD and a pI of 4.57. The gene has two exons (1 to 65 and 429 to 1104) and one intron (66 to 428) (www.arabidopsis.org). The coding region (445 to 951) is at the second exon (Figure 1).
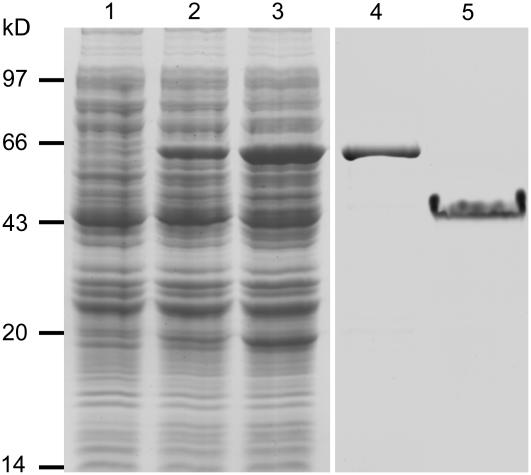
To characterize the activity of this protein on MTs, we cloned the full-length CDS into the pGEX-4T vector and transformed the plasmid into Escherichia coli. The expressed recombinant protein was then purified with a glutathione sepharose 4B resin column and analyzed using SDS-PAGE (Figure 2). The results indicate that purified recombinant protein was obtained. Although the predicated molecular mass of this protein is ∼18.5 kD, its apparent molecular mass on 10% SDS-polyacrylamide gel is ∼43 kD. Two possibilities may be considered for causing such reduction in mobility. First, both basic and acidic highly charged proteins show reduced mobility with SDS-PAGE (Kaufmann et al., 1984). Second, high levels of Pro content in proteins may also cause reduction of mobility on SDS-polyacrylamide gels (Harlow and Lane, 1998). This protein has a pI of 4.57 and 11.3% of Pro residues, suggesting both possibilities may account for the reduction in its mobility. In addition, both plant and animal proteins, such as SB401 (Liu et al., 1997) and MAP1B (Noble et al., 1989), with V-V-E-K-K-N/E-E repeats also show a similar reduction in mobility.
Figure 2.
Coomassie Blue–Stained Protein Gel of the Recombinant Protein Expression and Purification.
Lane 1, total extract from bacterial cells without MAP18 expression (25 μg); lane 2, total extract from bacterial cells for the protein expression without isopropylthio-β-galactoside (IPTG) induction (25 μg); lane 3, total extract from IPTG-induced bacterial cells for the protein expression (25 μg); lane 4, purified GST recombinant protein in eluate (25 μg); lane 5, purified recombinant protein after the removal of GST (4 μg).
MAP18 Binds to MTs in Vitro and Colocalizes with Cortical MTs in Vivo
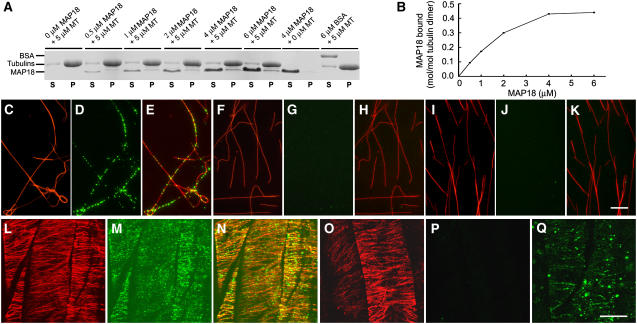
To address the question whether this protein is a MAP or not, we assessed the binding activity of the recombinant protein to taxol-stabilized MTs using cosedimentation experiments. Preformed taxol-MTs (5 μM) were incubated with various concentrations (0, 0.5, 1, 2, 4, and 6 μM) of the recombinant protein (glutathione S-transferase [GST] removed) and centrifuged after incubation. SDS-PAGE analysis of the pellets showed that the protein bound to and cosedimented with MTs (Figure 3A). Scanning of the SDS-PAGE gel showed that the mass of recombinant protein in the pellets increased as higher concentrations of recombinant protein were added, before reaching saturation (Figure 3B). The molar binding ratio of the recombinant protein to the tubulin dimer was estimated to be ∼0.4:1 at the saturation level. To further confirm that this protein binds to MTs, we raised its antibody and performed in vitro immunofluorescence labeling. Preformed rhodamine-labeled MTs stabilized with taxol were incubated with the recombinant protein. Samples were stained with the antibody and secondary antibody and observed on a CCD camera. The observations showed that the protein formed dot-like structures along MTs (Figures 3C to 3E), while no such structures were observed when the protein was denatured by boiling (Figures 3F to 3H) or stained with secondary antibody alone (Figures 3I to 3K). Thus, we conclude that this protein is capable of binding to MTs in vitro, and it was named MAP18.
Figure 3.
MAP18 Binds to MTs in Vitro and Colocalizes with Cortical MTs in Vivo.
(A) Recombinant MAP18 protein (GST removed) is cosedimented with 5 μM taxol MTs. Recombinant MAP18 protein appeared mainly in the supernatant (S) after the centrifugation in the absence of MTs and cosedimented with MTs into the pellets (P). BSA (6 μM) was used as a control.
(B) Quantitative analysis of the binding between MAP18 and MTs. The amounts of proteins in (A) were determined by gel scanning. The binding of recombinant MAP18 protein to MTs is saturated at a stoichiometry of ∼0.4 M MAP18 per mole of tubulin dimer, estimated by gel scanning.
(C) to (E) MAP18 forms dot-like structures along MTs. Preformed rhodamine-labeled MTs stabilized with taxol were incubated with MAP18 and then stained with anti-MAP18 antibody and a secondary antibody. (C) MTs, (D) MAP18, and (E) merged image of (C) and (D).
(F) to (H) No MAP18 signal was detected when MTs were incubated with denatured MAP18. (F) MTs, (G) MAP18, (H) merged image of (F) and (G).
(I) to (K) No MAP18 signal was detected when MAP18 was stained with the secondary antibody alone. (I) MTs, (J) MAP18, and (K) merged image of (I) and (J). Bar in (K) = 10 μm for (C) to (K).
(L) to (N) MAP18 colocalizes with cortical MTs in cells. Double immunofluorescence staining of cortical MTs and MAP18 was performed with root epidermal cells. (L) Cortical MTs, (M) MAP18, and (N) merged image of (L) and (M).
(O) to (Q) Staining with preimmune serum showed no detectable MAP18 signal in cells. (O) Cortical MTs, (P) MAP18, and (Q) linear-dotted pattern could still be seen in cells stained with anti-MAP18 antibody without MT labeling. Bar in (Q) = 10 μm for (L) to (Q).
To further investigate the localization of MAP18 in cells, we conducted double immunofluorescence microscopy to visualize both MAP18 and MTs in cells. Confocal microscopy observations showed that MAP18 formed dot-like structures both in the cytoplasm and the cortex of root epidermal cells. Close observation showed that such dot-like structures of MAP18 were colocalized with cortical MTs (Figures 3L to 3N). Staining of MAP18 with preimmune serum showed no MAP18 signal detected when MTs were double stained (Figures 3O and 3P). A linear-dotted pattern could still be seen in cells stained with anti-MAP18 antibody without MT labeling (Figure 3Q). Our observations demonstrated that MAP18 binds to MTs not only in vitro but also in vivo.
MAP18 Inhibits Tubulin Polymerization
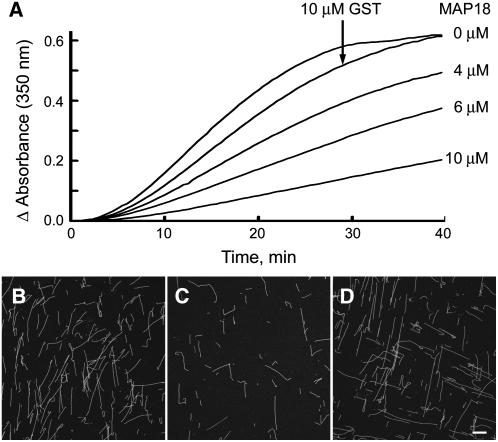
To investigate the effect of MAP18 on tubulin polymerization, turbidimetrical analysis was performed. Various concentrations of GST-MAP18 protein (0, 4, 6, and 10 μM) were added to a 40 μM tubulin solution and tubulin polymerization monitored turbidimetrically. Addition of MAP18 caused a decrease in turbidity, compared with lack of MAP18 or addition of 10 μM GST (Figure 4A), indicating that the MT mass was decreased in the presence of MAP18. At the same time, the polymerization rate was also decreased, which is indicated by the slope of the polymerization curves. Both the decrease in MT mass and polymerization rate occurred in a concentration-dependent manner.
Figure 4.
MAP18 Inhibits Tubulin Polymerization.
(A) Concentrations of 0, 4, 6, and 10 μM GST-MAP18 were added to a 40 μM tubulin solution. The turbidity of the mixture during the polymerization was monitored. Both tubulin polymerization rate and the mass of MTs in steady state of tubulin polymerization were decreased in the presence of MAP18, in a concentration-dependent manner. Addition of 10 μM GST had no effect on the mass of MTs in steady state of tubulin polymerization.
(B) and (C) MTs were polymerized in a 15 μM rhodamine-labeled tubulin solution in the presence and absence of MAP18. (B) Without MAP18; (C) in the presence of 10 μM GST-MAP18. Note that MTs were present as a single-filament pattern, and no MT bundles were observed in the presence of MAP18.
(D) In the presence of 10 μM GST.
Bar in (C) = 20 μm for (B) to (D).
To further confirm this result, MTs were polymerized from rhodamine-labeled tubulin in the presence and absence of MAP18. The observation showed that fewer MTs formed in the presence of 10 μM GST-MAP18 (Figure 4C) compared with MTs in the absence of MAP18 (Figure 4B). GST (10 μM), used as a control, had no effect on MT formation (Figure 4D). This observation is consistent with the results from the turbidimetrical analysis. Therefore, we conclude that MAP18 has an inhibitory effect on tubulin polymerization. In addition, our observations of MTs at various concentrations of MAP18 indicated that MTs were always present as single-filament patterns, and no MT bundles were observed (Figure 4C).
The Expression Pattern of MAP18
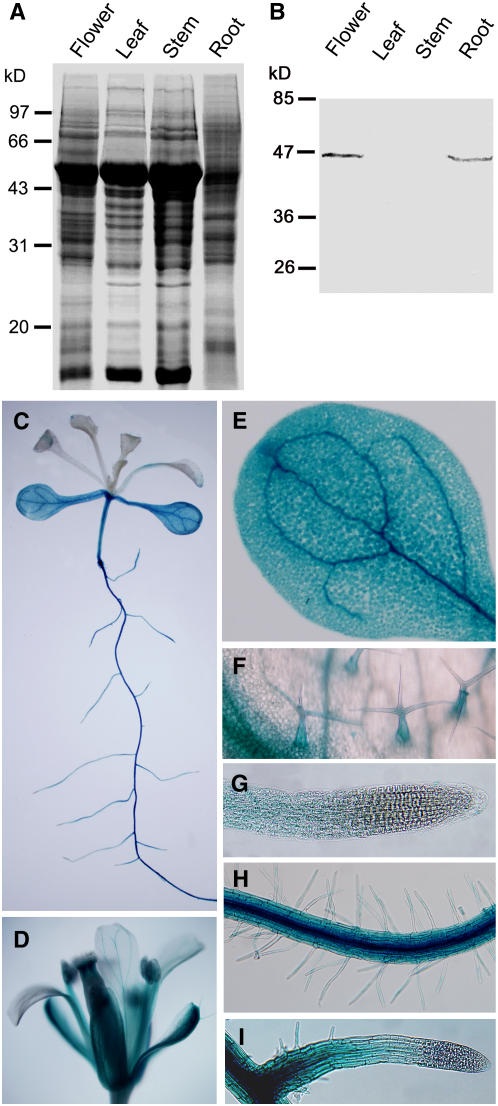
The data from the Affymetrix AG and ATH1 GeneChip arrays in the Genevestigator database (www.genevestigator.ethz.ch) indicate that MAP18 (At5g44610) is mainly expressed in the rapidly elongating region of root and flower tissues. To verify such information, protein gel blotting experiments were conducted to examine the protein in various tissues and organs of Arabidopsis. The protein gel blot analysis demonstrated that the antibody specifically recognized a protein band in protein extracts from roots and flower tissues but not in other organs or tissues (Figures 5A and 5B). The protein molecular mass of the band recognized by the antibody was ∼43 kD, similar with the recombinant MAP18 protein expressed in bacteria, which was also recognized by the antibody. Therefore, the experimental results indicated that the antibody specifically recognizes MAP18, and MAP18 is mainly expressed in root and flower tissues.
Figure 5.
MAP18 Expression in Arabidopsis Tissues and Organs.
(A) and (B) Protein gel blot analysis of total protein of Arabidopsis extracts. (A) Total seedling extract (27 μg) on 10% SDS-PAGE; (B) protein gel blot analysis of the gel in (A), with affinity-purified anti-MAP18 antibody, identified MAP18 in root and flower tissues.
(C) to (I) The analysis of GUS activity in the tissues and organs of transgenic Arabidopsis harboring an MAP18 promoter GUS gene fusion construct. (C) Whole seedlings, (D) flower, (E) cotyledon, (F) trichome, (G) primary root, (H) root hair, and (I) lateral root.
Furthermore, we transformed Arabidopsis with a MAP18 promoter:β-glucuronidase (GUS) gene fusion construct to determine the expression pattern of MAP18 in tissues and organs. Thirty-five transgenic lines were analyzed. GUS activity was detected in root (Figures 5C and 5G), flower (Figure 5D), cotyledon (Figures 5C and 5E), hypocotyls (Figure 5C), trichome stalks (Figure 5F), root hairs (Figure 5H), and lateral root (Figure 5I) but not in root tip and mature leaves (Figures 5C, 5G, and 5I). Our GUS experiment results were not fully consistent with the data of gene chip analysis in the Genevestigator database. GUS activity was detected both in elongation tissues and some mature tissues, suggesting that MAP18 may function during and after cell growth.
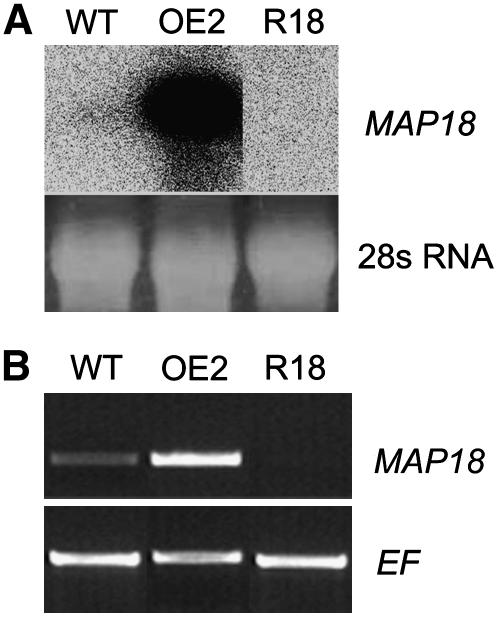
To analyze the in vivo function of MAP18 in Arabidopsis, both RNA interference (RNAi) and overexpressing transgenic plants were generated. Fifty-two lines of MAP18 RNAi and 12 lines of MAP18-overexpressing Arabidopsis were obtained. The MAP18 RNAi lines having cotyledon pavement cells with fewer extension lobes and shorter cell length, and MAP18-overexpressing lines with a root skewing phenotype were selected for further study. Nineteen lines of MAP18 RNAi Arabidopsis and six homozygous lines of MAP18-overexpressing Arabidopsis showing such phenotypes were selected and analyzed. Line 2 of MAP18-overexpressing Arabidopsis (OE2) and line 18 of MAP18 RNAi transgenic Arabidopsis (R18) were selected for cell and MT analysis. The transcription level of MAP18 was determined by RNA gel blots and RT-PCR analysis (Figure 6). The results indicated that MAP18 expression was considerably enhanced in the overexpressing lines and inhibited in the RNAi lines.
Figure 6.
Analysis of Lines of MAP18-Overexpressing and RNAi Transgenic Arabidopsis Plants Used in This Study.
(A) RNA gel blot analysis. OE2, line 2 of MAP18-overexpressing Arabidopsis; R18, line 18 of MAP18 RNAi transgenic Arabidopsis.
(B) RT-PCR analysis. EF4A was used as control.
Observation of the MT arrays of cells in the root tips showed that the mitotic index was not significantly affected in MAP18-overexpressing and RNAi Arabidopsis (Table 1), suggesting that MAP18 function is not required for cell division.
Table 1.
Percentages of the Four MT Arrays in Root Tip Cells of MAP18 Transgenic Arabidopsis
| Cortical MTs | Preprophase Band | Spindle | Phragmoplast | |
|---|---|---|---|---|
| Wild type (n = 2539) | 93.4% | 2.5% | 2.1% | 2% |
| OE2 (n = 1008) | 90% | 3.8% | 4.4% | 2.5% |
| R23 (n = 2058) | 94.6% | 2.1% | 1.4% | 1.9% |
The MT arrays in cells of 0.5-mm root tip from 15 roots of each line were observed by immunofluorescence microscopy. n = number of cells. OE2, line 2 of MAP18-overexpressing Arabidopsis; R23, line 23 of MAP18 RNAi transgenic Arabidopsis.
MAP18 Transgenic Arabidopsis Lines Show Abnormal Root Growth and Defects of Directional Cell Growth
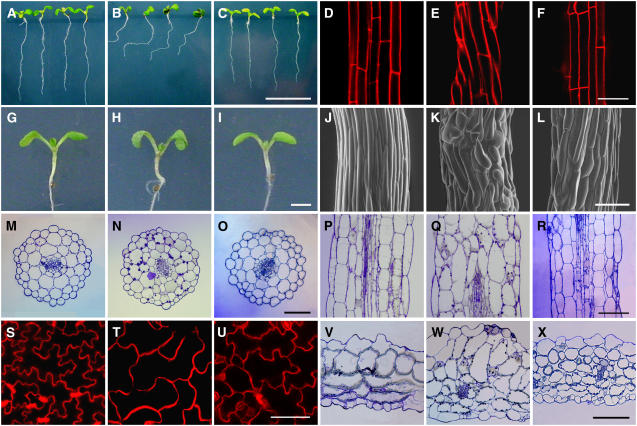
Examination of the transgenic Arabidopsis lines showed that overexpression of MAP18 gave rise to several abnormalities in root growth and cell directional expansion (Figure 7). The roots of MAP18-overexpressing Arabidopsis lines showed a left-handed skewing pattern when grown on the surface of Murashige and Skoog (MS) medium containing 1% agar (Figure 7B). The files of the root epidermal cells also exhibited a left-handed twist in these lines (Figure 7E). However, roots and root epidermal cell files showed no left-skewing and twisting growth in both wild-type and MAP18 RNAi lines (Figures 7A, 7C, 7D, and 7F).
Figure 7.
Defects in MAP18 Transgenic Arabidopsis.
(A) to (C) The root growth of wild-type (A), MAP18-overexpressing lines (B), and MAP18 RNAi transgenic lines (C). The root growth exhibited a pattern of left-handed skewing growth in MAP18-overexpressing lines but remained normal in MAP18 RNAi transgenic lines. Bar in (C) = 1 cm for (A) to (C).
(D) to (F) The epidermal cell files of wild-type (D), MAP18-overexpressing lines (E), and MAP18 RNAi transgenic lines (F) that were stained by propidium iodide (5 μg/mL). The files of the root epidermal cells exhibited a left-handed twist in MAP18-overexpressing lines. Bar in (F) = 50 μm for (D) to (F).
(G) to (I) Seedlings of the wild type (G), MAP18-overexpressing lines (H), and MAP18 RNAi transgenic lines (I). MAP18-overexpressing lines had shorter hypocotyls and curvier cotyledons than that of wild-type plants at the same age, while there were no significant changes in the MAP18 RNAi transgenic line. Bar in (I) = 1 cm for (G) to (I).
(J) to (L) Scanning electron microscopy images of hypocotyls of the wild type (J), MAP18-overexpressing lines (K), and MAP18 RNAi transgenic lines (L). Bar in (L) = 100 μm for (J) to (L).
(M) to (R) Cross and longitudinal sections of hypocotyls cells of the wild type ([M] and [P]), MAP18-overexpressing lines ([N] and [Q]), and MAP18 RNAi transgenic lines ([O] and [R]). Bars in (O) and (R) = 100 μm for (M) to (R).
(S) to (U) The cotyledon pavement cells of the wild type (S), MAP18-overexpressing lines (T), and MAP18 RNAi transgenic lines (U) that stained by propidium iodide (5 μg/mL). The cell lobes of MAP18-overexpressing lines were dramatically eliminated. In MAP18 RNAi transgenic lines, the cell lobes had much less extension, although the robe number remained the same compared with wild-type Arabidopsis. Bar in (U) = 100 μm for (S) to (U).
(V) to (X) Cross sections of cotyledon pavement cells of the wild type (V), MAP18-overexpressing lines (W), and MAP18 RNAi transgenic lines (X). Bar in (X) = 100 μm for (V) to (X).
Abnormal cell shapes were also observed in cells exhibiting anisotropic growth, such as hypocotyl cells and cotyledon pavement cells. Measurements of 7-d-old seedlings showed that MAP18 overexpression resulted in shorter hypocotyls, but there was no difference between MAP18 RNAi and wild-type plants in hypocotyl length (Figures 7G to 7I, Table 2). The observation of hypocotyls by scanning electron microscopy revealed that the epidermal cells of hypocotyls overexpressing MAP18 were spindle-shaped and formed a jagged surface (Figure 7K). On the other hand, the hypocotyl epidermal cells of MAP18 RNAi Arabidopsis showed a shorter and laterally expanded pattern (Figure 7L) compared with wild-type cells (Figure 7J). Further observation of the hypocotyl cells by cross and longitudinal section microscopy revealed an overall swelling pattern, and the cell layers were obviously disordered in MAP18-overexpressing Arabidopsis (Figures 7M to 7R). Measurements of hypocotyl epidermal cells showed that the cells of MAP18-overexpressing hypocotyls were shorter in length and wider (Table 2). Besides the epidermal cells, the cortex cells of MAP18-overexpressing hypocotyls were much fatter and in many cases had oblique end walls between them instead of vertical end walls in wild-type cells (Figures 7N and 7Q). Measurements also showed that cortex cells of MAP18-overexpressing line hypocotyls were also shorter in length and wider compared with the wild type (Table 2). However, the cortex cells of MAP18 RNAi hypocotyls showed no abnormality (Figures 7O and 7R), compared with the wild type (Figures 7M and 7P, Table 2).
Table 2.
The Size of Cotyledons, Hypocotyls, and Cells of MAP18 Transgenic Arabidopsis
| Transgenic Lines | Length of Hypocotyls (mm) | Length of Hypocotyl Epidermal Cells (μm) | Length of Hypocotyl Cortex Cells (μm) | Width of Hypocotyl Cortex Cells (μm) | Size of Cotyledon (mm2) | Cotyledon Pavement Cell
|
|||
|---|---|---|---|---|---|---|---|---|---|
| Lobe Number | Cell Length (μm) | Neck Width (μm) | Robe Length (μm) | ||||||
| Wild type | 1.5 ± 0.2 (n = 67) | 90.7 ± 20.9 (n = 97) | 91.3 ± 10.6 (n = 77) | 33.9 ± 4.8 (n = 77) | 3.2 ± 0.4 (n = 32) | 12 (n = 197) | 141.5 ± 10.9 (n = 145) | 28.9 ± 4.9 (n = 197) | 25.9 ± 4.7 (n = 79) |
| MAP18 overexpression | 1.2 ± 0.1 (n = 63) | 82.5 ± 23.6 (n = 97) | 62.0 ± 7.6 (n = 63) | 40.7 ± 5.9 (n = 63) | 2.9 ± 0.5 (n = 39) | 4.5 (n = 200) | 157.0 ± 20.0 (n = 210) | 23.8 ± 5.8 (n = 200) | 16.1 ± 2.7 (n = 272) |
| MAP18 RNAi | 1.5 ± 0.2 (n = 126) | 90.4 ± 12.9 (n = 82) | 90.7 ± 12.8 (n = 124) | 35.3 ± 3.9 (n = 103) | 3.8 ± 0.3 (n = 30) | 11 (n = 133) | 114.5 ± 9.5 (n = 380) | 26.4 ± 4.0 (n = 133) | 16.6 ± 1.9 (n = 80) |
Data are means ± se (number of measurements)
Mature pavement cells of Arabidopsis cotyledons usually have a jigsaw puzzle shape at their periphery. They have lobes intercalated with the neck of adjacent cells and thus display various sizes of radial diameter (Figure 7S). However, cotyledon pavement cells of Arabidopsis overexpressing MAP18 were longer in cell length and narrower at their necks than that of wild-type pavement cells (Table 2). The lobes of the cell were dramatically eliminated, resulting in nearly rectangular or spindle-like cells with straight-sided walls (Figure 7T, Table 2). In MAP18 RNAi transgenic Arabidopsis, the pavement cells of cotyledons also showed certain abnormalities. The lobes of the cell had much less extension, although the number of lobes remained almost the same, and the length of cells was much shorter compared with the wild type (Figure 7U, Table 2). Microscopy of cotyledon sections showed that cell shapes of not only epidermal but also cortex cells changed both in MAP18-overexpressing and MAP18 RNAi transgenic Arabidopsis, exhibiting a rounded pattern, with obviously disordered cell layers (Figures 7V to 7X). The cotyledons of MAP18-overexpressing Arabidopsis usually had a curved growth pattern (Figure 7H), while those of MAP18 RNAi transgenic Arabidopsis showed no abnormalities (Figure 7I) compared with the wild type (Figure 7G).
The Organization of Cortical MTs Is Affected in MAP18 Transgenic Arabidopsis Cells
The defects in root growth and cell directional expansion in MAP18 transgenic Arabidopsis, together with our analysis of the binding activity of MAP18 to MTs, suggested that MTs may be affected. To further address this question, we observed the cortical MTs in MAP18 transgenic Arabidopsis with a green fluorescent protein (GFP)–tubulin background or using immunofluorescence microscopy. Our observation showed that the organization of cortical MTs was significantly altered both in MAP18-overexpressing and RNAi Arabidopsis lines (Table 3).
Table 3.
MT Organization of Cotyledons, Hypocotyls, and Root Cells of MAP18 Transgenic Arabidopsis
| Transgenic Lines | Cotyledon Pavement Cell
|
Hypocotyl Epidermal Cell
|
Root Epidermal Cell
|
|||
|---|---|---|---|---|---|---|
| Random Orientation | Paralleled Orientation | Transverse Alignment | Oblique or Random Alignment | Transverse Alignment | Oblique or Random Alignment | |
| Wild type | 86.8% (n = 144) | 13.2% (n = 144) | 81.7% (n = 169) | 18.3% (n = 169) | 93.9% (n = 229) | 6.1% (n = 229) |
| MAP18 overexpression | 7.4% (n = 161) | 92.6% (n = 161)* | 2.8% (n = 218) | 97.2% (n = 218) | 32.4% (n = 139) | 67.6% (n = 139) |
| MAP18 RNAi | 4.7% (n = 212) | 95.3% (n = 212)** | 28.1% (n = 199) | 71.9% (n = 199) | 69.3% (n = 192) | 30.7% (n = 199) |
Data are percentages with cell number in parentheses. *, Orientated transversely against the long axis; **, orientated longitudinally against the long axis.
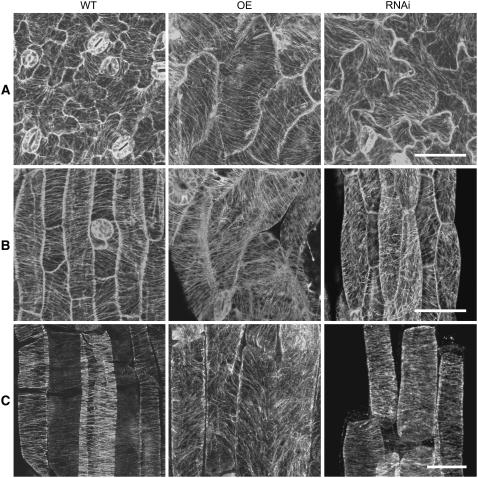
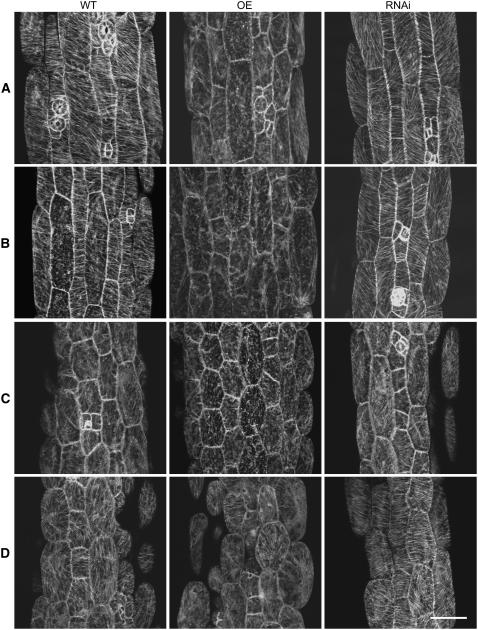
In mature cotyledon pavement cells of wild-type Arabidopsis, the cortical MTs usually formed a randomly oriented array and sometimes localized densely around the neck region (Figure 8A, left panel). However, in MAP18-overexpressing cotyledon pavement cells the cortical MTs were mostly organized into an array of parallel MTs orientated transversely against the long axis, a pattern often present in the earlier stages of pavement cell development (Figure 8A, middle panel). In cotyledon pavement cells of MAP18 RNAi Arabidopsis, the cortical MTs also exhibited an array of parallel MTs, although mostly along the long growth axis of the cell (Figure 8A, right panel).
Figure 8.
The Cortical MT Array Is Altered in MAP18-Overexpressing and MAP18 RNAi Lines.
(A) Cortical MTs of cotyledon pavement cells observed by confocal microscopy with MAP18-overexpressing and MAP18 RNAi transgenic lines with a GFP-tubulin background.
(B) Cortical MTs of hypocotyls epidermal cells observed by confocal microscopy with MAP18-overexpressing and MAP18 RNAi transgenic lines with GFP-tubulin background.
(C) Cortical MTs of root epidermal cells visualized by immunofluorescence microscopy.
Bars in (A) and (B) = 50 μm, and bar in (C) = 20 μm.
In wild-type hypocotyl epidermal cells, cortical MTs were usually organized into a parallel array, transversely oriented to the longitudinal growth axis (Figure 8B, left panel). However, only a small proportion of cells in MAP18-overexpressing and RNAi Arabidopsis hypocotyls had transversely parallel arrays of MTs (Table 3). Cortical MTs in hypocotyl epidermal cells of MAP18-overexpressing Arabidopsis (Figure 8B, middle panel) and MAP18 RNAi Arabidopsis (Figure 8B, right panel) showed a parallel array that was mostly oblique to the long expansion axis of the cell.
Because it was difficult to observe the MTs in root cells with GFP-tubulin Arabidopsis, we used immunofluorescence microscopy to visualize cortical MTs in root epidermal cells. The root epidermal cells of wild-type Arabidopsis also had transverse cortical MTs (Figure 8C, left panel). However, the cortical MTs in root epidermal cells overexpressing MAP18 were mostly organized into oblique or longitudinal arrays (Figure 8C, middle panel). On the other hand, cortical MTs in root epidermal cells of the MAP18 RNAi Arabidopsis were generally transverse, similar to wild-type cells (Figure 8C, right panel).
Our observations indicated that either the overexpression or the elimination of MAP18 results in the abnormal organization of cortical MTs and, as a consequence, abnormalities in cell morphogenesis.
MAP18-Overexpressing Arabidopsis Lines Are Hypersensitive to MT-Disrupting Drugs
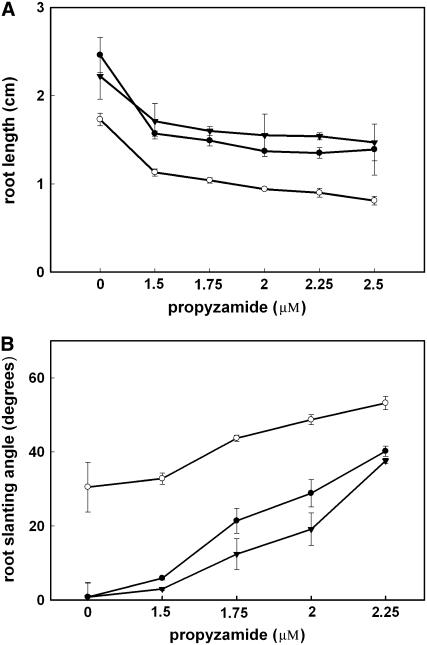
To test the effect of MAP18 on cortical MTs, the MT-disrupting drug propyzamide (PPM) was applied. Wild-type, MAP18-overexpressing, and MAP18 RNAi Arabidopsis were cultured on MS medium containing various concentrations of PPM, and the length and left-handed skewing angle of the roots were measured. When cultured in the presence of PPM, root lengths were shorter (Figure 9A) and the left-skewing angles were larger (Figure 9B) in the MAP18-overexpressing line but longer and smaller in the MAP18 RNAi line compared with wild-type Arabidopsis. The effect of PPM was always more pronounced in MAP18-overexpressing lines and decreased in MAP18 RNAi Arabidopsis, with all the concentrations applied. These observations suggest that MTs are more sensitive to PPM treatments in MAP18-overexpressing cells but less sensitive when MAP18 is eliminated.
Figure 9.
Statistics of the Lengths and Left-Skewing Angles of the Roots of the Wild Type, MAP18-Overexpressing, and RNAi Arabidopsis in the Presence of Various Concentrations of the MT-Disrupting Drug PPM.
Closed circles, the wild type; open circles, MAP18-overexpressing line; closed triangles, MAP18 RNAi line. More than 60 roots grown on three different plates were measured for each treatment and line in (A) and 30 roots in (B). Data are means ± se.
To further confirm this, we compared MTs in cells of wild-type, MAP18-overexpressing, and MAP18 RNAi Arabidopsis hypocotyls after treatment with oryzalin, another MT-disrupting drug. Observations showed that MTs were disrupted in hypocotyl epidermal cells in MAP18-overexpressing lines, while MTs in cells of wild-type and MAP18 RNAi Arabidopsis hypocotyls remained almost normal after the treatment of 5 μM oryzalin for 15 min (Figure 10A). Increasing oryzalin concentration or treatment time resulted in the disruption of cortical MTs in cells of both wild-type and MAP18-overexpressing Arabidopsis hypocotyls; however, the cortical MTs were almost normal in cells of MAP18 RNAi Arabidopsis hypocotyls (Figures 10B and 10C). Furthermore, when oryzalin was washed off after the treatments, the cortical MTs were mostly recovered in the cells of wild-type and MAP18 RNAi Arabidopsis hypocotyls. However, most of the cortical MTs remained disrupted in cells of MAP18-overexpressing Arabidopsis hypocotyls (Figure 10D). Therefore, we conclude that MAP18 exerts a destabilizing effect on MTs.
Figure 10.
Cortical MTs Are Hypersensitive in MAP18-Overexpressing Cells but More Resistant in MAP18 RNAi Cells to the Treatments of Oryzalin.
(A) to (C) The observations of cortical MTs in wild-type, MAP18-overexpressing, and MAP18 RNAi Arabidopsis hypocotyls cells after treatments of 5 μM oryzalin for 15 min (A), 10 μM oryzalin for 5 min (B), and 10 μM oryzalin for 30 min (C).
(D) After the treatment of 10 μM oryzalin for 30 min, the oryzalin was washed off and cortical MTs were observed in 1.5 h. Bar = 50 μm.
DISCUSSION
MAP18 Is Involved in the Regulation of Cell-Polarized Expansion by Controlling the Organization of Cortical MTs
Several kinds of abnormality in plant growth and cell expansion are often observed in mutants where cortical MTs are affected. First, root growth is often shown to exhibit a left- or right-skewing pattern and a left- or right-twist cell file rotation. For example, the lefty mutants with tubulin mutations cause unstable MTs and result in a left-handed twist in Arabidopsis organs (Thitamadee et al., 2002). Mutation of SKU6/SPIRAL1 causes right-handed axial twisting in roots, etiolated hypocotyls, leaf petioles, and strongly right-skewed root growth on inclined agar media (Sedbrook, 2004). Seedlings overexpressing WVD2, which may directly or indirectly interact with MTs, exhibit constitutive right-handed helical growth in both roots and etiolated hypocotyls and left-handed twisting in the petioles of rosette leaves (Yuen et al., 2003). Second, the anisotropic cell growth is often reduced, and the radial expansion of the cell is often enhanced. For instance, mutations of Arabidopsis SPR1 or SPR2 reduce anisotropic growth of endodermal and cortical cells in roots and etiolated hypocotyls (Furutani et al., 2000). Mutation of MOR1/GEM1 also results in radially expanding roots (Whittington et al., 2001; Twell et al., 2002). The radial expansion defect is also observed in katanin mutants (Burk and Ye, 2002; Webb et al., 2002). The Arabidopsis TON2 mutants also show reduced anisotropic growth of hypocotyl cells, along with aberrant orientation of cortical MTs (Camilleri et al., 2002). Third, aberrant pavement cells are often formed. For example, the shape of pavement cells is significantly altered in mutants of the plant Rho-related protein family ROPs, which control both the organization of actin filaments and cortical MTs (Fu et al., 2002, 2005).
All these abnormalities in root growth and cell expansion are observed in MAP18-overexpressing lines. When MAP18 is overexpressed, the root skews at a left angle, and the cell files have a left-handed twist. Hypocotyl cells exhibit an overall swelling pattern and disordered cell layers. The lobes of cotyledon pavement cells were dramatically eliminated, causing nearly rectangular or spindle-like cells. Further investigation of the cortical MTs in cells overexpressing MAP18 revealed that the organization of cortical MTs is significantly altered. Cortical MTs in hypocotyl epidermal cells form a parallel array, mostly oblique to the long expansion axis of the cell, instead of perpendicular to the long expansion axis in wild-type hypocotyl epidermal cells. By contrast, in cotyledon pavement cells, the cortical MTs are organized into an array of parallel MTs oriented transversely to the long growth axis, a pattern often present in elongating cells. These observations suggest that MAP18 is involved in determination of cell morphology. The observed nontransverse arrays may be the result of altered growth properties in the transgenic plants. Our data on MAP18 promoter-directed GUS activity showed that MAP18 is expressed mainly in cells under expansion but not in dividing cells. Therefore, MAP18 may function during cell expansion and exert its regulatory effect on the determination of plant growth and cell morphology.
MAP18 Is Involved in Controlling MT Organization by Destabilizing Cortical MTs
The dynamics of MTs may play a major role in the organization of cortical MTs. MT-interacting proteins may directly regulate the dynamics of cortical MTs to control cortical MT organization and in turn regulate plant cell expansion (Wasteneys and Galway, 2003; Dixit and Cyr, 2004; Smith and Oppenheimer, 2005; Ehrhardt and Shaw, 2006).
Treatments of MT-interacting drugs often cause phenotypes similar to mutants of MT-interacting proteins. Long-term treatment with the MT-stabilizing drug taxol often causes left-skewing of root growth (Furutani et al., 2000), suggesting that such defects may be due to restraint of MT dynamics. However, treatment with the MT-disrupting drug PPM also induces left-handed helical growth that is dominant over right-handed helical growth of spr1 and spr2 (Furutani et al., 2000). The Arabidopsis lefty tubulin mutant causes unstable MTs and exhibits left-handed twist growth, with cortical MTs arranged in right-handed helices (Thitamadee et al., 2002). Therefore, both overstabilization and understabilization of cortical MTs may result in cell growth defects. This study showed that MAP18 inhibits tubulin polymerization, and overexpression of MAP18 in Arabidopsis results in left-handed skewing of root growth as well as aberrant hypocotyl and cotyledon pavement cells. In addition, MAP18-overexpressing lines are more sensitive, while MAP18 RNAi transgenic lines are more resistant to treatments with PPM and oryzalin. Based on these observations, we conclude that MAP18 is an MT-destabilizing factor in Arabidopsis.
How is such MT destabilization involved in MT organization, and in turn, how does this determine cell shape? In Arabidopsis, cortical MTs exhibit dynamics at both ends: polymerization-biased dynamic instability at one end and slow depolymerization at the other end. As a result, sustained cortical MTs migrate by a hybrid treadmilling mechanism and are organized into different cortical MT arrays (Shaw et al., 2003). The movement of cortical MTs would stop if such dynamics of cortical MTs were restrained, and as a result, the reorientation of cortical MTs would be suppressed. In addition, the orientation of cortical MTs may also reflect the dynamics of MTs. The transverse MTs consist predominantly of tyrosinylated α-tubulin and may be more dynamic than the longitudinal MTs containing detyrosinylated α-tubulin (Wiesler et al., 2002). Such orientation-dependent cortical MT dynamics may also play a role in the reorientation of cortical MTs. When cortical MTs are reoriented from transverse to oblique or longitudinal arrays, disorganized or regionally discordant cortical MTs at the start are eventually organized into a new oblique or longitudinal global orientation (Yuan et al., 1994; Granger and Cyr, 2001). Stabilization of the cortical MTs may inhibit such cortical MT reorientation. In turn, such suppression of cortical MT reorganization would result in abnormal cell morphogenesis.
Three stages are suggested for the development of Arabidopsis pavement cells (Fu et al., 2002, 2005). Transition from the early to the late phase of cell expansion is correlated with the formation of transverse cortical MTs. The transverse cortical MTs are then concentrated in the neck region and restrict the expansion of the neck region during the formation of the necks and robes (Fu et al., 2002, 2005; Wasteneys and Galway, 2003). It is likely that inhibiting the reorganization of transverse cortical MTs in the neck region may also suppress the development of necks and robes. Indeed, a recent study on the ROP family, Rho-related GTPase from plants, revealed that ROP2 inactivates its target RIC1, an MT binding protein, to promote cortical MT bundling and organization at the neck region and locally inhibit the outgrowth of Arabidopsis pavement cells, suggesting a stabilizing effect on cortical MTs during cell development (Fu et al., 2005). Considering that MTs are usually absent at the lobe region, depolymerization of cortical MTs at robes should also play certain roles during the outgrowth of lobes. It is reasonable to suggest that both stabilization and destabilization of cortical MTs are required during pavement cell development. Our data suggest that MAP18 destabilizes cortical MTs. In mature cotyledon pavement cells overexpressing MAP18, cortical MTs are organized into parallel long MT bundles, mostly perpendicular to the long expansion axis of the cell, and the cell lobes are dramatically eliminated.
However, overexpressing MAP18 may result in different cortical MT organization in different cell types. In hypocotyl epidermal cells, where cortical MTs usually take a global transverse orientation in wild-type plants, cortical MTs are mostly oblique to the long expansion axis of the cell when MAP18 is overexpressed. As a consequence, the expansion of cells along the longitudinal growth axis was found to be significantly reduced. Again, such abnormal MT organization may also result from the destabilization of cortical MTs.
In conclusion, we have demonstrated that MAP18 has a destabilizing effect on cortical MTs. Therefore, overexpression of MAP18 restrains the stabilization of cortical MTs and results in abnormal cell growth.
METHODS
Plants
Arabidopsis thaliana ecotype Columbia was used for the study. Transgenic Arabidopsis expressing GFP-tagged α-tubulin was crossed with MAP18 overexpression and RNAi lines for the observation of cortical MTs.
Bacterial Expression of MAP18
The gene (accession number At5g44610.1) was identified by BLASTP, the Arabidopsis database. The protein coding region was cloned from the genomic DNA. The full-length CDS of MAP18 was cloned into pGEM-7Z (Promega). The MAP18 fragment was then reconstructed into the pGEX-4T vector (Amersham Biosciences). The reconstructed pGEX-4T plasmid containing MAP18 was then transformed into Escherichia coli strain BL21 (DE3) and induced to express. The recombinant protein was purified by glutathione sepharose 4B resin column (Amersham Pharamarcia) equilibrated with buffer L (50 mM Tris-HCl, 0.25 M NaCl, and 1 mM EDTA, pH 8.0). Ten microliters of thrombin (1 unit/μL) was used to remove the GST from the fusion protein at room temperature for 2 h. MAP18 protein was then eluted with 10 mL of buffer L. Fractions containing the protein were collected, combined, and dialyzed overnight against PEM buffer (80 mM PIPES, 1 mM EGTA, and 1 mM MgSO4, pH 6.9). Protein concentration was determined by a Bio-Rad protein assay kit. Protein samples were analyzed by SDS-PAGE.
MT Binding and Polymerization Assays
To test the binding activity of MAP18 to MTs, the preparation of purified porcine brain tubulin and cosedimentation experiments were performed as described previously (Mao et al., 2005). Purified porcine brain tubulin was centrifuged at 60,000g at 4°C for 30 min before use. The binding reaction was performed in 100 μL of 4 μM preformed taxol-stabilized MTs in PEMT buffer (0.1 M PIPES, 1 mM EGTA, 1 mM MgSO4, and 20 μM taxol, pH 6.9) with various concentrations of MAP18 (0, 0.5, 1, 2, 4, and 6 μM). After 30 min incubation at room temperature, samples were centrifuged at 100,000g for 30 min at 25°C. The pellet was rinsed with PEMT resuspended with SDS sample buffer. The samples were analyzed by 10% SDS-PAGE and visualized by staining the gels with Coomassie Brilliant Blue R 250. BSA (6 μM) was used as a control. The amounts of MAP18 bound to MTs were determined by gel scanning, and the binding ratio between MAP18 and MTs was analyzed by the Alpha Image 2200 documentation and analysis system.
In vitro immunofluorescence labeling experiments were also performed to investigate the binding of MAP18 to MTs. NHS-rhodamine tubulin was prepared according to Keating and White (1998). Taxol-stabilized NHS-rhodamine MTs were incubated with MAP18 (at a molar ratio of 6:1) for 30 min at room temperature in PEM buffer. Samples were stained with anti-MAP18 antibody at 1:100 dilution for 15 min, and then a secondary antibody of Alexa-488–conjugated donkey anti-rabbit IgG at 1:200 dilution was added to incubate for another 15 min. The samples were then transferred onto the slides coated with poly-l-Lys. Denatured MAP18 by boiling for 2 min and staining with the secondary antibody alone were taken as controls. Samples were observed on an Olympus BX51 microscope equipped with a CoolSNAP HQ CCD camera (Photometrics). Images were acquired using MetaMorph (Universal Imaging).
For the MT polymerization assay, various concentrations of GST-MAP18 were added to 40 μM tubulin solution in PEM buffer supplemented with 1 mM GTP. The time course of MT polymerization was monitored turbidimetrically by the absorbance at 350 nm, and 10 μM GST was used as a control. To further examine the effect of MAP18 on tubulin polymerization, 15 μM NHS-rhodamine–labeled tubulin was incubated with 10 μM GST-MAP18 at 37°C for 30 min. Glutaraldehyde (1% [v/v]) was added into the system to terminate the reaction before observation with the confocal microscopy, and 10 μM GST was used as a control.
Antibodies and Protein Gel Blots
Purified recombinant MAP18 was used to elicit polyclonal antisera production in rabbits. The MAP18 polyclonal antibody was purified using the Protein A resin column and cyanogen bromide resin column (Amersham Pharamarcia).
The protein extracts were prepared from root, stem, leaf, and flower tissues of 30-d-old Arabidopsis plants. The protein sample was separated on 10% SDS-PAGE gels and transferred to nitrocellulose membrane. Blots were probed with purified anti-MAP18 antibody at the dilution of 1:500 with TBST (50 mM Tris, 150 mM NaCl, and 0.05% Tween 20, pH 7.5) and the secondary antibody of alkaline phosphatase-conjugated goat anti-rabbit IgG antibody (Sigma-Aldrich) at the dilution of 1:10,000.
Analysis of MAP18 Promoter:GUS Activity
For the preparation of a MAP18 promoter:GUS construct, a fragment of 2172 bp upstream of the initiation codon (ATG) of MAP18 was amplified and inserted into the pGEM-T easy vector (Promega). The sequence was reconstructed into the pCAMBIA1391 vector. The construct was then transformed into Arabidopsis plants by Agrobacterium tumefacienes (strain GV3101). Fourteen-day-old homozygous seedlings were used for the histochemical localization of GUS activity in various tissues, except that 4-week-old plants were used for flower tissues.
GUS staining was performed in a solution containing 1 mM 5-bromo-4-chloro-3-indolyl-β-d-glucuronide, 10 mM phosphate buffer, pH 7.0, 0.05 mM potassium ferrocyanide, 0.05 mM potassium ferricyanide, 2 mM EDTA, and 0.1% (v/v) Triton X-100. Plants were incubated in staining solution at 37°C for 12 h in dark and then cleared with a solution of ethanol:acetic acid at 3:1 (v/v) several times before observation. Samples were examined on an Olympus microscope equipped with a color CCD camera (Sutter Instrument; LAMBDA 10-2).
MAP18 Overexpression and RNAi Arabidopsis
For preparation of stable MAP18-overexpressing and RNAi lines of Arabidopsis, the MAP18 RNAi vector with 504-bp MAP18 full-length coding sequences in the sense and antisense orientations was amplified and inserted into pGEM-7Z vector. The MAP18-inverted repeat transcript construct was reconstructed into pBI121 by replacing the GUS gene. The overexpression vector was constructed by inserting the MAP18 fragment from the pGEM-7Z vector into pBI121. All the vectors were under control of the 35S promoter and the nopaline synthase terminator and were transformed into Arabidopsis plants with Agrobacterium (strain GV3101). The transgenic homozygous Arabidopsis lines of the T3 generation were used for the studies.
RNA Gel Blot and RT-PCR Analysis
Total RNA was isolated from 14-d-old seedlings using TRIzol reagent (Invitrogen). Twenty micrograms of total RNA in each lane was separated on a denaturing agarose gel, blotted onto a nylon membrane (Amersham Biosciences), and probed with radiolabeled MAP18 full-length cDNA. The 28S rRNA stained with ethidium bromide was used as a loading control. Signal was visualized by a phosphor imager system (Amersham Biosciences).
M-MLV reverse transcriptase (Promega) was used for RT-PCR. The following primers were used for detection of MAP18 expression: 5′-CGAAGGTTGTTCCAAGG-3′ and 5′-AAGAGTGCGTACCACGTC-3′. EF4A was used as control. EF4A was used as control, using the primers 5′-TTGGCGGCACCCTTAGCTGGATCA-3′ and 5′-ATGCCCCAGGACATCGTGATTTCAT-3′.
Microscopy
Confocal microscopy observations and image acquisition were performed on a Zeiss LSM 510 META confocal microscope. Zeiss ×40, ×63, and ×100 oil objectives (Plan-Apochromat; numerical aperture of 1.4) were used for the observation. GFP-tubulin transgenic Arabidopsis 7-d-old seedlings were used for the observations of MTs in hypocotyl epidermal cells and cotyledon pavement cells. Immunofluorescence staining was performed for the observation of MTs in roots. Roots were cut from 7-d-old seedlings and fixed in 4% (v/v) paraformaldehyde and 0.1% (v/v) glutaraldehyde. A mouse anti-β-tubulin monoclonal antibody (Sigma-Aldrich) at 1:800 dilution and the anti-MAP18 polyclonal antibody at 1:100 dilution were applied as primary antibodies, and TRITC-conjugated rabbit anti-mouse IgG at 1:500 dilution and Alexa 488–conjugated donkey anti-rabbit IgG (Molecular Probes) at 1:500 dilution were used as secondary antibodies. Staining with preimmune serum and staining MAP18 alone without MT labeling were taken as controls.
Scanning electron microscopy images of 7-d-old Arabidopsis were obtained with a XL30 ESEM scanning electron microscope (Philips). For the observation of cell morphology, 7-d-old seedlings were fixed with 2% (w/v) paraformaldehyde and 1% glutaraldehyde, followed by 1% (v/v) OsO4. Samples were dehydrated in an ethanol series and embedded in Spurr's embedding medium (SPI-Chem; low viscosity kit). Sections (1.5 μm thick) were stained in 0.1% toluidine blue and observed on an Olympus BX51 microscope equipped with a color CCD camera (Olympus DP70).
Drug Treatments
The MT-specific drug PPM [pestanal, 3,5-dichloro-N-(1,1-dimethyl-2-propynyl) benzamide] was added to MS medium at a final concentration of 1.5 to 2.5 μM. Wild-type, overexpressing, and RNAi-MAP18 of Arabidopsis were sown on MS with 1% agar in Petri dishes vertically positioned, containing the MT-targeted drug, and growing for 7 d. At least 30 roots grown on three different plates were measured to calculate the means of lengths and the skewing angles to the vertical axis of the primary roots with standard errors.
Upper hypocotyls of 7-d-old seedlings of transgenic Arabidopsis expressing GFP-tagged α-tubulin and MAP18-overexpressing and RNAi-MAP18 Arabidopsis with GFP-tubulin background were used for the observations of cortical MTs with drug treatments. Oryzalin (3,5-dinitro-N4, N4-dipropylsulfanilamide, Ps-410) was applied to the whole plant for the treatments, according to the experiments. The hypocotyls were cut immediately before the observation of the cortical MTs. The observation of cortical MTs was performed under the confocal microscope.
Accession Numbers
Sequence data from this article can be found in the GenBank/EMBL data libraries under accession numbers BAC41928 (At5g44610; MAP18), CAA65228 (SB401), AAS17876 (ST901), AAR29265 (SBgLR), and AAM53961 (TSB).
Acknowledgments
We thank Patrick J. Hussey (University of Durham, UK) for critical reading and comments to the manuscript. Zhenbiao Yang (University of California, Riverside) and Bo Liu (University of California, Davis) generously provided the seeds of Arabidopsis-expressed GFP-tubulin. This research was supported by the National Key Basic Research Project of China (2006CB100101) and National Natural Science Foundation of China (30421002, 30370707, and 30570925).
The author responsible for distribution of materials integral to the findings presented in this article in accordance with the policy described in the Instructions for Authors (www.plantcell.org) is: Ming Yuan (mingyuan@cau.edu.cn).
References
- Burk, D.H., and Ye, Z.-H. (2002). Alteration of oriented deposition of cellulose microfibrils by mutation of a katanin-like microtubule severing protein. Plant Cell 14 2145–2160. [DOI] [PMC free article] [PubMed] [Google Scholar]
- Camilleri, C., Azimzadeh, J., Pastuglia, M., Bellini, C., Grandjean, O., and Bouchez, D. (2002). The Arabidopsis TONNEAU2 gene encodes a putative novel protein phosphatase 2A regulatory subunit essential for the control of the cortical cytoskeleton. Plant Cell 14 833–845. [DOI] [PMC free article] [PubMed] [Google Scholar]
- Dixit, R., and Cyr, R. (2004). The cortical microtubule array: From dynamics to organization. Plant Cell 16 2546–2552. [DOI] [PMC free article] [PubMed] [Google Scholar]
- Ehrhardt, D., and Shaw, S. (2006). Microtubule dynamics and organization in the plant cortical array. Annu. Rev. Plant Biol. 57 859–875. [DOI] [PubMed] [Google Scholar]
- Fu, Y., Gu, Y., Zheng, Z., Wasteneys, G., and Yang, Z. (2005). Arabidopsis interdigitating cell growth requires two antagonistic pathways with opposing action on cell morphogenesis. Cell 120 687–700. [DOI] [PubMed] [Google Scholar]
- Fu, Y., Li, H., and Yang, Z. (2002). The ROP2 GTPase controls the formation of cortical fine F-actin and the early phase of directional cell expansion during Arabidopsis organogenesis. Plant Cell 14 777–794. [DOI] [PMC free article] [PubMed] [Google Scholar]
- Furutani, I., Watanabe, Y., Prieto, R., Masukawa, M., Suzuki, K., Naoi, K., Thitamadee, S., Shikanai, T., and Hashimoto, T. (2000). The SPIRAL genes are required for directional control of cell elongation in Arabidopsis thaliana. Development 127 4443–4453. [DOI] [PubMed] [Google Scholar]
- Granger, C.L., and Cyr, R.J. (2001). Spatiotemporal relationships between growth and microtubule orientation as revealed in living root cells of Arabidopsis thaliana transformed with green-fluorescent-protein gene construct GFP-MBD. Protoplasma 216 201–214. [DOI] [PubMed] [Google Scholar]
- Hao, Y., Zhao, Q., Ao, G., and Yu, J. (2006). Characterization and functional analysis of a pollen-specific gene st901 in Solanum tuberosum. Planta 224 405–412. [DOI] [PubMed] [Google Scholar]
- Harlow, E., and Lane, D. (1998). Using Antibodies: A Laboratory Manual. Cold Spring Harbor, NY: Cold Spring Harbor Laboratory Press.
- Hussey, P.J., Hawkins, T.J., Igarashi, H., Kaloriti, D., and Smertenko, A. (2002). The plant cytoskeleton: Recent advances in the study of the plant microtubule-associated proteins MAP-65, MAP-190 and the Xenopus MAP215-like protein, MOR1. Plant Mol. Biol. 50 915–924. [DOI] [PubMed] [Google Scholar]
- Kaufmann, E., Geisler, N., and Weber, K. (1984). SDS-PAGE strongly overestimates the molecular masses of the neurofilament proteins. FEBS Lett. 170 81–84. [DOI] [PubMed] [Google Scholar]
- Keating, H., and White, J. (1998). Centrosome dynamics in early embryos of Caenorhabditis elegans. J. Cell Sci. 111 3027–3033. [DOI] [PubMed] [Google Scholar]
- Lang, Z., Zhao, Q., Yu, J., Zhu, D., and Ao, G. (2004). Cloning of potato SBgLR gene and its intron splicing in transgenic maize. Plant Sci. 166 1227–1233. [Google Scholar]
- Liu, J., Seul, U., and Thompson, R. (1997). Cloning and characterization of a pollen-specific cDNA encoding a glutamic-acid-rich protein (GARP) from potato Solanum berthaultii. Plant Mol. Biol. 33 291–300. [DOI] [PubMed] [Google Scholar]
- Lloyd, C., and Chan, J. (2002). Helical microtubule arrays and spiral growth. Plant Cell 14 2319–2324. [DOI] [PMC free article] [PubMed] [Google Scholar]
- Mao, T., Jin, L., Li, H., Liu, B., and Yuan, M. (2005). Two microtubule-associated proteins of the Arabidopsis MAP65 family function differently on microtubules. Plant Physiol. 138 654–662. [DOI] [PMC free article] [PubMed] [Google Scholar]
- Mathur, J. (2004). Cell shape development in plants. Trends Plant Sci. 9 583–590. [DOI] [PubMed] [Google Scholar]
- Muller, S., Smertenko, A., Wagner, V., Hussey, P., and Hauser, M. (2004). The plant microtubule-associated protein AtMAP65-3/PLE is essential for cytokinetic phragmoplast function. Curr. Biol. 14 412–417. [DOI] [PMC free article] [PubMed] [Google Scholar]
- Noble, M., Lewis, S., and Cowan, N.J. (1989). The microtubule binding domain of microtubule-associated protein MAP1B contains a repeated sequence motif unrelated to that of MAP2 and Tau. J. Cell Biol. 109 3367–3376. [DOI] [PMC free article] [PubMed] [Google Scholar]
- Sedbrook, J.C. (2004). MAPs in plant cells: Delineating microtubule growth dynamics and organization. Curr. Opin. Plant Biol. 7 632–640. [DOI] [PubMed] [Google Scholar]
- Sedbrook, J.C., Ehrhardt, D.W., Fisher, S.E., Scheible, W., and Somervilleb, C.R. (2004). The Arabidopsis SKU6/SPIRAL1 gene encodes a plus end–localized microtubule-interacting protein involved in directional cell expansion. Plant Cell 16 1506–1520. [DOI] [PMC free article] [PubMed] [Google Scholar]
- Shaw, S.L., Kamyar, R., and Ehrhardt, D.W. (2003). Sustained microtubule treadmilling in Arabidopsis cortical arrays. Science 300 1715–1718. [DOI] [PubMed] [Google Scholar]
- Smertenko, A.P., Chang, H.-Y., Wagner, V., Kaloriti, D., Fenyk, S., Sonobe, S., Lloyd, C., Hauser, M.-T., and Hussey, P.J. (2004). The Arabidopsis microtubule-associated protein AtMAP65-1: Molecular analysis of its microtubule bundling activity. Plant Cell 16 2035–2047. [DOI] [PMC free article] [PubMed] [Google Scholar]
- Smith, L.G., and Oppenheimer, D.G. (2005). Spatial control of cell expansion by the plant cytoskeleton. Annu. Rev. Cell Dev. Biol. 21 271–295. [DOI] [PubMed] [Google Scholar]
- Thitamadee, S., Tuchihara, K., and Hashimoto, T. (2002). Microtubule basis for left-handed helical growth in Arabidopsis. Nature 417 193–196. [DOI] [PubMed] [Google Scholar]
- Twell, D., Park, S.I., Hawkins, T.J., Schubert, D., Schmidt, R., Smertenko, A., and Hussey, P.J. (2002). MOR1/GEM1 has an essential role in the plant-specific cytokinetic phragmoplast. Nat. Cell Biol. 4 711–714. [DOI] [PMC free article] [PubMed] [Google Scholar]
- Wasteneys, G.O., and Galway, M.E. (2003). Remodeling the cytoskeleton for growth and form: An overview with some new views. Annu. Rev. Plant Biol. 54 691–722. [DOI] [PubMed] [Google Scholar]
- Webb, M., Jouannic, S., Foreman, J., Linstead, J., and Dolan, L. (2002). Cell specification in the Arabidopsis root epidermis requires the activity of ECTOPIC ROOT HAIR3—A katanin-p60 protein. Development 129 123–131. [DOI] [PubMed] [Google Scholar]
- Whittington, A.T., Vugrek, O., Wei, K.J., Hasenbein, N.G., Sugimoto, K., Rashbrooke, M.C., and Wasteneys, G.O. (2001). MOR1 is essential for organizing cortical microtubules in plants. Nature 411 610–613. [DOI] [PubMed] [Google Scholar]
- Wiesler, B., Wang, Q., and Nick, P. (2002). The stability of cortical microtubules depends on their orientation. Plant J. 32 1023–1032. [DOI] [PubMed] [Google Scholar]
- Yuan, M., Shaw, P.J., Warn, R.M., and Lloyd, C.W. (1994). Dynamic reorientation of cortical microtubules, from transverse to longitudinal, in living plant cells. Proc. Natl. Acad. Sci. USA 91 6050–6053. [DOI] [PMC free article] [PubMed] [Google Scholar]
- Yuen, C.Y.L., Pearlman, R.S., Silo-suh, L., Hilson, P., Carroll, K.L., and Masson, P.H. (2003). WVD2 and WDL1 modulate helical organ growth and anisotropic cell expansion in Arabidopsis. Plant Physiol. 131 493–506. [DOI] [PMC free article] [PubMed] [Google Scholar]
- Zhao, Q., Yu, J., Zhu, D., and Ao, G. (2004). Cloning and characterization of a pollen-specific lysine-rich protein cDNA (tsb) from tomato. Chin. J. Biochem. Mol. Biol. 20 275–279. [Google Scholar]


