Abstract
Phosphorylation of tyrosine residues by protein tyrosine kinases mediates numerous cellular processes. Deregulated tyrosine phosphorylation underlies constitutive activation of signaling pathways leading to oncogenesis. Analytical techniques for evaluation of the global phosphoproteome level are challenging and can be improved on to enhance yields. Here, we evaluated several approaches to enrich for tyrosine phosphoproteins in cancer cells for subsequent liquid chromatography-tandem mass spectrometry analysis using lysates from SU-DHL-1 cells, which express the nucleophosmin-anaplastic lymphoma kinase tyrosine kinase as a model system. Cells were grown in the presence or absence of the phosphatase inhibitor sodium orthovanadate, and tyrosine phosphoproteins were subsequently enriched by immunoprecipitation or immunoaffinity chromatography and protein identification performed by liquid chromatography-tandem mass spectrometry. Our results show that sodium orthovanadate improves enrichment and thus detection of tyrosine phosphoproteins. Immunoprecipitation of tyrosine phosphoproteins using two different antiphosphotyrosine antibodies increased the number of protein identifications. Finally, peptides from proteins enriched by immunoprecipitation were more abundant (n = 338) than those enriched by immunoaffinity chromatography (n = 138), and relatively few proteins were found in common (n = 43). Our data demonstrate the utility of an enrichment strategy for the mass spectrometry-based identification of tyrosine phosphoproteins and show the advantage of complementary techniques for greater protein identification.
Protein phosphorylation is a mechanism that controls signal transduction and protein activity and can modulate fundamental cellular processes, including cell differentiation, metabolism, gene expression, motility, division, and survival.1 A variety of signaling pathways depend on the activity of protein tyrosine kinases, which catalyze the transfer of phosphate groups from ATP to a phosphodiester bond on the hydroxyl group of tyrosine residues of their substrates.2 Although the ratio of phosphorylation on serine/threonine/tyrosine is 1800:200:1 in vertebrates,3 aberrant expression of protein tyrosine kinases because of chromosomal aberrations, gene amplifications, activating mutations in kinase domains, or perturbation of transcriptional machinery can lead to malignancy.4
Notable protein tyrosine kinases that are deregulated in human cancers include BCR-ABL,5 KIT,6 platelet-derived growth factor receptor,7 and nucleophosmin (NPM)-anaplastic lymphoma kinase (ALK).8 Common to all four proteins is their constitutive tyrosine phosphorylation activity, resulting in aberrant signaling of proteins involved in pathways that enable tumor cell survival.9 For example, the expression of NPM-ALK in anaplastic large-cell lymphoma10 results from the t(2;5)(p23;q35) chromosomal rearrangement.8 The fusion protein undergoes dimerization and autophosphorylation, leading to constitutive activation of the ALK tyrosine kinase.10 Activated ALK associates with and phosphorylates a group of adaptor proteins that contain SRC homology 2 and 3 or protein tyrosine binding domains,8 including IRS1,11 GRB2,12 PLCγ,13 and SHC,11 which activate downstream signaling pathways involved in cell survival.14 Analysis of tyrosine phosphoproteins in ALK-positive anaplastic large-cell lymphoma cells may lead to identification of proteins that play a role in tumor cell survival as well as those that may serve as drug targets.15 Furthermore, identification of tyrosine phosphoproteins may establish the role of novel signaling pathways involved in oncogenesis.
Because of their low abundance, analysis of tyrosine phosphoproteins has been difficult. Direct mass spectrometry (MS) analysis of low abundance proteins, such as tyrosine phosphoproteins, is difficult because of stoichiometric under-representation of such posttranslationally modified species.16 Immobilized metal affinity chromatography is one approach that enriches phosphopeptides from cell lysates,17 but this technique isolates all phosphorylated residues, including phosphoserine, phosphothreonine, and phosphotyrosine.18 Furthermore, immobilized metal affinity chromatography has been shown to perpetuate oxidization of eluted proteins, catalyzed by leached metal ions.19 Enrichment of the phosphotyrosine proteome with anti-phosphotyrosine antibodies is another strategy that has been used to overcome the low stoichiometry of tyrosine phosphorylated proteins for their easier detection in complex samples.20 However, a systematic analysis of enrichment by immunoprecipitation and immunoaffinity chromatography has not been reported.
Here, we describe studies aimed at optimizing enrichment of tyrosine phosphoproteins in cancer cells for subsequent liquid chromatography-tandem mass spectrometry identification. The results of our studies demonstrate that sodium orthovanadate significantly increases the levels and numbers of tyrosine phosphoproteins enriched for MS analysis. Enrichment of tyrosine phosphoproteins using two commercially available antibodies facilitated greater overall protein identifications. Finally, the numbers of peptides identified by liquid chromatography-tandem mass spectrometry (LC-MS/MS) using immunoprecipitation-enriched tyrosine phosphoproteins demonstrated significantly higher identifications (n = 338) compared with those enriched by immunoaffinity chromatography (n = 138). Importantly, only 43 proteins were in common between the two samples. These data indicate that use of enrichment strategies for isolation of tyrosine phosphoproteins is effective at increasing the yield of tyrosine phosphoproteins before LC-MS/MS.
Materials and Methods
Sodium orthovanadate (Sigma-Aldrich, St. Louis, MO) was prepared as a 200 mmol/L stock solution in water, and the pH was adjusted to 10 by adding 1 N HCl and boiling the solution. Stock solutions were frozen at −20°C until use. The mouse anti-human 4G10 monoclonal agarose-conjugate anti-phosphotyrosine antibody, anti-phosphotyrosine immunoaffinity purification kit, and goat anti-mouse IgG horseradish peroxidase-conjugated secondary antibody were obtained from Upstate Cell Signaling Solutions (Waltham, MA). The rabbit anti-human polyclonal sc-18182 agarose-conjugate anti-phosphotyrosine antibody, goat anti-rabbit IgG horseradish peroxidase-conjugated secondary antibody, and molecular weight standards were obtained from Santa Cruz Biotechnology (Santa Cruz, CA). The human lymphoma cell line SU-DHL-1, expressing the NPM-ALK tyrosine kinase, was obtained from German Collection of Microorganisms and Cell Cultures (Braunschweig, Germany). RPMI 1640, SilverQuest mass spectrometry-compatible silver staining kit, Coomassie blue reagent, and antibiotic-antimycotic solution were obtained from Invitrogen (Carlsbad, CA). Fetal bovine serum was obtained from American Type Culture Collection (Manassas, VA). The Bradford colorimetric assay for protein concentration was obtained from Pierce (Rockford, IL). Nitrocellulose protein blotting membranes were obtained from Bio-Rad (Hercules, CA). All other reagents were obtained from Sigma-Aldrich.
Cell Culture
The NPM-ALK-positive cell line SU-DHL-1 was cultured in RPMI 1640 supplemented with 10% fetal bovine serum and 0.1% antibiotic-antimycotic solution at 37°C in 5% CO2. When a cell density of 8 × 10⁵ cells/ml was achieved, cells were seeded in 12-well plates, treated with 2 mmol/L sodium orthovanadate, and incubated for 24 hours. Cells were subsequently harvested, washed twice in 1× phosphate-buffered saline, and subjected to protein isolation. Control cells were treated in the same manner without sodium orthovanadate.
Protein Preparation and Analysis of Protein Concentration
Whole-cell lysates were prepared from cells by the addition of 2 ml of radioimmunoprecipitation assay lysis buffer [1× phosphate-buffered saline, 0.5% sodium deoxycholate, 1% Nonidet P-40, 0.1% sodium dodecyl sulfate (SDS), 20 mmol/L Tris, pH 7.5, 100 mmol/L NaCl, 1 mmol/L ethylenediamine tetraacetic acid, and 0.2% protease inhibitor]. After a 30-minute incubation on ice, samples were centrifuged at 14,000 rpm for 15 minutes at 4°C to pellet cellular material, and supernatants were assessed for protein concentrations. Protein concentrations were assessed using the Bradford colorimetric assay.
Immunoprecipitation
The agarose-conjugated anti-phosphotyrosine antibodies 4G10 and sc-18182 were used to immunoprecipitate tyrosine phosphoproteins from NPM-ALK-expressing SU-DHL-1 cells. Briefly, 1 mg of cell lysates was incubated with various concentrations of agarose-conjugated 4G10 or sc-18182 overnight at 4°C on a rocker. Pellets were washed extensively in 1× phosphate-buffered saline and boiled to elute enriched tyrosine phosphoproteins from beads.
Immunoaffinity Chromatography
Immunoaffinity chromatography was performed using the α-phosphotyrosine antibody 4G10 cross-linked to protein A agarose by dimethylpimelimidate. Briefly, antiphosphotyrosine-agarose conjugate was applied to a disposable polypropylene column, and antibody-bead mixture was allowed to settle in the column for 15 minutes at 4°C. Column was washed five times with binding buffer followed by application of 1 mg of cell lysate in 1 ml of radioimmunoprecipitation assay buffer. Flow-through was collected and reloaded on the column nine times. The final fraction (containing all but phosphotyrosine proteins) was collected followed by the addition of 1 ml of binding buffer five times. Phosphotyrosine-enriched proteins were eluted from the column by the addition of 1 ml of elution buffer, which was collected and reapplied to the column five times. Column was regenerated by washing with regeneration buffer and stored in storage buffer at 4°C.
SDS-Polyacrylamide Gel Electrophoresis (PAGE), Silver Stain, Coomassie Blue, and Immunoblot Analysis
SDS-PAGE was performed by mixing 25 μg of enriched tyrosine phosphoproteins with 5 μl of Laemmli reducing sample buffer and boiling for 2 minutes. Samples were then cooled to room temperature and resolved by SDS-PAGE on 10% gels at 120 V for 1 hour or until dye fronts were within 1 cm of the bottom of the gels.
Mass spectrometry-compatible silver staining was performed according to manufacturer’s protocol (Invitrogen). In brief, gels were fixed for 20 minutes followed by sensitization for 10 minutes. After three washes, gels were stained for 15 minutes followed by development for 4 to 8 minutes. When desired band intensity appeared, stop solution was added, and gels were rinsed.
On the other hand, after electrophoresis, resolved proteins were semidry transferred to nitrocellulose membranes (Bio-Rad) at 20 V for 2 hours. Membranes were subsequently washed twice in 1× phosphate-buffered saline for 30 minutes and blocked for 1 hour in blocking solution [5% nonfat milk diluted in Tris-buffered saline (20 mmol/L Tris-HCl, pH 7.4, 150 mmol/L NaCl, and 0.05% Tween 20)]. Membranes were then incubated overnight with various concentrations of 4G10 or sc-18182 in 3% buffer solution (Tris-buffered saline containing 3% nonfat dry milk), washed five times with 3% buffer solution, and probed with appropriate horseradish peroxidase-labeled secondary antibody at room temperature for 1 hour. After five washes with Tris-buffered saline, immunoreactive bands were visualized by chemiluminescence (Amersham Biosciences, Piscataway, NJ). Densitometry was performed using Image J software (National Institutes of Health, Bethesda, MD). To confirm equal loading, SDS gels were subjected to Coomassie blue staining subsequent to electrophoresis and photographed.
Protein Digestion, Peptide Extraction, and MS Analysis
After silver staining of gels, lanes of interest were excised into 12 equivalent slices, and proteins were extracted using the Invitrogen protocol. In brief, each gel slice was destained and washed, crushed and dried, and then rehydrated in ammonium bicarbonate buffer. Freshly prepared sequencing grade lysine-C endopeptidase (Princeton Separations, Adelphia, NJ) was added (1:50) to each tube, and the tubes were incubated at 37°C for 4 hours. Sequencing grade-modified trypsin (Princeton Separations) was then added (1:50), and the tubes were returned to incubate at 37°C overnight.
The digested peptides were extracted with 50% acetonitrile with 0.1% trifluoroacetic acid (TFA) and reduced to a final volume of 30 μl. A 15-μl aliquot of each sample was analyzed by automated nanoflow reverse-phase LC/MS using the LCQ Deca XP ion trap mass spectrometer (Thermo Scientific, Waltham, MA). Digested peptides were injected by an autosampler, using an acetonitrile gradient (0 to 60% B in 80 minutes; A, 5% acetonitrile with 0.4% acetic acid and 0.005% heptafluorobutyric acid; B, 95% acetonitrile 0.4% acetic acid and 0.005% heptafluorobutyric acid) through a reverse-phase column (75-μm i.d. fused silica packed with 12 cm of 5-μm C18 particles) to elute the peptides at a flow rate of 250 nl/min into the mass spectrometer. An electrospray voltage of 2.2 kV was used with the ion transfer tube temperature set to 180°C. Peptide analysis was performed using data-dependent acquisition of one MS scan (600 to 2000 m/z) followed by MS/MS scans of the three most abundant ions in each MS scan. Dynamic exclusion was set to a repeat count of 3, with the exclusion duration of 5 minutes. For improved reproducibility, all samples were analyzed in triplicate.
Data Analysis
The MS/MS-acquired data were searched using the SEQUEST algorithm in Bioworks 3.1 SR1 (Thermo Electron Corporation, San Jose, CA) against amino acid sequences in the International Protein Index human protein database21 (v3.09; accessed September 21, 2005; 50,041 entries). Protein search parameters included a precursor peptide mass tolerance of ±0.7 atomic mass unit and fragment mass tolerance of ±0.1 atomic mass unit. The search was constrained to tryptic peptides with one missed enzyme cleavage allowed. Phosphorylation was set as a differential modification for tyrosine residues. The peptide-matching criteria of a cross-correlation score (Xcorr) >1.8 for +1 peptides, >2.5 for +2 peptides, and >3.5 for +3 peptides, and a Δ correlation score (ΔCn) >0.100 was used as a threshold of acceptance.
All SEQUEST data (.dta) and output (.out) files from triplicate experiments were combined and analyzed using INTERACT and ProteinProphet (Institute for Systems Biology).22 Data analysis using INTERACT and ProteinProphet improved the confidence of protein identification by best-fit distribution of probability scores specific to each data set and reduced the risk of false-positive protein identifications. The false-positive error rate for protein identifications was estimated using the composite target/decoy database method.23 Acquired MS/MS spectra were searched against the International Protein Index v3.09 protein database containing either reversed or scrambled amino acid sequences for each protein entry. The total number of proteins identified with reverse sequence entries was then multiplied (2×) to compensate for doubling the size of the database. Overall, the predicted error rate for protein identification by LC-MS/MS ranged from 9.4 to 17.6%. All proteins identified with less than 5% predicted error were summarized and directly exported into Excel with subsequent gene ontology characterization performed using the GOMiner gene ontology tool.24,25
Results
Sodium Orthovanadate Enhances Tyrosine Phosphoprotein Enrichment
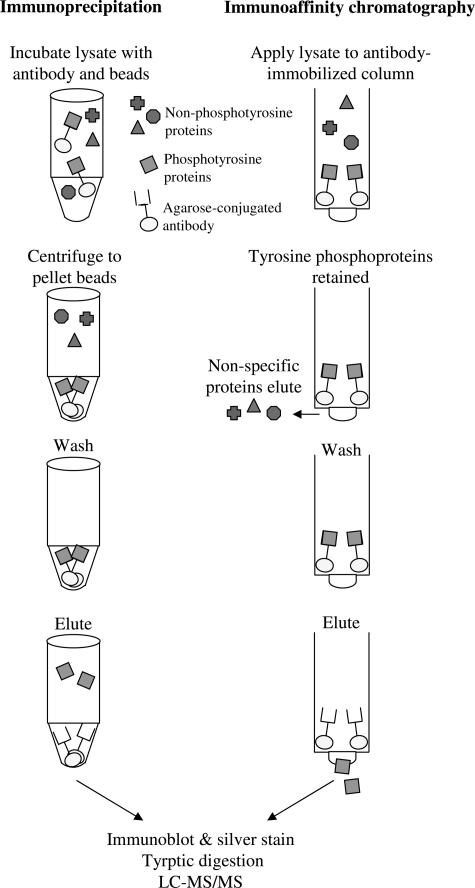
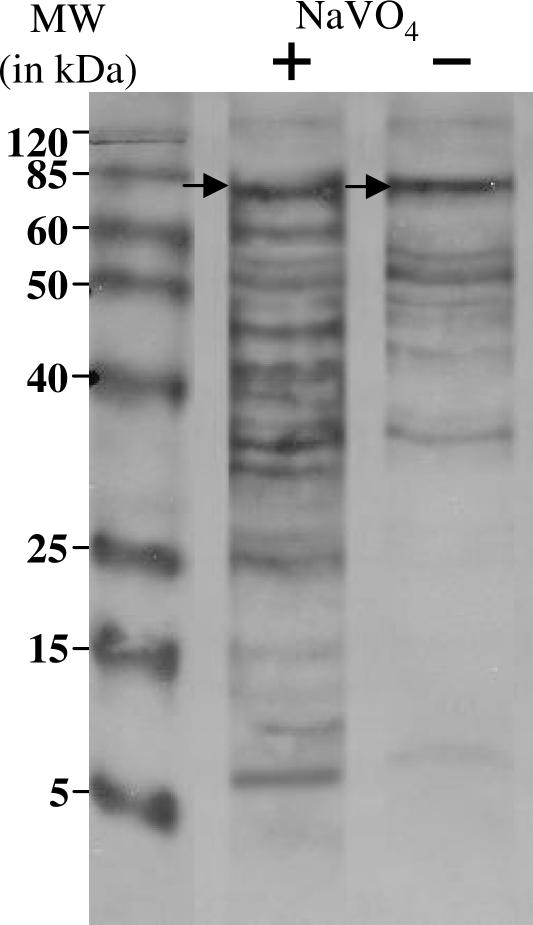
To determine the basal effects of cellular phosphatases on the enrichment of tyrosine phosphoproteins, we cultured human lymphoma SU-DHL-1 cells, which express the NPM-ALK tyrosine kinase, in the presence or absence of the phosphatase inhibitor sodium orthovanadate. Total cell lysates were extracted from cells, and tyrosine phosphoproteins were immunoprecipitated (Figure 1, left) and immunoblotted with the 4G10 anti-phosphotyrosine antibody. We identified 16 immunoreactive bands in the lane corresponding to cells grown in the presence of sodium orthovanadate (Figure 2, +NaVO4), ranging in molecular mass from 8 to 130 kd, and nine immunoreactive bands in the lane corresponding to cells grown in the absence of sodium orthovanadate (Figure 2, −NaVO4), ranging in molecular mass from 10 to 130 kd. Densitometry analysis revealed an 18% increase in NPM-ALK (Figure 2, arrows) from cells grown in the presence of sodium orthovanadate. These data illustrate the utility of treating cells with the phosphatase inhibitor sodium orthovanadate to improve detection of tyrosine phosphoproteins.
Figure 1.
Tyrosine phosphoproteins from SU-DHL-1 cells were enriched by immunoprecipitation (left) or immunoaffinity chromatography (right). Subsequently, enriched tyrosine phosphoproteins were subjected to immunoblot, silver stain, tryptic digestion, and LC-MS/MS analysis.
Figure 2.
Effect of sodium orthovanadate on tyrosine phosphoproteins. Lysates from SU-DHL-1 cells treated (+) or untreated (−) with sodium orthovanadate were immunoprecipitated and probed with the 4G10 anti-phosphotyrosine antibody. The lane corresponding to sodium orthovanadate-treated cells illustrates a total of 16 immunoreactive bands ranging from 130 through 8 kd. The lane corresponding to untreated cells illustrates a total of nine immunoreactive bands ranging from 130 through 8 kd. Densitometry analysis of the band corresponding to NPM-ALK, denoted by arrows, demonstrated an 18% increase in band intensity in the lane corresponding to sodium orthovanadate-treated cells.
4G10 and sc-18182 Enrich for Tyrosine Phosphoproteins
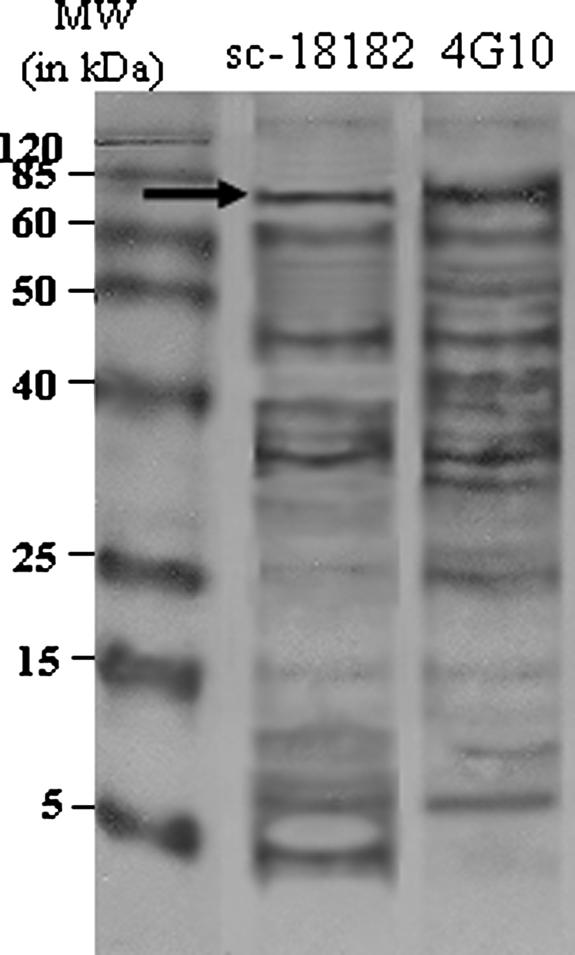
To compare antibodies for effectiveness in enriching tyrosine phosphoproteins of SU-DHL-1 cells, we performed immunoprecipitation of total cell lysate using two commercially available antibodies. Figure 3 illustrates the immunoblot of tyrosine phosphoproteins enriched and probed using sc-18182 and 4G10, respectively. The lane corresponding to immunoprecipitation and probing with sc-18182 demonstrates 14 immunoreactive bands, whereas the lane corresponding to immunoprecipitation and probing with 4G10 demonstrates 15 immunoreactive bands. Distinct immunoreactive bands at 80, 65, 45, and 38 kd were seen in both samples. However, unique bands in the sc-18182 sample were seen at 39, 10, 8, and 5 kd, whereas those unique to the 4G10 sample were seen at 52, 43, 34, and 25 kd. Densitometry analysis revealed a 22% increase in NPM-ALK (Figure 3, arrows) from tyrosine phosphoprotein immunoprecipitation enriched with 4G10. These data illustrate the similarities and differences in tyrosine phosphoproteins recognized by antibodies and the strength of using multiple antibodies to improve detection of tyrosine phosphoproteins.
Figure 3.
4G10 and sc-18182 enrich for tyrosine phosphoproteins. Lysates from SU-DHL-1 cells treated with 2 mmol/L sodium orthovanadate were immunoprecipitated and probed using sc-18182 (left) or 4G10 (right). The lane corresponding to immunoprecipitation using sc-18182 demonstrates 14 immunoreactive bands ranging in size from 4 to 130 kd. The lane corresponding to proteins enriched by immunoprecipitation using 4G10 illustrates a total of 15 immunoreactive bands ranging from 8 to 120 kd. Densitometry analysis of the bands corresponding to NPM-ALK (arrow) demonstrated a 22% increase in intensity in the lane corresponding to tyrosine phosphoproteins immunoprecipitated with 4G10.
Tyrosine Phosphoproteins Are Enriched More Effectively Using Immunoprecipitation
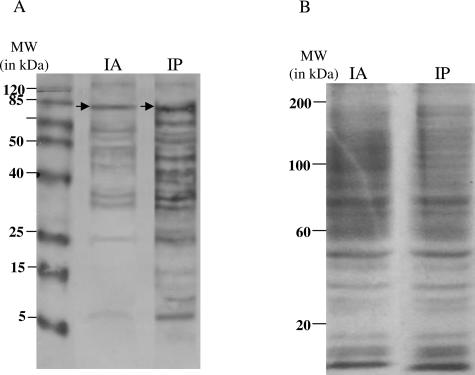
To examine two techniques frequently used to enrich for phospho-specific proteins, we performed phosphotyrosine enrichment by immunoprecipitation or immunoaffinity chromatography as illustrated in Figure 1, left (IP) and right (IA) panels. Equal amounts (25 μg) of phosphotyrosine proteins were subjected to immunoblot analysis using the 4G10 antibody. Figure 4, lane IA, illustrates immunoreactive bands from immunoaffinity chromatography-enriched tyrosine phosphoproteins. Figure 4, lane IP, illustrates immunoreactive bands from immunoprecipitated tyrosine phosphoproteins. All bands were more intense in tyrosine phosphoproteins enriched by immunoprecipitation. Densitometry analysis revealed a 41% increase in NPM-ALK (Figure 4, arrows) from immunoprecipitation-enriched tyrosine phosphoproteins and was similar in other immunoreactive bands. These data highlight the superior efficacy of immunoprecipitation over immunoaffinity chromatography for the identification of tyrosine phosphoproteins.
Figure 4.
Enrichment of tyrosine phosphoproteins by immunoaffinity chromatography and immunoprecipitation and confirmation of equal loading. Tyrosine phosphoproteins from SU-DHL-1 cells were enriched by immunoaffinity chromatography or immunoprecipitation and probed with the 4G10 antibody. A: The lane corresponding to immunoaffinity chromatography (IA) demonstrates 10 immunoreactive bands ranging from 8 to 120 kd. In contrast, the lane corresponding to immunoprecipitation (IP) demonstrates 17 immunoreactive bands ranging from 8 to 120 kd. Densitometry analysis of the band corresponding to NPM-ALK, denoted by arrows, demonstrated a 44% increase in band intensity in the lane corresponding to proteins enriched by immunoprecipitation over immunoaffinity chromatography. B: A Coomassie blue-stained gel of tyrosine phosphoproteins enriched by immunoaffinity chromatography (IA) or immunoprecipitation (IP). Gel demonstrates equal loading between the two samples.
Identification of Tyrosine Phosphoproteins by LC-MS/MS
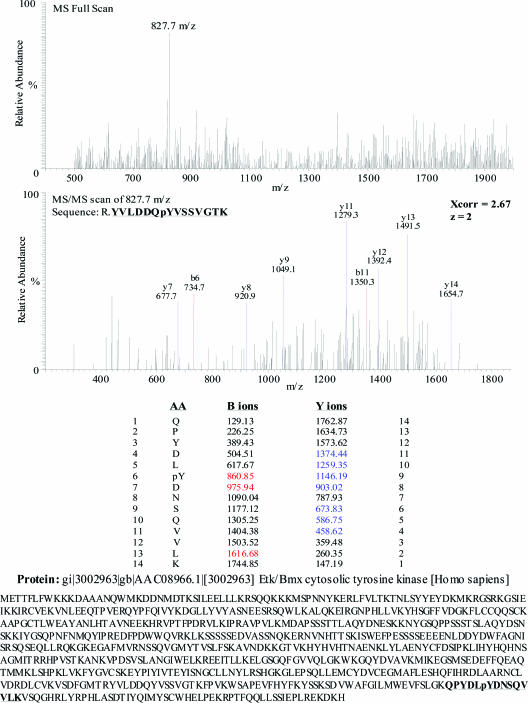
To identify proteins enriched by immunoprecipitation and immunoaffinity chromatography using 4G10, we performed LC-MS/MS analysis. Total cell lysate was extracted and phosphotyrosine proteins enriched by immunoprecipitation or immunoaffinity chromatography (Figure 1) followed by SDS-PAGE, silver stain analysis, and LC-MS/MS, as described in Materials and Methods. Figure 5 displays an example of the MS-full scan and MS/MS scan for the peptide sequence corresponding to ETK/BMX cytosolic tyrosine kinase. The identified B-ion series appears in red, and Y-ion series appears in blue. The corresponding peptide sequence was matched to that of ETK by the underlined sequence.
Figure 5.
Identification of ETK tyrosine kinase by LC-MS/MS. MS full scan and data-dependent MS/MS scan identified the tryptic peptide QPYDIpYDNSQV. Peptide sequencing is indicated by the B-ion (red) and Y-ion (blue) fragment series, with the identified peptide matching to ETK in the electronic database search.
Proteins enriched by immunoprecipitation and immunoaffinity chromatography and identified by LC-MS/MS were compared. The number of peptides identified at a 5% error rate in immunoprecipitation-enriched samples was 338, whereas those identified in immunoaffinity chromatography-enriched samples was 138. Importantly, there were 43 peptides in common between both samples. From a total of 1227 peptides identified by immunoaffinity chromatography enrichment, 138 phosphotyrosine-containing peptides were identified. In contrast, the immunoprecipitation experiment identified 3741 peptides, of which 338 phosphotyrosine-containing peptides were identified. However, the immunoaffinity chromatography enrichment resulted in 36% (95 of 263) unique phosphotyrosine peptides, whereas the immunoprecipitation strategy remained near 10% (295 of 2777). Analysis of error rates using a reverse and scrambled database demonstrated 17.6 and 16.1%, respectively, in immunoprecipitation-enriched samples and 12.8 and 9.4%, respectively, in immunoaffinity chromatography-enriched samples.
The enriched phosphoproteins identified by MS included several proteins known to be involved in cell signaling (a subset presented in Table 1) and included receptors, immunoglobulins, ubiquitin-related, cell cycle-related, and other signaling molecules. Many of these proteins have not been previously implicated in NPM-ALK-mediated lymphomagenesis.
Table 1.
Peptides Identified at 5% Error Rate in Proteins Enriched by Immunoprecipitation and Immunoaffinity Chromatography
| Chromato- graphy | Name | Description | IPI No. | Peptide | X corr | Charge state |
|---|---|---|---|---|---|---|
| IA | O52B6 | Olfactory receptor 52 B6 | 303388 | LHEPMY*IFLSMLASADVLLSTTTMPKAL | 1.38 | 1 |
| IA | IgG | Immunoglobulin heavy chain variable region | 7893 | TAIY*Y*CARISGDRGAFDMWGQG | 2.58 | 2 |
| IA | FSH-R | Follicle-stimulating hormone receptor precursor | 328365 | RARSTY*NLKKLPT | 2.62 | 2 |
| IA | CEP2 | Centrosomal protein 2 | 160622 | LQKEVVLLQAQLTLERKQKQDY*I | 2.53 | 2 |
| IA | E2G1 | Ubiquitin-conjugating enzyme E2G 1 | 514050 | KDY*PLRPPKMKFITEIWHPNVDK | 2.54 | 2 |
| IA | CLCN5 | Chloride channel 5 | 294056 | FNTSKGGELPDRPAGVGVY*SA | 2.52 | 2 |
| IA | DNAH8 | Dynein | 216653 | FEPSFCFY*TGYKIPLCKTLDQY*FEYI | 1.23 | 1 |
| IA | Statip1 | STAT3-interacting protein 1 | 15560 | VLHPSQRYVVAVGLECGKICLY*TWKKTD | 2.12 | 1 |
| IA | RASGRF1 | Ras protein-specific guanine nucleotide-releasing factor 1 | 16784 | PIITGGKALDLAALSCNSNGY*TSMY*SAMS | 2.05 | 1 |
| IA | FPR1 | Formylpeptide receptor 1 | 328644 | LPTNTSGGTPAVSAGY*LFL | 1.48 | 1 |
| IP | NCOR2 | Nuclear receptor co- repressor 2 | 1735 | ACY*EESLKSRPGTASSSGGSIAR | 3 | 2 |
| IP | IgG1 | Immunoglobulin heavy chain variable region | 7906 | IIPFSGIAY*YAQK | 2.59 | 2 |
| IP | DOCK7 | Dedicator of cytokinesis protein 7 | 513791 | LLDLLYLCVSCFEY*KGK | 2.55 | 2 |
| IP | CLK2 | CDC-like kinase 2 | 478691 | SSY*DDRSSDRRVY*D | 1.45 | 1 |
| IP | IGHV4–61 | Immunoglobulin-μ heavy chain variable region | 4995455 | WIRQPAGKGLEWIGRIY*TTGSTNSNPS | 1.6 | 1 |
| IP | EIF2C3 | Eukaryotic translation initiation factor 2C 3 | 304181 | Y*TLQLKY*PHLPCLQVGQEQK | 1.38 | 1 |
| IP | ARTS-1 | Type 1 tumor necrosis factor receptor shedding aminopeptidase | 165949 | VEWIKFNVGMNGYY* | 2.62 | 2 |
| IP | MYBPC3 | Myosin binding protein C gene | 292412 | AELIVQEKKLEVY*QSIA | 2.56 | 2 |
| IP | HLA-Cw | Major histocompatibility complex class I antigen | 144014 | LEAARAAEQLRAY*LEGTCVEWLR | 2.58 | 2 |
| IP | CCR1 | Chemokine (C-C motif) receptor 1 | 27685 | PLY*SLVFVIGLVGNILVVLV | 1.38 | 1 |
| IP | CDC2L5 | Cell division cycle 2-like 5 isoform 2 | 456970 | LPRSPSPY*SR | 2.19 | 1 |
Peptides identified by LC-MS/MS in immunoprecipitation (IP)- and immunoaffinity (IA)-enriched samples were analyzed for corresponding proteins using INTERACT and Protein Prophet and compared with the International Protein Index (IPI) database. Listed are select IP- and IA-enriched tyrosine phosphoproteins including protein name, description, National Center for Biotechnology Information accession no., and identified peptide sequence. Y*, phosphotyrosine.
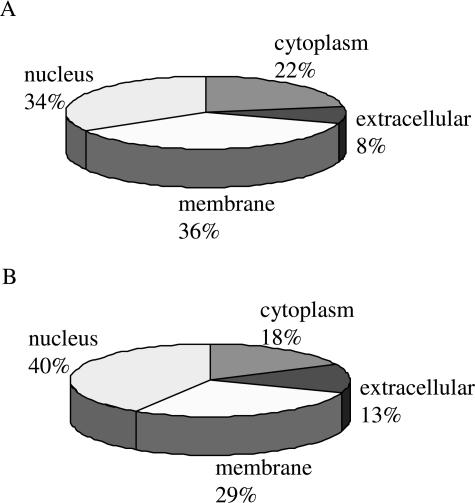
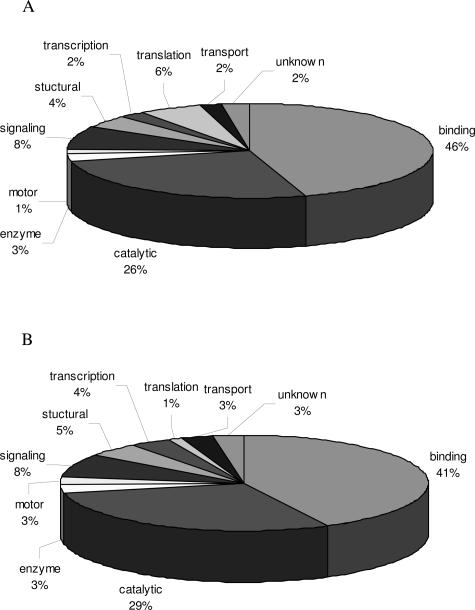
Proteins identified by LC-MS/MS in both immunoprecipitation and immunoaffinity chromatography-enriched samples were subjected to GOMiner analysis for cellular localization and molecular functions. Figure 6A illustrates cellular localization of proteins identified by LC-MS/MS enriched by immunoprecipitation, and Figure 6B illustrates those enriched by immunoaffinity chromatography. A larger percentage of proteins enriched by immunoprecipitation were localized to the cytoplasm and nucleus than those enriched by immunoaffinity chromatography. Molecular functions of proteins enriched by immunoprecipitation and immunoaffinity chromatography (Figure 7, A and B) were similar in distribution.
Figure 6.
Analysis of cellular distribution of identified proteins enriched for by immunoprecipitation (A) and immunoaffinity chromatography (B). SU-DHL-1 cells were grown to 8 × 10⁵ cells/ml and protein precipitated as described in Materials and Methods. Immunoprecipitation, SDS-PAGE, silver stain, and LC-MS/MS were performed as described. Proteins were analyzed for cellular distribution using GOMiner.
Figure 7.
Analysis of molecular functions of identified proteins enriched for by immunoprecipitation (A) and immunoaffinity chromatography (B). SU-DHL-1 cells were grown to 8 × 10⁵ cells/ml and protein precipitated as described in Materials and Methods. Immunoprecipitation, SDS-PAGE, silver stain, and LC-MS/MS were performed as described. Proteins were analyzed for molecular function using GOMiner.
Discussion
Tyrosine kinase-mediated signaling pathways are frequently deregulated in cancer.9 In one such example, the NPM-ALK fusion protein results from the t(2;5)(p23;q35) chromosomal translocation and causes constitutive ALK activation. Activated ALK has been shown to phosphorylate a variety of substrate proteins, whose signaling pathways are associated with cell growth, motility, and inhibition of apoptosis and cell cycle arrest.8,14,26,27,28,29,30
Although vital to cell signaling, tyrosine phosphoproteins are low in abundance,3 necessitating use of enrichment strategies for detection. Due to their vital roles in cellular processes, identification of tyrosine phosphoproteins is important in the investigation of specific signaling pathways exploited by oncogenes or potential substrates that may serve as surrogate biomarkers.20
The unbiased comprehensive analysis of the phosphoproteome of cancer cells by LC-MS/MS analysis would be facilitated by enrichment of tyrosine phosphoproteins. In the present study, we examined phosphotyrosine enrichment techniques using NPM-ALK-positive SU-DHL-1 cells as a model system. The results of our studies highlight the utility of an antibody-based approach at enriching for the phosphotyrosine proteome in cancer cells.
Sodium orthovanadate is a tyrosine phosphatase inhibitor that promotes an overall increase in protein tyrosine phosphorylation by mimicking the phosphorous group of phosphotyrosine.31 In this regard, we found that culturing cells in the presence of sodium orthovanadate increased the number of immunoreactive bands from 9 to 16 (Figure 2). Moreover, densitometry analysis revealed an 18% increase in NPM-ALK expression in sodium orthovanadate-treated cells. These data illustrate the utility of treating cells with sodium orthovanadate before enrichment and demonstrate its ability to promote hyperphosphorylation. Because it can be envisioned that this may result in a feedback mechanism in which phosphorylases may be activated in response, it may be necessary to perform IPs at various time points after sodium orthovanadate treatment to determine the optimal time point for protein extraction.
A comparison of antibodies used to immunoprecipitate the phosphotyrosine proteome demonstrates the utility of a complementary approach (Figure 3). Whereas 14 individual bands were identified using sc-18182, 15 were identified using 4G10. Furthermore, a 22% increase in band intensity of NPM-ALK was seen using 4G10. Interestingly, three bands (40, 33, and 18 kd) were more intense using sc-18182. These may be because sc-18182 is a polyclonal antibody that is raised in rabbits,32 whereas 4G10 is a monoclonal antibody raised in mice.33 These data illustrate the overall strength of 4G10 and the possible utility of using multiple antibodies to identify a larger subset of phosphotyrosine proteins.
Examination of immunoprecipitation and immunoaffinity chromatography-enriched proteins identified by LC-MS/MS revealed a greater than twofold increase in peptides identified in immunoprecipitation-enriched samples; however, both immunoprecipitation and immunoaffinity chromatography yielded about 10% enrichment for tyrosine phosphoproteins. These data are consistent with what was shown in Figure 4. However, at a 5% error rate (Table 1), there were 43 peptides in common between immunoprecipitation and immunoprecipitation-enriched samples. These data illustrate the potential role of using both methods of enrichment to identify more proteins.
In summary, our studies demonstrate the utility of enrichment strategies to facilitate MS-based detection of tyrosine-phosphorylated proteins. Analysis of proteins from immunoaffinity- and immunoprecipitation-enriched samples demonstrates a diverse group of proteins, primarily those involved in cell signaling. Implementation of enrichment strategies of phosphotyrosine-containing peptides or proteins offers potentially rewarding opportunities for studying signaling pathways in physiological or pathological cellular states.
Footnotes
Supported in part by the ARUP Institute for Clinical and Experimental Pathology and the Children’s Oncology Group Translational Research Award (to M.S.L.).
Current address for M.S.L.: Department of Pathology, University of Michigan, Ann Arbor, MI.
References
- Krause DS, Van Etten RA. Tyrosine kinases as targets for cancer therapy. N Engl J Med. 2005;353:172–187. doi: 10.1056/NEJMra044389. [DOI] [PubMed] [Google Scholar]
- Hunter T. Tyrosine phosphorylation in cell signaling and disease. Keio J Med. 2002;51:61–71. doi: 10.2302/kjm.51.61. [DOI] [PubMed] [Google Scholar]
- Grønborg M, Kristiansen TZ, Stensballe A, Andersen JS, Ohara O, Mann M, Jensen ON, Pandey A. A mass spectrometry-based proteomic approach for identification of serine/threonine-phosphorylated proteins by enrichment with phospho-specific antibodies: identification of a novel protein, Frigg, as a protein kinase A substrate. Mol Cell Proteomics. 2002;1:517–527. doi: 10.1074/mcp.m200010-mcp200. [DOI] [PubMed] [Google Scholar]
- Blume-Jensen P, Hunter T. Oncogenic kinase signalling. Nature. 2001;411:355–365. doi: 10.1038/35077225. [DOI] [PubMed] [Google Scholar]
- Lugo TG, Pendergast AM, Muller AJ, Witte ON. Tyrosine kinase activity and transformation potency of bcr-abl oncogene products. Science. 1990;247:1079–1082. doi: 10.1126/science.2408149. [DOI] [PubMed] [Google Scholar]
- Chabot B, Stephenson DA, Chapman VM, Besmer P, Bernstein A. The proto-oncogene c-kit encoding a transmembrane tyrosine kinase receptor maps to the mouse W locus. Nature. 1988;335:88–89. doi: 10.1038/335088a0. [DOI] [PubMed] [Google Scholar]
- Williams LT. Signal transduction by the platelet-derived growth factor receptor. Science. 1989;243:1564–1570. doi: 10.1126/science.2538922. [DOI] [PubMed] [Google Scholar]
- Elmberger PG, Lozano MD, Weisenburger DD, Sanger W, Chan WC. Transcripts of the npm-alk fusion gene in anaplastic large cell lymphoma, Hodgkin’s disease, and reactive lymphoid lesions. Blood. 1995;86:3517–3521. [PubMed] [Google Scholar]
- Imaizumi M, Nishimura M, Takeuchi S, Murase M, Hamaguchi M. Role of tyrosine specific phosphorylation of cellular proteins, especially EGF receptor and p125FAK in human lung cancer cells. Lung Cancer. 1997;17:69–84. doi: 10.1016/s0169-5002(97)00650-8. [DOI] [PubMed] [Google Scholar]
- Ladanyi M, Cavalchire G, Morris SW, Downing J, Filippa DA. Reverse transcriptase polymerase chain reaction for the Ki-1 anaplastic large cell lymphoma-associated t(2;5) translocation in Hodgkin’s disease. Am J Pathol. 1994;145:1296–1300. [PMC free article] [PubMed] [Google Scholar]
- Morris SW, Kirstein MN, Valentine MB, Dittmer KG, Shapiro DN, Saltman DL, Look AT. Fusion of a kinase gene, ALK, to a nucleolar protein gene NPM, in non-Hodgkin’s lymphoma. Science. 1994;263:1281–1284. doi: 10.1126/science.8122112. [DOI] [PubMed] [Google Scholar]
- Pulford K, Lamant L, Morris SW, Butler LH, Wood KM, Stroud D, Delsol G, Mason DY. Detection of anaplastic lymphoma kinase (ALK) and nucleolar protein nucleophosmin (NPM)-ALK proteins in normal and neoplastic cells with the monoclonal antibody ALK1. Blood. 1997;89:1394–1404. [PubMed] [Google Scholar]
- Mason DY, Pulford KA, Bischof D, Kuefer MU, Butler LH, Lamant L, Delsol G, Morris SW. Nucleolar localization of the nucleophosmin-anaplastic lymphoma kinase is not required for malignant transformation. Cancer Res. 1998;58:1057–1062. [PubMed] [Google Scholar]
- Crockett DK, Lin Z, Elenitoba-Johnson KS, Lim MS. Identification of NPM-ALK interacting proteins by tandem mass spectrometry. Oncogene. 2004;23:2617–2629. doi: 10.1038/sj.onc.1207398. [DOI] [PubMed] [Google Scholar]
- Rush J, Moritz A, Lee KA, Guo A, Goss VL, Spek EJ, Zhang H, Zha XM, Polakiewicz RD, Comb MJ. Immunoaffinity profiling of tyrosine phosphorylation in cancer cells. Nat Biotechnol. 2005;23:94–101. doi: 10.1038/nbt1046. [DOI] [PubMed] [Google Scholar]
- Sachon E, Mohammed S, Bache N, Jensen ON. Phosphopeptide quantitation using amine-reactive isobaric tagging reagents and tandem mass spectrometry: application to proteins isolated by gel electrophoresis. Rapid Commun Mass Spectrom. 2006;20:1127–1134. doi: 10.1002/rcm.2427. [DOI] [PubMed] [Google Scholar]
- Kånge R, Selditz U, Granberg M, Lindberg U, Ekstrand G, Ek B, Gustafsson M. Comparison of different IMAC techniques used for enrichment of phosphorylated peptides. J Biomol Tech. 2005;16:91–103. [PMC free article] [PubMed] [Google Scholar]
- Stensballe A, Andersen S, Jensen ON. Characterization of phosphoproteins from electrophoretic gels by nanoscale Fe(III) affinity chromatography with off-line mass spectrometry analysis. Proteomics. 2001;1:207–222. doi: 10.1002/1615-9861(200102)1:2<207::AID-PROT207>3.0.CO;2-3. [DOI] [PubMed] [Google Scholar]
- Bush KD, Lumpkin JA. Structural damage to lactate dehydrogenase during copper iminodiacetic acid metal affinity chromatography. Biotechnol Prog. 1998;14:943–950. doi: 10.1021/bp9800539. [DOI] [PubMed] [Google Scholar]
- Ibarrola N, Molina H, Iwahori A, Pandey A. A novel proteomic approach for specific identification of tyrosine kinase substrates using [13C]tyrosine. J Biol Chem. 2004;279:15805–15813. doi: 10.1074/jbc.M311714200. [DOI] [PubMed] [Google Scholar]
- Kersey PJ, Duarte J, Williams A, Karavidopoulou Y, Birney E, Apweiler R. The International Protein Index: an integrated database for proteomics experiments. Proteomics. 2004;4:1985–1988. doi: 10.1002/pmic.200300721. [DOI] [PubMed] [Google Scholar]
- Keller A, Nesvizhskii AI, Kolker E, Aebersold R. Empirical statistical model to estimate the accuracy of peptide identifications made by MS/MS and database search. Anal Chem. 2002;74:5383–5392. doi: 10.1021/ac025747h. [DOI] [PubMed] [Google Scholar]
- Elias JE, Haas W, Faherty BK, Gygi SP. Comparative evaluation of mass spectrometry platforms used in large-scale proteomics investigations. Nat Methods. 2005;2:667–675. doi: 10.1038/nmeth785. [DOI] [PubMed] [Google Scholar]
- Zeeberg BR, Feng W, Wang G, Wang MD, Fojo AT, Sunshine M, Narasimhan S, Kane DW, Reinhold WC, Lababidi S, Bussey KJ, Riss J, Barrett JC, Weinstein JN. GoMiner: a resource for biological interpretation of genomic and proteomic data. Genome Biol. 2003;4:R28. doi: 10.1186/gb-2003-4-4-r28. [DOI] [PMC free article] [PubMed] [Google Scholar]
- Feng W, Wang G, Zeeberg BR, Guo K, Fojo AT, Kane DW, Reinhold WC, Lababidi S, Weinstein JN, Wang MD: Development of gene ontology tool for biological interpretation of genomic and proteomic data. AMIA Annu Symp Proc 2003, 839 [PMC free article] [PubMed] [Google Scholar]
- Turner SD, Tooze R, Maclennan K, Alexander DR. Vav-promoter regulated oncogenic fusion protein NPM-ALK in transgenic mice causes B-cell lymphomas with hyperactive Jun kinase. Oncogene. 2003;22:7750–7761. doi: 10.1038/sj.onc.1207048. [DOI] [PubMed] [Google Scholar]
- Watanabe M, Sasaki M, Itoh K, Higashihara M, Umezawa K, Kadin ME, Abraham LJ, Watanabe T, Horie R. JunB induced by constitutive CD30-extracellular signal-regulated kinase 1/2 mitogen-activated protein kinase signaling activates the CD30 promoter in anaplastic large cell lymphoma and reed-sternberg cells of Hodgkin lymphoma. Cancer Res. 2005;65:7628–7634. doi: 10.1158/0008-5472.CAN-05-0925. [DOI] [PubMed] [Google Scholar]
- Slupianek A, Nieborowska-Skorska M, Hoser G, Morrione A, Majewski M, Xue L, Morris SW, Wasik MA, Skorski T. Role of phosphatidyl-inositol 3-kinase-Akt pathway in nucleophosmin/anaplastic lymph-oma kinase-mediated lymphomagenesis. Cancer Res. 2001;61:2194–2199. [PubMed] [Google Scholar]
- Zhang Q, Raghunath PN, Xue L, Majewski M, Carpentieri DF, Odum N, Morris S, Skorski T, Wasik MA. Multilevel dysregulation of STAT3 activation in anaplastic lymphoma kinase-positive T/null-cell lymphoma. J Immunol. 2002;168:466–474. doi: 10.4049/jimmunol.168.1.466. [DOI] [PubMed] [Google Scholar]
- Ouyang T, Bai RY, Bassermann F, von Klitzing C, Klumpen S, Miething C, Morris SW, Peschel C, Duyster J. Identification and characterization of a nuclear interacting partner of anaplastic lymphoma kinase (NIPA). J Biol Chem. 2003;278:30028–30036. doi: 10.1074/jbc.M300883200. [DOI] [PubMed] [Google Scholar]
- Brown DJ, Gordon JA. The stimulation of pp60v-src kinase activity by vanadate in intact cells accompanies a new phosphorylation state of the enzyme. J Biol Chem. 1984;259:9580–9586. [PubMed] [Google Scholar]
- Lemmon MA, Schlessinger J. Regulation of signal transduction and signal diversity by receptor oligomerization. Trends Biochem Sci. 1994;19:459–463. doi: 10.1016/0968-0004(94)90130-9. [DOI] [PubMed] [Google Scholar]
- Thomas SM, Soriano P, Imamoto A. Specific and redundant roles of Src and Fyn in organizing the cytoskeleton. Nature. 1995;376:267–271. doi: 10.1038/376267a0. [DOI] [PubMed] [Google Scholar]


