

Abstract
The electrical conductivity value of the human skull is important for biophysics research of the brain. In the present study, the human brain-to-skull conductivity ratio was estimated through in vivo experiments utilizing intra-cranial electrical stimulation in two epilepsy patients. A realistic geometry inhomogeneous head model including the implanted silastic grids was constructed with the aid of the finite element method, and used to estimate the conductivity ratio. Averaging over 49 sets of measurements, the mean value and standard deviation of the brain-to-skull conductivity ratio were found to be 18.7 and 2.1, respectively.
Keywords: Conductivity, Bioimpedance, Skull, Brain
The ability to localize brain activity from noninvasive electrical measurements over the scalp provides a better understanding of the mechanisms of brain functions and aids clinical diagnosis and management of various neurological disorders. Determination of the physical properties of the human head volume conductor1,2,3, is essential for accurate localization of brain electrical activity. A number of experimental studies have suggested the appropriateness of the piecewise homogeneous head volume conductor (PHVC) model, in which different conductivity values of each tissue type (brain, skull, scalp) are used4,5. The proper determination of these conductivity values plays an important role for obtaining high accuracy brain source localization. In the PHVC model, the conductivity values can be reflected in the ratio of scalp and skull conductivities relative to the conductivity of the brain. While the scalp is assumed to have the same conductivity as that of the brain, in most investigations 1,2,6,7 the skull is set to a much lower value than that of the soft tissues.
The correct value for the brain-to-skull conductivity ratio is still controversial. Rush and Driscoll8 estimated the value of 80 as an optimal effective conductivity ratio between the human skull and a permeating fluid (modeling the skin and scalp muscles) by using an electrolytic tank to measure the impedance of the human skull. Cohen and Cuffin9 suggested the brain-to-skull conductivity ratio of 80 in a combined analysis of the electroencephalogram (EEG) and magnetoencephalogram (MEG) recordings evoked by the same stimulus. More recently, Oostendorp et al10 suggested a different brain-to-skull conductivity ratio of 15 from their in vitro and in vivo experiments in two human subjects. Lai et al7 used a spherical head model based cortical imaging technique to estimate the human brain-to-skull conductivity ratio from 5 epilepsy patients and suggested the in vivo human brain-to-skull conductivity ratio of 24.8±6.6.
In the present study, we estimated the human brain-to-skull conductivity ratio through in vivo experiments in two pediatric epilepsy patients who underwent simultaneous scalp EEG measurements and intra-cranial electrical stimulation delivered via a pair of electrodes in the implanted sub-dural grids. The methods used are illustrated in Fig. 1. The finite element method (FEM)1 was used to solve the EEG forward problem, utilizing the realistic geometries of the post-operative head including the scalp, skull, brain and the silastic sub-dural grids reconstructed from co-registered magnetic resonance (MR) and computer tomography (CT) images2. Data were collected on 2 pediatric epilepsy patients according to a protocol approved by the Institutional Review Boards (IRBs) of the University of Minnesota and University of Chicago. Whole-head MR and CT images were obtained respectively prior to and following implantation of the silastic sub-dural grids. During 2-sec epochs, sinusoidal electrical current at a frequency of 50 Hz and amplitudes between 1 and 10 mA was delivered via a pair of intra-cranial electrodes with a distance of 1cm. The scalp potentials were simultaneously recorded with a 400 Hz sampling rate and band-pass filtering from 1 to 100 Hz. During the post-processing, the scalp potentials caused by the 50 Hz frequency component were further extracted for the conductivity ratio estimation. The surfaces of the scalp, skull and brain and the implanted silastic sub-dural grids were reconstructed from co-registered MR and CT image data sets with the aid of Curry 5.0 (NeuroScan Lab, TX). The corresponding volumes were constructed using Rhinoceros software (Robert McNeel and Assoc., WA), and Ansys 7.0 (ANSYS. Inc, PA) was subsequently used to build the realistic geometry FEM head model with 167,395 tetrahedrons (including 5,325 tetrahedrons for the Silastic grids) and 29,858 nodes for patient #12 (the number of finite elements for patient #2 were about the same as in patient #1). Because the Silastic grid is a kind of insulator, a very small conductivity value, 3.3e-11 S/m was set to the Silastic subdural grids. The scalp potentials due to the injected currents were calculated by the FEM based upon the realistic geometry FEM head model for a given brain-to-skull conductivity ratio. The value of the brain-to-skull conductivity ratio was estimated by maximizing the correlation coefficient between the recorded and FEM-model generated scalp potentials with the aid of the simplex method.
Fig. 1.
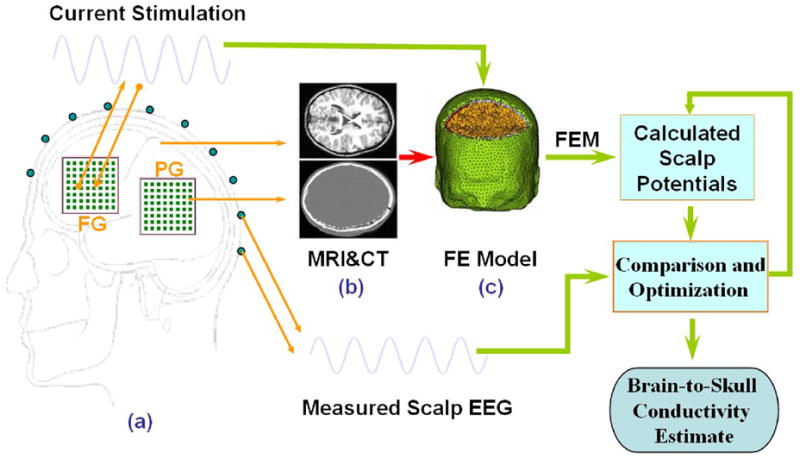
Schematic diagram of the procedures to estimate the in vivo brain-to-skull conductivity ratio in human subjects. The electrical potentials over the scalp are recorded during injection of current onto a pair of adjacent subdural electrodes (1 cm apart). The realistic geometry inhomogeneous head model was constructed from the MRI and CT images of the subject, including the brain, skull, scalp, and the silastic subdural grids. The finite element method is used to solve the electric fields due to current injection with various conductivity profiles. The difference between the measured and model-predicted scalp electric potentials is minimized by means of the simplex method, with the parameter of brain-to-skull conductivity ratio.
Computer simulations were conducted to test the validity and evaluate the performance of the above-mentioned procedure. Brain-to-skull conductivity ratios of 20, 50, and 80 were tested in the FEM head model. The scalp electrical potentials at 32 locations were calculated by the FEM and the noise-contaminated scalp potential measurements were simulated by adding Gaussian white noise (GWN) with noise level of 10% to the computed scalp potentials, and GWN with standard deviation of 5mm to the scalp electrode positions. In the computer simulations, the brain-to-skull conductivity ratio was estimated with a relative error of less than 10%, when the testing brain-to-skull conductivity ratio was set to 20, 50 or 80, regardless of the initial value in the search procedure. The computer simulations provided a calibration of the present estimation procedures.
In the human experimentation, scalp potential signals were recorded for a duration of 2-sec, and averaged for each of the stimulation experiments. The averaged signals with the largest signal-to-noise ratio (SNR) were used to estimate the brain-to-skull conductivity ratio. The results from patient #1 are shown in Fig. 2, where the electrical currents were injected into nine locations, sequentially one location at a time (8 in the frontal grids and 1 in the posterior grid) with stimulation strength ranging from 6 mA to 9 mA. The results indicate that the estimated brain-to-skull conductivity ratio remained at a similar level, but some variations are observed for different current stimulation strengths and among different stimulation locations. While the variation in the estimate was relatively small for a given stimulation location, the variation occurred maybe due to the different signal-to-noise ratio in the scalp potential measurements. The horizontal bars in Fig. 2 depict the mean value for each of the stimulation locations. Averaged over 29 sets of data in patient #1, the brain-to-skull conductivity ratio was estimated to be 17.9±2.3. The results from patient #2 are shown in Fig. 3, where there were three stimulation locations with the injected current strength ranging from 4 mA to 9 mA. The results from patient #2 were similar to those in patient #1. Averaged over 20 sets of data in patient #2, the brain-to-skull conductivity ratio was estimated to be 19.9±1.0, which is close to the estimate from patient #1. Summarizing all 49 sets of data from the two patients studied, the brain-to-skull conductivity ratio was estimated to be 18.7±2.1.
Fig. 2.
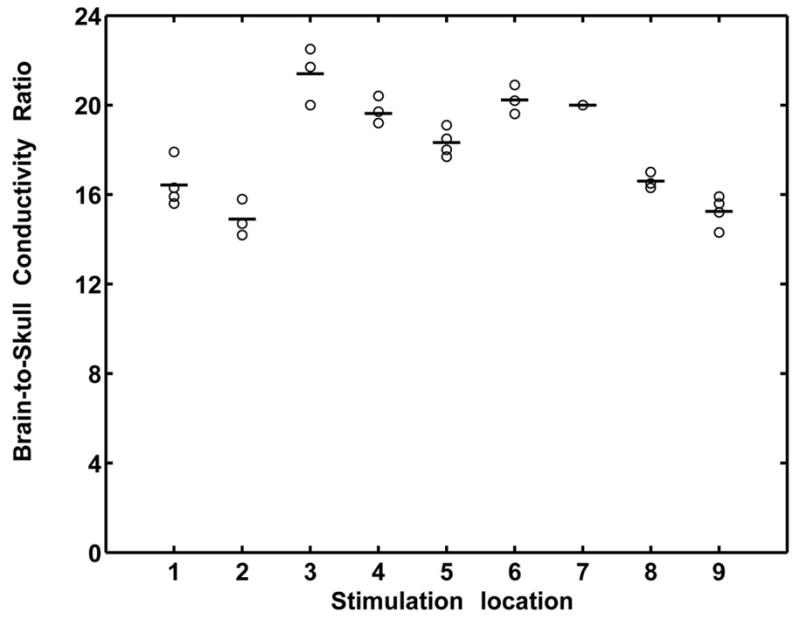
Estimated brain-to-skull conductivity ratio in subject #1, at various stimulating locations with various strength of current injection. Open circles refer to the values of brain-to-skull conductivity ratio. Horizontal bars refer to the mean values of the brain-to-skull conductivity ratio obtained when current was injected at a given location. Stimulation locations 1 through 9 refer to the stimulating electrode pairs: 1: FG11-12; 2: FG13-14; 3: FG15-16; 4: FG17-18; 5: FG19-20; 6: FG23-24; 7: FG28-29; 8: FG35-36; 9: PG47-48. The stimulation strength ranges from 6 mA to 9 mA. Note that the brain-to-skull conductivity ratio values ranged from 14 to 23 in this subject, with the mean and standard deviation being 17.9±2.3.
Fig. 3.
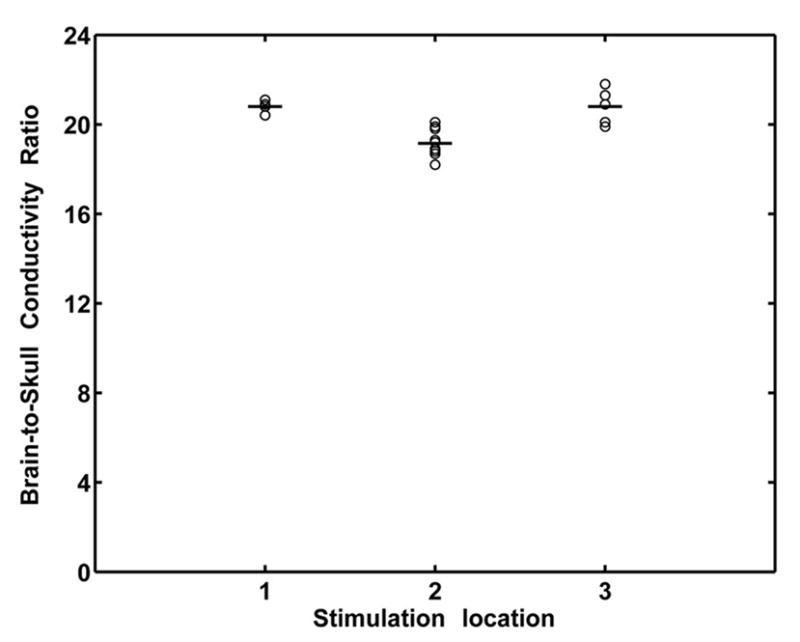
Estimated brain-to-skull conductivity ratio in subject #2, at various stimulating locations with various strength of current injection. See caption of Fig. 2 for notation. Stimulation locations 1 through 3 refer to the stimulating electrode pairs: 1: PAR36-37; 2: PAR43-44; 3: PAR46-47. The stimulation strength ranges from 4 mA to 9 mA. Note that the mean and standard deviation of the brain-to-skull conductivity ratio values is 19.9±1.0 in this subject.
The in vivo human brain-to-skull conductivity ratio is an important physical parameter which has wide implications for various applications to model and localize brain electrical activity from EEG and MEG measurements. In the present study we estimate the effective in vivo human brain-to-skull conductivity ratio in a realistic geometry inhomogeneous head volume conductor in which implanted silastic sub-dural grids are included. The present intra-cranial electrical stimulation protocol represents a desirable and well-controlled experimental set-up to determine the conductivity profile of the volume conducting medium. The current clinical setup necessitates the use of the silastic sub-dural grids, but the insulating properties of the material2 substantially distort the current flow in its vicinity, leading to severe modeling errors of the scalp potential field. The skull conductivity estimated in the head volume conductor, which neglects the silastic sub-dural grids, is the equivalent conductivity which combines the conductivity values of the skull and silastic sub-dural grids. Lai et al7 used a cortical imaging technique to estimate the human brain-to-skull conductivity ratio based upon multi-channel simultaneous intra- and extra-cranial electrical potential recordings in a 3-shell spherical head volume conductor. Their study did not include the effects of the implanted silastic sub-dural grids and suggested a mean value of 24.8 as the brain-to-skull conductivity ratio with a standard deviation of 6.6. In the present study, we not only considered the realistic geometry of the head volume conductor, but also included the silastic sub-dural grids into our FEM head model. By including the effect of silastic subdural grids, the in vivo brain-to-skull conductivity ratio was estimated to be 18.7±2.1, in comparison to the previous estimate of 24.8±6.6. Note that some inter-subject variation in the brain-to-skull conductivity ratio estimates was observed. This maybe due to the intrinsic properties of biological tissues, and is consistent with the other findings as reported in literature7,10.
In summary, the present effective in vivo human brain-to-skull conductivity ratio of 18.7±2.1 provides the most realistic estimate using an experimental protocol combining intracranial stimulation, simultaneous scalp recordings, MRI/CT imaging, and realistic modeling of both the head geometry and conductivity property of implanted silastic sub-dural strips. The present results promise to provide an important parameter for the physical properties of human head, which will have a lasting impact on research in modeling and localization of electrical brain activity and thus aiding neuroscience research and clinical diagnosis and management of a variety of brain disorders.
Acknowledgments
The authors are grateful to Lei Ding for useful discussions. This work was supported in part by NIH RO1 EB00178 and NSF BES-0411898.
Contributor Information
Yingchun Zhang, Department of Biomedical Engineering, University of Minnesota, Minneapolis, MN 55455.
Wim van Drongelen, Department of Pediatrics, University of Chicago, Chicago, IL 60637, USA.
Bin He, Department of Biomedical Engineering, University of Minnesota, 7-105 NHH, 312 Church Street, Minneapolis, MN 55455.
References
- 1.Zhang YC, Zhu SA, He B. Phys Med Biol. 2004;49:2975. doi: 10.1088/0031-9155/49/13/014. [DOI] [PubMed] [Google Scholar]
- 2.Zhang YC, Ding L, van Drongelen W, Hecox K, Frim DM, He B. Neuroimage. 2006;31:1513. doi: 10.1016/j.neuroimage.2006.02.027. [DOI] [PMC free article] [PubMed] [Google Scholar]
- 3.Neilson LA, Kovalyov M, Koles ZJ. Clin Neurophysiol. 2005;116:2302. doi: 10.1016/j.clinph.2005.07.010. [DOI] [PubMed] [Google Scholar]
- 4.Nunez PL, Srinivasan R. Electric fields of the brain: the neurophysics of EEG. 2. Oxford University Press; New York: 2005. [Google Scholar]
- 5.Malmivuo J, Plonsey R. Bioelectromagnetism - principles and applications of bioelectric and biomagnetic fields. Oxford University Press; New York: 1995. [Google Scholar]
- 6.He B, Wang YH, Wu DS. IEEE Trans Biomed Eng. 1999;46:1264. doi: 10.1109/10.790505. [DOI] [PubMed] [Google Scholar]
- 7.Lai Y, van Drongelen W, Ding L, Hecox K, Towle VL, Frim DM, He B. Clinical Neurophysiology. 2005;116:456. doi: 10.1016/j.clinph.2004.08.017. [DOI] [PubMed] [Google Scholar]
- 8.Rush S, Driscoll DA. Anesth Analg. 1968;47:717. [PubMed] [Google Scholar]
- 9.Cohen D, Cuffin BN. Electroencph Clin Neurophysiol. 1983;56:38. doi: 10.1016/0013-4694(83)90005-6. [DOI] [PubMed] [Google Scholar]
- 10.Oostendorp TF, Delbeke J, Stegeman DF. IEEE Trans Biomed Eng. 2000;47:1487. doi: 10.1109/TBME.2000.880100. [DOI] [PubMed] [Google Scholar]