Abstract
Identification of prognostic and predictive genomic markers requires long-term clinical follow-up of patients. Extraction of high-quality DNA from archived formalin-fixed, paraffin-embedded material is essential for such studies. Of particular importance is a robust reproducible method of whole genome amplification for small tissue samples. This is especially true for high-resolution analytical approaches because different genomic regions and sequences may amplify differentially. We have tested a number of protocols for DNA amplification for array-based comparative genomic hybridization (CGH), in which relative copy number of the entire genome is measured at 1 to 2 mb resolution. Both random-primed amplification and degenerate oligonucleotide-primed amplification approaches were tested using varying amounts of fresh and paraffin-extracted normal and breast tumor input DNAs. We found that random-primed amplification was clearly superior to degenerate oligonucleotide-primed amplification for array-based CGH. The best quality and reproducibility strongly depended on accurate determination of the amount of input DNA using a quantitative polymerase chain reaction-based method. Reproducible and high-quality results were attained using 50 ng of input DNA, and some samples yielded quality results with as little as 5 ng input DNA. We conclude that random-primed amplification of DNA isolated from paraffin sections is a robust and reproducible approach for array-based CGH analysis of archival tumor samples.
Genomic analysis of tumor DNA allows identification of alterations in sequence and copy number for individualized diagnostic, prognostic, and therapeutic decision making. This is especially relevant as personalized treatments for cancer patients based on specific genomic alterations become clinically available. Although DNA extracted from freshly acquired samples is optimum for these analyses, it is not always feasible to freeze away such samples given the constraints of clinical practice. Thus, having optimized protocols for extraction of DNA from formalin blocks is a necessary adjunct to recently developed clinical testing for tumor DNA alterations.
One of the most useful approaches for analysis of DNA copy number alterations over the entire genome uses an array-based comparative genomic hybridization (CGH) analysis of DNA clones at 1-mb resolution.1,2,3 Current protocols for array CGH commonly require μg quantities of high-quality DNA.4 Such material is generally not available from paraffin sections of formalin-fixed material, especially when tumors are small or require microdissection to remove contaminating normal or necrotic elements.
A number of protocols have been reported for extraction and genomic amplification of archival material for application to standard (chromosome-based) or even array-based CGH, with varying quality of the resultant analyses. Degenerate oligonucleotide-primed (DOP) polymerase chain reaction (PCR)5,6 and genomic representation amplification7,8 have been tested using small numbers of cells with some success, but tend to preferentially amplify some sequences over others, and as yet have not resulted in true quantitative genomic copy number, even using cell lines as test samples. This type of amplification works satisfactorily for gene-specific PCR (which does not require uniformity across the genome), but generally does not yield consistent or complete genomic representation, mostly because of poor DNA quality and low quantity available from archival formalin-fixed tumor material.
In this report we demonstrate that consistent high-quality quantitative results can be achieved by array CGH after random prime amplification (RPA) and labeling. Further, we show that careful attention to quantitation of the starting DNA from manually microdissected paraffin material is necessary for optimum results.
Materials and Methods
Samples
Four invasive breast cancers for which both frozen and formalin-fixed, paraffin-embedded samples were available were selected from the collection of the University of California San Francisco Comprehensive Cancer Center Breast Oncology Program Tissue Core. All samples were coded. The study received University of California San Francisco Institutional Review Board approval. Each frozen or paraffin block was reviewed to assure that at least 70% tumor cells were present before sectioning and DNA extraction.
Manual Microdissection and DNA Extraction from Paraffin Samples
Microdissection and DNA extraction of paraffin samples was performed as described previously (http://cc.ucsf.edu/people/waldman/Protocols/index.html).9,10,11 Nine consecutive 5-μm slides were cut from each block. Slides 2, 5, and 8 were stained with hematoxylin and eosin (H&E) for a guide, and the remaining six slides were stained with 0.1% methyl green for manual microdissection. Areas of tumor were identified on the H&E sections and then normal and other unwanted regions were scraped away from the regions of interest using a no. 11 surgical blade. A small drop of extraction buffer [10 mmol/L Tris, 1.5 mmol/L MgCl2, 50 mmol/L KCl, 0.5% Tween-20 buffer, 4 mg/ml proteinase K (Sigma, catalog no. p2308)] was placed on the region of interest, which was then scraped with a no. 15 surgical blade and deposited in 15 μl of DNA extraction buffer per 1000 cells. The microdissected tissue was incubated in a shaking water bath at 55°C for 3 days, adding 0.02 μl of 20 mg/ml proteinase K per μl of DNA extraction buffer on days 2 and 3. At the end of the incubation the proteinase K was inactivated by heating at 95°C for 15 minutes. Samples were then concentrated using a Microcon YM-30 column (Amicon Millipore, Bedford, MA), with elution into deionized water.
DNA Extraction from Frozen Samples
Samples from the same tumors were collected and frozen in OCT immediately after surgery, and stored at −70°C. An initial H&E-stained frozen section was examined to allow trimming of the block for exclusion of nontumor material. The tumor section was reviewed to have greater than 70% tumor cells. Ten to fifteen 50-μm sections were cut and stored at −70°C for DNA extraction. A final 5-μm H&E section was reviewed for validation of tumor remaining in the block. Genomic DNA was extracted according to standard procedures using proteinase K digestion and phenol-chloroform extraction as described previously (http://cc.ucsf.edu/people/waldman/Protocols/index.html). Normal DNA pooled from several individuals of the same sex was obtained from Promega (Madison, WI). This was used as a reference control because use of paraffin normal DNA yielded variable and poor quality results.
DNA Quantitation
Extracted DNA was quantitated before and after DNA amplification by TaqMan real-time PCR using a mix of CA repeat probes.12 DNA extracted from paraffin sections showed significant variability when measured by absorbance or fluorometry. One μl of sample DNA was analyzed by quantitative PCR in duplicate. A standard curve using pooled normal genomic DNA at 30, 3, 0.3, and 0.03 ng/μl (measured by fluorometry) was run in duplicate for analysis of tumor sample DNA concentration.
Random Prime Amplification (RPA)
RPA was performed with varying amounts of DNA (5, 10, or 50 ng by quantitative PCR) using components from the BioPrime DNA labeling system (Invitrogen, Carlsbad, CA). Test and reference DNAs were combined with 300 ng/μl of random oligodeoxyribonucleotide primers, and water to a volume of 22 μl, denatured at 100°C for 10 minutes, and then immediately cooled on ice. A 3-μl mixture of 20 U of Klenow enzyme, 200 μmol/L dATP, 200 μmol/L dCTP, 200 μmol/L dTTP, and 200 μmol/L dGTP were added and the reaction was incubated at 37°C for 2 hours. Excess nucleotides were removed using the QIAquick PCR purification kit (Qiagen Inc., Valencia, CA) and the amplified DNA was eluted in water. The amplified DNA products were measured by quantitative PCR as described above.
Degenerate Oligonucleotide Polymerase Chain Reaction (DOP Amplification)
DNA was amplified by DOP amplification as described previously.10,11 Briefly, 5 preamplification cycles were followed by 5 cycles of sequenase treatment, followed by 35 cycles of amplification. The PCR reactions were cleaned up by Qiaquick PCR purification columns (Qiagen) and eluted into water.
Labeling
The entire amplified DNA product, or else 500 ng of fresh nonamplified DNA, was labeled. DNA was combined with 24 μg of random primers and water to 64.4 μl, denatured at 100°C for 10 minutes, and immediately cooled on ice. This was then combined with 15.6 μl of 64 U of Klenow enzyme, 200 μmol/L dATP, 200 μmol/L dCTP, 200 μmol/L dGTP, 100 μmol/L dTTP, and 75 μmol/L cy-dye conjugated dUTP, and was incubated for 2 hours at 37°C. Tumor DNA was labeled with FluoroLink Cy3-dUTP, and reference DNA (used in the two-color array hybridization) was labeled with FluoroLink Cy5-dUTP (Amersham Pharmacia, Piscataway, NJ). After labeling, excess primers and nucleotides were removed using a Sephadex G-50 column (Amersham Pharmacia).
Array CGH Hybridizations
Array CGH was performed according to protocols described previously.1,3,13 Human Array 2.0 chromium surface arrays were obtained from the University of California San Francisco Cancer Center Array Core (kindly provided by Donna Albertson and Dan Pinkel). Each array was composed of 2464 BACs printed in triplicate, at a resolution of ∼1.5 mb, representing the entire human genome. Before use, arrays were UV cross-linked at 1300 mJ in a Stratalinker light box (Stratagene, La Jolla, CA).
Labeled tumor and reference DNAs, generated from the same amount of input DNA, were combined, 100 μg (measured by fluorometry) Cot-1 DNA (Invitrogen) was added, and the mixture was precipitated using 1/10 vol of 3 mol/L sodium acetate, pH 5.2, and 2.5 vol of 100% ethanol. DNA was initially redissolved in 18 μl of a solution of 33 μg/μl yeast t-RNA (Invitrogen) with 9% sodium dodecyl sulfate. This was then thoroughly mixed with 42 μl of hybridization solution consisting of 71% formamide, 14% dextran sulfate, and 2.9× standard saline citrate. The DNA was then denatured at 73°C for 15 minutes, incubated at 37°C for 30 minutes, and applied to the array. The slide was sealed inside a slide box humidified with 50% formamide/2× standard saline citrate and then placed on a rocking platform and incubated at 37°C for 48 hours. For uniformity, slides were turned 180 degrees, hybridization mixture side up, twice per day.
After hybridization, the array was washed twice in 50% formamide/2× standard saline citrate at 45°C for 10 minutes, and twice in phosphate buffer with 0.1% Nonidet P-40, pH 8.0 (PN buffer) at room temperature for 10 minutes. While the slide was still wet with PN buffer, 100 μl of 3 μg/ml 4,6-diamidino-2-phenylindole in 10% phosphate-buffered saline (pH 9) in glycerol was added to the slide. A 24 × 50-mm glass coverslip (Fisher Scientific, Tustin, CA) was applied, excess PN and 4,6-diamidino-2-phenylindole was blotted out, and then sealed along the edges with clear nail enamel.
Image Capture and Processing
Arrays were imaged using a charge-coupled device camera as described previously.1 Intensity data were acquired through 4,6-diamidino-2-phenylindole, Cy-3, and Cy-5 channels. The SPOT 2.0 software program (available at http://cc.ucsf.edu/jain/public) was used to process the image data.14 For each clone, an average single centered log2 ratio of test intensity over reference intensity was calculated from the three replicate spots on the array.
Array CGH Quality Assessment
Both objective and subjective measures of data quality were used. The SD of the log2 ratios for whole chromosomal arms that were completely gained, lost, or had no change were calculated. The threshold for determining gains or losses was defined as log2ratio greater than 0.225 or less than −0.225. This threshold was 2 standard deviations from the mean, and has been confirmed using cell lines with known alterations (data not shown). Other subjective interpretations of quality (noisiness of the analysis) were also used (see Results).
Analysis
Clones were excluded from analysis when they were suspected polymorphic clones (http://cc.ucsf.edu/people/waldman/breast/hwang.polymorphisms.xls) had fewer than two replicates, or had a SD value greater than 0.3 for log2ratio. Clones that yielded results in less than 70% of the samples tested were also excluded from analysis because they did not perform consistently, presumably because of printing or hybridization problems.
Concordance between pairs of fresh and paraffin tumors was calculated using a kappa statistic.15 This was chosen to take into account that these pairs might have differing degrees of copy number changes. A pair with a κ value greater than 0.6 is considered to be in substantial agreement, and a pair with a κ value greater than 0.8 is considered to be in almost perfect agreement.
Results
DNA Quantitation
DNA extracted from unfixed (fresh/frozen) tumors and cell lines showed consistent quantitation when measured by fluorometry, spectrophotometry (A260), or quantitative PCR (TaqMan), although absorbance measurements tended to vary more according to the quality of the DNA being measured. In contrast, measurement of DNA extracted from paraffin sections showed large inconsistencies among these analytical approaches. Absorbance measurements showed the most divergence, although fluorometry disagreed with quantitative PCR in a number of samples tested. Further, fluorometry was nonlinear when measuring concentrations less than 50 ng/μl, and archival specimens frequently yielded concentrations below this value. Thus, quantitation by PCR was used to determine the quantity of input DNA for the experiments reported.
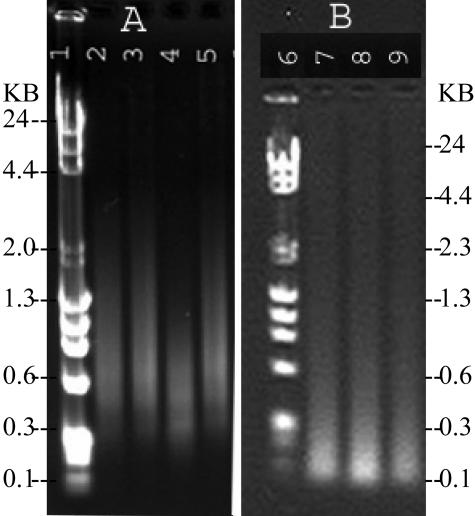
DNA was measured after both random prime and DOP amplification (Table 1). Amplification of fresh DNA consistently resulted in more product than amplification of paraffin DNA. DOP amplification resulted in two to five times more DNA product than RPA. In general, 5 ng of starting material resulted in a lower yield, but higher fold increase of DNA than 50 ng, for both amplification protocols. The size of DNA product from the two amplification protocols was evaluated by agarose gel electrophoresis (Figure 1). In general paraffin DNA resulted in a smaller range of DNA size after DOP amplification (Figure 1, lane 4) than after the random prime amplification (Figure 1, lane 8).
Table 1.
Quantitation of Amplified DNA
| Random prime amplification Input DNA
|
DOP amplification Input DNA
|
|||
|---|---|---|---|---|
| 5 ng | 50 ng | 5 ng | 50 ng | |
| Fresh DNA A | 350 ng* | 522 ng | 2000 ng | 3744 ng |
| (72×)† | (10×) | (388×) | (74×) | |
| Fresh DNA B | 340 ng | 860 ng | 1861 ng | 3307 ng |
| (68×) | (17×) | (372×) | (66×) | |
| Paraffin DNA | 200 ng | 412 ng | 1372 ng | 875 ng |
| (39×) | (8×) | (274×) | (17×) | |
DNA input and product were both measured by quantitative PCR.
Fold increase.
Figure 1.
Agarose 1% gels depicting product from amplification of 50 ng of DNA by DOP (A) and random prime (B) approaches. Lanes 1 and 6 are size markers. DNA products in lanes 2 and 7 are from genomic female, lane 3 is from a fresh-frozen tumor, lanes 4 and 8 are from a paraffin tumor, and lanes 5 and 9 are from genomic male DNA.
DNA Amplification for Array CGH
Determining the best amplification protocol and the minimum amount of input DNA necessary to yield adequate array CGH quality required both objective and subjective measures. Quality was defined by 1) the SD of the log2 ratios of all BACs contained in entire chromosomal arms that were completely gained, lost, or had no change in the samples tested; 2) consistent interpretation of small (<10 mb) regions showing amplification or homozygous deletion; and 3) interpretation of the overall signal to noise ratio for the hybridization; this was evaluated by comparing the overall variability of BAC ratios to the deviation from zero for clear chromosomal alterations.
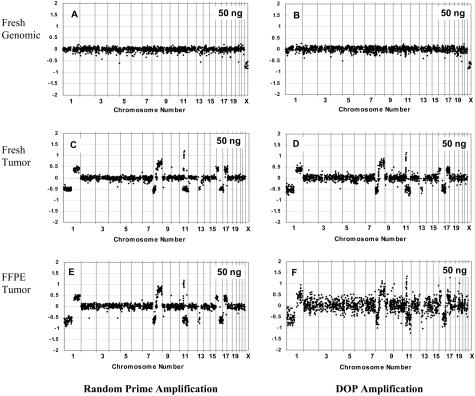
Array CGH after random-primed versus degenerate oligonucleotide-primed amplification was compared using normal lymphocyte control DNA, fresh-frozen tumor DNA, and formalin-fixed paraffin-embedded tumor DNA from the same case (Figure 2). The random prime amplification yielded almost identical results as the DOP PCR approach for the fresh normal sample (Figure 2, A and B). The SD for the log2 ratios of all of the BACS across the genome (excluding chromosome X) was 0.075 for the RPA versus 0.089 for the DOP-amplified DNA, similar to that observed for unamplified control DNA (not shown). The fresh tumor sample also showed comparable results with the two approaches, with all changes apparent in both analyses, and with equivalent noise in the array CGH plot (Figure 2, C and D). The SD for the average log2 ratios of chromosome 2, which showed no aberration, was 0.057 for RPA and 0.082 for DOP amplification. In contrast, random prime amplification of the FFPE sample yielded a much better result than did DOP amplification (Figure 2, E and F). A much lower SD for chromosome 2 was seen for the RPA versus the DOP amplification (SD 0.086 versus 0.204). Deletions and amplifications were clearly identified for the random prime amplified sample, whereas the DOP analysis showed more scatter and more difficult interpretation of the chromosome alterations. This same trend was observed when less than 50 ng was used as input DNA, and the RPA products were less noisy than the DOP products (data not shown). Based on these results, random prime amplification was then used for further experiments designed to determine the lowest input DNA yielding quality data.
Figure 2.
Array CGH using random prime (A, C, E) versus DOP (B, D, F) amplification with 50 ng of input DNA. Normal genomic male versus female DNA is shown in A and B, whereas DNA from a fresh-frozen breast tumor versus female reference is shown in C and D, and results from the same tumor that was formalin-fixed and paraffin-embedded is shown in E and F. Log2 ratios for each BAC are plotted according to chromosome position.
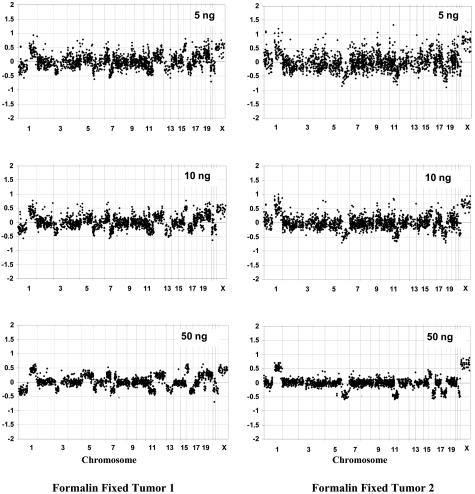
Input amounts of 5 ng, 10 ng, and 50 ng were compared to determine the optimum input threshold (Figure 3). The quality of the array CGH analyses were generally excellent for RPA-amplified fresh tumor samples, ranging from 5 to 50 ng input DNA (data not shown). However, for the FFPE samples, the SD for regions 1q (gained), 16q (lost), and 2q (no change) all decreased with increasing amounts of DNA (Table 2). The amount of scatter in the log2 ratio plots also decreased as the paraffin DNA input increased. Interpretation of deletions and amplifications was more straightforward when using 50 ng of input DNA. It should be noted that the quality of the array CGH varied widely with different tumor samples, and that some yielded high-quality results with 5 ng input whereas others were uninterpretable even with 50 ng input (data not shown). It is our experience, based on more than 200 samples analyzed, that adequate quality is possible from archival DNA in ∼90% of samples using RPA with 50 ng input DNA.
Figure 3.
Array CGH plots using 5 ng, 10 ng, and 50 ng of DNA from two different paraffin-embedded breast tumors versus normal male reference as input DNA. DNA was random prime amplified, labeled, and hybridized as described in Materials and Methods. Log2 ratios for each BAC are plotted according to chromosome position. Note the decreasing scatter with increased starting DNA. However, even lower DNA inputs still show changes within chromosome 1, 6, 11, 16, 18, and 22.
Table 2.
Quality of Array CGH after Random Prime Amplification
| FFPE tumor 1, SD*
|
FFPE tumor 2, SD
|
Fresh control DNA, SD
|
||||||
|---|---|---|---|---|---|---|---|---|
| 5 ng | 10 ng | 50 ng | 5 ng | 10 ng | 50 ng | 5 ng | 50 ng | |
| 1q† | 0.182 | 0.156 | 0.102 | 0.255 | 0.197 | 0.103 | 0.089 | 0.086 |
| 2q | 0.159 | 0.157 | 0.089 | 0.214 | 0.167 | 0.077 | 0.071 | 0.076 |
| 16q | 0.119 | 0.098 | 0.067 | 0.223 | 0.161 | 0.141 | 0.066 | 0.056 |
Standard deviation of log2 ratios for all triplicate averages of all BACs included in the specified regions.
Both tumors showed gain of chromosome arm 1q, loss of 16q, and no change on 2q.
Comparison of Array CGH for FFPE versus Fresh-Frozen DNA
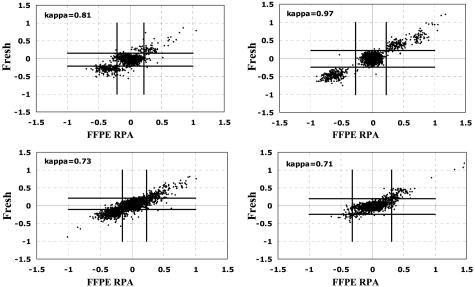
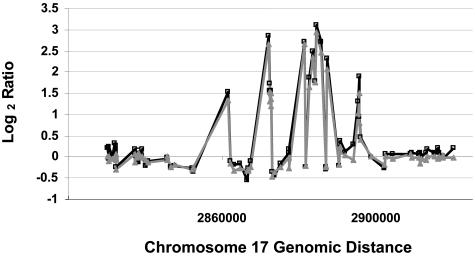
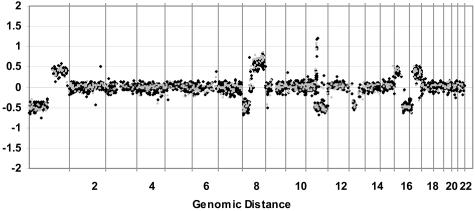
Array CGH was compared using DNA isolated from fresh frozen tumors versus formalin-fixed paraffin blocks in four different breast tumors (Figure 4). The genomic profiles for the fresh and FFPE samples were similar in quality, and were highly correlated. The κ statistic was used as a measure of concordance between sample analyses. Samples are considered to be in near-perfect agreement when their κ value is greater than 0.80. The average κ correlation value for these four tumors was 0.805. Examples of the equivalence between fresh and paraffin/amplified DNA are shown for a complex amplicon on chromosome 17 (Figure 5) and for the whole genome (Figure 6).
Figure 4.
Comparison of array CGH using DNA from fresh-frozen versus formalin-fixed paraffin-embedded (FFPE) breast tumors. κ correlations are calculated for each case. Five hundred ng of DNA (unamplified) was used for the fresh-frozen tumor and 50 ng of DNA input for random prime amplification was used for the FFPE sample.
Figure 5.
Comparison of chromosome 17 array CGH using DNA from a fresh-frozen versus FFPE breast tumor. The log2 ratios for the fresh tumor (gray) and FFPE tumor (black) show very close agreement. DNA is labeled as in Figure 4.
Figure 6.
Comparison of total genomic array CGH using DNA from a fresh-frozen versus FFPE breast tumor. Fresh tumor (black squares) and FFPE tumor (gray squares) show close agreement. DNA labeled as in Figure 4. Log2 ratio for each BAC is plotted according to chromosome position. Note the similar levels of high-level amplification on 11q for both samples.
Discussion
We have shown that consistent high-quality array-based CGH analyses can be accomplished from 50 ng of DNA extracted from formalin-fixed paraffin-embedded tissue samples after manual microdissection. This protocol requires careful quantitation of DNA by quantitative PCR to assure adequate input for the random-primed amplification reaction. The protocol is sufficiently robust that DNA that has been proteinase K treated and concentrated, without further extraction or purification, can be used routinely.
Array-based CGH appears to have different requirements for DNA quality and quantity than chromosome-based CGH, especially after DNA amplification. DOP amplification was adequate for array CGH using DNA extracted from fresh-frozen samples, but yielded poor results using DNA from formalin-fixed paraffin-embedded samples. This was surprising because as little as 1 ng of input FFPE DNA for DOP PCR amplification results in adequate chromosomal CGH. It is likely that the lower spatial resolution of chromosomal CGH reduces the sequence-dependent variability because of DOP amplification, while that variability may be exaggerated using cloned BAC DNAs as target. Interestingly, the ratio bias sometimes seen at 1p, 19, and 22 with chromosomal CGH after DOP amplification was not seen after DOP amplification using array-based CGH. Although DOP amplification yielded more product than did RPA, this increase did not translate into better quality array-based CGH.
Other amplification protocols besides DOP have been used successfully by others for chromosomal CGH, although not specifically applied to array CGH, from very small amounts of starting material.6,7,8,16,17,18,19 Stoecklein and colleagues6 used a procedure termed “SCOMP” for whole genome amplification of chromosomal CGH. These results using DNA from normal lymphocytes and from lymph nodes fixed in formalin were promising. However, DNA from an FFPE tumor showed classic chromosomal CGH artifacts at 1p, 19, and 22, making those chromosomes and perhaps other regions uninterpretable. Lucito and colleagues7,19 successfully applied ligation-mediated PCR to chromosomal CGH, although not from fixed samples. Other approaches for optimization of DOP protocols have also been suggested,16,17,18,19 although none have been validated for array CGH with limited amounts of DNA from FFPE samples.
Paris and colleagues4 and Van Dekken and colleagues20 described successful array-based CGH from FFPE prostate tumor DNA, but required 1 μg of input DNA. Linn and colleagues21 also successfully applied 2 to 4 μg of FFPE DNA to cDNA arrays and reported similar results to fresh DNA. Extraction of this quantity of DNA from paraffin sections is frequently not feasible, especially when microdissection is needed for preinvasive malignant lesions. Some investigators have recently reported results from as little as 100 ng of FFPE DNA,22,23 and Daigo and colleagues5 used DOP PCR amplification of very limited amounts of tumor DNA, but these results were from smaller arrays, including a commercial array consisting of 57 oncogenes. The limited number of targets used in these studies makes interpretation of the hybridization quality difficult; it appears that their amplification made interpretation of deletions difficult, and oncogene amplification levels may not have been linear. It was also unclear whether a larger genome wide array would require more input DNA.
Random-primed amplification of 50 ng FFPE DNA in our hands generally yielded array CGH analyses that were as high quality as DNA from the original fresh or frozen tumors. This is in contrast to array CGH analyses using 100 ng to 1 μg quantities of FFPE DNA without amplification. It is likely that the unamplified DNA samples contain impurities that lead to noisier hybridization reactions, whereas the random prime amplification produces freshly synthesized DNA without residual crosslinking or protein impurities. Careful quantitation of the FFPE DNA by real-time quantitative PCR was required for these experiments because of variability resulting from using too little DNA. Other approaches for quantitation were adequate for DNA from fresh or frozen samples, but were highly variable (and usually inaccurate) with DNA from paraffin.
Hybridization bias was not seen for array CGH after random-primed amplification of FFPE DNA. Such bias, seen as false ratio changes involving chromosomes 1p, 19, 22, and so forth, is sometimes seen for chromosome-based CGH with FFPE DNA and DOP amplification. Although the source of that bias is not well understood, it may be because of differential hybridization of test versus reference samples to GC-rich regions of the genome, and this may be exaggerated after biased amplification of these regions. Array-based CGH may be less sensitive to these artifacts of hybridization because the BAC targets are limited in size, and are selected for consistent hybridization results.
In this study we have shown that we can produce high-quality validated array CGH analyses from limited quantities of DNA isolated from FFPE tumor samples. Real-time quantitative PCR allowed reproducible application of our robust protocol, allowing analysis of small amounts of starting DNA. This approach has been used routinely to analyze archival tumors at high throughput to provide accurate high-resolution genomic information with the potential for direct clinical application.
Footnotes
Supported by the National Cancer Institute (grants CA92374, CA58207, CA89715, CA92374) and Biostar (grant 10215).
References
- Pinkel D, Segraves R, Sudar D, Clark S, Poole I, Kowbel D, Collins C, Kuo W-L, Chen C, Zhai Y, Dairkee SH, Ljung B-M, Gray JW, Albertson DG. High resolution analysis of DNA copy number variation using comparative genomic hybridization to microarrays. Nat Genet. 1998;20:207–211. doi: 10.1038/2524. [DOI] [PubMed] [Google Scholar]
- Snijders AM, Nowak N, Segraves R, Blackwood S, Brown N, Conroy J, Hamilton G, Hindle AK, Huey B, Kimura K, Law S, Myambo K, Palmer J, Ylstra B, Yue JP, Gray JW, Jain AN, Pinkel D, Albertson DG. Assembly of microarrays for genome-wide measurement of DNA copy number. Nat Genet. 2001;29:263–264. doi: 10.1038/ng754. [DOI] [PubMed] [Google Scholar]
- Veltman JA, Fridlyand J, Pejavar S, Olshen AB, Korkola JE, DeVries S, Carroll P, Kuo WL, Pinkel D, Albertson D, Cordon-Cardo C, Jain AN, Waldman FM. Array-based comparative genomic hybridization for genome-wide screening of DNA copy number in bladder tumors. Cancer Res. 2003;63:2872–2880. [PubMed] [Google Scholar]
- Paris PL, Albertson DG, Alers JC, Andaya A, Carroll P, Fridlyand J, Jain AN, Kamkar S, Kowbel D, Krijtenburg PJ, Pinkel D, Schroder FH, Vissers KJ, Watson VJ, Wildhagen MF, Collins C, Van Dekken H. High-resolution analysis of paraffin-embedded and formalin-fixed prostate tumors using comparative genomic hybridization to genomic microarrays. Am J Pathol. 2003;162:763–777. doi: 10.1016/S0002-9440(10)63873-4. [DOI] [PMC free article] [PubMed] [Google Scholar]
- Daigo Y, Chin SF, Gorringe KL, Bobrow LG, Ponder BA, Pharoah PD, Caldas C. Degenerate oligonucleotide primed-polymerase chain reaction-based array comparative genomic hybridization for extensive amplicon profiling of breast cancers: a new approach for the molecular analysis of paraffin-embedded cancer tissue. Am J Pathol. 2001;58:1623–1631. doi: 10.1016/S0002-9440(10)64118-1. [DOI] [PMC free article] [PubMed] [Google Scholar]
- Stoecklein NH, Erbersdobler A, Schmidt-Kittler O, Diebold J, Schardt JA, Izbicki JR, Klein CA. SCOMP is superior to degenerated oligonucleotide primed-polymerase chain reaction for global amplification of minute amounts of DNA from microdissected archival tissue samples. Am J Pathol. 2002;161:43–51. doi: 10.1016/S0002-9440(10)64155-7. [DOI] [PMC free article] [PubMed] [Google Scholar]
- Lucito R, West J, Reiner A, Alexander J, Esposito D, Mishra B, Powers S, Norton L, Wigler M. Detecting gene copy number fluctuations in tumor cells by microarray analysis of genomic representations. Genome Res. 2000;11:1726–1736. doi: 10.1101/gr.138300. [DOI] [PMC free article] [PubMed] [Google Scholar]
- Liu D, Liu C, DeVries S, Waldman F, Cote RJ, Datar RH. lM-PCR permits highly representative whole genome amplification of DNA isolated from small number of cells and paraffin-embedded tumor tissue sections. Diagn Mol Pathol. 2004;13:105–115. doi: 10.1097/00019606-200406000-00007. [DOI] [PubMed] [Google Scholar]
- Gong G, DeVries S, Chew KL, Cha I, Ljung B-M, Waldman FM. Genetic changes in paired atypical and usual ductal hyperplasia of the breast by comparative genomic hybridization. Clin Cancer Res. 2001;7:2410–2414. [PubMed] [Google Scholar]
- Waldman FM, DeVries S, Chew KL, Moore DH, Kerlikowske K, Ljung BM. Chromosomal alterations in ductal carcinomas in situ and their in situ recurrences. JNCI. 2000;92:313–320. doi: 10.1093/jnci/92.4.313. [DOI] [PubMed] [Google Scholar]
- Willenbucher RF, Zelman SJ, Ferrell LD, Moore DH, Waldman FM. Chromosomal alterations in ulcerative colitis-related neoplastic progression. Gastroenterology. 1997;113:791–801. doi: 10.1016/s0016-5085(97)70173-2. [DOI] [PubMed] [Google Scholar]
- Ginzinger DG, Godfrey TE, Nigro J, Moore DH, II, Suzuki S, Pallavicini MG, Gray JW, Jensen RH. Measurement of DNA copy number at microsatellite loci using quantitative PCR analysis. Cancer Res. 2000;60:5405–5409. [PubMed] [Google Scholar]
- Wilhelm M, Veltman JA, Olshen AB, Jain AN, Moore DH, Presti JC, Kovacs G, Waldman FM. Array-based comparative genomic hybridization for the differential diagnosis of renal cell cancer. Cancer Res. 2002;62:957–960. [PubMed] [Google Scholar]
- Jain AN, Tokuyasu TA, Snijders AM, Segraves R, Albertson DG, Pinkel D. Fully automatic quantification of microarray image data. Genome Res. 2002;12:325–332. doi: 10.1101/gr.210902. [DOI] [PMC free article] [PubMed] [Google Scholar]
- Seigel DG, Podgor MJ, Remaley NA. Acceptable values of kappa for comparison of two groups. Am J Epidemiol. 1992;135:571–578. doi: 10.1093/oxfordjournals.aje.a116324. [DOI] [PubMed] [Google Scholar]
- Kuukasjarvi T, Tanner M, Pennanen S, Karhu R, Visakorpi T, Isola J. Optimizing DOP-PCR for universal amplification of small DNA samples in comparative genomic hybridization. Genes Chromosom Cancer. 1997;18:94–101. [PubMed] [Google Scholar]
- Beheshti B, Vukovic B, Marrano P, Squire JA, Park PC. Resolution of genotypic heterogeneity in prostate tumors using polymerase chain reaction and comparative genomic hybridization on microdissected carcinoma and prostatic intraepithelial neoplasia foci. Cancer Genet Cytogenet. 2002;137:15–22. doi: 10.1016/s0165-4608(02)00540-x. [DOI] [PubMed] [Google Scholar]
- Larsen J, Ottesen AM, Lundsteen C, Leffers H, Larsen JK. Optimization of DOP-PCR amplification of DNA for high-resolution comparative genomic hybridization analysis. Cytometry. 2001;44:317–325. doi: 10.1002/1097-0320(20010801)44:4<317::aid-cyto1123>3.0.co;2-5. [DOI] [PubMed] [Google Scholar]
- Lucito R, Nakimura M, West JA, Han Y, Chin K, Jensen K, McCombie R, Gray JW, Wigler M. Genetic analysis using genomic representations. Proc Natl Acad Sci USA. 1998;95:4487–4492. doi: 10.1073/pnas.95.8.4487. [DOI] [PMC free article] [PubMed] [Google Scholar]
- Van Dekken H, Paris PL, Albertson DG, Alers JC, Andaya A, Kowbel D, Van Der Kwast TH, Pinkel D, Schroder FH, Vissers KJ, Wildhagen MF, Collins C. Evaluation of genetic patterns in different tumor areas of intermediate-grade prostatic adenocarcinomas by high-resolution genomic array analysis. Genes Chromosom Cancer. 2004;39:249–256. doi: 10.1002/gcc.20001. [DOI] [PubMed] [Google Scholar]
- Linn SC, West RB, Pollack JR, Zhu S, Hernandez-Boussard T, Nielsen TO, Rubin BP, Patel R, Goldblum JR, Siegmund D, Botstein D, Brown PO, Gilks CB, van de Rijn M. Gene expression patterns and gene copy number changes in dermatofibrosarcoma protuberans. Am J Pathol. 2003;163:2383–2395. doi: 10.1016/S0002-9440(10)63593-6. [DOI] [PMC free article] [PubMed] [Google Scholar]
- Garnis C, Coe BP, Zhang L, Rosin MP, Lam WL. Overexpression of LRP12, a gene contained within an 8q22 amplicon identified by high-resolution array CGH analysis of oral squamous cell carcinomas. Oncogene. 2003;12:1–5. doi: 10.1038/sj.onc.1207367. [DOI] [PubMed] [Google Scholar]
- Peng DF, Sugihara H, Mukaisho K, Tsubosa Y, Hattori T. Alterations of chromosomal copy number during progression of diffuse-type gastric carcinomas: metaphase- and array-based comparative genomic hybridization analyses of multiple samples from individual tumours. J Pathol. 2003;201:439–450. doi: 10.1002/path.1459. [DOI] [PubMed] [Google Scholar]


