Abstract
High-resolution melting techniques are a simple and cost-effective alternative to other closed-tube genotyping methods. Here, we genotyped human platelet antigens (HPAs) 1 to 6 and 15 by high-resolution melting methods that did not require labeled probes. Conventional melting analysis with hybridization probes (HybProbes) was also performed at each locus. HybProbe assays were performed individually, whereas amplicon melting (HPAs 1 to 5 and 16) and unlabeled probe (HPA 6) assays were duplexed when possible. At all loci for each method, both homozygous and heterozygous genotypes were easily identified. We analyzed 100 blinded clinical samples (33 amniotic fluid, 12 cultured amniocytes, and 55 blood samples) for all 7 single-nucleotide polymorphisms (SNPs) by each method. Genotype assignments could be made in 99.0% of the SNPs by high-resolution melting and in 98.7% of the SNPs with HybProbes with an overall genotype concordance of 98.8%. Errors included two sample misidentifications and six incorrect assignments that were all resolved by repeating the analysis. Advantages of high-resolution melting include rapid assay development and execution, no need for modified oligonucleotides, and similar accuracy in genotyping compared with other closed-tube melting methods.
Human platelet antigens (HPAs) can cause illness when platelets expressing an antigen are introduced into an individual who does not have that antigen but has circulating antibodies directed against the antigen.1,2,3 Sixteen HPA systems have been identified.4 HPA loci are designated by an integer (1 to 16) followed by either an “a” to represent the more common allele or a “b” for the less common allele. The different alleles arise from an amino acid change brought about by a single-nucleotide polymorphism (SNP).5 The most well-known disease examples are neonatal alloimmune thrombocytopenic purpura and posttransfusion purpura. The neonatal disorder is caused by transplacentally acquired maternal platelet alloantibodies to fetal platelets that carry paternal HPA antigens. It has a frequency of approximately 1 in 1200 and is caused primarily by HPAs 1 and 5 in Caucasians and HPAs 3 and 4 in Asians.6,7,8 In posttransfusion purpura, an individual negative for antigen is transfused with platelets from another individual who is positive for an HPA antigen. Antibodies to HPA 1a are the most common cause,9 and transfusions with platelets negative for HPA 1a are therapeutic in most cases.10,11
HPAs 1, 3, 4, and 6 are found on integrin αIIbβ3; HPA 2 is found on the GPIb-IX-V complex; HPA 5 is found on integrin α2β1; and HPA 15 is found on CD109.5 Phenotyping of HPA 1 on platelets by flow cytometry has been reported.12,13 Several molecular methods are also available for HPA genotyping.14 Closed-tube fluorescent assays include a hybridization probe melting (HybProbe) assay15 and 5′-nuclease genotyping with a minor groove binder and a nonfluorescent quencher.16 Although convenient, these closed-tube methods require relatively expensive labeled probes.
Recently developed high-resolution melting methods for genotyping do not require covalently labeled probes. The simplest method, small amplicon melting,17 requires only two polymerase chain reaction (PCR) primers. This method was used to genotype six of the seven HPA SNPs. Because of a neighboring benign polymorphism at the HPA 6 loci, an unlabeled oligonucleotide probe assay was developed to distinguish HPA 6 genotypes.18 These methods were compared with genotyping with conventional adjacent hybridization probes.19
Materials and Methods
DNA Samples
All samples were de-identified according to a global ARUP protocol under Institutional Review Board (protocol no. 7275). The samples used in this study included blood specimens, amniotic fluid, and cultured amniocytes submitted to either ARUP (Salt Lake City, UT) or the DNA Diagnostic Laboratory (University of Utah) for routine clinical genotyping. Thirteen samples of DNA extracted from cultured amniocytes (a training set) were used to develop the assays. These samples had a final concentration of 25 ng/μl and had been previously genotyped for HPAs 1 and 5 and 15 by allele-specific PCR analysis.20,21 To validate the assays, 100 DNA samples of unknown HPA genotype were obtained for a blinded study: 33 were samples of amniotic fluid, 12 were samples of cultured amniocytes, and 55 were samples from blood. DNA was extracted from these specimens with the MagNa Pure instrument (Roche, Indianapolis, IN) according to the manufacturer’s instructions. These samples had a final concentration ranging from 10 to 50 ng/μl.
Primers
Primers for the HybProbe assays were obtained from GTI Inc. (Waukesha, WI). All other oligonucleotides were obtained from Integrated DNA Technologies (Coralville, IA) or Qiagen Operon (Alameda, CA).
Artificial Template Synthesis
Certain genotypes for some of the HPA systems are so rare, it was highly improbable that the genotype would be encountered in the samples studied. Therefore, artificial templates were synthesized for HPA 4 b/b and HPA 6. This was done according to the method described by Barik.22 Artificial templates were sequenced after synthesis.
Sequencing
HPA amplicon sequencing was performed in the Sequencing Laboratory at ARUP by standard dideoxy termination. The amplified nucleic acid was sequenced bi-directionally using dye-terminator chemistry on an ABI PRISM 377 DNA Sequencer (Applied Biosystems, Foster City, CA).
PCR of HPAs 1 to 6 and 15 by Adjacent Hybridization Probes (HybProbes)
PCR of HPAs 1 to 6 and 15 was performed in a LightCycler (Roche) with reagents commonly used in clinical laboratories. Generally, 10-μl reaction mixtures contained 2 to 4 mmol/L MgCl2, 1× LightCycler FastStart DNA Master Hybridization Probes master mix, forward primer, reverse primer, 0.2 μmol/L fluorescein-labeled probe, and 0.2 μmol/L LC640-labeled probe, 0.01 U/μl Escherichia coli uracil N-glycosylase (UNG; Roche), and 10 to 50 ng of genomic DNA. Table 1 lists primer and probe sequences as well as primer concentrations. The PCR was initiated with a 5-minute hold at room temperature for contamination control by UNG and a 10-minute hold at 95°C for activation of the polymerase. Thermal cycling was performed with a 10-second hold at 95°C, a 10-second hold at 55°C, and a 10-second hold at 72°C for 40 cycles. The transition rate between all steps was 20°C/second.
Table 1.
List of Primers, Probes, and Concentrations Used in HybProbe Assays
| Locus | Primer locations and probe sequences* | Primer (μmol/L) |
|---|---|---|
| HPA 1 | tttatgctccaatgtacggggtaaactcttagctattgggaagtggtagggcctgcaggaggtagagagtcgccatagctctgatt-gctggacttctctttgggctcctgtcttacaggccctgcctctgggctcacctcgctgtgacctgaaggagaatctgctgaaggat-aactgtgccccagaatc (189) | 0.2/0.2 |
| LC RED 640-cctgcctccgggctcac-P | ||
| ggacttctctttgggctcctgtcttacagg-FITC | ||
| HPA 2 | ggctgacctcgctgcctcttggtgccctgcgtggtcttggcgaactccaagagctctacctgaaaggcaatgagctgaagaccc-tgcccccagggctcctgacgcccacacccaagctggagaagctcagtctggctaacaacaacttgactgagctccccgctgg-gctcctgaatgggctggagaatctcgacacccttctcctcc (207) | 0.2/0.2 |
| tcctgacgcccacacccaa-FITC | ||
| LC RED 640-ggagaagctcagtctggctaacaacaacttgactga-P | ||
| HPA 3 | ctgggcctgaccactcctttgcccccccaggtggactgggggctgcccatccccagcccctcccccattcacccggcccatca-caagcgggatcgcagacagatcttcctgccagagcccgagcagccctcgaggcttcaggatccagttctcgtagtga (160) | 0.2/0.2 |
| tgcccatccccagcccc-FITC | ||
| LC RED 640-cccccattcacccggcccatcac-P | ||
| HPA 4 | aagaatttctccatccaagtgcggcaggtggaggattaccctgtggacatctactacttgatggacctgtcttactccatgaaggatg-atctgtggagcatccagaacctgggtaccaagctggccacccagatgcgaaagctcaccagtaacctgcggattggcttcggg-gcatttgtggacaagcctgtgtcaccatacatgtatatctccccacc (218) | 0.15/0.5 |
| cccagatgcgaaagctcacca-FITC | ||
| LC RED 640-taacctgcggattggcttcgggg-P | ||
| HPA 5 | atgagtgacctaaagaaagaggaaggaagagtctacctgtttactatcaaagaggtaaaaaaaaaaaaataaactaatagtttaatt-tgctttagtactggtaatttaacttgcatttggaaagaaaaatttattattattgaatgataatttgcacagatagtatggtttacatttc (178) | 0.05/1.0 |
| ctacctgtttactatcaaagaggtaa-FITC | ||
| LC RED 640-aaaaaaaataaactaatagtttaatttgctttagtactgg-P | ||
| HPA 6 | tgggatcccagtgtgagtgctcagaggaggactatcgcccttcccagcaggacgaatgcagcccccgggagggtcagcccgt-ctgcagccagcggggcgagtgcctctgtggtcaatgtgtctgccacagcagtgactttggcaagatcacgggcaagtactgcga-gtgtgacgacttct (180) | 0.15/0.5 |
| cagcccccgcgagggtcag-FITC | ||
| LC RED 640-gtctgcagccagcggggcgagtgcct-P | ||
| HPA 15 | attttggcttatttcaaaatgtatcagttcttggttttgtgatgtttatatttattatcttgacttcagttacaggatttaccaagaatttgaagtaac-tgtacctgattctatcacttcttgggtggctactggttttgtgatctctgaggacctgggtcttggactaacaactactccagt (183) | 0.2/0.2 |
| acttcagttccaggatttaccaa-FITC | ||
| LC RED 640-aatttgaagtaactgtacctgattctatcacttctt-P |
Primer locations are indicated by underlined sequences. Italicized sequences indicate that these particular primers had TCCT engineered onto the 5′ end of oligonucleotide covering these nucleotides. Number in parentheses indicates the length of the amplicon in base pairs. Listed after the amplicon sequences are the detection probe and then the anchor probe. Nucleotides in bold in the detection probe indicate the locations of the SNPs.
After amplification, samples were held at 95°C for 1 minute, followed by 60°C for 1 minute, 50°C for 1 minute, and 35°C for 1 minute with programmed 20°C/second transitions. This was followed by melting curve acquisition at a ramp rate of 0.1°C/second to 95°C with continuous fluorescence acquisition.
PCR of HPAs 1 to 5 and 15 for High-Resolution Amplicon Melting Analysis
PCR for high-resolution amplicon melting analysis (HPAs 1 to 5 and 15) was also performed on a LightCycler. Exact concentrations of primers in the master mixes for each of the reactions varied slightly (Table 2), even though the cycling parameters for all targets were the same. In addition, to increase throughput, pairs of targets were multiplexed together. Constant components of the 10-μl reactions were 5 mmol/L MgCl2, 1× LightCycler FastStart DNA Master Hybridization Probes master mix, 1× LCGreen PLUS, 0.01 U/μl UNG, and 10 to 50 ng of genomic DNA. PCR was initiated with a 10-minute hold at 37°C for contamination control by UNG and a 10-minute hold at 95°C for activation of the polymerase. Rapid thermal cycling was performed between 94 and 60°C. The transition rate from 60 to 90°C was 2°C/second and from 90 to 60°C was 20°C/second. On completion of thermal cycling, samples were analyzed by melting in the LightCycler to provide fast verification of amplification. Samples were rapidly heated to 95°C, then cooled at 20°C/second to 55°C, and held for 20 seconds. This was followed by melting curve acquisition at a rate of 0.05°C/second up to 95°C with continuous fluorescence acquisition. To induce heteroduplex formation, samples were then rapidly cooled to 40°C and were either stored at 4°C before high-resolution melting analysis or analyzed immediately.
Table 2.
List of Primers and Concentrations Used in High-Resolution Melting Assays
| Locus | Primer locations | Primer (μmol/L) |
|---|---|---|
| HPA 1* | ctcctgtcttacaggccctgcctctgggctcacctcgctgtg (42)† | 0.2/0.2 |
| HPA 5 | gaaggaagagtctacctgtttactatcaaagaggtaaaaaaaaaaaaataaactaatagtttaatttgc (69) | 0.5/0.5 |
| HPA 2 | tcctgcccccagggctcctgacgcccacacccaagctggagaagctcagga (51) | 0.15/0.15 |
| HPA 15 | tatatttattatcttgacttcagttacaggatttaccaagaatttgaag (49) | 0.25/0.25 |
| HPA 3 | Gcctgaccactcctttgcccccccaggtggactgggggctgcccatccccagcccctcccccattcacccggcccatcaca-agcgggatcgcagacagatcttcc(105) | 0.5/0.25 |
| HPA 4 | taccaagctggccacccagatgcgaaagctcaccagtaacctgcggattg(50) | 0.25/0.25 |
| HPA 6 | tgggatcccagtgtgagtgctcagaggaggactatcgcccttcccagcaggacgaatgcagcccccgggagggtcagccc-gtctgcagccagcggggcgagtgcctctgtggtcaatgtgtctgccacagcagtgactttggcaagatcacgggcaagtactg-cgagtgtgacgacttct (180) | 0.49/0.06 |
| ctgcagacgggctgaccctcacgggggctgc-P‡ | 0.5 |
The duplex reactions were as follows: HPAs 1 and 5; HPAs 2 and 15; HPAs 3 and 4.
Locations of primers are indicated by underlined sequence. Bold nucleotides are SNPs. Numbers in parentheses indicate the length of the amplicon in base pairs. Italicized sequences indicate that these particular primers had TCCT engineered onto the 5’ end of oligonucleotide covering these nucleotides.
Unlabeled probe is 3′ phosphorylated to prevent extension during PCR.
PCR of HPA 6 for High-Resolution Unlabeled Probe Melting Analysis
Genotyping of HPA 6 was performed by high-resolution melting analysis of an unlabeled oligonucleotide probe.18 Amplification was performed in a LightCycler with 10-μl reactions consisting of 3 mmol/L MgCl2, 1× LightCycler FastStart DNA Master Hybridization Probes master mix, 1× LCGreen PLUS, 0.01 U/μl UNG, 0.49 μmol/L forward primer, 0.06 μmol/L reverse primer, 0.5 μmol/L 3′-phosphorylated unlabeled oligonucleotide probe (Table 2), and 10 to 50 ng of genomic DNA. Rapid thermal cycling was performed with a 1-second hold at 95°C, a 1-second hold at 68°C, and a 10-second hold at 72°C for 56 cycles. All transition rates were 20°C/second. On completion of thermal cycling, these samples were treated the same way as described for HPAs 1 to 5 and 15.
High-Resolution Melting Curve Acquisition and Analysis
The HR-1 (Idaho Technology) is an instrument that measures high-resolution DNA melting curves from samples in a single LightCycler capillary. This is achieved by monitoring the fluorescence change of the fluorescent DNA intercalating dye, LCGreen Plus, as the sample is melted. Turnaround time per sample is approximately 1 to 2 minutes, depending on how broad the temperature range is required to be.
LightCycler capillaries were transferred to the HR-1 instrument and heated at 0.3°C/second. HPA 1/HPA 5 and HPA 2/HPA 15 were analyzed between 63 and 90°C, and HPA 3/HPA 4 were analyzed between 70 and 95°C with a turnaround time of approximately 2 minutes/sample. HPA 6 was analyzed between 65°C and 95°C. High-resolution melting data were analyzed with the HR-1 software. All curves were plotted using Microsoft Excel after export of the data.
Genotyping
Genotyping for the HybProbe assay was based on the melting temperature (Tm) calculated from the derivative melting temperature plots of the LightCycler data. An a/a homozygous sample has a single peak of a certain Tm, a b/b homozygous sample has a single peak of a different Tm, and an a/b heterozygous sample has both peaks.
Genotyping by amplicon melting was based on normalized melting curves17,23 compared against control samples. For amplicon melting of HPAs 1 to 5 and 15, homozygous samples were identified by a single transition, with a/a and b/b melting curves separated by about 0.3 to 1°C. Heterozygous samples showed broad and/or additional transitions at low temperatures. In addition, fluorescence difference plots were also analyzed, highlighting differences between homozygous and heterozygous samples. HPA 6 data were analyzed by examining the derivative melting curves of the HR-1 data and correlating alleles with Tm, similar to HybProbe analysis. Homozygous samples were detected by the presence of a single derivative melting peak, and heterozygous samples were detected by the presence of two derivative melting peaks.
Results
HybProbe Assays
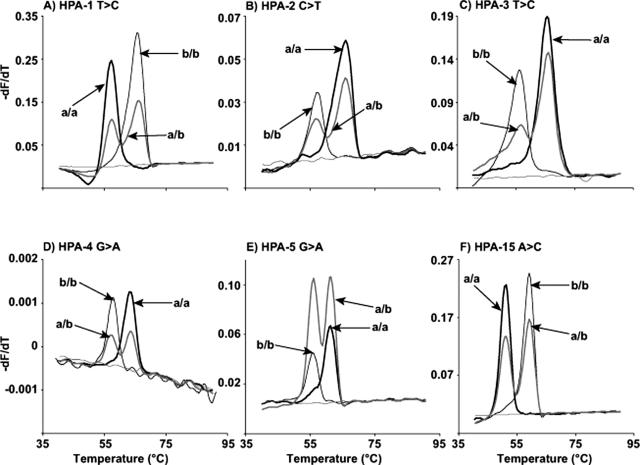
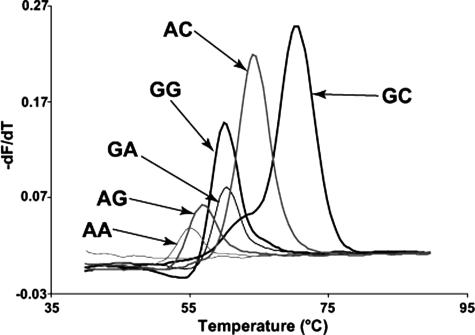
Example data of HybProbe analysis of HPAs 1 to 5 and 15 are shown in Figure 1. Homozygous samples have clearly defined single peaks, and heterozygous samples contain both peaks. HPA 6 was more complicated to genotype because of a 1545G>A polymorphism adjacent to the 1544G>A SNP.24 Therefore, instead of two possible homozygous genotypes, there are six (Figure 2). At 1544, the possible nucleotides are G and A; whereas at 1545, the possible nucleotides are G, A, and rarely, C. In the rest of this study, when we refer to these genotypes at these two nucleotides, we will use two letters, eg, 1544A and 1545A is simply AA. The genotype order from lowest to highest probe Tm was: AA, AG, GG = GA, AC, and GC.
Figure 1.
Melting curves of HPAs 1 to 5 and 15 from HybProbe assays performed on the LightCycler. Each HPA locus (1 to 5 and 15) is displayed on separate graphs (A–F). The genotype of each curve is indicated with arrows. The thin gray line without an arrow on each graph represents the no template control for each reaction.
Figure 2.
HPA 6 melting curves from the HybProbe assay performed on the LightCycler. There are six melting curves shown, each representing a homozygous genotype at HPA 6 (nucleotide 1544) and the adjacent 3′ nucleotide (nucleotide 1545). The genotype of each curve is labeled with an arrow. The thin gray line without an arrow on each graph represents the no template control for each reaction. The first letter is the nucleotide at position 1544; the second letter is the nucleotide at position 1545.
High-Resolution Melting Assays
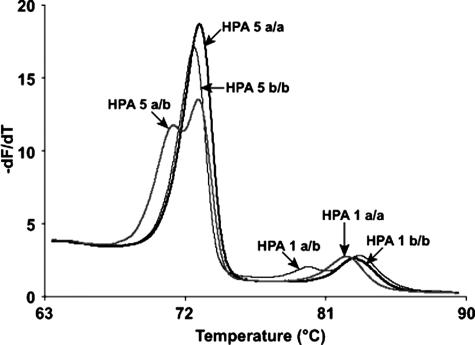
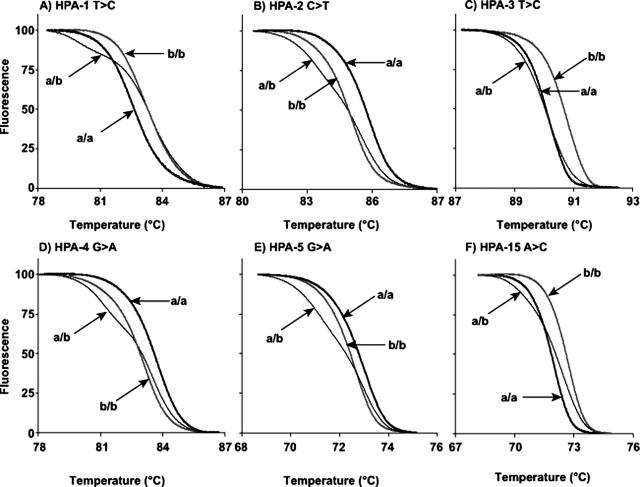
As predicted by nearest neighbor stability calculations,25,26,27,28,29,30,31 the melting temperature differences between homozygotes at the same SNP locus varied from 0.4 to 1.3°C. HPAs 1 and 5, HPAs 2 and 15, and HPAs 3 and 4 were run as duplex assays. For each duplex assay, the two amplicons were well separated as judged by derivative melting curves of the high-resolution data (Figure 3). The degree of separation was 3 to 6°C. Even though the efficiency of amplification (and hence the height of the derivative melting curves) often differed between amplicons, this did not interfere with genotyping. When looking at the normalized data for each amplicon, all genotypes were well separated with high-resolution analysis (Figure 4). Homozygous a/a and b/b samples were separated by 0.3 to 1°C. Heterozygous samples could be distinguished by the presence of heteroduplexes indicated by an inflection at a lower temperature in the normalized data compared with the homoduplexes. The melting curves of the three genotypes at all of the HPA loci tested were well discriminated, although HPA 3 heterozygotes had curves very close to HPA 3 a/a. However, these curves were still easily distinguishable when fluorescence difference plots were used (data not shown).
Figure 3.
Derivative curves of high-resolution melting data from an HPA 1 and 5 duplex assay. Three samples are shown, which represent the six possible genotypes. Each genotype is labeled with an arrow. Sample 1 (thin black line) is HPA 5 b/b and HPA 1 a/b, sample 2 (thick gray line) is HPA 5 a/b and HPA 1 a/a, and sample 3 (thick black line) is HPA 5 a/a and HPA 1 b/b.
Figure 4.
Normalized curves of high-resolution melting data from HPAs 1 to 5 and 15. Each HPA locus (1 to 5 and 15) is represented by one graph (A–F). Three samples are shown on each graph, which represent the three possible genotypes: a/a (thick black line), a/b (thin gray line), and b/b (thick gray line). Each genotype is labeled with an arrow.
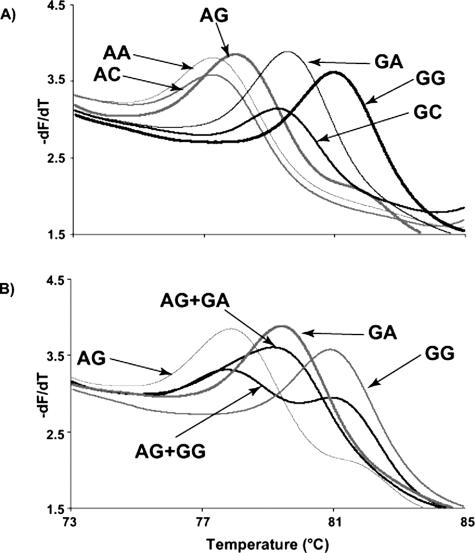
Genotyping of HPA 6 with unlabeled probes used derivative melting curves of the HR-1 data without normalization (Figure 5).18 Similar to the HybProbe assay, the six potentially different homozygotes were resolved using unlabeled probe melting analysis (Figure 5A). HPA 6 b/b genotypes had lower Tms compared with HPA 6 a/a genotypes. The order of homozygote Tms (low to high) were: AG, AC = AA, GA = GC, and GG. All heterozygous genotypes are also resolved with this assay, and examples of two of the most difficult are shown in Figure 5B.
Figure 5.
Derivative curves of high-resolution melting data using an unlabeled oligonucleotide probe to genotype HPA 6. The first graph represents the homozygous genotypes (A). There are six melting curves shown, each representing HPA 6 (nucleotide 1544) and the adjacent 3′ nucleotide (nucleotide 1545). The genotype of each curve is labeled with an arrow. The first letter is the nucleotide at position 1544; the second letter is the nucleotide at position 1545. The second graph shows two heterozygous genotypes generated by mixing the appropriate homozygous samples together (B). These heterozygotes are the most likely combinations based on the nucleotide frequencies.
Validation Studies
One sample of DNA from amniotic fluid (out of 100 total samples) did not amplify in any assay. Two of the remaining samples (one amniotic fluid and one blood) did not amplify in the HybProbe assay for HPA 5. There was 100% concordance between the HybProbe assay and the high-resolution melting assays for HPA 2, 3, 4, and 6. For HPA 1 and HPA 5 there was 99% (98 of 99 and 96 of 97, respectively) concordance, and for HPA 15 there was 93% (92 of 99) concordance. After repeating the discrepant samples by high-resolution melting, the discrepant samples were found to be 100% concordant with the results of the HybProbe assay. The distribution of genotypes is listed in Table 3.
Table 3.
Genotype Distributions across HPAs 1 to 6 and 15 Found in This Study
| HPA | Genotype | No. of samples |
|---|---|---|
| HPA 1 | a/a | 73 |
| a/b | 22 | |
| b/b | 4 | |
| HPA 2 | a/a | 78 |
| a/b | 17 | |
| b/b | 4 | |
| HPA 3 | a/a | 45 |
| a/b | 41 | |
| b/b | 13 | |
| HPA 4 | a/a | 99 |
| a/b | 0 | |
| b/b | 0 | |
| HPA 5 | a/a | 83 |
| a/b | 12 | |
| b/b | 2 | |
| HPA 6 | a/a | 99 |
| a/b | 0 | |
| b/b | 0 | |
| HPA 15 | a/a | 22 |
| a/b | 44 | |
| b/b | 33 |
The discrepancies were explained as follows. The discrepant sample for HPA 1 was due to sample misidentification. The discrepant sample for HPA 5 was a weak a/b sample that was identified as a/a. The subsequent repeat was genotyped as a/b. One of the discrepant samples for HPA 15 was the same sample that was misidentified for HPA 1. The remaining six samples that were discrepant for HPA 15 (five amniotic fluid and one blood) occurred because of insufficient amplification and primer dimer interference in the duplex assay. When the samples were repeated as singleplex assays, results were 100% concordant with the HybProbe assay.
Discussion
Two robust, closed-tube genotyping methods based on melting analysis for HPAs 1 to 6 and 15 were evaluated in this report. They can be applied to DNA from whole blood, amniotic fluid, and cultured amniocytes. The HybProbe method has previously been reported on some of the HPA loci.15 High-resolution melting curve analysis of small amplicons and unlabeled probes are new techniques that have only been applied to a few SNPs.17,18 Compared with other methods for genotyping HPA, closed-tube assays limit the possibility of contamination because there is no postamplification manipulation and the results are read directly from the tube.
The design of high-resolution melting assays is very simple compared with HybProbe assays. To assay the seven HPA loci in this study, 15 oligonucleotides were required for high-resolution melting compared with 28 oligonucleotides with HybProbes. Furthermore, one-half of the oligonucleotides in the HybProbe assay were labeled with fluorescent dyes, whereas only unlabeled oligonucleotides were required for the high-resolution melting assays. However, high-resolution melting methods required a special dye (LCGreen PLUS) and instrument (HR-1). Although commercially available, these products are not as widely known or available as real-time PCR instruments.
The accuracy of high-resolution melting was the same as the HybProbe method for HPAs 2, 3, 4, and 6. Although some discrepant genotypes initially occurred for HPAs 1, 5, and 15, repeated analysis resolved these discrepancies, which were caused by sample misidentification and difficulty duplexing one of the assays. All analytical errors correlated with insufficient amplification, particularly with DNA extracted from amniotic fluid. DNA was not quantified routinely, and robust amplification could be ensured by using a known quantity of high-quality DNA. If it was not possible to ensure the quantity and quality of DNA, genotyping SNPs as single reactions was more robust than multiplexing.
Melting curves were analyzed largely by custom software with normalized, temperature-shifted curves. In addition, HPA 3 was analyzed as fluorescence difference plots to help with the genotyping. Fluorescence difference plots have been described previously by Graham et al.32 In short, fluorescence difference plots display the difference in fluorescence between the melting curve of a standard versus an unknown sample, highlighting small differences in melting curve shape and Tm. In the case of HPA 3, melting curves of a/a samples were very close in shape and position to a/b samples, and fluorescence difference plots helped to further separate the two different genotypes.
High-resolution melting data are affected by the salt concentration,23 and care is required to use the same batch of reagents during DNA purification of samples and controls. Alternatively, controls can be purified at the same time as unknown samples. Another option is to multiplex the assays, providing an integrated internal control. If the salt concentration changes between samples, then identical shifts should occur in both amplicons. To the best of our knowledge, this is the first time that solution genotyping by amplicon melting has been multiplexed.
The unlabeled probe assay was designed to unambiguously genotype HPA 6, regardless of the immediately adjacent polymorphism at 1545.33,34 The polymorphism at position 1545 has allele frequencies of 63% (G), 37% (A), and <1% (C).24 Of 99 samples, we identified 43 as 1545G, 8 as 1545A, and 48 as G/A heterozygous (data not shown). The unlabeled probe used for the HPA 6 genotyping assay does not differentiate 1545A from 1545C, so it is not possible to determine whether any samples included the rare 1545C polymorphism.
Diagnosis is paramount in treating alloimmune illnesses related to the HPA system. Simple melting assays provide a rapid method for determining HPA genotype. They are accurate, closed-tube methods that can be performed as the need arises. HPA genotyping provides a good example of molecular based assays that can provide an immediate clinical diagnosis for tailored treatment.
Footnotes
Supported by the ARUP Institute of Clinical and Experimental Pathology.
References
- Santoso S. Human platelet alloantigens. Transfus Apher Sci. 2003;28:227–236. doi: 10.1016/S1473-0502(03)00040-5. [DOI] [PubMed] [Google Scholar]
- Norton A, Allen DL, Murphy MF. Review: platelet alloantigens and antibodies and their clinical significance. Immunohematol. 2004;20:89–102. [PubMed] [Google Scholar]
- Mohanty D, Kulkarni B, Ghosh K, Nair S, Khare A. Human platelet specific antigens and their importance. Indian Pediatr. 2004;41:797–805. [PubMed] [Google Scholar]
- Metcalfe P, Watkins NA, Ouwehand WH, Kaplan C, Newman P, Kekomaki R, De Haas M, Aster R, Shibata Y, Smith J, Kiefel V, Santoso S. Nomenclature of human platelet antigens. Vox Sang. 2003;85:240–245. doi: 10.1046/j.1423-0410.2003.00331.x. [DOI] [PubMed] [Google Scholar]
- Bussel JB, Kunicki TJ, Michelson AD. Platelets: new understanding of platelet glycoproteins and their role in disease. Hematology (Am Soc Hematol Educ Program) 2000:222–240. doi: 10.1182/asheducation-2000.1.222. [DOI] [PubMed] [Google Scholar]
- Blanchette VS, Johnson J, Rand M. The management of alloimmune neonatal thrombocytopenia. Baillieres Best Pract Res Clin Haematol. 2000;13:365–390. doi: 10.1053/beha.2000.0083. [DOI] [PubMed] [Google Scholar]
- Ohto H. [Neonatal alloimmune thrombocytopenia]. Nippon Rinsho. 1997;55:2310–2314. [PubMed] [Google Scholar]
- Mueller-Eckhardt C, Kiefel V, Grubert A, Kroll H, Weisheit M, Schmidt S, Mueller-Eckhardt G, Santoso S. 348 cases of suspected neonatal alloimmune thrombocytopenia. Lancet. 1989;1:363–366. doi: 10.1016/s0140-6736(89)91733-9. [DOI] [PubMed] [Google Scholar]
- Kroll H, Kiefel V, Mueller-Eckhardt C. [Clinical and serologic studies in 34 patients with post-transfusion purpura]. Beitr Infusionsther. 1992;30:403–407. [PubMed] [Google Scholar]
- Loren AW, Abrams CS. Efficacy of HPA-1a (PlA1)-negative platelets in a patient with post-transfusion purpura. Am J Hematol. 2004;76:258–262. doi: 10.1002/ajh.20093. [DOI] [PubMed] [Google Scholar]
- Win N, Peterkin MA, Watson WH. The therapeutic value of HPA-1a-negative platelet transfusion in post-transfusion purpura complicated by life-threatening haemorrhage. Vox Sang. 1995;69:138–139. doi: 10.1111/j.1423-0410.1995.tb01685.x. [DOI] [PubMed] [Google Scholar]
- Sorel N, Brabant S, Christiaens L, Brizard A, Mauco G, Macchi L. A rapid and specific whole blood HPA-1 phenotyping by flow cytometry using two commercialized monoclonal antibodies directed against GP IIIa and GP IIb-IIIa complexes. Br J Haematol. 2004;124:221–223. doi: 10.1046/j.1365-2141.2003.04757.x. [DOI] [PubMed] [Google Scholar]
- Killie MK, Kjeldsen-Kragh J, Randen I, Skogen B, Husebekk A. Evaluation of a new flow cytometric HPA 1a screening method: a rapid and reliable tool for HPA 1a screening of blood donors and pregnant women. Transfus Apher Sci. 2004;30:89–92. doi: 10.1016/j.transci.2003.10.004. [DOI] [PubMed] [Google Scholar]
- Hurd CM, Cavanagh G, Schuh A, Ouwehand WH, Metcalfe P. Genotyping for platelet-specific antigens: techniques for the detection of single nucleotide polymorphisms. Vox Sang. 2002;83:1–12. doi: 10.1046/j.1423-0410.2002.00187.x. [DOI] [PubMed] [Google Scholar]
- Randen I, Sorensen K, Killie MK, Kjeldsen-Kragh J. Rapid and reliable genotyping of human platelet antigen (HPA)-1, -2, -3, -4, and -5 a/b and Gov a/b by melting curve analysis. Transfusion. 2003;43:445–450. doi: 10.1046/j.1537-2995.2003.00354.x. [DOI] [PubMed] [Google Scholar]
- Higgins M, Hughes A, Buzzacott N, Lown J. High-throughput genotyping of human platelet antigens using the 5′-nuclease assay and minor groove binder probe technology. Vox Sang. 2004;87:114–117. doi: 10.1111/j.1423-0410.2004.00539.x. [DOI] [PubMed] [Google Scholar]
- Liew M, Pryor R, Palais R, Meadows C, Erali M, Lyon E, Wittwer C. Genotyping of single-nucleotide polymorphisms by high-resolution melting of small amplicons. Clin Chem. 2004;50:1156–1164. doi: 10.1373/clinchem.2004.032136. [DOI] [PubMed] [Google Scholar]
- Zhou L, Myers AN, Vandersteen JG, Wang L, Wittwer CT. Closed-tube genotyping with unlabeled oligonucleotide probes and a saturating DNA dye. Clin Chem. 2004;50:1328–1335. doi: 10.1373/clinchem.2004.034322. [DOI] [PubMed] [Google Scholar]
- Bernard PS, Ajioka RS, Kushner JP, Wittwer CT. Homogeneous multiplex genotyping of hemochromatosis mutations with fluorescent hybridization probes. Am J Pathol. 1998;153:1055–1061. doi: 10.1016/s0002-9440(10)65650-7. [DOI] [PMC free article] [PubMed] [Google Scholar]
- Dormoy A, Hanau D, Tongio MM, Cazenave JP. Development and validation of a genotyping kit for the eight principal human platelet alloantigen systems. Transfus Clin Biol. 2000;7:51–62. doi: 10.1016/s1246-7820(00)88712-1. [DOI] [PubMed] [Google Scholar]
- Metcalfe P, Waters AH. HPA-1 typing by PCR amplification with sequence-specific primers (PCR-SSP): a rapid and simple technique. Br J Haematol. 1993;85:227–229. doi: 10.1111/j.1365-2141.1993.tb08680.x. [DOI] [PubMed] [Google Scholar]
- Barik S. Mutagenesis by megaprimer. Horton RM, Tait RC, editors. Wymondham, UK: Horizon Scientific Press,; Genetic Engineering with PCR. 1998:25–37. [Google Scholar]
- Gundry CN, Vandersteen JG, Reed GH, Pryor RJ, Chen J, Wittwer CT. Amplicon melting analysis with labeled primers: a closed-tube method for differentiating homozygotes and heterozygotes. Clin Chem. 2003;49:396–406. doi: 10.1373/49.3.396. [DOI] [PubMed] [Google Scholar]
- Wang R, McFarland JG, Kekomaki R, Newman PJ. Amino acid 489 is encoded by a mutational “hot spot” on the beta 3 integrin chain: the CA/TU human platelet alloantigen system. Blood. 1993;82:3386–3391. [PubMed] [Google Scholar]
- SantaLucia J, Jr, Allawi HT, Seneviratne PA. Improved nearest-neighbor parameters for predicting DNA duplex stability. Biochemistry. 1996;35:3555–3562. doi: 10.1021/bi951907q. [DOI] [PubMed] [Google Scholar]
- Allawi HT, SantaLucia J., Jr Thermodynamics and NMR of internal G.T mismatches in DNA. Biochemistry. 1997;36:10581–10594. doi: 10.1021/bi962590c. [DOI] [PubMed] [Google Scholar]
- Allawi HT, SantaLucia J., Jr Nearest neighbor thermodynamic parameters for internal G.A mismatches in DNA. Biochemistry. 1998;37:2170–2179. doi: 10.1021/bi9724873. [DOI] [PubMed] [Google Scholar]
- Allawi HT, SantaLucia J., Jr Thermodynamics of internal C.T mismatches in DNA. Nucleic Acids Res. 1998;26:2694–2701. doi: 10.1093/nar/26.11.2694. [DOI] [PMC free article] [PubMed] [Google Scholar]
- Allawi HT, SantaLucia J., Jr Nearest-neighbor thermodynamics of internal A.C mismatches in DNA: sequence dependence and pH effects. Biochemistry. 1998;37:9435–9444. doi: 10.1021/bi9803729. [DOI] [PubMed] [Google Scholar]
- Peyret N, Seneviratne PA, Allawi HT, SantaLucia J., Jr Nearest-neighbor thermodynamics and NMR of DNA sequences with internal AA, C.C, G.G, and T.T mismatches. Biochemistry. 1999;38:3468–3477. doi: 10.1021/bi9825091. [DOI] [PubMed] [Google Scholar]
- SantaLucia J., Jr A unified view of polymer, dumbbell, and oligonucleotide DNA nearest-neighbor thermodynamics. Proc Natl Acad Sci USA. 1998;95:1460–1465. doi: 10.1073/pnas.95.4.1460. [DOI] [PMC free article] [PubMed] [Google Scholar]
- Graham R, Liew M, Meadows C, Lyon E, Wittwer CT. Distinguishing different DNA heterozygotes by high-resolution melting. Clin Chem. 2005;51:1295–1298. doi: 10.1373/clinchem.2005.051516. [DOI] [PubMed] [Google Scholar]
- Haga H, Yamada R, Ohnishi Y, Nakamura Y, Tanaka T. Gene-based SNP discovery as part of the Japanese Millennium Genome Project: identification of 190,562 genetic variations in the human genome: single-nucleotide polymorphism. J Hum Genet. 2002;47:605–610. doi: 10.1007/s100380200092. [DOI] [PubMed] [Google Scholar]
- Cargill M, Altshuler D, Ireland J, Sklar P, Ardlie K, Patil N, Shaw N, Lane CR, Lim EP, Kalyanaraman N, Nemesh J, Ziaugra L, Friedland L, Rolfe A, Warrington J, Lipshutz R, Daley GQ, Lander ES. Characterization of single-nucleotide polymorphisms in coding regions of human genes. Nat Genet. 1999;22:231–238. doi: 10.1038/10290. [DOI] [PubMed] [Google Scholar]


