Abstract
The goal of this study was to identify a set of fluorescence in situ hybridization probes for the detection of dysplasia and adenocarcinoma in patients with Barrett’s esophagus. We examined 170 brushing specimens from 138 patients with Barrett’s esophagus or a history of Barrett’s esophagus using fluorescence in situ hybridization with probes to 5p15, 5q21-22, centromere 7, 7p12, 8q24.12-13, centromere 9, 9p21, centromere 17, 17p13.1, 17q11.2-12, 20q13.2, and centromere Y. Receiver-operator curves were used to determine the sensitivity and specificity of various four-probe combinations for detecting low-grade dysplasia, high-grade dysplasia, and esophageal adenocarcinoma. Endoscopic biopsy results were used as the gold standard. Numerous four-probe combinations provided a similarly high sensitivity and specificity. Of these, a set consisting of probes to 8q24, 9p21, 17q11.2, and 20q13.2 was found to have a sensitivity and specificity, respectively, of 70% and 89% for low-grade dysplasia, 84% and 93% for high-grade dysplasia, and 94% and 93% for esophageal adenocarcinoma. This probe set was chosen for future prospective clinical evaluations based on its high sensitivity and specificity, its ability to distinguish adenocarcinoma and high-grade or low-grade dysplasia from lesser diagnostic categories, and the favorable signal quality for each of the probes.
The majority of esophageal adenocarcinomas is thought to arise in patients with Barrett’s esophagus. Barrett’s esophagus is a preneoplastic condition caused by metaplasia of the normal squamous mucosa of the distal esophagus into specialized intestinal mucosa containing goblet cells.1 Individuals with Barrett’s esophagus have a 30- to 60-fold elevated risk of developing adenocarcinoma and develop adenocarcinoma at a rate of ∼0.5 to 1.0% per year of follow-up.2,3,4,5
The American College of Gastroenterology has recommended that Barrett’s esophagus patients be monitored for the development of dysplasia and adenocarcinoma by undergoing regular endoscopic examinations of the esophagus and obtaining four-quadrant biopsies for every 1 to 2 cm of affected esophagus.6,7 However, there are problems associated with the use of biopsies for monitoring Barrett’s esophagus patients for the development of neoplasia including: 1) limited sampling of the affected mucosa leading to false-negative biopsy results,8 2) lengthy procedure time required to take four-quadrant biopsies every 1 to 2 cm,7 3) poor interobserver reproducibility of pathologists for the diagnosis of dysplasia,9 and 4) relatively poor ability of histological findings to predict which patients are likely to progress to adenocarcinoma.10 Assays that improve the ability to accurately detect dysplasia and esophageal adenocarcinoma as well as predict which patients will progress to adenocarcinoma could markedly improve the clinical management of these patients. Conventional cytology is not routinely performed on endoscopic brushings obtained from patients with Barrett’s esophagus in most institutions, and there are relatively few studies that have addressed the sensitivity and specificity of cytology for the detection of dysplasia and adenocarcinoma in patients with Barrett’s esophagus. However, a study by Falk and colleagues11 demonstrated that balloon cytology had a sensitivity of 80% for the detection of high-grade dysplasia and adenocarcinoma, a sensitivity of 25% for low-grade dysplasia, and a specificity of 95%.
Fluorescence in situ hybridization (FISH) is a technique that utilizes fluorescently labeled DNA probes to detect chromosomal abnormalities. FISH is increasingly used by cytologists to identify neoplastic cells in various cytological specimens and has been shown to be more sensitive than conventional cytology for the detection of bladder cancer in urine specimens and biliary tract malignancy in endoscopic brushing specimens of the biliary tract.12,13,14,15 FISH performed on esophageal brushing specimens may offer a more practical and accurate surveillance tool for patients with Barrett’s esophagus because endoscopic brushing specimens can be obtained more rapidly than four-quadrant biopsies and can sample a larger percentage of the affected area.13,16
Studies that used FISH to detect bladder cancer in urine specimens used a probe set that was tailored specifically for the detection of bladder cancer.17 Different malignancies, although sharing certain genetic alterations (eg, 17p13.1 deletions and P53 mutations are common in most solid tumor types), have a profile of genetic alterations that are characteristic of that particular malignancy.18 Numerous studies have identified common genetic alterations associated with low-grade dysplasia, high-grade dysplasia, and adenocarcinoma in patients with Barrett’s esophagus. Genes or genetic loci that have been found to be frequently altered include 3p21, 5p15, 5q21-22, EGFR (7p12), 7q36.1, C-MYC (8q24.12-13), P16 (9p12), P53 (17p13.1), HER-2/NEU (17q11.2-12), 20q13.2, and the Y chromosome.19,20,21,22,23,24,25,26,27,28,29,30
The primary goal of this study was to develop a multitarget, multicolor FISH assay that could detect dysplasia and esophageal adenocarcinoma, as well as differentiate low-grade dysplasia from high-grade dysplasia/adenocarcinoma. To accomplish this, we performed FISH with 12 fluorescently labeled probes targeting chromosomal loci shown to be frequently altered in patients with Barrett’s associated neoplasia on endoscopically obtained brushing specimens from Barrett’s esophagus patients with biopsy-proven dysplasia or adenocarcinoma. Data collected from this study were then used to identify a four-probe combination with the potential to provide high sensitivity and specificity for the detection of dysplasia and esophageal adenocarcinoma.
Materials and Methods
Patients
Institutional review board approval was obtained for this study, and informed consent was acquired from all enrolled patients. One hundred seventy specimens were collected from 122 male and 16 female patients seen at the Mayo Clinic, Rochester, MN, from September 2002 through December 2003 who either had a previous history of Barrett’s esophagus or had Barrett’s esophagus at the time of enrollment. Patient age ranged from 31 to 87 years.
FISH Probes
Probes were labeled with Spectrum Red, Spectrum Green, Spectrum Aqua, or Spectrum Gold fluorophores and placed into one of three four-probe sets (Table 1). Chromosome enumeration probes hybridize to the peri-centromeric regions of a chromosome and allow one to determine the number of copies of a given chromosome in a cell. Locus-specific indicator probes are generally used to asses for deletions, gains, or amplification of specific genes.
Table 1.
Fluorescence in Situ Hybridization Probe Sets
| Probe set | Fluorophore
|
|||
|---|---|---|---|---|
| Spectrum Red | Spectrum Green | Spectrum Aqua | Spectrum Gold | |
| I | LSI 9p21 (P16) | LSI 5p15 | CEP 9 | LSI 5q21–22 (APC) |
| II | CEP Y | LSI 17q11.2–12 (HER-2/NEU) | CEP 17 | LSI 17p13.1 (P53) |
| III | LSI 20q13.2 | LSI 8q24.12–13 (C-MYC) | CEP 7 | LSI 7p12 (EGFR) |
Centromere enumeration (CEP) and locus-specific indicator (LSI)probes along with the corresponding fluorophore.
Specimen Collection and Histological Classification
During endoscopy, a cytology brush (Hobbs Medical Inc., Stafford Springs, CT) was swept over the entire observed area of Barrett’s esophagus. The brush was then placed into a vial containing 20 ml of PreservCyt solution (Cytyc Corp., Marlborough, MA). Four-quadrant biopsies were obtained every 1 cm of affected esophagus; some patients also had endoscopic mucosal resection. Patients with multiple biopsies or biopsies with endoscopic mucosal resection were categorized according to the most advanced histological lesion observed. The histological diagnoses for the 170 specimens in the study were normal squamous epithelium (n = 34), intestinal metaplasia (n = 28), low-grade dysplasia (n = 24), high-grade dysplasia (n = 67), and esophageal adenocarcinoma (n = 17).
Endoscopic Brushing Processing
Endoscopic brushing specimens were processed by washing the brush with 40 ml of 3:1 methanol:glacial acetic acid fixative solution. Cells were sedimented at 800 × g for 8 minutes. The supernatant was removed and the cell pellet was resuspended in 10 ml of 3:1 methanol:glacial acetic acid fixative solution. The cells were then sedimented again at 300 × g for 8 minutes. All but ∼100 μl of the supernatant was removed. The cell pellet was then resuspended and slides were prepared.
Slide Preparation
Approximately 3 μl of the cell pellet suspension was pipetted onto three etched 1-cm rings (Gold Seal, Portsmouth, NH), one ring for each of the three probe sets. Cellularity was assessed with a phase contrast microscope. Additional cell suspension was added to the slide until adequate cellularity was reached (ie, the highest number of cells possible per ring with minimal cell overlap) or until the cell pellet was exhausted.
FISH
FISH pretreatment and hybridization were performed as previously described14 with the following modifications: 1) the pepsin concentration was 0.05 mg/ml rather than 0.5 mg/ml, and 2) instead of separately denaturing the probe and target DNA before hybridization, the probe and target DNA were co-denatured in a Vysis HYBrite denaturation/hybridization system at 73°C for 3 minutes and then incubated overnight at 37°C.
Enumeration of FISH Signals
FISH signal enumeration was performed without knowledge of the patient’s clinical or histological diagnosis. The specimen was analyzed under a fluorescence microscope using single bandpass filters (Abbott Molecular, Des Plaines, IL) specific for DAPI (4,6-diamidino-2-phenylindole), Spectrum Aqua, Spectrum Green, Spectrum Gold, and Spectrum Red fluorescence. The number of FISH signals for each probe was recorded in a minimum of 50 consecutive noninflammatory, nonsquamous cells. Squamous cells were enumerated only for the occasional case in which no other cell types were present. One hundred cells were enumerated per hybridization when possible. One hundred cells could be enumerated for all three probe sets for 147 of the 170 specimens in this study.
Analysis of Enumeration Data
Each cell analyzed was categorized as either normal (ie, having the anticipated complement of FISH signals) or abnormal (ie, having a gain or loss of the anticipated number of FISH signals). The normal complement of FISH signals for the 11 autosomal loci is two signals. Gain of a locus (greater than two FISH signals) or loss of a locus (less than two FISH signals) was considered abnormal. For centromere Y, one copy of the centromeric sequence was normal, while two or more signals indicated gain and zero signals indicated loss. Enumeration data for female patients were excluded for calculations involving the Y chromosome.
The sensitivity and specificity of individual probes and different probe combinations for the detection of low-grade dysplasia, high-grade dysplasia, and/or adenocarcinoma at varying cutoffs for gain or loss were determined and plotted using receiver-operator characteristics (ROC) curves. For probe combinations, cutoffs were varied independently for each probe to identify sets of cutoffs that provided a good balance of sensitivity and specificity. Because this generates multiple sensitivity values for each specificity value, only the highest sensitivity value at each specificity value was plotted.
Results
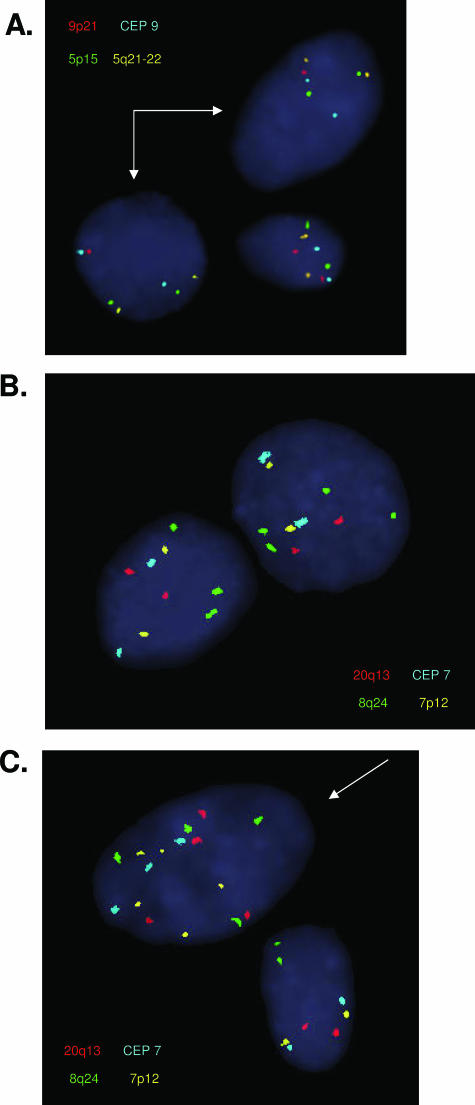
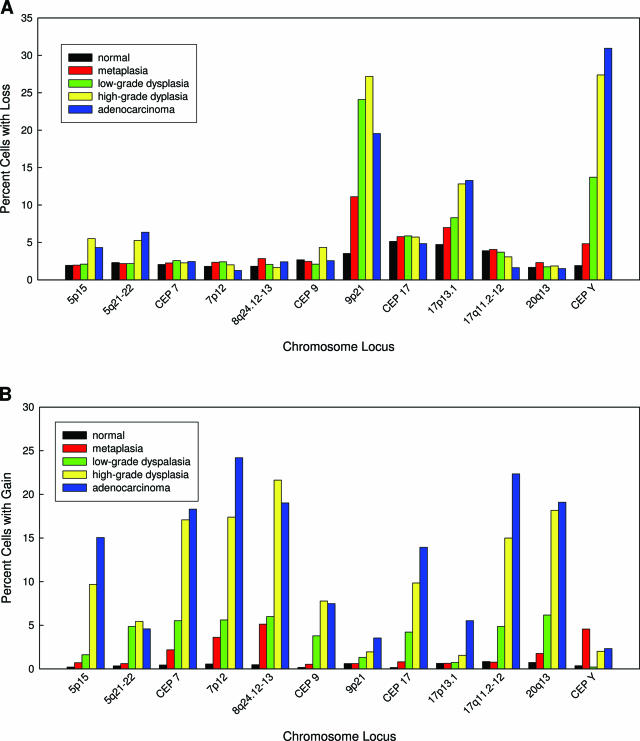
A variety of chromosomal alterations were detected by FISH in the cells obtained by endoscopic brushing (Figure 1). These alterations were broadly categorized either as loss or gain. Figure 2 shows the average percentage of cells with loss (Figure 2A) and gain (Figure 2B) for all loci according to histological category. There was a large increase in the percentage of cells showing loss of 9p21, 17p13.1, and the Y chromosome with progression from benign squamous epithelium to high-grade dysplasia (Figure 2A). However, there was little additional increase observed in the percentage of cells showing loss of 17p13.1 and the Y chromosome and a decrease in the percentage of cells showing loss of 9p21 with progression from high-grade dysplasia to adenocarcinoma. The other loci examined did not show high percentages of cells with loss in any of the histological categories.
Figure 1.
Representative examples of genetic alterations detected by FISH on cells obtained by esophageal brushing during endoscopy. A: Hybridization of probe set I, arrows showing hemizygous 9p21 deletion (single red signal per cell). B: Hybridization of probe set III, showing isolated gain of 8q24.12-13 (greater than two green signals). C: Hybridization of probe set III, arrow showing gains of multiple probes. See Table 1 for a description of each probe set.
Figure 2.
Average percentage of cells in the brushing specimens with loss (A) or gain (B) for each locus within the different histological categories.
Figure 2B demonstrates that there was a large increase in the percentage of cells showing gain of 5p15, CEP 7, 7p21, 8q24.12-13, CEP 17, 17q11.2, and 20q13.2 with progression from benign squamous epithelium to high-grade dysplasia. Additional increases in the percentage of cells showing gains of 5p15, 7p12, CEP 17, and 17q11.2-12 were observed with progression from high-grade dysplasia to adenocarcinoma. Four of the probes, 5q21-22, 9p21, 17p13.1, and centromere Y, did not show high percentages of gain within any of the histological categories.
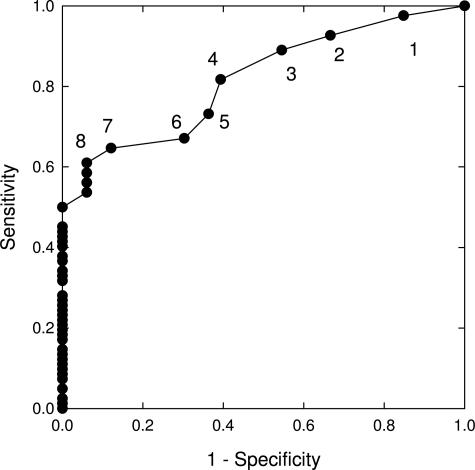
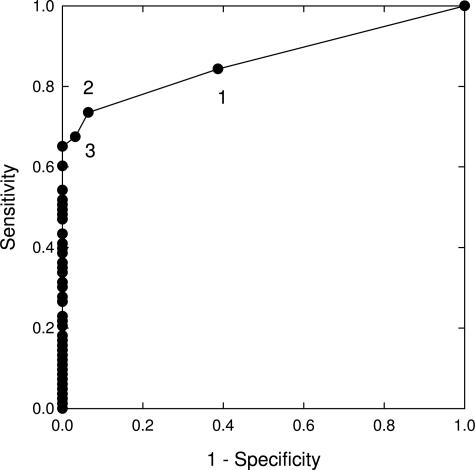
ROC curves were generated for each probe, for both gain and loss, to determine the sensitivity and specificity of different cutoff values for the detection of low-grade dysplasia, high-grade dysplasia, and adenocarcinoma. The ROC curve of 9p21 loss for the detection of low-grade dysplasia is shown in Figure 3. This curve reveals that a cutoff of 8% or more cells with 9p21 loss is associated with a sensitivity of 60% and a specificity of 95% for the detection of low-grade dysplasia. A representative ROC curve for locus gain, 8q24.12-13 gain for the detection of high-grade dysplasia/adenocarcinoma, is shown in Figure 4. This curve reveals that a cutoff of 4% or more cells with 8q24.12-13 gain is associated with a sensitivity of 65% and a specificity of 100% for the detection of high-grade dysplasia/adenocarcinoma.
Figure 3.
ROC curve of 9p21 loss for the detection of low-grade dysplasia relative to normal squamous epithelium. The filled circles along the curve represent the sensitivity and specificity for low-grade dysplasia that would be obtained in this cohort of patients using different cutoffs. The numbers shown at each point along the curve refer to the percentage of cells that would have to exhibit 9p21 loss for a specimen to be considered positive for low-grade dysplasia.
Figure 4.
ROC curve of gain of 8q24.12-13 for the detection of high-grade dysplasia and esophageal adenocarcinoma relative to normal squamous epithelium. The numbers shown at each filled circle along the curve refer to the percentage of cells that would have to exhibit 8q24.12-13 gain for a specimen to be considered positive for high-grade dysplasia or esophageal adenocarcinoma.
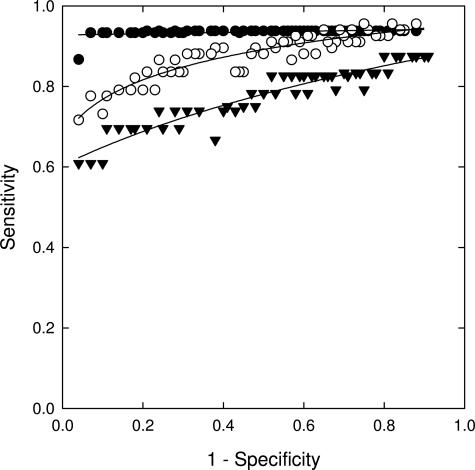
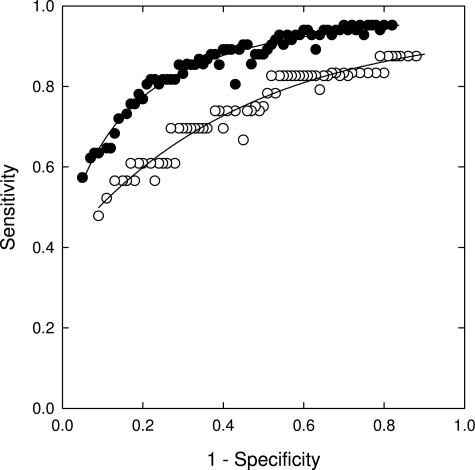
ROC curves were also generated for numerous different four-probe combinations to determine the sensitivity and specificity for low-grade dysplasia, high-grade dysplasia, and adenocarcinoma detection. One of the best performing four-probe combinations consisted of probes to 9p21, 8q24.12-13, 17q11.2-12, and 20q13.2. The ROC curves of this probe set for the detection of low-grade dysplasia, high-grade dysplasia, and adenocarcinoma relative only to patients with normal squamous mucosa are shown in Figure 5. In addition, ROC curves of this probe set for the detection of high-grade dysplasia/adenocarcinoma relative to all lower diagnoses (ie, low-grade dysplasia, intestinal metaplasia, and normal squamous mucosa) and of low-grade dysplasia relative to all lower diagnoses are shown in Figure 6.
Figure 5.
ROC curves of a 9p21, 8q24.12-13, 17q11.2, and 20q13.2 probe combination for the detection of low-grade dysplasia (inverted filled triangles), high-grade dysplasia (open circles), and esophageal adenocarcinoma (filled circles) relative to normal squamous epithelium. The ROC curve of this probe set for low-grade dysplasia used 9p21 loss and gain of the other loci as the criterion for abnormality. The ROC curve of this probe set for high-grade dysplasia and esophageal adenocarcinoma used chromosomal gains for all loci as the criterion for abnormality.
Figure 6.
ROC curves of a 9p21, 8q24.12-13, 17q11.2, and 20q13.2 probe combination for the detection of combined high-grade dysplasia and esophageal adenocarcinoma relative to the lower diagnoses of low-grade dysplasia, intestinal metaplasia, and normal squamous epithelium (filled circles), and detection of low-grade dysplasia relative to the combined diagnoses of intestinal metaplasia and normal squamous epithelium (open circles).
Discussion
In this study, we demonstrate the ability of FISH to detect chromosomal alterations in cells collected from endoscopic brushings and identify a probe set that has high sensitivity and specificity for the detection of dysplasia and adenocarcinoma in patients with Barrett’s esophagus. In addition, we demonstrate that this probe set discriminates patients with high-grade dysplasia/adenocarcinoma from those with low-grade dysplasia.
Brushing specimens taken from patients with low-grade dysplasia had high percentages of cells with 9p21, 17p13.1, and centromere Y loss but relatively low percentages of cells with chromosomal gains (Figure 2, A and B). In contrast, brushing specimens taken from patients with high-grade dysplasia and adenocarcinoma had high percentages of cells with chromosomal gains of most loci examined except for 5q21-22, 9p21, 17p13.1, and centromere Y (Figure 2B). The percentage of cells with gain increased with disease progression from squamous epithelium to adenocarcinoma for all loci but was most pronounced for 5p15, CEP 7, 7p21, 8q24.12-13, CEP 17, 17q11.2-12, and 20q13.2. The largest increase in the percentages of cells showing gain occurred at the low-grade dysplasia to high-grade dysplasia transition. These findings are consistent with studies that have shown that 9p21 (P16) and 17p13.1 (P53) loss occur early in the development of Barrett’s associated neoplasia and that the progression of low-grade dysplasia to high-grade dysplasia is accompanied by a significant increase in chromosomal instability and the appearance of aneuploidy.8,31,32
A ROC curve of 9p21 loss for the detection of low-grade dysplasia was performed because this is a frequent alteration observed in low-grade dysplasia (Figure 3). This curve reveals that in our cohort of patients a cutoff of greater than or equal to 9% cells with 9p21 loss yields a sensitivity of ∼45% for the detection of low-grade dysplasia with 100% specificity. The 55% false-negative rate for low-grade dysplasia at this cutoff could be due to the fact that inactivation of the P16 tumor suppressor gene is frequently caused by hypermethylation of the P16 promoter rather than P16 allelic loss.33,34,35 Other possible explanations for false-negative results of 9p21 loss for low-grade dysplasia include inadequate sampling or the possibility that the low-grade dysplasia arose through chromosomal alterations not involving the 9p21 locus.
Because chromosomal gains are a frequent occurrence in high-grade dysplasia and esophageal adenocarcinoma, we performed ROC curves to determine the sensitivity and specificity of gains of individual loci to detect high-grade dysplasia and adenocarcinoma. The ROC curve of 8q24.12-13 gain for the detection of high-grade dysplasia and adenocarcinoma is shown as a representative example (Figure 4). This curve reveals that in our cohort of patients a cutoff of greater than or equal to 4% of cells with 8q24.12-13 gain is associated with a sensitivity of ∼65% and a specificity of 100% for the detection of high-grade dysplasia and esophageal adenocarcinoma.
Previous studies have shown that the sensitivity and specificity of a FISH assay for the detection of cancer increases by increasing the number of probes used in the probe set.14,36 However, there is a point of diminishing returns at which the inclusion of additional probes does not provide significant increases in the overall sensitivity of the assay.36 Furthermore, it is currently not possible to have more than four different visually distinguishable fluorophores in a single FISH probe set due to spectral overlap in the excitation and emission spectra of the different fluorescent labels. Because the goal of this study was to identify a four-probe set that would provide optimal sensitivity and specificity for the detection of dysplasia and esophageal adenocarcinoma in patients with Barrett’s esophagus, ROC curves for various four-probe combinations were performed. This analysis revealed a number of four-probe combinations that provide similarly high sensitivities and specificities for the detection of dysplasia and esophageal adenocarcinoma.
One of the best performing four-probe combinations consisted of probes to 9p21, 8q24.12-13, 17q11.2-12, and 20q13.2 (Figure 5). We have chosen this probe set for future evaluation. Because a number of different four probe combinations provided similar sensitivity and specificity, the decision to use these four probes in a final probe set was based on several factors including: 1) probe hybridization quality, 2) the ability of the probe(s) to distinguish high-grade dysplasia and adenocarcinoma from low-grade dysplasia, and 3) the potential for the probe(s) to provide additional prognostic and therapeutic information. The 9p21, 8q24.12-13, 17q11.2-12, and 20q13.2 probes have all been shown to provide good signals and a lack of cross-hybridization. Three of these four probes hybridize to chromosomal regions that harbor known or putative oncogenes. The inclusion of probes primarily for oncogenes rather than tumor suppressor genes was based on previous studies that show that the finding of a small number of cells with chromosomal gains is a more specific indicator of neoplasia (dysplasia and adenocarcinoma) than chromosomal losses because normal cells frequently exhibit artifactual loss due to signal overlap or incomplete hybridization. Nonetheless, one of the four probes chosen for inclusion in the four probe set, the 9p21 probe, hybridizes to the P16 tumor suppressor gene region. This probe was chosen because it provides reasonably good discrimination between patients with low-grade dysplasia and patients with high-grade dysplasia/adenocarcinoma (Figure 6). Finally, locus-specific probes were chosen over centromeric probes because they have the ability to provide prognostic and therapeutic information that is not provided by centromeric probes. For example, the HER-2 probe might be useful should Herceptin or other anti-Her-2 therapies become useful for the treatment of Barrett’s esophagus associated neoplasia.
The sensitivity and specificity of a probe set for the detection of low-grade dysplasia, high-grade dysplasia, and esophageal adenocarcinoma depends on the cutoff values that are used and can be chosen according to whether one desires to optimize sensitivity or specificity or to maintain a balance between sensitivity and specificity. For the combination of 8q24.12-13, 9p21, 17q11.2-12, and 20q13.2, Figure 5 predicts a sensitivity and specificity, respectively, of 70% and 89% for the detection of low-grade dysplasia, 84% and 93% for the detection of high-grade dysplasia, and 94% and 93% for the detection of esophageal adenocarcinoma can by achieved with respect to specimens with normal squamous epithelium. Additionally, the data from Figure 6 suggests that this probe set can discriminate high-grade dysplasia and adenocarcinoma from low-grade dysplasia and lesser diagnoses with a sensitivity and specificity of ∼80% and can discriminate low-grade dysplasia from lesser diagnoses (intestinal metaplasia and benign squamous epithelium) with a sensitivity and specificity of ∼70%. The lower specificities of the probe set observed in the curves in Figure 6 relative to those shown in Figure 5 is due to the fact that Figure 6 addresses the ability of the probe set to discriminate between similar conditions (ie, high-grade and low-grade dysplasia in the upper curve, low-grade dysplasia and intestinal metaplasia in the lower curve) whereas Figure 5 addresses the ability of the probe set to discriminate dysplasia or adenocarcinoma from normal specimens.
Several groups have begun to explore the possibility of using FISH to detect Barrett’s associated neoplasia using endoscopic brushing specimens obtained from patients undergoing surveillance for Barrett’s esophagus.16,37 These studies have shown that FISH can successfully identify neoplastic cells in endoscopic brushing specimens. Although previous studies have shown an ability to detect adenocarcinoma or dysplasia relative to normal specimens, this is the first study demonstrating the ability of a probe set to distinguish between the more advanced diagnoses of esophageal adenocarcinoma and high-grade dysplasia, and the lesser diagnoses of low-grade dysplasia, intestinal metaplasia, and normal squamous epithelium (Figure 6). This distinction is critical from a patient care perspective because a diagnosis of high-grade dysplasia is often the point at which aggressive corrective procedures such as esophagectomy are performed.
In conclusion, we have identified a set of FISH probes consisting of locus-specific probes to 8q24.12-13, 9p21, 17q11.2-12, and 20q13.2 with the potential to provide high sensitivity and specificity for the detection of Barrett’s associated neoplasia and to differentiate high-grade dysplasia/adenocarcinoma from low-grade dysplasia. However, blinded prospective studies are needed to further assess the performance characteristics of this specific probe set and to define how results obtained with the probe set would be used to alter the clinical management of patients with Barrett’s esophagus.
Footnotes
Supported by Vysis/Abbott Molecular (industry grant 4-1) and the National Institutes of Health (grant RO 1 CA97048-01).
A patent has been filed for the probe set discussed in this article.
References
- Haggitt RC. Barrett’s esophagus, dysplasia, and adenocarcinoma. Hum Pathol. 1994;25:982–993. doi: 10.1016/0046-8177(94)90057-4. [DOI] [PubMed] [Google Scholar]
- Cameron AJ, Ott BJ, Payne WS. The incidence of adenocarcinoma in columnar-lined (Barrett’s) esophagus. N Engl J Med. 1985;313:857–859. doi: 10.1056/NEJM198510033131404. [DOI] [PubMed] [Google Scholar]
- O’Connor JB, Falk GW, Richter JE. The incidence of adenocarcinoma and dysplasia in Barrett’s esophagus: report on the Cleveland Clinic Barrett’s Esophagus Registry. Am J Gastroenterol. 1999;94:2037–2042. doi: 10.1111/j.1572-0241.1999.01275.x. [DOI] [PubMed] [Google Scholar]
- Drewitz DJ, Sampliner RE, Garewal HS. The incidence of adenocarcinoma in Barrett’s esophagus: a prospective study of 170 patients followed 4.8 years. Am J Gastroenterol. 1997;92:212–215. [PubMed] [Google Scholar]
- van der Burgh A, Dees J, Hop WC, van Blankenstein M. Oesophageal cancer is an uncommon cause of death in patients with Barrett’s oesophagus. Gut. 1996;39:5–8. doi: 10.1136/gut.39.1.5. [DOI] [PMC free article] [PubMed] [Google Scholar]
- Wang KK, Wongkeesong M, Buttar NS. American Gastroenterological Association technical review on the role of the gastroenterologist in the management of esophageal carcinoma. Gastroenterology. 2005;128:1471–1505. doi: 10.1053/j.gastro.2005.03.077. [DOI] [PubMed] [Google Scholar]
- Sampliner RE. Updated guidelines for the diagnosis, surveillance, and therapy of Barrett’s esophagus. Am J Gastroenterol. 2002;97:1888–1895. doi: 10.1111/j.1572-0241.2002.05910.x. [DOI] [PubMed] [Google Scholar]
- Reid BJ, Blount PL, Feng Z, Levine DS. Optimizing endoscopic biopsy detection of early cancers in Barrett’s high-grade dysplasia. Am J Gastroenterol. 2000;95:3089–3096. doi: 10.1111/j.1572-0241.2000.03182.x. [DOI] [PubMed] [Google Scholar]
- Skacel M, Petras RE, Gramlich TL, Sigel JE, Richter JE, Goldblum JR. The diagnosis of low-grade dysplasia in Barrett’s esophagus and its implications for disease progression. Am J Gastroenterol. 2000;95:3383–3387. doi: 10.1111/j.1572-0241.2000.03348.x. [DOI] [PubMed] [Google Scholar]
- Spechler SJ. Dysplasia in Barrett’s esophagus: limitations of current management strategies. Am J Gastroenterol. 2005;100:927–935. doi: 10.1111/j.1572-0241.2005.41201.x. [DOI] [PubMed] [Google Scholar]
- Falk GW, Chittajallu R, Goldblum JR, Biscotti CV, Geisinger KR, Petras RE, Birgisson S, Rice TW, Richter JE. Surveillance of patients with Barrett’s esophagus for dysplasia and cancer with balloon cytology. Gastroenterology. 1997;112:1787–1797. doi: 10.1053/gast.1997.v112.pm9178668. [DOI] [PubMed] [Google Scholar]
- Bubendorf L, Grilli B, Sauter G, Mihatsch MJ, Gasser TC, Dalquen P. Multiprobe FISH for enhanced detection of bladder cancer in voided urine specimens and bladder washings. Am J Clin Pathol. 2001;116:79–86. doi: 10.1309/K5P2-4Y8B-7L5A-FAA9. [DOI] [PubMed] [Google Scholar]
- Skacel M, Fahmy M, Brainard JA, Pettay JD, Biscotti CV, Liou LS, Procop GW, Jones JS, Ulchaker J, Zippe CD, Tubbs RR. Multitarget fluorescence in situ hybridization assay detects transitional cell carcinoma in the majority of patients with bladder cancer and atypical or negative urine cytology. J Urol. 2003;169:2101–2105. doi: 10.1097/01.ju.0000066842.45464.cc. [DOI] [PubMed] [Google Scholar]
- Halling KC, King W, Sokolova IA, Meyer RG, Burkhardt HM, Halling AC, Cheville JC, Sebo TJ, Ramakumar S, Stewart CS, Pankratz S, O’Kane DJ, Seelig SA, Lieber MM, Jenkins RB. A comparison of cytology and fluorescence in situ hybridization for the detection of urothelial carcinoma. J Urol. 2000;164:1768–1775. [PubMed] [Google Scholar]
- Kipp BR, Stadheim LM, Halling SA, Pochron NL, Harmsen S, Nagorney DM, Sebo TJ, Therneau TM, Gores GJ, de Groen PC, Baron TH, Levy MJ, Halling KC, Roberts LR. A comparison of routine cytology and fluorescence in situ hybridization for the detection of malignant bile duct strictures. Am J Gastroenterol. 2004;99:1675–1681. doi: 10.1111/j.1572-0241.2004.30281.x. [DOI] [PubMed] [Google Scholar]
- Fahmy M, Skacel M, Gramlich TL, Brainard JA, Rice TW, Goldblum JR, Connor JT, Casey G, Legator MS, Tubbs RR, Falk GW. Chromosomal gains and genomic loss of p53 and p16 genes in Barrett’s esophagus detected by fluorescence in situ hybridization of cytology specimens. Mod Pathol. 2004;17:588–596. doi: 10.1038/modpathol.3800088. [DOI] [PubMed] [Google Scholar]
- Sokolova IA, Halling KC, Jenkins RB, Burkhardt HM, Meyer RG, Seelig SA, King W. The development of a multitarget, multicolor fluorescence in situ hybridization assay for the detection of urothelial carcinoma in urine. J Mol Diagn. 2000;2:116–123. doi: 10.1016/S1525-1578(10)60625-3. [DOI] [PMC free article] [PubMed] [Google Scholar]
- Mertens F, Johansson B, Hoglund M, Mitelman F. Chromosomal imbalance maps of malignant solid tumors: a cytogenetic survey of 3185 neoplasms. Cancer Res. 1997;57:2765–2780. [PubMed] [Google Scholar]
- Riegman PH, Burgart LJ, Wang KK, Wink-Godschalk JC, Dinjens WN, Siersema PD, Tilanus HW, van Dekken H. Allelic imbalance of 7q32.3-q36.1 during tumorigenesis in Barrett’s esophagus. Cancer Res. 2002;62:1531–1533. [PubMed] [Google Scholar]
- Sanz-Ortega J, Hernandez S, Saez MC, Sierra E, Sanz-Ortega G, Torres A, Balibrea JL, Sanz-Esponera J, Merino MJ. 3p21, 5q21, 9p21 and 17p13.1 allelic deletions are potential markers of individuals with a high risk of developing adenocarcinoma in Barrett’s epithelium without dysplasia. Hepatogastroenterology. 2003;50:404–407. [PubMed] [Google Scholar]
- van Dekken H, Vissers CJ, Tilanus HW, Tanke HJ, Rosenberg C. Clonal analysis of a case of multifocal oesophageal (Barrett’s) adenocarcinoma by comparative genomic hybridization. J Pathol. 1999;188:263–266. doi: 10.1002/(SICI)1096-9896(199907)188:3<263::AID-PATH374>3.0.CO;2-Y. [DOI] [PubMed] [Google Scholar]
- Walch AK, Zitzelsberger HF, Bruch J, Keller G, Angermeier D, Aubele MM, Mueller J, Stein H, Braselmann H, Siewert JR, Hofler H, Werner M. Chromosomal imbalances in Barrett’s adenocarcinoma and the metaplasia-dysplasia-carcinoma sequence. Am J Pathol. 2000;156:555–566. doi: 10.1016/S0002-9440(10)64760-8. [DOI] [PMC free article] [PubMed] [Google Scholar]
- Varis A, Puolakkainen P, Savolainen H, Kokkola A, Salo J, Nieminen O, Nordling S, Knuutila S. DNA copy number profiling in esophageal Barrett adenocarcinoma: comparison with gastric adenocarcinoma and esophageal squamous cell carcinoma. Cancer Genet Cytogenet. 2001;127:53–58. doi: 10.1016/s0165-4608(00)00423-4. [DOI] [PubMed] [Google Scholar]
- Barrett MT, Sanchez CA, Galipeau PC, Neshat K, Emond M, Reid BJ. Allelic loss of 9p21 and mutation of the CDKN2/p16 gene develop as early lesions during neoplastic progression in Barrett’s esophagus. Oncogene. 1996;13:1867–1873. [PubMed] [Google Scholar]
- Blount PL, Ramel S, Raskind WH, Haggitt RC, Sanchez CA, Dean PJ, Rabinovitch PS, Reid BJ. 17p allelic deletions and p53 protein overexpression in Barrett’s adenocarcinoma. Cancer Res. 1991;51:5482–5486. [PubMed] [Google Scholar]
- Neshat K, Sanchez CA, Galipeau PC, Blount PL, Levine DS, Joslyn G, Reid BJ. p53 mutations in Barrett’s adenocarcinoma and high-grade dysplasia. Gastroenterology. 1994;106:1589–1595. doi: 10.1016/0016-5085(94)90415-4. [DOI] [PubMed] [Google Scholar]
- Wong DJ, Paulson TG, Prevo LJ, Galipeau PC, Longton G, Blount PL, Reid BJ. p16(INK4a) lesions are common, early abnormalities that undergo clonal expansion in Barrett’s metaplastic epithelium. Cancer Res. 2001;61:8284–8289. [PubMed] [Google Scholar]
- Weiss MM, Kuipers EJ, Hermsen MA, van Grieken NC, Offerhaus J, Baak JP, Meuwissen SG, Meijer GA. Barrett’s adenocarcinomas resemble adenocarcinomas of the gastric cardia in terms of chromosomal copy number changes, but relate to squamous cell carcinomas of the distal oesophagus with respect to the presence of high-level amplifications. J Pathol. 2003;199:157–165. doi: 10.1002/path.1260. [DOI] [PubMed] [Google Scholar]
- Croft J, Parry EM, Jenkins GJ, Doak SH, Baxter JN, Griffiths AP, Brown TH, Parry JM. Analysis of the premalignant stages of Barrett’s oesophagus through to adenocarcinoma by comparative genomic hybridization. Eur J Gastroenterol Hepatol. 2002;14:1179–1186. doi: 10.1097/00042737-200211000-00004. [DOI] [PubMed] [Google Scholar]
- Riegman PH, Vissers KJ, Alers JC, Geelen E, Hop WC, Tilanus HW, van Dekken H. Genomic alterations in malignant transformation of Barrett’s esophagus. Cancer Res. 2001;61:3164–3170. [PubMed] [Google Scholar]
- Krishnadath KK, Tilanus HW, van Blankenstein M, Hop WC, Teijgeman R, Mulder AH, Bosman FT, van Dekken H. Accumulation of genetic abnormalities during neoplastic progression in Barrett’s esophagus. Cancer Res. 1995;55:1971–1976. [PubMed] [Google Scholar]
- Reid BJ, Haggitt RC, Rubin CE, Rabinovitch PS. Barrett’s esophagus. Correlation between flow cytometry and histology in detection of patients at risk for adenocarcinoma. Gastroenterology. 1987;93:1–11. [PubMed] [Google Scholar]
- Klump B, Hsieh CJ, Holzmann K, Gregor M, Porschen R. Hypermethylation of the CDKN2/p16 promoter during neoplastic progression in Barrett’s esophagus. Gastroenterology. 1998;115:1381–1386. doi: 10.1016/s0016-5085(98)70016-2. [DOI] [PubMed] [Google Scholar]
- Bian YS, Osterheld MC, Fontolliet C, Bosman FT, Benhattar J. p16 inactivation by methylation of the CDKN2A promoter occurs early during neoplastic progression in Barrett’s esophagus. Gastroenterology. 2002;122:1113–1121. doi: 10.1053/gast.2002.32370. [DOI] [PubMed] [Google Scholar]
- Wong DJ, Barrett MT, Stoger R, Emond MJ, Reid BJ. p16INK4a promoter is hypermethylated at a high frequency in esophageal adenocarcinomas. Cancer Res. 1997;57:2619–2622. [PubMed] [Google Scholar]
- Sauter G, Gasser TC, Moch H, Richter J, Jiang F, Albrecht R, Novotny H, Wagner U, Bubendorf L, Mihatsch MJ. DNA aberrations in urinary bladder cancer detected by flow cytometry and FISH. Urol Res. 1997;25:S37–S43. doi: 10.1007/BF00942046. [DOI] [PubMed] [Google Scholar]
- Doak SH, Jenkins GJ, Parry EM, D’Souza FR, Griffiths AP, Toffazal N, Shah V, Baxter JN, Parry JM. Chromosome 4 hyperploidy represents an early genetic aberration in premalignant Barrett’s oesophagus. Gut. 2003;52:623–628. doi: 10.1136/gut.52.5.623. [DOI] [PMC free article] [PubMed] [Google Scholar]


