

Abstract
In this study we have investigated the expression of three B-cell-associated transcription factors in normal lymphoid tissue and in T-cell neoplasms (three cell lines, and more than 50 biopsy samples). Nuclear OCT-1 immunoreactivity was seen in normal B cells, in many extrafollicular T cells, and in a heterogeneous pattern (ranging in intensity from weak to moderate) in most T-cell neoplasms. OCT-2 immunostaining was primarily restricted in normal lymphoid tissue to B cells, and was absent from most T-cell neoplasms. In contrast, immunostaining for BOB-1/OCA-B–essentially restricted to B cells in normal lymphoid tissue, with the exception of activated T-lymphocytes–was seen in all of the T-cell lines tested and the majority of the tumor cells in all categories of T-cell lymphoma. Thus labeling for each of these three B-cell-associated transcription factors can be seen to varying degrees in T-cell neoplasms. However, the high frequency of BOB-1 expression in T-cell neoplasms, in contrast to its absence from resting peripheral T cells, suggests that its expression might be a prerequisite for neoplastic transformation, and prompts a search for the transcriptional target(s) of this factor in T cells.
It is now well recognized that human hematopoietic cells contain nuclear proteins that interact with specific sequences in the human genome (and also with each other) to control the expression of genes involved in cell maturation and function. 1,2 However, despite their central importance in the physiology of hematopoietic cells and the fact that many are restricted in terms of lineage (eg, OCT-2 is involved in immunoglobulin gene expression and appears to be B-cell-specific, 3-5 ) hematopathologists have only recently explored their use for the immunohistological study and diagnosis of neoplasia.
An early study of this sort reported that the transcription factor encoded by the master hematopoiesis gene TAL-1 (SCL) is detectable by immunostaining in the nuclei of erythroid and megakaryocytic cells, 6 and it was subsequently detected in cases of acute T-cell lymphoblastic leukemia in which the TAL-1 gene was rearranged. 7 This hinted that other human hematopoietic transcription factors might be present at high enough levels to be detectable by conventional immunohistochemistry, and also that these factors might be comparable in terms of lineage specificity to more traditional markers (ie, surface membrane markers). Subsequently a number of immunohistological studies of hematopoietic transcription factors other than TAL-1 (SCL) have confirmed both predictions, and a total of eight different B-cell-associated transcription factors have now been detected in paraffin-embedded tissue sections, namely BCL-6, 8 BOB-1/OCA-B, 9,10 OCT-1, 11 OCT-2, 9,10 E2A, 12 MUM-1/IRF4, 13 PAX5/BSAP, 14,15 and PU.1. 16
These studies have reported interesting data relating to B-cell neoplasms (eg, the Reed-Sternberg cells express PAX5/BSAP 15 but lack BOB-1/OCA-B and OCT-2 9,10 ). However, the literature still contains only limited information on the expression of these markers in neoplastic cells of non-B lineage. In this study we have explored the expression of three B-cell-associated transcription factors in a series of T-cell neoplasms, comprising more than 50 samples and three cell lines. The aim of this study was to establish whether any of these B-cell-associated proteins were expressed by neoplastic T cells. Furthermore, we considered whether such aberrant expression, if it occurred, might be of potential diagnostic value and/or throw light on the origin of T-cell neoplasms.
Materials and Methods
Tissue Samples
Fifty-seven T-cell lymphomas, diagnosed according to the REAL classification, 17 were obtained from the files of the Hematopathology Centre of Bologna University and the Laboratory of Anatomical and Cytologic Pathology of Toulouse University. They had been fixed in either buffered formalin 18 or Bouin’s fixative, 19 processed according to routine procedures, and embedded in paraffin. Paraffin-embedded samples of tonsils and lymph nodes showing reactive changes (including 10 examples of infectious mononucleosis and dermatopathic lymphadenitis with a huge number of CD30-positive cells in the paracortex), as well as frozen tonsil samples, were also obtained from the authors’ institutions.
Cell Lines
The FL18 (follicle center lymphoma-derived) B-cell line and the T-cell lymphoma-derived cell lines Hut 78 and CCRF-CEM were obtained from Dr. E. Macintyre (Hôpital Necker-Enfants Malades, Paris, France). Jurkat, another lymphoma derived T-cell line, and the Raji (Burkitt’s-derived) B-cell line were obtained from the Sir William Dunn School of Pathology, Oxford, UK. The KM-H2 (HD-derived) cell line was purchased from the Deutsche Sammlung vom Mikroorganismen und Zellkulturen (DSMZ) cell collection (Braunschweig, Germany). The cells were maintained in culture in RPMI 1640 containing 10% fetal calf serum (Invitrogen, Paisley, Scotland) at 37°C in 5% CO2. Cytocentrifuge preparations were obtained, fixed, and stored as previously described. 20
Immunohistochemistry
Tissue sections (4 μm) were cut from routine blocks, coated on electrically charged slides, dewaxed and rehydrated, and then submitted to antigen retrieval by microwaving in 1 mmol/L of ethylenediaminetetraacetic acid (pH 8.0) twice for 5 minutes at 900 W. 21 After cooling, slides were incubated for 30 minutes at room temperature with antibodies from the panel listed in Table 1 ▶ . Antibody binding was detected by the alkaline phosphatase anti-alkaline phosphatase technique 22 or by the peroxidase-based EnVision+ (Dako Cytomation, Glostrup, Denmark) method 23 and sections were then counterstained with hematoxylin. Most immunohistochemical tests were performed on a TechMate 500 immunostainer. 23
Table 1.
Antibodies Used in Present Study
| Antigen | Antibody | Source |
|---|---|---|
| OCT-1 | sc-232 (polyclonal) | Santa Cruz Biotechnology, Santa Cruz, CA |
| OCT-2 | sc-233 (polyclonal) | Santa Cruz Biotechnology |
| BOB-1/OCA-B | sc-955 (polyclonal) | Santa Cruz Biotechnology |
| CD3 | CD3 (polyclonal) | Dako Cytomation, Glostrup, Denmark |
| CD3 | CD3 (monoclonal) | BioCarta UK, Oxford, UK |
| CD8 | C8/144B (monoclonal) | Prof. D.Y. Mason, Oxford, UK |
| CD15 | C3D-1 (monoclonal) | Dako Cytomation |
| CD20 | L26 (monoclonal) | Dako Cytomation |
| CD21 | 1F8 (monoclonal) | Dako Cytomation |
| CD30 | Ber-H2 (monoclonal) | Dako Cytomation |
| CD34 | QBEnd10 (monoclonal) | Dako Cytomation |
| CD45 | 2B11+PD7/26 | Dako Cytomation |
| CD45R0 | OPD4 (monoclonal) | Dako Cytomation |
| CD68 | PG-M1 (monoclonal) | Prof. B. Falini, Perugia, Italy |
| CD79a | JCB117 (monoclonal) | Dako Cytomation |
| Proliferation-associated nuclear antigen | MIB-1 (monoclonal) | Dako Cytomation |
| TdT | TdT (polyclonal) | Dako Cytomation |
| Myeloperoxidase | Myeloperoxidase (polyclonal) | Dako Cytomation |
| Epithelial membrane antigen (EMA) | E29 (monoclonal) | Dako Cytomation |
| Anaplastic large cell lymphoma kinase | ALK1 (monoclonal) | Prof. D.Y. Mason |
| Anaplastic large cell lymphoma kinase | ALKc | Prof. B. Falini |
| Epstein-Barr virus-associated latent membrane protein-1 (LMP-1) | CS1–4 (monoclonal) | Dako Cytomation |
| Cytotoxic T cell | TIA-1 (monoclonal) | Coulter Immunology, Hialeah, FL |
Five-μm-thick sections from frozen tonsil tissue were air-dried overnight at room temperature, fixed in acetone and chloroform (10 minutes each), and then incubated for 30 minutes with antibody, followed by the alkaline phosphatase anti-alkaline phosphatase technique.
Cytospin preparations of cell lines were stained by an immunoperoxidase technique using the Envision kit (Dako Cytomation).
Double-Immunoenzymatic Labeling
Paraffin sections of tonsil and reactive lymph node were dewaxed and rehydrated in the usual way. All sections were pressure cooked in a microwaveable pressure cooker (A. Menarini Diagnostics, Wokingham, UK) in Tris-ethylenediaminetetraacetic acid buffer, pH 9, for 2 minutes and placed in Tris-buffered saline for 5 minutes. Endogenous peroxidase was blocked using Peroxidase Blocking Reagent (DAKO Ltd, Ely, UK) for 20 minutes. The sections were then incubated with anti-OCT-2 and BOB-1 antibodies at a dilution of 1:1200 and 1:2000, respectively. After washing in Tris-buffered saline, the slides were incubated with anti-rabbit EnVision horseradish peroxidase reagent (DAKO Ltd). The slides were developed using the diaminobenzidine substrate provided with the EnVision System kit.
Anti-CD2-, CD3-, CD4-, CD8-, and CD20 antibodies (Table 1) ▶ were then applied to the sections at appropriate dilutions. After washing in Tris-buffered saline, the antibodies were detected by either anti-mouse/anti-rabbit EnVision AP reagent (DAKO Ltd) or the alkaline phosphatase anti-alkaline phosphatase 22 technique. The slides were developed using the Vector Blue Substrate Kit (Vector Laboratories Ltd, Peterborough, UK) or new fucsin. 22 The sections were washed in tap water and mounted in Aquamount (Merck, Hoddesdon, UK). All primary and secondary antibody incubations lasted 30 minutes at room temperature.
Sodium Dodecyl Sulfate-Polyacrylamide Gel Electrophoresis and Western Blotting
Ten million cells from each of the Raji, Jurkat, CCRF-CEM, and KM-H2 cell lines were washed three times in ice-cold phosphate-buffered saline (PBS). Seven hundred μl of Laemmli sample buffer containing dithiothreitol were added to each cell pellet. Tonsil proteins were solubilized by adding 100 μl of sample buffer to each tonsil cryostat section as previously described. 24 After heating all of the samples at 95°C for 4 minutes, the cell-solubilized proteins were separated by sodium dodecyl sulfate-polyacrylamide gel electrophoresis 25 before being transferred to polyvinylidene difluoride (PDVF) membrane for 30 minutes with anti-BOB-1 (1:250). The membranes were washed in PBS containing 0.5% Tween 20 and then incubated with horseradish peroxidase-goat anti-mouse Ig (diluted 1:2000). After a thorough wash for 4 hours, bound antigen:antibody complexes were visualized using enhanced chemiluminescence substrate as previously described. 24
Results
The results of this study are summarized in Tables 2 and 3 ▶ ▶ , and illustrated in Figures 1 to 4 ▶ ▶ ▶ .
Table 2.
Immunostaining for OCT-1, OCT-2, and BOB-1/OCA-B in Paraffin Sections of Human T-Cell Lymphomas
| T-cell lymphoma | Number of cases | OCT-1 | OCT-2 | BOB-1/OCA-B | |||||||||
|---|---|---|---|---|---|---|---|---|---|---|---|---|---|
| Negative | Positive | Negative | Positive | Negative | Positive | ||||||||
| − | −/+ | +/− | + | − | −/+ | +/− | + | − | −/+ | +/− | + | ||
| Peripheral, unspecified | 12 | 1 | 2 | 3 | 6 | 6 | 3 | 1 | 2 | 0 | 0 | 1 | 11 |
| Angioimmunoblastic* (AILD) | 8 | 1 | 2 | 3 | 1 | 8 | 0 | 0 | 0 | 1 | 1 | 4 | 2 |
| CD30-positive cutaneous | 3 | 1 | 0 | 1 | 1 | 3 | 0 | 0 | 0 | 0 | 0 | 0 | 3 |
| T-lymphoblastic† | 11 | 1 | 0 | 0 | 9 | 10 | 1 | 0 | 0 | 0 | 1 | 1 | 9 |
| Mycosis fungoides | 9 | 6 | 2 | 1 | 0 | 7 | 1 | 1 | 0 | 0 | 1 | 3 | 5 |
| Nasal type | 2 | 0 | 0 | 0 | 2 | 2 | 0 | 0 | 0 | 0 | 0 | 0 | 2 |
| Intestinal type | 1 | n.d. | n.d. | n.d. | n.d. | 1 | 0 | 0 | 0 | 0 | 0 | 0 | 1 |
| ALK-negative anaplastic | 5 | 0 | 0 | 5 | 0 | 5 | 0 | 0 | 0 | 0 | 1 | 1 | 3 |
| ALK-positive | 6 | 0 | 2 | 1 | 3 | 3 | 2 | 0 | 1 | 1 | 1 | 1 | 3 |
| Total | 57 | 10 | 8 | 14 | 22 | 45 | 7 | 2 | 3 | 2 | 5 | 11 | 39 |
−, Negative; −/+, 20 to 50% of the tumour cells are positive; +/−, 50 to 70% of the tumour cells are positive; +, >96% of all tumour cells are positive.
*One case of angioimmunoblastic T-cell lymphoma and
†one case of T-lymphoblastic lymphoma were not stained for OCT-1 protein because of insufficient material; n.d. = not done (material not available).
Table 3.
Immunostaining for OCT-1, OCT-2, and BOB-1/OCA-B in T- and B-Cell Lines
| Cell lines | Staining pattern | |||||
|---|---|---|---|---|---|---|
| Nuclear | Cytoplasmic | |||||
| OCT-1 | OCT-2 | BOB-1 | OCT-1 | OCT-2 | BOB-1 | |
| T-cell lines | ||||||
| Jurkat | + | +Moderate | +Strong | − | − | +Weak |
| Hut 78 | + | +Moderate | +* | − | − | +Weak |
| CCRF-CEM | + | +Weak | − | − | − | + |
| B-cell lines | ||||||
| Follicle center lymphoma (FL18) | + | +Strong | + | − | − | + |
| Burkitt’s lymphoma (Raji) | + | +Strong | + | − | − | + |
+, Positive; −, negative; −/+, <50% of the cells are negative.
*The nuclear staining was heterogeneous and granular.
Figure 1.
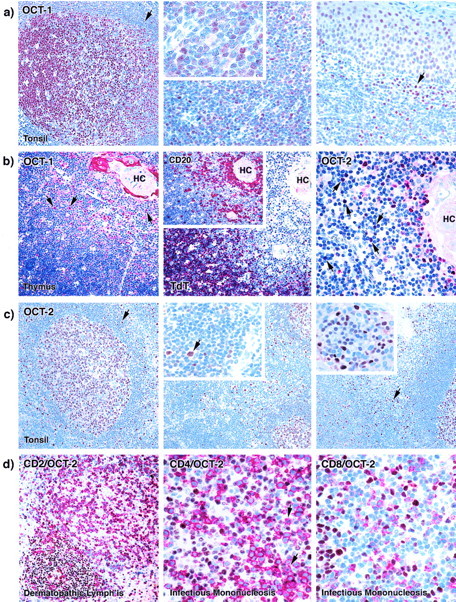
Single and double immunostaining by OCT-1 and OCT-2 antibodies on paraffin-embedded human tonsil, thymus, and reactive lymph nodes. a: Left: Nuclear OCT-1 staining is seen in germinal center cells. Lymphocytes in the mantle zone (arrow) show negative to weak labeling. Middle: The majority of the lymphocytes in the interfollicular (T cell-rich) area show nuclear OCT-1 staining (see inset). Right: Plasma cells (arrows) and overlying tonsillar squamous epithelial cells also show nuclear staining. b: Left: Weak nuclear OCT-1 staining was observed in cortical thymocytes that were TdT-positive (middle). In the medulla OCT-1 was seen in B lymphocytes (arrows) that express CD20 (center, inset). OCT-1 staining was also found in the cytoplasm of epithelial cells forming the Hassall’s corpuscles (HCs). Right: OCT-2 antibody stained in the thymus mainly B cells (arrows), and a few scattered cortical and medullary thymocytes. c: Left: OCT-2 nuclear labeling is seen in a germinal center. The mantle zone (arrows) is also weakly labeled. Middle: In the interfollicular area of hyperplastic tonsil only scattered cells (arrows in inset) are OCT-2-positive. Right: Plasma cells (arrow) lying under the tonsillar crypt epithelium show moderate to strong OCT-2 positivity (see inset). d: Left: Double-immunoenzymatic staining for CD2 (red) and OCT-2 (brown) in a case of dermatopathic lymphadenitis shows scattered CD2-positive, OCT-2-positive T cells. Center: Double-immunoenzymatic staining for CD4 (red) and OCT-2 (brown) in a case of infectious mononucleosis. Only a few activated CD4-positive (red) T cells express OCT-2 (brown) (arrows). Right: Double-immunoenzymatic staining for CD8 (red) and OCT-2 (brown) of the same cases of infectious mononucleosis double immunolabeled for CD4 and OCT-2. CD8-positive (red) T cells turned out to be OCT-2-negative (brown).
Figure 2.
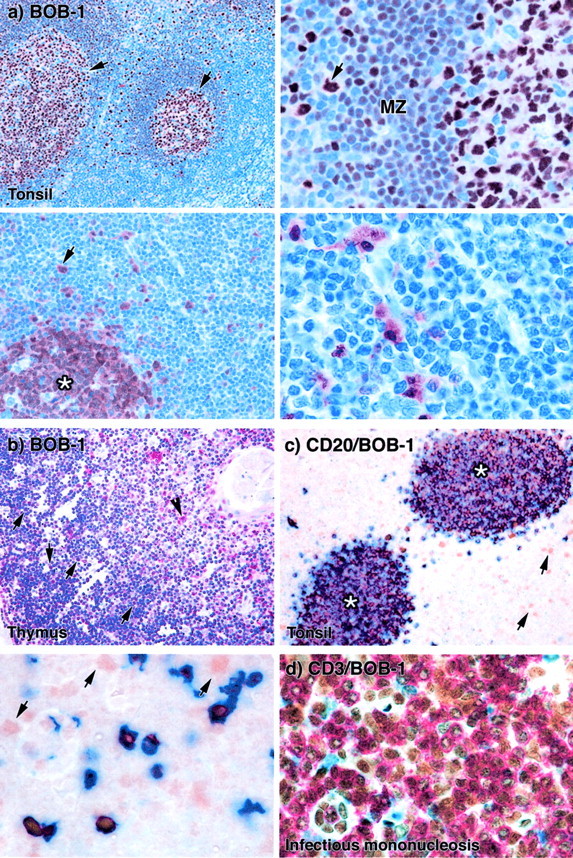
Single and double immunostaining by BOB-1 antibody on paraffin-embedded human tonsil, thymus, and reactive lymph nodes. a: BOB-1 immunostaining in paraffin sections of human tonsil. Top left: Cells in germinal centers (arrows) are strongly labeled. Top right: A higher power view shows that most cells in the follicle mantle zone (MZ) are BOB-1-positive. The arrow indicates a strongly BOB-1-positive peri-mantle large cell. Bottom left: A low-power view of an interfollicular area and part of a B-cell follicle (asterisk) shows that only a few cells outside the follicle are positive (arrow). Bottom right: A higher power view shows clearly that most cells in the interfollicular area are BOB-1-negative. b: In thymus BOB-1 antibody labeled strongly B cells lying in the medulla (arrowhead) and weakly scattered cortical thymocytes (arrows). c: Double-immunoenzymatic staining for CD20 (blue) and BOB-1 (brown) in paraffin sections of human tonsil. Top right: The low-power view shows two lymphoid follicles (asterisks) and scattered interfollicular BOB-1-positive CD20-negative lymphocytes (arrows) that are presumably T cells. Bottom left: A higher magnification view shows these cells more clearly (arrows). (Note that in some of the B cells the intense blue label for CD20 obscures the underlying brown reaction product for BOB-1.) d: Double-immunoenzymatic staining for CD3 (red) and BOB-1 (brown) in a case of infectious mononucleosis. Numerous CD3-positive T cells co-express BOB-1.
Figure 3.
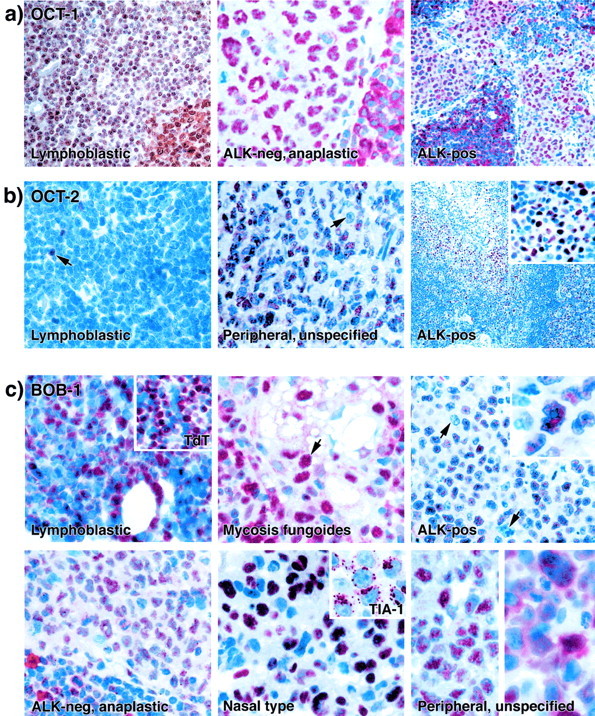
Immunostaining by anti-OCT-1, anti-OCT-2, and anti-BOB-1 antibodies on paraffin-embedded T-cell neoplasms. a: OCT-1 immunostaining. Nuclear OCT-1 staining is seen in a T-lymphoblastic lymphoma (left) (note the residual germinal center in the bottom right corner of this image), in an ALK-negative anaplastic large T-cell lymphoma (center), and in an ALK-positive anaplastic large T-cell lymphoma (right) (note a residual B-cell area in the bottom left quadrant of the latter image). b: OCT-2 immunolabeling. Left: In a T-lymphoblastic lymphoma, the only positive cells are rare residual B cells (arrows). Center: In a case of peripheral T-cell lymphoma, NOS, >50% of the neoplastic cells stain for OCT-2 (an OCT-2-negative lymphoma cell is arrowed). Right: An ALK-positive anaplastic large T-cell lymphoma cell infiltrating lymph node sinuses expresses OCT-2 (seen also at higher magnification in the inset). c: BOB-1 immunostaining. Top left: In a case of T-lymphoblastic lymphoma neoplastic cells stain strongly for BOB-1 (the inset shows the TdT positivity of the tumor). Top center: A case of mycosis fungoides shows BOB-1 labeling in the tumor cells (arrow) infiltrating a sebaceous gland. Top right: In an ALK-positive lymphoma many cells express BOB-1 in the nucleus (seen at higher magnification in the inset), but the arrows indicate BOB-1-negative tumor cells. Bottom left: An ALK-negative anaplastic large T-cell lymphoma shows moderate nuclear BOB-1 staining. Bottom center: In a peripheral T/NK cell lymphoma of nasal-type strong BOB-1 nuclear positivity is seen in the lymphoma cells (which also express the TIA-1 molecule, see inset). Bottom right: The two images show the two patterns of BOB-1 staining seen in T-cell lymphomas: either restricted to nuclei (left), or present in both nuclei and cytoplasm (right).
B-Cell Transcription Factor Expression in Normal and Reactive Peripheral Lymphoid Tissue
OCT-1
Nuclear staining was observed in the great majority of cells in both the dark and light areas of germinal centers (Figure 1) ▶ . Labeling was most intense in larger centroblasts (Figure 1) ▶ . In contrast, the nuclei of mantle zone lymphocytes were weakly positive or OCT-1-negative (Figure 1) ▶ . In the interfollicular area, nuclear staining was found in numerous small- to medium-sized lymphocytes as well as in scattered large cells (Figure 1) ▶ . Plasma cells and epithelial cells showed nuclear OCT-1 labeling (Figure 1) ▶ .
In normal thymus, a weak OCT-1 staining was recorded in most TdT-positive cortical thymocytes (Figure 1) ▶ . In the medulla, OCT-1 positivity decreased in the T-cell compartment, whereas there was a strong expression in CD20-positive B lymphocytes (Figure 1) ▶ . In addition, a cytoplasmic labeling was detected in a proportion of the epithelial cells of Hassall’s corpuscles (Figure 1) ▶ .
OCT-2
The nuclei of all lymphoid cells in the dark zone of germinal centers were strongly OCT-2 positive. Many cells in the light zone showed the same intensity of nuclear staining but were intermingled with clearly negative centrocytes (Figure 1) ▶ . Follicle mantle lymphocytes showed weak to moderate OCT-2 nuclear positivity (Figure 1) ▶ . In the interfollicular zone nuclear OCT-2 positivity was found in a few scattered large cells and small lymphocytes (Figure 1) ▶ . Plasma cells showed moderate to strong nuclear OCT-2 staining (Figure 1) ▶ . In the thymus, OCT-2 expression was mostly confined to B-cells, with the exception of few scattered cortical and medullary thymocytes (Figure 1) ▶ .
Double stains for OCT-2/CD2, OCT-2/CD4, and OCT-2/CD8 in infectious mononucleosis and dermatopathic lymphadenitis revealed scattered CD2-positive T cells and only exceptional CD4-positive T lymphocytes carrying OCT-2 nuclear expression (Figure 1) ▶ .
BOB-1/OCA-B
Strong immunostaining for this protein was seen in the nuclei and also in the cytoplasm of germinal center lymphoid cells (Figure 2) ▶ . Plasma cells were also positive, often strongly so, in both the nucleus and cytoplasm. Most cells in the follicle mantle zone were labeled for BOB-1, but staining was very variable and frequently only weak to moderate (Figure 2) ▶ . BOB-1 immunostaining in the interfollicular area of the examined tonsils and lymph nodes was variable in intensity, being weakly positive on small cells and stronger on medium-large cells (Figure 2) ▶ . BOB-1 staining, when performed on frozen sections of tonsil or lymph node, was similar to that obtained using paraffin-embedded tissue sections, although slightly weaker. The BOB-1 staining pattern in the thymus overlapped the one observed with OCT-2 (Figure 2) ▶ .
After our observation of BOB-1 reactivity in T-cell lymphomas (see below), tissue sections from normal tonsil and reactive lymph nodes were stained by a double-immunolabeling technique for BOB-1 in conjunction with CD20. In the interfollicular areas medium to large cells and a proportion of small lymphocytes showed double immunostaining for BOB-1 and CD20 (ie, were interfollicular B cells). However, CD20-negative cells were also seen, which variably expressed BOB-1/OCA-B (Figure 2) ▶ : their number was much higher in the lymph nodes from patients with infectious mononucleosis or dermatopathic lymphadenitis, all characterized by a high content of activated CD30-positive elements. In the light of this, further serial sections were cut from these lymph nodes and double immunostained for BOB-1 and CD3: the CD20-negative BOB-1-positive interfollicular cells turned out to express CD3 (Figure 2) ▶ .
Transcription Factor Expression in Neoplastic T Cells
OCT-1
OCT-1 immunostaining was seen at low to moderate levels in differing proportions of the neoplastic cells in the majority of T-cell neoplasms (44 of 54) (Table 2) ▶ . Strong OCT-1 labeling was seen in the majority of cases of CD30-positive ALK-negative tumors of anaplastic large cell morphology (Figure 3) ▶ and in T-lymphoblastic lymphoma (Figure 3) ▶ , with the exception of one negative case. In 6 of 12 peripheral T-cell lymphomas (NOS), the majority of the tumor cells showed medium to strong nuclear OCT-1 expression. In five cases only a proportion of tumor cells (ranging from 20 to 70%) showed OCT-1 positivity and the intensity of the reaction varied from medium to weak. OCT-1 immunostaining varied among the six ALK-positive lymphomas. In three cases (Figure 3) ▶ , the majority of the tumor cells were OCT-1-positive. Moderate nuclear staining was found in 50% of the neoplastic cells in one case, whereas 20 to 40% of the tumor cells showed weak to moderate labeling in the remaining two cases. The highest percentage of OCT-1-negative cases (six of nine) was observed among cases of mycosis fungoides.
OCT-2
Most of the T-cell lymphomas tested (45 of 57) were OCT-2-negative (Figure 3) ▶ . However, there were two exceptions. The first comprised peripheral T-cell lymphomas (NOS) in which OCT-2 immunostaining was seen in 6 of 12 cases. The number of OCT-2-positive tumor cells was variable (ranging from 30 to 100%) and the intensity of staining varied from weak to moderate (Figure 3) ▶ . The second exception comprised ALK-positive tumors that showed clear nuclear staining in one case and partial weak to moderate OCT-2 positivity (Figure 3) ▶ in two additional cases. In contrast, all ALK-negative lymphomas of anaplastic large cell morphology were OCT-2-negative.
BOB-1/OCA-B
Tissue Biopsies:
BOB-1/OCA-B immunostaining was seen in the majority of the tumor cells in essentially all categories of T-cell lymphoma, including those deriving from immature cells (Figure 3) ▶ , and those comprising mature small lymphoid cells (eg, mycosis fungoides) (Figure 3 ▶ and Table 2 ▶ ). The one category of T-cell neoplasms in which BOB-1/OCA-B labeling tended to have the lowest expression was those lymphomas with anaplastic large cell morphology (Table 2) ▶ . Among six tumors of this sort expressing ALK protein, one case was scored as negative and two cases showed BOB-1/OCA-B labeling restricted to only a proportion of the neoplastic cells (Figure 3) ▶ . Furthermore, among five CD30-positive ALK-negative lymphomas of anaplastic large cell morphology, three were scored as moderately positive (Figure 3) ▶ , whereas less than 50% of the tumor cells were weakly labeled for BOB-1 in the remaining two cases.
The cellular staining pattern for BOB-1/OCA-B showed some variation from case to case (and even within a single section), being most prominent in the nucleus in some instances (principally nasal and peripheral T-cell lymphoma), mainly cytoplasmic in others, and sometimes present with comparable intensity at both sites (Figure 3) ▶ .
Cell Lines:
Strong labeling of both the nucleus and cytoplasm of the FL18 and Raji B-cell lines was observed (Figure 4) ▶ . Staining was also found in all of the T-cell lines tested (Table 3) ▶ . With the exception of the CCRF-CEM (Figure 4) ▶ , that showed cytoplasmic BOB-1 staining, in the other cell lines both nuclei and cytoplasm were labeled. The HUT 78 and Jurkat cell lines exhibited the strongest labeling (Figure 4) ▶ . The nuclear labeling showed a granular pattern, with the intensity being greatest at the edge of the nucleus. Of interest was the presence of intense cytoplasmic labeling in mitotic cells.
Figure 4.
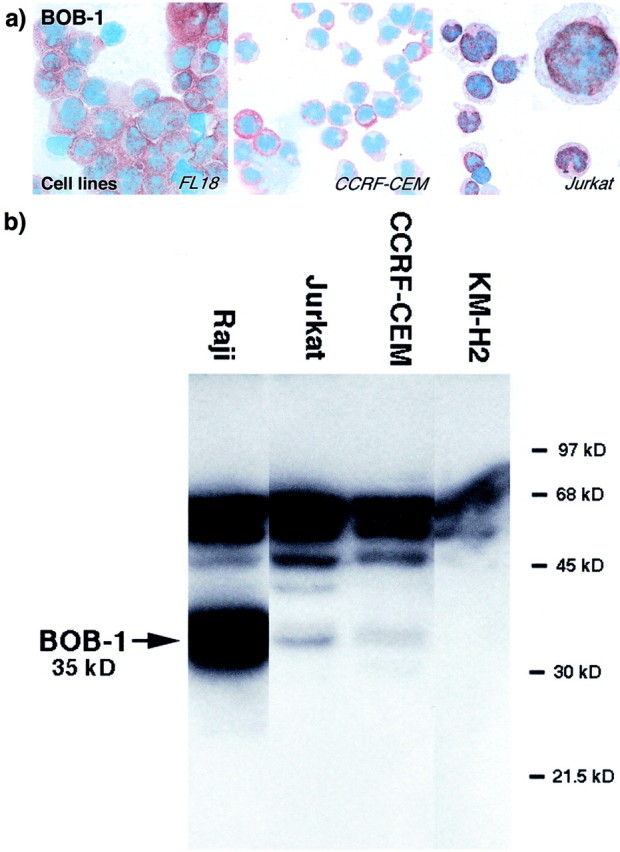
Immunohistochemical and biochemical studies of transformed cell lines by anti-BOB-1 antibody. a: Cell lines labeled for BOB-1. Left: Strong nuclear and cytoplasmic BOB-1 staining is seen in a follicle center lymphoma-derived B-cell line (FL18). The T-lymphoblastic-derived T-cell line (CCRF-CEM) shows cytoplasmic BOB-1 staining, and cytoplasmic and nuclear BOB-1 labeling is seen in the Jurkat T-cell line (see also inset at higher magnification). b: Western blotting of cell lysates from Raji (B cell), Jurkat (T cell), CCRF-CEM (T cell), and KMH2 (Hodgkin’s disease) cell lines. The widely studied anti-BOB-1-antibody from Santa Cruz detects a protein with the expected molecular weight for BOB-1 (35 kd) in cell lysates of the Raji, Jurkat, and CCRF-CEM cell lines. The latter cell line shows a weaker additional band of ∼33 kd. Cell lysates of the Hodgkin’s-derived KMH2 cell line revealed only the presence of the higher band (60 kd) common to the other three cell lines and show the absence of the 35-kd proteins.
Biochemical Studies on BOB-1 Expression in Cell Lines (Figure 4) ▶ :
A strong band of 35 kd comparable in size to BOB-1 protein was detected in lysates of the Raji, Jurkat, and CCRF-CEM cell lines. The latter cell line showed an additional band of ∼33 kd. In contrast, only the higher molecular weight band (∼60 kd) common to all four cell lines was detected in the KM-H2 cell line lysates.
Discussion
Cellular gene expression is the outcome of multiple interactions between transcription-regulating proteins (many of which have probably yet to be characterized) that bind directly to DNA, or to each other. A number of these transcription factors have been identified in human B and T cells, and some of them are known to influence the transcription of functionally important lymphoid-associated molecules (eg, immunoglobulin, CD3, CD4, CD20, CD79a, interleukin-2, interleukin-3, and so forth). 2,5,26-32 The physiological importance of many lymphoid transcription factors is evident from the consequences of disrupting the gene that encodes them (eg, knockout of BOB-1/OCA-B or BCL-6 genes abrogates germinal center formation). 33-35 Of additional relevance in a clinical context are observations that acquired alterations of hematopoietic transcription factor genes (resulting in deregulated protein expression or the expression of chimeric proteins) can contribute to malignant cell transformation [eg, the (1;19)(q23;p13.3) translocation in acute lymphoblastic leukemia creates a fusion protein gene that encodes an oncogenic hybrid E2A-PBX1 transcription factor]. 36
A number of recent studies have shown that hematopoietic transcription factors constitute a novel category of immunohistochemical markers whose expression may correlate with cell lineage and/or the stage of cell differentiation. 32 Recently published data demonstrate that OCT-1, OCT-2, and BOB-1/OCA-B transcription factors are expressed in almost all categories of B-cell neoplasms, 37 with the exception of classical Hodgkin’s lymphoma. 9,10 The aim of this study was to study the expression of anti-OCT-1, anti-OCT-2, and anti-BOB-1/OCA-B antibodies among T-cell neoplasms.
The first B-cell-associated transcription factor to be identified, OCT-1, detected because of its direct interaction with the immunoglobulin heavy chain gene, 38-40 was subsequently shown to be expressed in cells of non-B-cell lineage. 5,41 In keeping with this, we found immunostaining for OCT-1 in both B and T cells, and in almost allof the T-cell lymphomas we investigated. Mycosis fungoides constituted an exception because tumor cells were negative in six of the nine cases studied.
In reactive lymphoid tissue (eg, cases of dermatopathic lymphadenitis and infectious mononucleosis), OCT-2 expression was essentially restricted to B cells, only scattered CD2-positive and exceptional CD4-positive T-lymphocytes being stained. Accordingly, the majority of T-cell neoplasms did not carry OCT-2, the exception being some peripheral T-cell lymphomas (NOS) and ALK-positive lymphomas, of which 50% were OCT-2-positive. Notably, ALK-negative lymphomas with anaplastic large cell morphology were all OCT-2-negative. The significance of OCT-2 immunostaining in T-cell lymphomas is unknown but it may conceivably relate to reports that OCT-2 can be expressed in T cells after in vitro activation. 28-31
The most interesting observation in this study was the finding that immunostaining for BOB-1/OCA-B was found in the great majority of T-cell neoplasms. This fits with a recent report of Saez and colleagues, 37 who incidentally found BOB-1 positivity in a few T-cell lymphomas, as well as with the detection of BOB-1 chromosomal rearrangement in a single case of T-prolymphocytic leukemia. 42 In the light of these findings, we decided to extensively look for BOB-1 expression in reactive lymphoid tissues and to conduct immunocytochemical and biochemical studies in selected cell lines. In the normal tonsil, the vast majority of interfollicular BOB-1-positive cells did actually correspond to (CD20+) B-lymphocytes, thus confirming the assumption that the molecule is usually restricted to the B-cell compartment. 1,33,34 However, in double-stained preparations from infectious mononucleosis and dermatopathic lymphadenitis cases (ie, conditions with numerous activated cells) BOB-1 was expressed by a significant number of interfollicular CD3-positive T cells. In the thymus, BOB-1 staining was mostly confined to B cells, with the exception of a few scattered cortical and medullary thymocytes. In the Jurkat, Hut 78, and CCRF-CEM T-cell lines, clear-cut nuclear and/or cytoplasmic BOB-1 positives were observed analogously to those recorded in T-cell lymphomas and FL18 and Raji B-cell lines. The Western blotting analysis provided additional evidence to that found from the immunolabeling studies. A protein of comparable size (35 kd) to that present in the Raji cell sample was detected in both the Jurkat and CCRF-CEM T-cell lines. BOB-1 expression in the Jurkat cell line does not represent a novel finding, as already reported by Zwilling and colleagues 31 By contrast, the KM-H2 cell line lacked the 35-kd band in keeping with its previously reported negativity at the search of BOB-1 mRNA. 43 It should be noted, however, that BOB-1 immunoblotting studies revealed the occurrence of a larger protein band in all of the cell lines investigated (including KM-H2). In view of this, the authors are attempting to produce a monoclonal reagent specific for BOB-1 protein.
The expression of BOB-1/OCA-B in T-cell lymphomas merits some comments. It may represent a secondary event associated with the neoplastic status and be in no way necessary for malignant transformation (Figure 5a) ▶ . In fact, intracellular molecules, often involved in gene transcription, were found aberrantly expressed in neoplastic cells, corresponding to a secondary epiphenomenon. For example, p27 is not expressed in normal lymphoid cells carrying the proliferation-associated marker Ki-67, but such co-expression has been reported in B-cell lymphomas. 44 Similarly, the MUM-1 transcription factor is normally restricted to BCL-6-negative B cells, but may be co-expressed with BCL-6 in 50% of diffuse large B-cell lymphoma (DLBCL), and with cytotoxic T-cell markers in ALK-positive lymphomas. 13
Figure 5.

Two possible hypotheses to account for BOB-1 expression in T-cell neoplasms are sketched in this diagram.
An alternative explanation for the expression of BOB-1 in T-cell neoplasms is that many of them arise from cells that already express BOB-1/OCA-B. The latter finding might result from a previous change (loosely termed “activation”) and represent a necessary prerequisite for neoplastic transformation (Figure 5b) ▶ . This assumption finds support in some previously reported data. In vitro activation of thymocytes 30 and T-cell lines 28,29 (with agents such as PMA or ionomycin) induces expression of BOB-1, which then undergoes serine phosphorylation. 31 This latter event may be one of the factors inducing the transcription of genes containing octamer-motif sequences whose products are necessary for activation-associated T-cell functions, for example production of the soluble factors interleukin-2, 30 interleukin-3, 31 and of the chemokine CCR-5. 45 A comparable activation in vivo--whose occurrence is supported by our results in activated lymph nodes—might be required before a T cell is at risk of neoplastic transformation. In this context it is noteworthy that several T-cell neoplasms (eg, enteropathy-associated intestinal T-cell lymphoma, nasal T/NK-cell lymphoma, HTLV-1-associated lymphoma/leukemia, and possibly angioimmunoblastic lymphadenopathy with dysproteinemia (AILD)) appear to arise against a background of polyclonal T-cell-reactive proliferation.
It may be added that there is yet a third explanation for the frequent expression of BOB-1/OCA-B in neoplastic T cells, namely that it reflects an ongoing external stimulation of the neoplastic cells via surface receptors. Further experiments (eg, the study of neoplastic cells in vitro when removed from external stimuli) might resolve this question.
In conclusion, this study reports that B-cell-associated transcription factors can be expressed in T-cell lymphomas, and opens new avenues both for the differential diagnosis of lymphoid biopsies and also for the understanding of events that lead to neoplastic transformation in the T-cell lineage.
Acknowledgments
We thank Bridget Watson, Robin Roberts-Gant, and Andrew Graham for their skilled assistance; and Paul Allen for his technical support.
Footnotes
Address reprint requests to Dr. Teresa Marafioti, Nuffield Department of Clinical Laboratory Sciences, John Radcliffe Hospital, OX3 9DU, Oxford, UK. E-mail: teresa.marafioti@ndcls.ox.ac.uk.
Supported by grants from the Leukemia Research Fund (to D. Y. M.), the Associazione Italiana per la Ricerca sul Cancro (Milan), and Ministero dell’Università e della Ricerca Scientifica e Tecnologica (Rome) (to S. A. P.).
References
- 1.Henderson A, Calame K: Transcriptional regulation during B cell development. Annu Rev Immunol 1998, 16:163-200 [DOI] [PubMed] [Google Scholar]
- 2.Kuo CT, Leiden JM: Transcriptional regulation of T lymphocyte development and function. Annu Rev Immunol 1999, 17:149-187 [DOI] [PubMed] [Google Scholar]
- 3.Wirth T, Pfisterer P, Annweiler A, Zwilling S, Konig H: Molecular principles of Oct2-mediated gene activation in B cells. Immunobiology 1995, 193:161-170 [DOI] [PubMed] [Google Scholar]
- 4.Shah PC, Bertolino E, Singh H: Using altered specificity Oct-1 and Oct-2 mutants to analyze the regulation of immunoglobulin gene transcription. EMBO J 1997, 16:7105-7117 [DOI] [PMC free article] [PubMed] [Google Scholar]
- 5.Matthias P: Lymphoid-specific transcription mediated by the conserved octamer site: who is doing what? Semin Immunol 1998, 10:155-163 [DOI] [PubMed] [Google Scholar]
- 6.Pulford K, Lecointe N, Leroy-Viard K, Jones M, Mathieu-Mahul D, Mason DY: Expression of TAL-1 proteins in human tissues. Blood 1995, 85:675-684 [PubMed] [Google Scholar]
- 7.Delabesse E, Bernard M, Meyer V, Smit L, Pulford K, Cayuela JM, Ritz J, Bourquelot P, Strominger JL, Valensi F, Macintyre EA: TAL1 expression does not occur in the majority of T-ALL blasts. Br J Haematol 1998, 102:449-457 [DOI] [PubMed] [Google Scholar]
- 8.Flenghi L, Bigerna B, Fizzotti M, Venturi S, Pasqualucci L, Pileri S, Ye BH, Gambacorta M, Pacini R, Baroni CD, Pescarmona E, Anagnostopoulos I, Stein H, Asdrubali G, Martelli MF, Pelicci PG, Dalla-Favera R, Falini B: Monoclonal antibodies PG-B6a and PG-B6p recognize, respectively, a highly conserved and a formol-resistant epitope on the human BCL-6 protein amino-terminal region. Am J Pathol 1996, 148:1543-1555 [PMC free article] [PubMed] [Google Scholar]
- 9.Re D, Muschen M, Ahmadi T, Wickenhauser C, Staratschek-Jox A, Holtick U, Diehl V, Wolf J: Oct-2 and Bob-1 deficiency in Hodgkin and Reed Sternberg cells. Cancer Res 2001, 61:2080-2084 [PubMed] [Google Scholar]
- 10.Stein H, Marafioti T, Foss HD, Laumen H, Hummel M, Anagnostopoulos I, Wirth T, Demel G, Falini B: Down-regulation of BOB.1/OBF.1 and Oct2 in classical Hodgkin disease but not in lymphocyte predominant Hodgkin disease correlates with immunoglobulin transcription. Blood 2001, 97:496-501 [DOI] [PubMed] [Google Scholar]
- 11.Marafioti T, Roncador G, Delsol G, Mason DY: Transcription factors: a new category of lineage and maturation-associated intracellular markers. Mason DY eds. Leucocyte Typing VII. 2002:pp 140-144 Oxford University Press, Oxford
- 12.Rutherford MN, LeBrun DP: Restricted expression of E2A protein in primary human tissues correlates with proliferation and differentiation. Am J Pathol 1998, 153:165-173 [DOI] [PMC free article] [PubMed] [Google Scholar]
- 13.Falini B, Fizzotti M, Pucciarini A, Bigerna B, Marafioti T, Gambacorta M, Pacini R, Alunni C, Natali-Tanci L, Ugolini B, Sebastiani C, Cattoretti G, Pileri S, Dalla-Favera R, Stein H: A monoclonal antibody (MUM1p) detects expression of the MUM1/IRF4 protein in a subset of germinal center B cells, plasma cells, and activated T cells. Blood 2000, 95:2084-2092 [PubMed] [Google Scholar]
- 14.Hamada T, Yonetani N, Ueda C, Maesako Y, Akasaka H, Akasaka T, Ohno H, Kawakami K, Amakawa R, Okuma M: Expression of the PAX5/BSAP transcription factor in haematological tumour cells and further molecular characterization of the t(9;14)(p13;q32) translocation in B-cell non-Hodgkin’s lymphoma. Br J Haematol 1998, 102:691-700 [DOI] [PubMed] [Google Scholar]
- 15.Foss HD, Reusch R, Demel G, Lenz G, Anagnostopoulos I, Hummel M, Stein H: Frequent expression of the B-cell-specific activator protein in Reed-Sternberg cells of classical Hodgkin’s disease provides further evidence for its B-cell origin. Blood 1999, 94:3108-3113 [PubMed] [Google Scholar]
- 16.Torlakovic E, Tierens A, Dang HD, Delabie J: The transcription factor PU.1, necessary for B-cell development is expressed in lymphocyte predominance, but not classical Hodgkin’s disease. Am J Pathol 2001, 159:1807-1814 [DOI] [PMC free article] [PubMed] [Google Scholar]
- 17.Harris NL, Jaffe ES, Stein H, Banks PM, Chan JK, Cleary ML, Delsol G, De Wolf-Peeters C, Falini B, Gatter KC: A revised European-American classification of lymphoid neoplasms: a proposal from the International Lymphoma Study Group. Blood 1994, 84:1361-1392 [PubMed] [Google Scholar]
- 18.Falini B, Pileri S, Martelli MF: Histological and immunohistological analysis of human lymphomas. Crit Rev Oncol Hematol 1989, 9:351-419 [DOI] [PubMed] [Google Scholar]
- 19.Laurent G, Delsol G, Reyes F, Abbal M, Mihaesco E: Detection of J chain in lymphomas and related disorders. Clin Exp Immunol 1981, 44:620-628 [PMC free article] [PubMed] [Google Scholar]
- 20.Erber WN, Pinching AJ, Mason DY: Immunocytochemical detection of T and B cell populations in routine blood smears. Lancet 1984, 1:1042-1046 [DOI] [PubMed] [Google Scholar]
- 21.Pileri SA, Roncador G, Ceccarelli C, Piccioli M, Briskomatis A, Sabattini E, Ascani S, Santini D, Piccaluga PP, Leone O, Damiani S, Ercolessi C, Sandri F, Pieri F, Leoncini L, Falini B: Antigen retrieval techniques in immunohistochemistry: comparison of different methods. J Pathol 1997, 183:116-123 [DOI] [PubMed] [Google Scholar]
- 22.Cordell JL, Falini B, Erber WN, Ghosh AK, Abdulaziz Z, MacDonald S, Pulford KA, Stein H, Mason DY: Immunoenzymatic labeling of monoclonal antibodies using immune complexes of alkaline phosphatase and monoclonal anti-alkaline phosphatase (APAAP complexes). J Histochem Cytochem 1984, 32:219-229 [DOI] [PubMed] [Google Scholar]
- 23.Sabattini E, Bisgaard K, Ascani S, Poggi S, Piccioli M, Ceccarelli C, Pieri F, Fraternali-Orcioni G, Pileri SA: The EnVision+ system: a new immunohistochemical method for diagnostics and research. Critical comparison with the APAAP, ChemMate CSA, LABC, and SABC techniques. J Clin Pathol 1998, 51:506-511 [DOI] [PMC free article] [PubMed] [Google Scholar]
- 24.Pulford K, Falini B, Cordell J, Rosenwald A, Ott G, Muller-Hermelink HK, MacLennan KA, Lamant L, Carbone A, Campo E, Mason DY: Biochemical detection of novel anaplastic lymphoma kinase proteins in tissue sections of anaplastic large cell lymphoma. Am J Pathol 1999, 154:1657-1663 [DOI] [PMC free article] [PubMed] [Google Scholar]
- 25.Laemmli UK: Cleavage of structural proteins during the assembly of the head of bacteriophage T4. Nature 1970, 227:680-685 [DOI] [PubMed] [Google Scholar]
- 26.Kemler I, Schaffner W: Octamer transcription factors and the cell type-specificity of immunoglobulin gene expression. EMBO J 1990, 4:1444-1449 [DOI] [PubMed] [Google Scholar]
- 27.Staudt LM, Lenardo MJ: Immunoglobulin gene transcription. Annu Rev Immunol 1991, 9:373-398 [DOI] [PubMed] [Google Scholar]
- 28.Kang SM, Tsang W, Doll S, Scherle P, Ko HS, Tran AC, Lenardo MJ, Staudt LM: Induction of the POU domain transcription factor Oct-2 during T-cell activation by cognate antigen. Mol Cell Biol 1992, 12:3149-3154 [DOI] [PMC free article] [PubMed] [Google Scholar]
- 29.Graef IA, Crabtree GR: The transcriptional paradox: octamer factors and B and T cells. Science 1997, 277:193-194 [DOI] [PubMed] [Google Scholar]
- 30.Sauter P, Matthias P: The B cell-specific coactivator OBF-1 (OCA-B, Bob-1) is inducible in T cells and its expression is dispensable for IL-2 gene induction. Immunobiology 1997, 198:207-216 [DOI] [PubMed] [Google Scholar]
- 31.Zwilling S, Dieckmann A, Pfisterer P, Angel P, Wirth T: Inducible expression and phosphorylation of coactivator BOB.1/OBF.1 in T cells. Science 1997, 277:221-225 [DOI] [PubMed] [Google Scholar]
- 32.Liberg D, Sigvardsson M: Transcriptional regulation in B cell differentiation. Crit Rev Immunol 1999, 19:127-153 [PubMed] [Google Scholar]
- 33.Kim U, Qin XF, Gong S, Stevens S, Luo Y, Nussenzweig M, Roeder RG: The B-cell-specific transcription coactivator OCA-B/OBF-1/Bob-1 is essential for normal production of immunoglobulin isotypes. Nature 1996, 383:542-547 [DOI] [PubMed] [Google Scholar]
- 34.Schubart DB, Rolink A, Kosco-Vilbois MH, Botteri F, Matthias P: B-cell-specific coactivator OBF-1/OCA-B/Bob1 required for immune response and germinal centre formation. Nature 1996, 383:538-542 [DOI] [PubMed] [Google Scholar]
- 35.Qin XF, Reichlin A, Luo Y, Roeder RG, Nussenzweig MC: OCA-B integrates B cell antigen receptor-, CD40L- and IL 4-mediated signals for the germinal center pathway of B cell development. EMBO J 1998, 17:5066-5075 [DOI] [PMC free article] [PubMed] [Google Scholar]
- 36.Hunger SP: Chromosomal translocations involving the E2A gene in acute lymphoblastic leukemia: clinical features and molecular pathogenesis. Blood 1996, 87:1211-1224 [PubMed] [Google Scholar]
- 37.Saez AI, Artiga MJ, Sanchez-Beato M, Sanchez-Verde L, Garcia JF, Camacho FI, Franco R, Piris MA: Analysis of octamer-binding transcription factors Oct2 and Oct1 and their coactivator BOB.1/OBF.1 in lymphomas. Mod Pathol 2002, 15:211-220 [DOI] [PubMed] [Google Scholar]
- 38.Pruijn GJ, van Driel W, van der Vliet PC: Nuclear factor III, a novel sequence-specific DNA-binding protein from HeLa cells stimulating adenovirus DNA replication. Nature 1986, 322:656-659 [DOI] [PubMed] [Google Scholar]
- 39.Pruijn GJ, van Driel W, van Miltenburg RT, van der Vliet PC: Promoter and enhancer elements containing a conserved sequence motif are recognized by nuclear factor III, a protein stimulating adenovirus DNA replication. EMBO J 1987, 6:3771-3778 [DOI] [PMC free article] [PubMed] [Google Scholar]
- 40.Poellinger L, Roeder RG: Octamer transcription factors 1 and 2 each bind to two different functional elements in the immunoglobulin heavy-chain promoter. Mol Cell Biol 1989, 9:747-756 [DOI] [PMC free article] [PubMed] [Google Scholar]
- 41.Sturm RA, Das G, Herr W: The ubiquitous octamer-binding protein Oct-1 contains a POU domain with a homeo box subdomain. Genes Dev 1988, 2:1582-1599 [DOI] [PubMed] [Google Scholar]
- 42.Yuille MA, Galiegue-Zouitina S, Hiorns LR, Jadayel D, De Schouwer PJ, Catovsky D, Dyer MJ, Kerckaert JP: Heterogeneity of breakpoints at the transcriptional co-activator gene, BOB-1, in lymphoproliferative disease. Leukemia 1996, 10:1492-1496 [PubMed] [Google Scholar]
- 43.Theil J, Laumen H, Marafioti T, Hummel M, Lenz G, Wirth T, Stein H: Defective octamer-dependent transcription is responsible for silenced immunoglobulin transcription in Reed-Sternberg cells. Blood 2001, 97:3191-3196 [DOI] [PubMed] [Google Scholar]
- 44.Sanchez-Beato M, Camacho FI, Martinez-Montero JC, Saez AI, Villuendas R, Sanchez-Verde L, Garcia JF, Piris MA: Anomalous high p27/KIP1 expression in a subset of aggressive B-cell lymphomas is associated with cyclin D3 overexpression. p27/KIP1-cyclin D3 colocalization in tumor cells. Blood 1999, 94:765-772 [PubMed] [Google Scholar]
- 45.Moriuchi M, Moriuchi H: Octamer transcription factors up-regulate the expression of CCR5, a coreceptor for HIV-1 entry. J Biol Chem 2001, 276:8639-8642 [DOI] [PubMed] [Google Scholar]