

Abstract
The etiology of the central nervous system (CNS) alterations after human immunodeficiency virus (HIV) infection, such as dementia and encephalitis, remains unknown. We have used microarray analysis in a monkey model of neuroAIDS to identify 98 genes, many previously unrecognized in lentiviral CNS pathogenesis, whose expression is significantly up-regulated in the frontal lobe of simian immunodeficiency virus-infected brains. Further, through immunohistochemical illumination, distinct classes of genes were found whose protein products localized to infiltrating macrophages, endothelial cells and resident glia, such as CD163, Glut5, and ISG15. In addition we found proteins induced in cortical neurons (ie, cyclin D3, tissue transglutaminase, α1-antichymotrypsin, and STAT1), which have not previously been described as participating in simian immunodeficiency virus or HIV-related CNS pathology. This molecular phenotyping in the infected brains revealed pathways promoting entry of macrophages into the brain and their subsequent detrimental effects on neurons. These data support the hypothesis that in HIV-induced CNS disease products of activated macrophages and astrocytes lead to CNS dysfunction by directly damaging neurons, as well as by induction of altered gene and protein expression profiles in neurons themselves which are deleterious to their function.
The cognitive/motor disorder associated with human immunodeficiency virus (HIV), also known as the AIDS dementia complex or neuroAIDS, occurs in approximately one-third of patients infected with HIV. Symptoms range from a minor disorder affecting 25% of individuals to dementia affecting 15 to 20% of those with AIDS. In symptomatic individuals, aspects of the pathological entity of HIV encephalitis (HIVE), which includes the appearance of infected cells of the monocyte/macrophage lineage, microglia/macrophage nodules, and multinucleated giant cells (MNGCs), have been proposed to correlate with neuroAIDS. Although many individuals with neuroAIDS do not exhibit frank HIVE, central nervous system (CNS) dysfunction best correlates with the level of activated microglia/macrophages in the brain as opposed to the level of viral infection. 1 Still, the etiology of HIV-induced CNS alterations remains unknown. Although cognitive dysfunction in HIV-infected individuals is linked to pathologically damaged neuronal dendrites, 2 the virus does not infect neurons thus indirect effects that follow infection of macrophage-like cells in the brain likely result in the neurological dysfunction of neuroAIDS.
Experimental infection with simian immunodeficiency virus (SIV) in rhesus macaques provides many parallels to HIV infection of humans including CNS infection and dysfunction. Cognitive and motor dysfunction, neurophysiological abnormalities, and neuropathological changesincluding SIV encephalitis (SIVE) are also found in SIV-infected monkeys. 3 As with the human disease, CNS abnormalities can occur throughout the course of infection, with the most severe symptoms at the onset of clinical AIDS. Like HIVE, SIVE can occur with end-stage disease and accompany CNS disorders. 4 SIVE arises sporadically in infected rhesus macaques, similar to HIVE in humans, but a reproducible system in which monkeys are transiently depleted of CD8+ cells shortly after infection 5 leads to rapid development of SIVE in a high percentage of animals. 6
Macrophages and microglia can produce molecules that are potentially harmful to neurons. Although such products are common candidates in proposed pathogenic mechanisms mediating HIV/SIV-initiated damage to the CNS, 7 the identities of the molecules responsible for neuropathogenesis remain unknown. We hypothesized that an unbiased examination of brain RNA from animals with SIV-induced CNS disease would allow us to identify gene transcripts found in infiltrating and activated macrophages, as well as other cell types in the affected brains, and to analyze their pathogenic products as well as molecular pathways of disease. To this end, gene expression was analyzed in the frontal lobe of brains from control and SIV-infected animals depleted of CD8+ cells during acute infection, using Affymetrix Human U95Av2 GeneChips to measure the expression of mRNA transcripts. We have found, as have others, that human gene chips are efficient in detecting mRNA transcripts from rhesus macaque tissues. 8,9 Indeed, here we report that many genes, previously unrecognized, were significantly up-regulated in the frontal lobe of brains with SIVE compared to that of uninfected animals. Using those results, we examined protein expression by immunohistochemistry to create a profile of the pathogenic cell populations present in the brain and to investigate the inflammatory processes and molecular alterations that result in CNS disease.
Materials and Methods
Rhesus Macaques
For this experiment we used 13 rhesus macaques free of SIV, type D simian retrovirus, and Herpes B virus, that were obtained from Charles River Breeding Laboratories (Key Lois, FL) and Covance (Alice, TX). Experiments were performed when the animals were 3 to 5 years of age with The Scripps Research Institute’s Animal Care and Use Committee approval and guidelines. Seven macaques were intravenously inoculated with a cell-free stock of SIVmac182 (p27 gag antigen equivalent of 0.9 ng, diluted in RPMI 1640 for injection). After inoculation these animals were initially injected with 10 mg/kg (subcutaneous) then subsequently 5 mg/kg (intravenous) of the CD8 antibody cM-T807 at 6, 9, and 13 days after inoculation, a slight modification of the originally described protocol. 5 The SIVmac182-infected monkeys were sacrificed, after development of signs of simian AIDS, on the following days after inoculation: macaque no. 289 (72 days), no. 301 (108 days), no. 321 (108 days), no. 322 (214 days), no. 323 (93 days), no. 328 (79 days), and no. 330 (111 days).
All of the SIV-infected animals had abnormalities in CNS functional testing (neurophysiology, cognitive and motor tasks), which will be reported in detail (MA Taffe and colleagues, in preparation). On postmortem histopathological examination one monkey (no. 322) had a lymphoma involving the CNS and was subsequently excluded from the study. The remaining six monkeys all showed signs of SIV encephalitis (SIVE) with varying degrees of severity. This was defined as including microglia activation, macrophage infiltration, perivascular cuffing, macrophage/microglia nodules, and high CNS viral loads (>100,000 RNA equivalent copies of SIV per μg frontal lobe RNA), with four of the cases also showing MNGCs (macaque nos.: 289, 301, 321, and 323).
The CD8+ cell-depleting regimen was also administered to two of six uninfected control monkeys (no. 392 and no. 393) who were sacrificed 87 and 113 days later, respectively. The four other uninfected control animals (no. 298, no. 331, no. 332, and no. 357) did not receive any treatment.
Necropsy was performed after terminal anesthesia (with ketamine, xylazine, and pentobarbital), with subsequent extensive intracardiac perfusion with sterile PBS containing 1 U/ml heparin to clear blood-borne cells from the brain tissue. A portion of the frontal lobe (from one sagittal section of the brain, cut coronally with the rostral border 0.5 cm from the frontal pole and the caudal border rostral to the head of the caudate) was taken for RNA extraction and preserved in RNA-Later (Ambion Inc., Austin, TX). Representative sections of this area were immersed in 10% formalin for histological studies. Additional brain tissue was taken from a coronal section of the occipital lobe in the striate area (control macaque nos.: 331, 392, 393; SIVE macaque nos.: 301, 321, 323, 330), midbrain (control macaque nos.: 298, 332, 357, 331; SIVE macaque nos.: 289, 301, 321, 323, 328), and a mid-sagittal section of cerebellum (control macaque nos.: 298, 332, 357, 331, 392, 393; SIVE macaque nos.: 289, 301, 321, 323, 328).
DNA Array
Total RNA was purified from samples using TRIzol Reagent (Invitrogen, Carlsbad, CA) following the manufacturer’s protocol, with an additional centrifugation step to remove unwanted cellular debris. RNA was then further purified using the RNeasy mini kit (Qiagen, Valencia, CA) and the quantity of total RNA was assessed by 260-nm UV absorption, with quality verified by gel electrophoresis and analysis of the ribosomal RNA bands. Total RNA was prepared to synthesize cDNA that was then used as a template to produce biotinylated cRNA (as described in the Gene Chip Expression Analysis Technical Manual, Version 5.0; Affymetrix, Santa Clara, CA). Affymetrix Test 2 chips were used to assess RNA quality by examining the 3′ to 5′ ratios for actin and glyceraldehyde-3-phosphate dehydrogenase (GAPDH). Fifteen μg of cRNA was prepared in a hybridization cocktail of 300 μl total volume, of which 200 μl was placed on an Affymetrix Human U95Av2 GeneChip, containing 12,625 independent probe sets to analyze gene expression. After hybridization this sample was returned to the original aliquot, which was then frozen. For the frontal lobe samples, a further 200 μl was sampled from the original cocktail and hybridized to a separate duplicate GeneChip within 30 days. Hybridization and subsequent washing and staining were performed using the Affymetrix Fluidics Station 400 following supplied protocols. Chips were then double stained and scanned according to basic Affymetrix protocol to create GeneChip image files that were converted to text-bases files using Microarray Suite 5.0 software (Affymetrix).
Earlier versions of the Affymetrix software gave empirical Average Difference values that could be negative and thus compromise statistical analysis. In this newer version each oligomer was assessed for signal intensity, and a mean Signal Value (SV) was obtained that assigns to the transcript a relative measure of abundance that is always a positive number. GeneSpring Expression Analysis Software 4.1 (Silicon Genetics, Redwood City, CA) was then used for statistical analysis of the SVs for each gene between the groups. Individual cases were classified for comparison as either control or SIVE. Cases were analyzed after normalization to center the data around 1. Next, significant differences in expression levels for the frontal lobe samples were determined to highlight only up-regulated genes as follows: 1) mean normalized SV of the SIVE group of at least 0.8 (to select for a significant level of expression of up-regulated genes, equivalent to a prenormalization SV of 200), 2) fold-change in mean normalized SV between SIVE and control of at least two-times higher, and 3) P < 0.01 using a nonparametric test (Wilcoxon-Mann-Whitney). As stated, these criteria highlight only significantly up-regulated genes. Discussion of down-regulated genes will be presented in a subsequent article. For the comparison of other brain regions, a single GeneChip analysis was performed from each sample, and the control and SIVE samples were grouped separately from each region and analyzed, using criteria 1 and 2 above, for the presence of probe sets that had been found to be up-regulated in the frontal lobe.
Immunohistochemistry and in Situ Hybridization
After identification of significantly up-regulated genes, this analysis was used for an immunohistochemical/in situ hybridization study of the location of proteins or transcripts corresponding to 16 of the up-regulated genes. In addition to the tissue from animals used in the array analysis, two more SIV-infected animals, that did not receive the CD8+ cell-depleting antibody but developed SIVE spontaneously in the course of simian AIDS, were used in the immunohistochemical studies for comparison with the SIV-infected monkeys given the CD8+ cell depleting regime. These animals were no. 188 (sacrificed at 308 days after inoculation) and no. 226 (sacrificed at 378 days after inoculation).
Formalin-fixed, paraffin-embedded sections were deparaffinized with xylene and hydrated in graded alcohols. Immunohistochemical staining followed a basic indirect protocol, using an antigen retrieval method where indicated (heating to 95°C in 0.01 mol/L citrate buffer for 45 minutes, then left for 20 minutes to steep). Antibodies and protocols used are indicated in Table 1 ▶ . The primary antibody was detected with the PicturePlus universal secondary antibody-horseradish peroxidase polymer reagent (Zymed, San Francisco, CA) and developed with the NovaRed chromogen (Vector Laboratories, Burlingame, CA), followed by a hematoxylin counterstain (Sigma-Aldrich, St. Louis, MO). Control slides included omission of the primary antibody and use of irrelevant primary antibodies.
Table 1.
Antibody Dilutions Used for Immunohistochemistry
| Antigen | Dilution | Antigen recovery | Antibody type | Source |
|---|---|---|---|---|
| Alpha-1 antichymotrypsin | 1:200 | None | Rabbit poly | Novacastra |
| Apolipoprotein D | 1:100 | Citrate | Mouse mono | Novacastra |
| C1q | 1:4 | None | Rabbit poly | BioGenex |
| CD163 | 1:100 | Citrate | Mouse mono | Novocastra |
| CD31 | 1:50 | Citrate | Mouse mono | Dako |
| CD37 | 1:300 | Citrate | Mouse mono | Novocastra |
| Cyclin D3 | 1:40 | Citrate | Mouse mono | Novocastra |
| GFAP | 1:500 | Citrate | Rabbit poly | Zymed |
| Glut5 | 1:200 | Citrate | Rabbit poly | Chemicon |
| HAM56 | 1:200 | Citrate | Mouse mono | Dako |
| HLA-DR (LN3) | 1:50 | Citrate | Mouse mono | Zymed |
| ISG15 | 1:250 | Citrate | Rabbit poly | Dr. E. Borden |
| LCA | 1:300 | Citrate | Mouse monos | Dako |
| STAT1 | 1:100 | Citrate | Mouse mono | Santa Cruz |
| TGase II (Ab-3) | 1:250 | Citrate | Mouse monos | Neomarkers |
| Vimentin | 1:100 | Citrate | Mouse mono | Novocastra |
| Von Willebrand Factor | 1:300 | None | Rabbit poly | Dako |
In situ hybridization was performed using probes for rhesus ISG12 and HCgp39, which were obtained by reverse transcriptase-polymerase chain reaction amplification using oligonucleotides derived from the human sequence. Molecularly cloned products were verified by DNA sequencing and used to construct 33P-labeled RNA probes (Stratagene, Cedar Creek, TX) with RNA bacteriophage promoters. Formalin-fixed, paraffin-embedded sections were prepared for immunohistochemistry as above, with heat-treatment in citrate buffer; after washes in 0.5× standard saline citrate, sections were incubated for 1 hour at 42 to 46°C in a prehybridization buffer (50% formamide, 0.3 mol/L NaCl, 20 mmol/L Tris, pH 8, 5 mmol/L ethylenediaminetetraacetic acid, 1× Denhardt’s solution, 10 mmol/L dithiothreitol, 10% dextran sulfate in diethyl pyrocarbonate-treated water) and subsequently hybridized in 3 × 10⁶ cpm radiolabeled probe in the same buffer at 42 to 46°C overnight. Controls included sense probes and omission of the probe. After hybridization, sections were washed and treated with RNase followed by an immunohistochemical staining with HAM56 antibody, performed as above except HistoMark Orange (KPL, Gaithersburg, MD) was used as the chromogen. The slides were then washed, dehydrated, vacuum-dried, and coated with LM1 emulsion (Amersham, Piscataway, NJ). The slides were then left in the dark for 40 days before developing (Kodak D19) and fixing (Kodak ‘Fixer’) (Eastman Kodak, Rochester, NY) followed by counterstaining with hematoxylin (Sigma-Aldrich), dehydrating, and mounting.
Image capture was performed with a Spot RT Color CCD camera with Spot RT software, version 3.4.2 for MacOS (Spot Diagnostic Instruments, Sterling Heights, MI) using a Leica Diaplan microscope (Leica Inc., Deerfield, IL). Figures were assembled with Adobe Photoshop, version 6.0 for MacOS (Adobe Systems Inc., San Jose, CA).
Results
Array Analysis of SIV-Induced CNS Transcripts
Statistical analysis revealed that 114 probe sets were significantly elevated in the frontal lobe of six monkeys with SIVE compared to six uninfected controls. These 114 probe sets corresponded to 98 independent genes (two or more probe sets were up-regulated for 12 genes). The mean SVs (plus SD) and fold change after normalization, accession numbers, probe sets, and gene names are listed in Table 2 ▶ . As SIVE neuropathology was varied among the cases analysis was also performed to compare controls with only the SIVE cases that showed MNGCs; there were no significant differences between these cases and the comparison including those without MNGCs. Initially, the genes have been categorized based on the described biological properties of their products, but we note that many gene products can function in more than one category. The roles of several genes in these categories are detailed below.
Table 2.
Genes Up-Regulated in the Frontal Lobe of SIVE Cases Compared to Control Cases
| Control | SIVE | Fold change | Probe set | Accession number | Gene name | OL | MB | CB | ||||||||
|---|---|---|---|---|---|---|---|---|---|---|---|---|---|---|---|---|
| Monocyte migration | ||||||||||||||||
| 0.50 (0.27) | 1.07 (0.33) | 2.1 | 37398_at | AA100961 | CD31/PECAM | * | ||||||||||
| 2.01 (1.36) | 5.21 (1.56) | 2.6 | 41138_at | M16279 | CD99/MIC2 | |||||||||||
| 0.87 (0.22) | 1.94 (0.56) | 2.2 | 31719_at | X02761 | Fibronectin | * | * | |||||||||
| 0.50 (0.22) | 1.45 (1.02) | 2.9 | 31720_s_at | M10905 | Fibronectin | * | ||||||||||
| 0.35 (0.37) | 1.40 (0.61) | 3.9 | 311_s_at | HG3044-HT3742 | Fibronectin | * | ||||||||||
| 0.39 (0.19) | 0.89 (0.52) | 2.3 | 32526_at | AA149644 | JAM3 | |||||||||||
| 2.30 (0.71) | 7.78 (4.34) | 3.4 | 2092_s_at | J04765 | Osteopontin | * | ||||||||||
| 15.47 (4.30) | 40.95 (18.04) | 2.7 | 34342_s_at | AF052124 | Osteopontin | * | ||||||||||
| 0.25 (0.12) | 0.82 (0.64) | 3.2 | 38138_at | D38583 | S100A11/Calgizzarin | * | ||||||||||
| 0.51 (0.42) | 1.97 (0.66) | 3.8 | 38404_at | M55153 | Transglutaminase-2 | * | * | * | ||||||||
| Inflammation and disease | ||||||||||||||||
| 0.31 (0.19) | 1.23 (0.49) | 4.0 | 36781_at | X01683 | Alpha1-antitrypsin | * | * | |||||||||
| 0.55 (0.36) | 1.43 (0.45) | 2.6 | 33825_at | X68733 | Alpha 1-antichymotrypsin | * | * | |||||||||
| 6.03 (1.83) | 14.39 (3.66) | 2.4 | 32242_at | AL038340 | Alpha B-crystallin | * | ||||||||||
| 17.25 (6.45) | 36.63 (8.66) | 2.1 | 32243_g_at | AL038340 | Alpha B-crystallin | |||||||||||
| 0.46 (0.40) | 1.79 (1.37) | 3.9 | 36681_at | J02611 | Apolipoprotein D | * | * | |||||||||
| 0.57 (0.40) | 1.24 (0.67) | 2.2 | 39775_at | X54486 | C1-inhibitor | * | ||||||||||
| 0.41 (0.28) | 3.66 (0.91) | 9.0 | 38796_at | X03084 | C1q-B | * | * | |||||||||
| 0.72 (0.37) | 3.88 (1.32) | 5.4 | 40766_at | U24578 | C4a | * | * | |||||||||
| 0.58 (0.34) | 1.42 (0.31) | 2.5 | 34362_at | M55531 | Glut5 | * | * | |||||||||
| 0.26 (0.24) | 1.24 (0.51) | 4.7 | 36197_at | Y08374 | HCgp39/YKL-40 | * | * | |||||||||
| 0.97 (0.32) | 2.59 (2.44) | 2.7 | 33273_f_at | X57809 | Heat shock 70kD protein 1A | * | ||||||||||
| 0.43 (0.28) | 1.43 (0.69) | 3.4 | 36804_at | M34455 | Indoleamine 2,3-dioxygenase | * | * | * | ||||||||
| 0.32 (0.27) | 2.69 (0.99) | 8.3 | 37754_at | L13210 | Mac-2 binding protein | * | * | * | ||||||||
| 0.45 (0.36) | 0.96 (0.5) | 2.1 | 35426_at | AC004410 | SPPL2b/PSL1 | |||||||||||
| 0.17 (0.05) | 1.88 (2.03) | 11.0 | 1693_s_at | D11139 | TIMP1 | * | ||||||||||
| 0.63 (0.29) | 1.27 (0.20) | 2.0 | 33452_at | M15518 | Tissue plasminogen activator | * | ||||||||||
| 0.21 (0.17) | 0.87 (0.31) | 4.2 | 607_s_at | M10321 | von Willebrand factor | * | ||||||||||
| Antigen presentation | ||||||||||||||||
| 0.65 (0.36) | 2.51 (0.98) | 3.9 | 34644_at | AB021288 | Beta 2-microglobulin | * | * | * | ||||||||
| 1.18 (0.57) | 6.59 (3.19) | 5.6 | 201_s_at | S82297 | Beta 2-microglobulin | * | * | * | ||||||||
| 2.33 (1.06) | 9.71 (3.59) | 4.2 | 428_s_at | V00567 | Beta 2-microglobulin | * | * | * | ||||||||
| 0.70 (0.60) | 1.64 (0.32) | 2.4 | 38363_at | W60864 | DAP12 | |||||||||||
| 1.21 (0.33) | 3.32 (0.80) | 2.7 | 41237_at | D32129 | HLA-A | * | * | |||||||||
| 2.02 (0.75) | 15.16 (4.51) | 7.5 | 37383_f_at | X58536 | HLA-C | * | * | |||||||||
| 0.38 (0.19) | 1.59 (0.54) | 4.2 | 37344_at | X62744 | HLA-DMα | * | * | |||||||||
| 0.48 (0.24) | 2.14 (1.41) | 4.4 | 41723_s_at | M32578 | HLA-DRβ1 | * | * | |||||||||
| 1.82 (0.33) | 8.15 (4.40) | 4.5 | 32321_at | X56841 | HLA-E | * | * | |||||||||
| 1.76 (0.46) | 6.28 (1.61) | 3.6 | 37421_f_at | AL022723 | HLA-F | * | * | |||||||||
| 2.44 (0.68) | 8.28 (2.54) | 3.4 | 40369_f_at | AL022723 | HLA-F | * | * | |||||||||
| 0.98 (0.38) | 5.57 (1.25) | 5.7 | 40370_f_at | M90683 | HLA-G | * | * | |||||||||
| 0.87 (0.34) | 4.01 (1.55) | 4.6 | 35016_at | M13560 | Ia-associated invariant γ-chain/CD74 | * | * | |||||||||
| 1.13 (0.22) | 2.96 (0.70) | 2.6 | 36600_at | L07633 | PA28α | * | * | |||||||||
| 1.65 (0.44) | 4.47 (1.08) | 2.7 | 41171_at | D45248 | PA28β | * | * | * | ||||||||
| 1.82 (0.40) | 4.06 (1.38) | 2.2 | 1184_at | D45248 | PA28β | * | * | |||||||||
| 0.07 (0.02) | 0.86 (0.65) | 12.0 | 41184_s_at | X87344 | PSMB8/LMP7 | * | ||||||||||
| 0.99 (0.36) | 5.06 (2.36) | 5.1 | 38287_at | AA808961 | PSMB9/LMP2 | * | * | * | ||||||||
| Lysosomal | ||||||||||||||||
| 0.86 (0.65) | 2.16 (1.23) | 2.5 | 39062_at | AL008726 | Cathepsin A | * | ||||||||||
| 0.73 (0.30) | 1.55 (0.56) | 2.1 | 37021_at | X16832 | Cathepsin H | * | ||||||||||
| 0.56 (0.40) | 1.20 (0.20) | 2.2 | 32824_at | AF039704 | CLN2 | * | ||||||||||
| 0.46 (0.33) | 1.67 (0.91) | 3.6 | 39728_at | J03909 | GILT/IP30 | * | * | * | ||||||||
| 0.26 (0.16) | 1.20 (0.73) | 4.6 | 925_at | J03909 | GILT/IP30 | * | * | |||||||||
| 1.08 (0.36) | 3.18 (0.68) | 2.9 | 37759_at | U51240 | LAPTM-5 | * | * | |||||||||
| 0.62 (0.46) | 1.38 (0.31) | 2.2 | 39130_at | AB018313 | Vam6/Vps39-like | |||||||||||
| Interferon inducible | ||||||||||||||||
| 0.20 (0.16) | 1.64 (0.98) | 8.4 | 1358_s_at | U22970 | G1P3 | * | * | |||||||||
| 0.56 (0.21) | 4.40 (1.52) | 7.8 | 37641_at | D28915 | IFI44 | * | * | * | ||||||||
| 0.94 (0.15) | 5.58 (2.43) | 5.9 | 32814_at | M24594 | IFIT1 | * | * | * | ||||||||
| 1.47 (0.43) | 18.33 (10.55) | 12.0 | 915_at | M24594 | IFIT1 | * | * | * | ||||||||
| 0.41 (0.24) | 2.87 (2.26) | 7.0 | 908_at | M14660 | IFIT2 | * | * | |||||||||
| 0.28 (0.20) | 1.22 (0.58) | 4.4 | 909_g_at | M14660 | IFIT2 | * | * | |||||||||
| 0.29 (0.15) | 0.94 (0.18) | 3.3 | 38584_at | AF026939 | IFIT4 | * | * | * | ||||||||
| 0.38 (0.19) | 0.84 (0.55) | 2.2 | 675_at | J04164 | IFITM1 | * | * | * | ||||||||
| 5.51 (2.28) | 61.23 (18.97) | 11.0 | 676_g_at | J04164 | IFITM1 | * | * | |||||||||
| 3.66 (2.34) | 35.11 (18.30) | 9.6 | 41745_at | X57352 | IFITM3 | * | * | |||||||||
| 0.38 (0.30) | 5.79 (2.54) | 15.0 | 425_at | X67325 | ISG12 | * | * | * | ||||||||
| 1.05 (0.35) | 10.01 (7.22) | 9.6 | 1107_s_at | M13755 | ISG15 | * | * | * | ||||||||
| 0.25 (0.19) | 0.92 (0.97) | 3.7 | 38432_at | AA203213 | ISG15 | * | * | |||||||||
| (Table continues) | ||||||||||||||||
Monocyte Migration
HIV and SIV likely make their entrance into the CNS carried by infiltrating macrophages. Because these cells are of prime importance in the pathogenic effects leading to CNS dysfunction, the up-regulated genes involved with cell migration across the blood-brain barrier are grouped together here.
The migration of monocytes across endothelial junctions involves the sequential expression of CD31/platelet-endothelial cell adhesion molecule (PECAM) and CD99/MIC2. 10 Also involved is the macrophage scavenger receptor CD163, which is important in monocyte adherence to the vascular endothelium. 11 Tissue transglutaminase (tTG), an enzyme involved in the cross-linking of glutamine and lysine, serves as an adhesion and migration receptor for the extracellular matrix protein fibronectin, promoting the invasion of monocytes into tissues. 12 Osteopontin, a protein also involved in immune cell differentiation and activation, is a potent chemoattractant for monocytes, 13 thus increases in this molecule may also promote monocyte entry.
Inflammation and Disease
The genes in this category are involved in inflammatory and neurodegenerative disorders of the CNS including HIVE/SIVE. Indoleamine 2,3-dioxygenase (IDO) is an interferon (IFN)-inducible enzyme in the conversion pathway of tryptophan to the neurotoxin quinolinic acid, present in the brains of HIV-infected humans and SIV-infected monkeys. 14 The serine protease tissue-type plasminogen activator (tPA) is a crucial component of excitotoxin-induced microglial activation and neuronal degeneration in the brain. 15 Increases in tPA in conjunction with matrix metalloproteinases can lead to degradation of the extracellular matrix unless the latter is blocked by the tissue inhibitors of metalloproteinases (TIMPs) such as TIMP1. SPPL2b/PSL1 (presenilin-like protein 1) is an intramembrane protease similar to the presenilins, thought to be crucial in Alzheimer’s disease pathogenesis. 16 Levels of apolipoprotein D (ApoD), a transporter of cholesterol and arachidonic acid, are increased in the brains of those with stroke, Alzheimer’s disease, and motor neuron disease. 17,18 Up-regulation of von Willebrand factor (vWf) indicates persistent activation of endothelial cells after injury. This factor is also released into plasmaand elevated in correspondence with HIV progression and viral load. 19 Also in this category are GLUT5 and HCgp39, which are expressed in activated microglia and macrophages, respectively.
Three inflammation-related serine proteinase inhibitors were found to be up-regulated: C1 inhibitor (C1I); α1-anti-trypsin and α1-anti-chymotrypsin (ACT). The latter two are major components of amyloid plaques in brains afflicted with Alzheimer’s disease 20 along with complement component C1q. 21 Both C1I and ACT are tTG substrates (see Monocyte Migration), a link that connects the expression of these inflammatory components to the cell migration process.
Antigen Presentation
Among the largest categories of genes described here are those involved in antigen presentation including both the major histocompatibility complex (MHC) class I and class II pathways for endogenous and exogenous peptide presentation to CD8+ and CD4+ T cells. Class I heavy chain molecules are represented in this study by both the ubiquitously expressed classical HLAs A and C, and the more restricted nonclassical HLAs F and G. Heavy chains associate with the constant light chain molecule β2-microglobulin, increases of which in cerebrospinal fluid correspond to the level of neuroAIDS. 22 Class II MHC molecules include HLA-DRβ1 and Ia-associated γ-chain/CD74. Accessory genes involved in antigen processing, such as those involved in proteosomal protein degradation, including PA28α and -β, and PSMB8 and PSMB9, are also induced in SIVE.
Lysosomal Proteins
Lysosomes break down intracellular molecules crucial for multiple cellular functions including antigen presentation. Interestingly, many of the up-regulated genes are lysosome-associated molecules. The association of increased lysosomal hydrolytic enzyme activity with HIV CNS infection has been reported; 23 we similarly find proteases such as cathepsin A and H to be up-regulated. Furthermore, other lysosomal proteins, such as LAPTM5, a factor in lysosomal membrane dynamics that is associated with microglia activation after neuronal apoptosis, 24 are up-regulated, indicating additional lysosomal processes that may be involved in escalating the damage of neuroAIDS.
Interferon-Inducible Genes/Antiviral/Transcriptional Regulation
More then 300 IFN-inducible genes have been identified and the proteins encoded by these genes play a large part in the antiviral response. Induction of many of the IFN-inducible genes, including MxA, adenosine deaminase, and 2-5 oligoadenylate synthase (2-5OA) can lead to actions protective against many viruses including, for 2-5OA, protection from HIV infection. 25
Transcription of these genes after stimulation of IFNα/β or γ receptors leads to the phosphorylation of signal transducer and activator of transcription (STAT)1α/β homodimers or of heterodimers in association with STAT2. On activation, the STAT molecules, which can also complex with p48protein/ISGF3γ, are translocated to the nucleus to stimulate transcription of genes including Mac- binding protein, ISG12, ISG15, and GIP3.
A transcriptional activator found up-regulated in activated and differentiated macrophages is nuclear factor interleukin 6 (NF-IL6), which is essential for HIV-1 replication in these cells. 26 This molecule is also involved in the gene expression of several inflammatory cytokines in conjunction with STAT3.
Cell Cycle and Growth, Differentiation, and Signaling
Cell proliferation, such as the astro- and microgliosis seen in SIVE/HIVE cases, involves up-regulation of cell-cycle elements, along with cell growth and differentiation. Cell-cycle progression relies on the effects of cyclins, such as cyclin D3, on the activity of cyclin-dependent protein kinases to enable the transcription of genes required in S phase of the cell cycle.
Epithelin/granulin peptides are growth factors for dividing cells, as is the cytokine midkine, which is involved in neuronal development, growth, and maintenance. Activation of fibroblast growth factor receptor-1, or CD81/target of anti-proliferative antibody 1 (TAPA1), can also increase cell proliferation rates, especially in angiogenesis and astrocytosis.
Cytoskeleton
Cell changes in neuroAIDS can include alterations in cell size and shape. Examples are the increased expression of intermediate filaments including, in astrocytes, vimentin which can alter cell shape and process length by association with plectin at the cell membrane. Plectin also binds GFAP, actin, and integrin-β4. Additionally, vimentin has a close relationship to CapG/macrophage capping protein, moesin, and actin, with the assembly of the latter involving the GTPase RhoG, a participant in neurite outgrowth.
Immune System
Some of the up-regulated genes are important in cells of the immune system. Of note, CapG (see also Cytoskeleton) accounts for 1% of the total protein in macrophages. CD14 and CD163 are specific markers for these cells and are more highly expressed in activated macrophages during inflammatory reactions, as is human cartilage glycoprotein 39 (HCgp39). Glut5, a fructose transporter with unknown CNS function, is expressed in restingand up-regulated microglia. 27 Moreover, the enzyme ribonuclease K6 resides in monocytes and neutrophils.
Other Brain Regions
Tissue RNA was also available from three other brain areas: the occipital lobe, the midbrain, and cerebellum from selected animals (at least four SIVE and three controls for each location). GeneChip analysis was performed to examine the expression levels of the genes found to be up-regulated in the frontal lobe samples. As indicated in Table 2 ▶ , 66 of the 98 genes were also up-regulated in the occipital lobe, with 68 in the midbrain and 19 in the cerebellum. All brain regions examined had genes that were predominant in the Interferon Inducible and Antigen Presentation categories. The cerebellum showed little up-regulation of genes in the other categories, suggesting that, in this model, there is far less involvement of this part of the brain. Interestingly there was little representation of the frontal lobe up-regulated genes from the Cytoskeleton and Growth and Differentiation categories in the other three brain regions, suggesting that cellular reorganization is a higher factor in the frontal lobe.
Infiltrating Macrophages and Parenchymal Microglia Express Many of the Up-Regulated Genes
Tissue samples taken for our RNA analysis contain the whole array of CNS cells such as neurons, oligodendrocytes, astrocytes, microglia, and endothelial cells, as well as cells found within lesions associated with SIV infection, such as infiltrating macrophages and lymphoid cells, and MNGCs. Certainly, analyzing gene array provides an overview of up-regulated genes in whole tissue, but of equal importance is pinpointing the specific locationsof these genes’ products. Furthermore, up-regulation ofRNA may not necessarily correspond to that of the protein product. To assess up-regulation of protein, and to gain insight into the cellular origin of the up-regulated genes, serial sections of frontal lobe from SIVE and uninfected control monkeys were immunostained with antibodies corresponding to 14 of the up-regulated genes, chosen to represent the functional groups described above. Subsequent immunohistochemical staining for GFAP (astrocytes), HAM56 (macrophages and activated microglia), and LCA (lymphocytes) then aided identification of affected cells. Two additional genes, HCgp39 and ISG12, were examined at the RNA level by in situ hybridization.
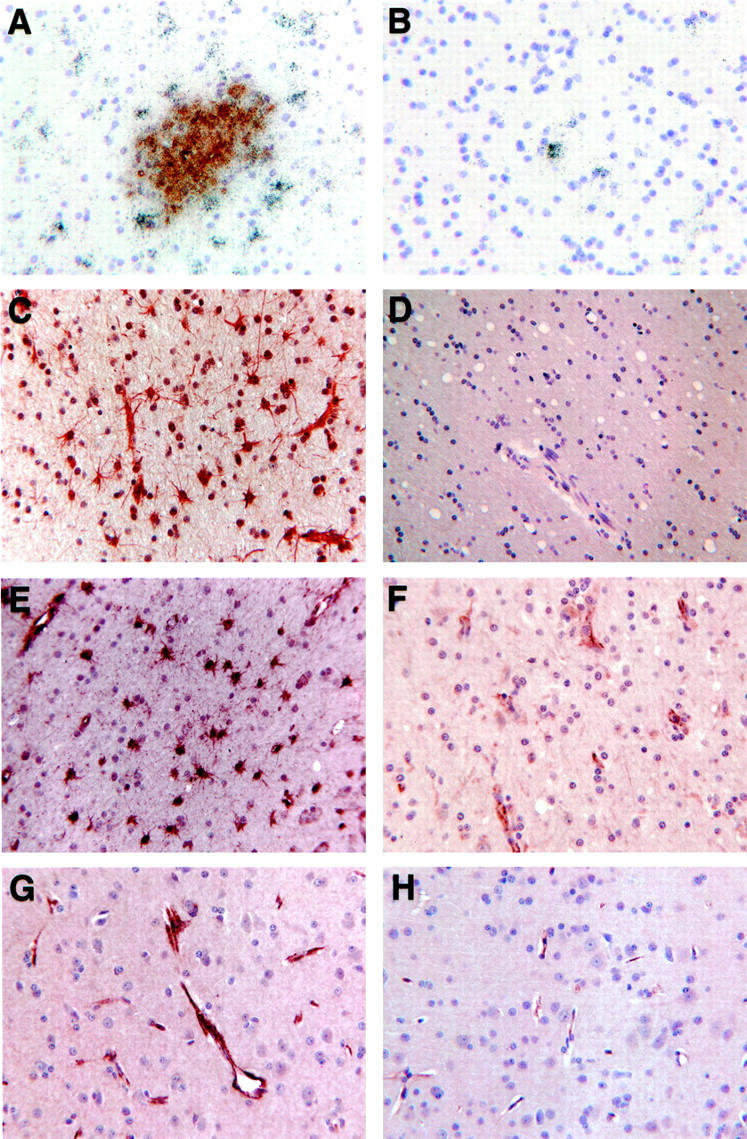
Most of the immunoreactivity and in situ hybridization signals occurred within the SIVE lesions, including perivascular cuffs and microglia/macrophage nodules. Such lesions were predominately composed of HAM56-positive microglia/macrophages (Figure 1A) ▶ with LCA staining of three to four lymphocytes (Figure 1B) ▶ , and with GFAP-reactive astrocytes surrounding, but rarely infiltrating, many of the nodular lesions (Figure 1C) ▶ . Within the lesions, staining was intense for CD163 (Figure 1D) ▶ , Glut5 (Figure 1E) ▶ , HLA-DR (Figure 1F) ▶ , tTG (Figure 1G) ▶ , and vimentin (Figure 1H) ▶ . HCgp39 (see below, Figure 3A ▶ ) and ISG12 in situ hybridization revealed signal over nodules of macrophages. Immunohistochemistry further revealed that ACT showed strong localization to large cells where foamy macrophages appeared (Figure 1I) ▶ . STAT1 and C1q (Figure 1J) ▶ were also found in these nodules, but to a lesser degree. ApoD (Figure 1K) ▶ , CD37 (Figure 1L) ▶ , and cyclin D3 were each found in only two or three distinct cells in lesions. MNGCs were not uniformly stained with these antibodies. HLA-DR (Figure 1M) ▶ , tTG (see Figure 1G ▶ ), vimentin (Figure 1N) ▶ , and HAM56 produced a very dark reaction product in MNGCs (including, with vimentin, an even darker central area); whereas C1q, CD163, Glut5, and ACT (Figure 1O) ▶ showed much lighter staining.
Figure 1.

Immunohistochemical staining of cellular infiltrates in SIVE revealing HAM56-positive microglia/macrophages in nodule (A) and LCA-positive lymphocytes contributing to a perivascular infiltrate (B). C: GFAP-positive astrocytes surround a nodule. Immunoreactivity is also found for CD163 (D), Glut5 (E), HLA-DR (F), tissue transglutaminase (tTG) (G), vimentin (H), α1-anti-chymotrypsin (ACT) (I), C1q (J), apolipoprotein D (K), and CD37 (L). Reactivity of MNGCs varies, as shown for HLA-DR (M), vimentin (N), and ACT (O). Asterisk indicates MNGCs.
Figure 3.
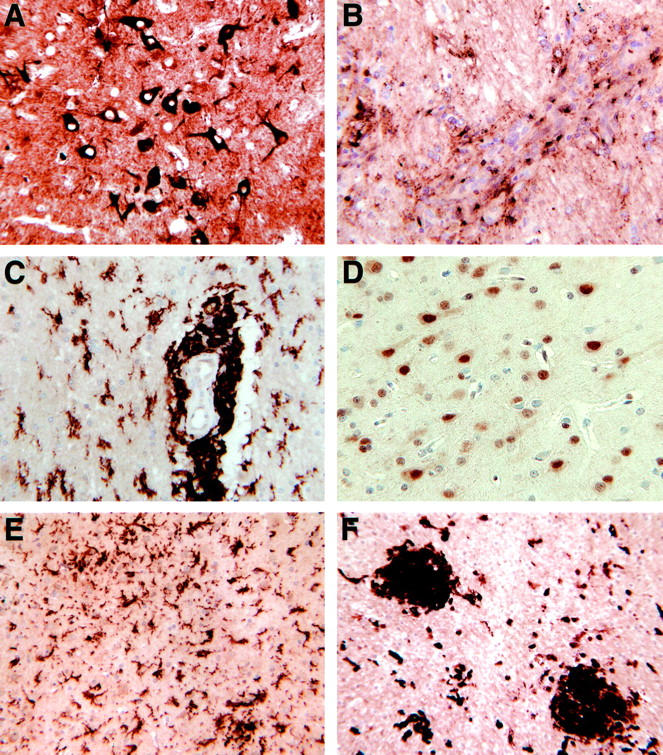
A and B: Glial reactivity for HCgp39 (in situ hybridization, combined with immunohistochemistry for HAM56 (A, SIVE; B, control). C and D: Immunohistochemical staining for STAT1 (C, SIVE; D, control) and ISG15 (E, SIVE). Endothelial reactivity in immunohistochemical staining for CD31 in SIVE (F) and von Willebrand factor (vWf) in SIVE (G) and control (H) brains.
In parenchymal microglia from the SIVE cases, CD163 (Figure 2A ▶ , see also Figure 1D ▶ ) was induced, and Glut5 (Figure 2C ▶ , see also Figure 1E ▶ ) clearly increased compared to amounts in uninfected controls (Figure 2, B and D ▶ , respectively). HLA-DR (see Figure 1, F and M ▶ ) occupied white matter microglia in concordance with HAM56 (Figure 2E) ▶ , but neither of these was identified in parenchymal microglia of uninfected controls (eg, Figure 2F ▶ ; HLA-DR). Less frequently, microglia expressing ACT, C1q, STAT1, and tTG (Figure 2G) ▶ could be found, predominantly around lesions. Control tissue had no Clq or STAT1 at all, and tTG was found only along the endothelium (Figure 2H) ▶ .
Figure 2.
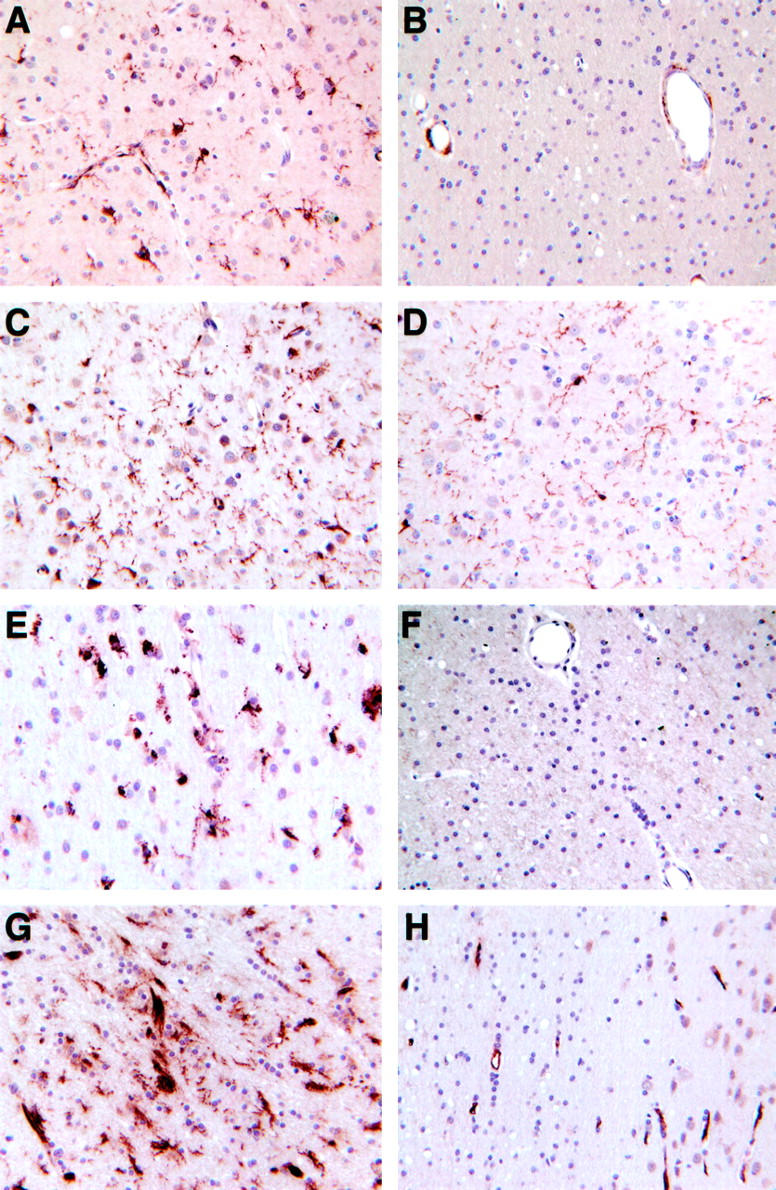
Immunohistochemical staining of parenchymal microglia in SIV-induced CNS pathology and control brains, respectively, using CD163 (A, B), Glut5 (C, D), HAM56/HLA-DR (E, F), and tTG (G, H).
Neurons and Other Native CNS Cells from SIV-Infected Animals Express a Wide Array of Novel Proteins
In addition to microglia, other native cells of the CNS also displayed induction or increased expression of markers. In SIV-infected brains, the HCgp39 signal appeared in white matter (Figure 3A) ▶ , in the vicinity of lesions and occasionally in patches along the white/gray matter junction; in controls, only a few isolated white matter cells contained HCgp39 (Figure 3B) ▶ . Although HCgp39 was found in macrophages in the lesions, the strongest signal was predominately found in cells that did not react with HAM56. Similarly ISG12 was also found in cells that did not stain with HAM56 (data not shown). In both cases these cells are presumably astrocytes but staining for GFAP was not performed in conjunction with in situ hybridization. Cells with clear astrocytic morphology expressed tTG, vimentin (Figures 1, H and N) ▶ , ACT, STAT1 (Figure 3C) ▶ , and ISG15 (Figure 3E) ▶ . Of these, ACT stained only occasional astrocyte patches in control tissue, whereas neither ISG15 nor STAT1 (Figure 3D) ▶ reacted at all with astrocytes in controls.
Endothelial cells in the brains of animals with SIVE expressed vimentin (Figure 1N) ▶ , tTG (Figure 2G) ▶ , ACT, ApoD, and STAT1 (Figure 3C) ▶ throughout the vascular endothelium in the setting of SIV-induced CNS pathology. Expression of vWf was much stronger (Figure 3G) ▶ than in the controls (Figure 3H) ▶ , and similarly a moderate level of CD31 (Figure 3F) ▶ was found in the SIVE cases compared to only faint staining in control cases.
The cytoplasm of distinct swaths of neurons located in cortical layers 4 to 6 were notably stained with ACT (Figure 4A) ▶ , whereas cyclin D3 (Figure 4C) ▶ was highly expressed in the nuclei of numerous neurons in cortical layers 3 to 6, and tTG (Figure 4E) ▶ was also encountered in many neuronal nuclei. This pattern occurred in all neurons of some areas but, elsewhere, only those in distinct layers or occasional cells. STAT1 stained unique, individual neurons, mostly classed as large pyramidal cells (Figure 4F) ▶ . None of these antibodies stained neurons in control tissue (ACT, Figure 4B ▶ ; cyclin D3, Figure 4D ▶ ; tTG, Figure 2H ▶ ).
Figure 4.
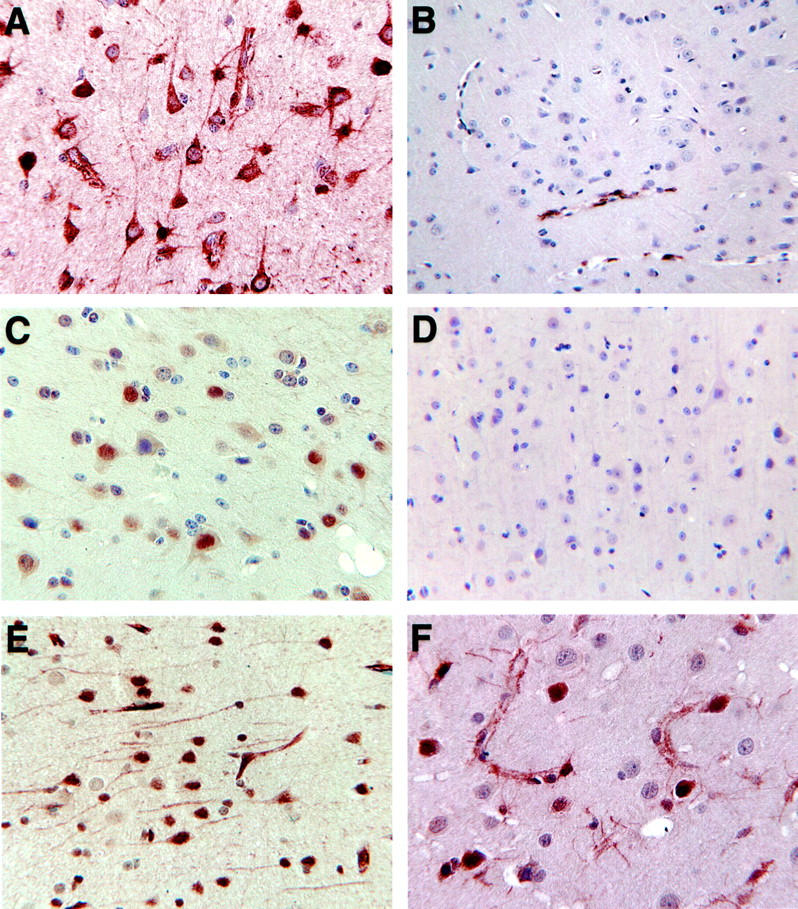
Immunohistochemical reactivity in neurons for ACT (A, SIVE, also showing astrocyte reactivity; B, control), cyclin D3 (C, SIVE; D, control), tTG in SIVE (E), and STAT1 in SIVE (F).
In addition to examining brains from uninfected, untreated monkeys, two additional sets of controls were performed. First, two of the uninfected animals received the CD8+ cell-depletion protocol. These were indistinguishable from the other four controls as to expression of the identified genes on the array analysis (data not shown); they did not exhibit neuropathological changes at necropsy, and their immunohistochemical analysis was consistent with that of the other controls (not shown). Second, brain sections from two animals that developed SIVE after a natural course of SIV infection (no CD8+ cell depletion; development of simian AIDS at an average of 11 months after infection) were examined by immunohistochemical staining for all of the protein markers. For all, the pattern of staining was consistent with that seen in animals with rapid SIVE induced by the CD8 depletion protocol (eg, Figure 5; A to F ▶ ).
Figure 5.
Immunohistochemical staining of brains from SIV-infected animals developing spontaneous SIVE. A, ACT in neurons; B, ApoD in perivascular and infiltrating cells; C, CD163 in perivascular macrophages and parenchymal microglia; D, cyclin D3 in neurons; E, Glut5 in parenchymal microglia; and F, tTG in nodules and infiltrating and/or parenchymal cells.
Discussion
Microarray analysis was used to investigate mRNA abundance in the frontal lobes of rhesus macaques with SIVE compared to that in uninfected monkeys. Statistical analysis revealed 98 up-regulated genes, the majority of which have never before been described in SIVE cases. Many of these were confirmed and localized to specific cell types within the brain at the protein and RNA level by the techniques of immunohistochemistry and in situ hybridization. As our results show, we identified an ensemble of genes and proteins up-regulated in association with SIVE and classified them into categories that reflect the following pathogenic processes thought responsible for neuroAIDS: monocyte entry into the brain; production of neurotoxic effectors; transcription factors that alter CNS gene expression; and signature markers of activated astrocytes, endothelial cells, macrophages, and microglia. Furthermore, finding induction of genes and their protein products within cortical neurons points to specific neuronal responses to SIVE, including those linked to apoptotic pathways. Although this technology has been applied to several other CNS disorders including multiple sclerosis, schizophrenia, and brain tumors, this is the first investigation of CNS disease induced by immunodeficiency virus infection.
NeuroAIDS is thought to develop after increased CNS invasion by infected and activated macrophages which, in turn, leads to up-regulation of resident microglia as well as of astrocytes, leading to damage in the CNS environment causing neuronal injury and loss. One of the key histological and pathogenic features of neuroAIDS is increased monocyte entry into the brain, and we found a number of genes in the SIVE cases connected to this process. Migration of monocytes through endothelial cells is dependent on both cell types expressing CD31 and CD99; and CD99 itself plays a crucial role in monocyte diapedesis, 10 the transendothelial migration in which the monocyte crosses the blood-brain barrier and becomes a brain macrophage. CD99 is also implicated in cell aggregation 28 and thus may be involved both in the recruitment of monocytes to, and formation of, macrophage/microglia nodules in SIVE/HIVE. Monocyte migration is also aided by tissue transglutaminase (tTG), 12 which we found prominently expressed on endothelial cells as well as on macrophages/microglia. Osteopontin is a multifunctional molecule with potent chemotactic and haptotactic actions on monocytes 13,29 and can also contribute to monocyte recruitment and CNS pathology. Interestingly, transcript sequencing from human multiple sclerosis plaques revealed abundant transcripts for osteopontin, and microarray analysis of spinal cord RNA from rats with experimental autoimmune encephalomyelitis (EAE), a mouse model for multiple sclerosis, revealed increased levels of osteopontin. 30 Furthermore, microarray analysis of brain RNA from mouse models of Huntington’s disease and from patients with Huntington’s disease also revealed increased levels of osteopontin. 31 In addition to its effects on monocytes, pleiotropic osteopontin may play additional roles in these CNS inflammatory and degenerative diseases.
The enhanced expression of these genes and proteins demonstrated here reinforces theories of damage occurring to the CNS after changes to the blood-brain barrier and a related surge of monocyte entry. In SIV- and HIV-induced CNS disease, analysis of the factors promoting monocyte migration has predominantly focused on the ICAM-1 and VCAM adhesion molecules and MCP-1, RANTES, and IP-10 chemokines, however these may be insufficient to explain macrophage accumulation in the CNS in neuroAIDS. 32 We now present CD99, tTG, and osteopontin as new candidate effectors in the monocyte accumulation found in SIV- and HIV-induced CNS disease. These molecules and the mechanisms through which they act can provide invaluable guides for therapy that aims at arresting monocyte migration into the brain and decreasing CNS inflammation.
Cells of the macrophage lineage are key to the pathogenesis of neuroAIDS as this condition correlates closely with the degree of microglia/macrophage activation. 1 Neuronal dysfunction and loss in patients with AIDS has been attributed to the increased release of potentially toxic factors from the large number of infiltrating macrophages as well as activated microglia and astrocytes. Activated microglia in the white matter were notable here for expression of HLA-DR, CD163, and Glut5. Although the function of Glut5 in the CNS is unknown, as it has previously only been characterized as a fructose transporter, CD163 receptor activation is involved in the secretion of IL1β, IL6, and GM-CSF, increases of which occur in the brains of HIV+ patients and have been linked to pathological mechanisms. 33,34
We have also observed the increased expression of Glut5 and CD163 associated with ramified, gray matter microglia. This outcome denotes a much more widespread up-regulation of resident microglia than previously thought, in fact extending beyond those surrounding infected cells. This generalized spread could contribute to the more subtle neuronal damage, such as dendritic and synaptic changes, in SIV-infected animals and HIV-infected patients. Considering their ability to stain such a diverse microglial population, CD163 and especially Glut5 may be more sensitive markers than the commonly used HLA-DR and HAM56 for examining microglia activation in diverse clinical diseases.
Interestingly, microarray analysis of genes induced by exposure of monocyte-derived macrophages to the HIV gp120 surface protein did not produce similar genes to those found in our study. 35 This implies that direct effects of gp120 on cells of the monocyte lineage in the brain is not sufficient to induce the pathological cascade resulting in neuroAIDS. Furthermore, although isolating and analyzing individual components of a response is an invaluable part of pathogenic assessment, the interactions between these parts can be more complex than the sum, and studies in the brain and other organs can necessitate the use of tissue containing all of the interacting components.
Astrogliosis can also accompany neuroAIDS, and many of the genes identified here can be linked to this process, including changes in astrocyte shape and activation state. Astrocytes in the vicinity of lesions were shown to express Clq, tTG, vimentin, and HCgp39; while α1-anti-chymotrypsin (ACT), STAT1, and ISG15 also stained a more diffuse set of astrocytes. ACT has a role in many processes including regulation of inflammation, apoptosis, complement activation, and viral pathogenesis. 36 Many reports cite astrocytes as the main ACT-expressing cell after any sort of CNS inflammation. ACT is also expressed in β-APP-containing plaques in brains of patients with Alzheimer’s disease, 37 and reciprocally β-APP has been found to be present in HIVE-associated lesions, 38 although the characteristic Alzheimer’s plaques are not present in HIV-induced dementia.
Another significant finding in astrocytes of SIV-infected brains is STAT1, which is not only up-regulated by IFNs 39 but also acts as a signal transducer for these cytokines, leading to the up-regulation of many IFN-inducible genes such as ISG15 and others found in this study. Many of these have anti-viral activity, both for the well-known molecules like 2-5OA and less characterized ones including ISG12 investigated here, which has been recently shown to be protective in lethal mouse Sinbis virus encephalitis. 40 Similar up-regulation of IFN-induced genes have been found in microarray analyses of other viral infections including hepatitis C virus infection of the chimpanzee liver, 41 human cytomegalovirus infection of fibroblasts, 42 and hantavirus infection of endothelial cells. 43
The CNS function of some of these up-regulated genes/proteins can be linked to pathogenic processes. For example tTG is known to be involved in apoptosis 44 and was previously reported to be highly up-regulated in MNGCs and lesions in HIVE. 45 An intriguing finding was the up-regulation of SPPL2b/PSL1 (presenilin-like protein 1). This is a member of the signal peptide peptidase family of intramembrane proteases 16 that is similar to the presenilins, thought to be crucial in Alzheimer’s disease pathogenesis. The product of another gene, VDUP1/TBP-2 (thioredoxin-binding protein-2) lowers the thiol-reducing activity and level of expression of thioredoxin. 46 This can lead to an accumulation of reactive oxygen species and resultant oxidative stress damage, including induction of apoptosis. 47 Thus these comprise other candidate mechanisms of neuronal damage in neuroAIDS.
The induction of another inflammatory protein, indoleamine 2,3-dioxygenase (IDO), is a critical step leading to production of the excitatory neurotoxin quinolinic acid, the presence of which in the CNS correlates with the severity of CNS dysfunction and cerebral volume loss resulting from HIV infection. 14,48 We have recently confirmed the strong up-regulation of IDO mRNA in these SIV-infected brains by real-time reverse transcriptase-polymerase chain reaction and found that IDO is expressed by macrophages within nodules. 49 An additional likely mediator of CNS damage is tissue plasminogen activator (tPA). Although best characterized for its lysis of blood clots, tPA’s release from neurons and microglia leads to microglial activation, and both excitotoxin-induced seizures and neuronal death are dependent on tPA production. 15,50 Thus, the mechanisms that underlie inflammation in neuroAIDS are found among other CNS diseases and represent excellent potential targets in future treatment paradigms.
Our immunohistochemical analysis was especially valuable for localizing up-regulation of protein products to neurons including STAT1, tTG, ACT, and cyclin D3, all novel findings with implications for pathogenesis. Neuronal STAT1 similarly increases in EAE 51 and, in vitro, STAT1 is linked to dendritic retraction after IFN-γ stimulation. 52 Such a mechanism of dendritic injury may be partially responsible for that accompanying cognitive dysfunction in patients with neuroAIDS. 2 TTG expression in neurons in vitro has been shown to lead to increased cellular oxidative stress, sensitizing them to apoptosis. 53 Furthermore, tTG expression in neurons in vivo has been strongly implicated in the damage found in Huntington’s disease. 31,54 In support of this, administration of cystamine, a competitive inhibitor to tTG, ameliorates pathology in mouse models of Huntington’s disease 31,55 and thus may represent an important direction of study for SIVE/HIVE cases. Although its function is unknown, neuronal ACT has been found to be up-regulated in the brainstem of people with spinocerebellar ataxia type 1, like Huntington’s, a CAG-trinucleotide repeat (polyglutamine) neurodegenerative disorder. 56
Cyclin D3, which is involved in the cell-cycle control system, is of particular interest here. Immunostaining for cyclin D3 located it predominately in the nuclei of neurons in cortical layers 3 to 6. Cyclin D3 can phosphorylate the cell-cycle regulator Rb during G1 phase allowing the release of the protein E2F1. 57 Although the normal function of E2F1 is to activate the gene expression needed for cell-cycle progression, 58 increased amounts of E2F1 in postmitotic cells such as neurons can also result in apoptosis. 59 In addition, neuronal death can be attributed in part to pRb phosphorylation itself, 60 and an increased and altered expression of the phosphorylated form of pRb exists in neuronal populations of HIVE- and SIVE-affected brains. 61,62 These latter studies, like ours, documented a predominantly nuclear staining of cell-cycle regulatory proteins, suggesting that the up-regulation of cyclin D3 found here is a precursor to increased pRb phosphorylation, E2F1 release, and neuronal death. In addition cyclin D3 can directly interact with caspase-2, resulting in an increase in the apoptosis-inducing, cleaved form of this molecule. 63 In fact, a cascade of neuronal caspase activation underlies dendritic degeneration and neuronal apoptosis in models of HIV neurotoxicity. 64
Neuronal damage has been hypothesized to occur in vivo during HIV infection because of the production and release of toxins by infected and/or activated microglia/macrophages. In the frontal lobes of SIV-infected animals studied here, the macrophage-containing lesions were predominately in the white matter, where microglial activation markers were also pronounced and astrocytes became activated. Therefore, a noteworthy observation is that the up-regulated neuronal proteins found here (cyclin D3, ACT, tTG, and STAT1) were located primarily in neurons from cortical layer 3 inward, suggesting that the proximity of these neurons to the source of damaging molecules is a key factor in neuronal pathogenesis. Indeed, Golgi impregnation staining has revealed significant damage to cortical neuronal dendrites in these SIV-infected animals (RF Mervis and HS Fox, unpublished data). Thus, it is indeed likely that products of infected and/or activated macrophages, such as those identified here, potentially amplified by additional factors from locally activated astrocytes and microglia, lead to untoward effects on neurons resulting in neuroAIDS.
In conclusion, this study has highlighted a number of novel genes and proteins, identified through unbiased assessment of gene expression levels by microarray analysis, that have not been previously considered in this field. These data support the role of activated macrophages and microglia in the injurious effects of HIV on the CNS, identify an upstream factor in the cell cycle-related abnormalities found in SIVE/HIVE neurons, and reveal molecular pathways whose modulation can potentially reduce cellular infiltration and neuronal dysfunction in those suffering from these devastating consequences of HIV infection of the CNS.
Table 2A.
Continued
| Antiviral | ||||||||||||||||
|---|---|---|---|---|---|---|---|---|---|---|---|---|---|---|---|---|
| 3.75 (1.63) | 9.54 (2.49) | 2.6 | 38014_at | X79448 | Adenosine deaminase | * | * | |||||||||
| 0.13 (0.09) | 3.00 (2.07) | 23.0 | 37014_at | M33882 | MxA/p78 | * | * | |||||||||
| 0.36 (0.21) | 0.83 (0.51) | 2.3 | 39264_at | M87284 | 2′-5′-oligadenylate synthetase | |||||||||||
| Transcriptional regulation | ||||||||||||||||
| 2.48 (0.85) | 6.24 (1.77) | 2.5 | 38354_at | X52560 | NF-IL6 | * | ||||||||||
| 1.20 (0.28) | 2.54 (0.92) | 2.1 | 1052_s_at | M83667 | NF-IL6b | * | * | |||||||||
| 0.52 (0.40) | 1.23 (0.75) | 2.4 | 38517_at | M87503 | P48 protein/ISGF3γ | * | * | |||||||||
| 0.57 (0.14) | 1.95 (1.00) | 3.4 | 36423_at | W47047 | P8 protein | * | * | |||||||||
| 0.52 (0.40) | 1.11 (0.35) | 2.1 | 34189_at | D31891 | SETDB1 | |||||||||||
| 0.34 (0.13) | 2.33 (0.68) | 6.9 | 32859_at | M97935 | STAT1 91kDa | * | * | * | ||||||||
| 0.35 (0.18) | 1.13 (0.29) | 3.2 | 32860)g_at | M97935 | STAT1 91kDa | * | * | * | ||||||||
| 0.17 (0.09) | 3.11 (1.30) | 18.0 | 3338_at | M97936 | STAT1 91kDa | * | * | * | ||||||||
| 0.63 (0.29) | 2.96 (1.32) | 4.7 | 33339_g_at | M97936 | STAT1 91kDa | * | * | |||||||||
| 0.91 (0.42) | 2.01 (0.75) | 2.2 | 39708_at | L29277 | STAT3 | * | ||||||||||
| 0.95 (0.65) | 2.03 (0.65) | 2.1 | 39681_at | AF060568 | Zinc finger protein 145 (PML) | |||||||||||
| Cell cycle | ||||||||||||||||
| 0.82 (0.57) | 2.39 (0.97) | 2.9 | 36131_at | AJ012008 | CLIC1/NCC27 | * | * | |||||||||
| 0.60 (0.44) | 1.26 (0.49) | 2.1 | 1794_at | M92287 | Cyclin D3 | |||||||||||
| 0.82 (0.83) | 2.96 (1.61) | 3.6 | 32609_at | AI885852 | Histone H2A | * | * | |||||||||
| 0.51 (0.30) | 1.13 (0.43) | 2.2 | 35576_f_at | AL009179 | Histone H2B | * | ||||||||||
| 0.34 (0.30) | 0.83 (0.40) | 2.4 | 34027_f_at | AA010078 | Histone H4 | * | * | |||||||||
| 0.61 (0.59) | 1.43 (0.40) | 2.3 | 1787_at | U23398 | p57KIP2 | * | ||||||||||
| 1.56 (0.83) | 3.33 (0.94) | 2.1 | 39286_at | D64109 | TOB2 | * | ||||||||||
| Growth, differentiation, and signaling | ||||||||||||||||
| 0.55 (0.28) | 1.42 (0.69) | 2.6 | 1278_at | HG162-HT3165 | AXL | * | ||||||||||
| 0.23 (0.12) | 1.32 (0.97) | 5.7 | 39061_at | D28137 | BST-2 | * | * | |||||||||
| 3.95 (1.82) | 9.43 (1.96) | 2.4 | 35282_r_at | M33680 | CD81/TAPA-1 | |||||||||||
| 0.27 (0.07) | 1.03 (0.67) | 3.8 | 41198_at | AF055008 | Epithelin/Granulin | * | ||||||||||
| 2.73 (2.58) | 6.81 (2.55) | 2.5 | 424_s_at | X66945 | FGFR1 | |||||||||||
| 0.53 (0.35) | 1.32 (0.43) | 2.5 | 34268_at | X91809 | GAIP/RGS19 | |||||||||||
| 0.40 (0.25) | 0.91 (0.62) | 2.3 | 577_at | M94250 | Midkine | * | ||||||||||
| 2.03 (0.54) | 4.39 (1.94) | 2.2 | 31508_at | S73591 | VDUP1/TBP-2 | * | ||||||||||
| Cytoskeleton | ||||||||||||||||
| 0.68 (0.21) | 1.44 (0.51) | 2.1 | 406_at | X53587 | Integrin beta 4 | |||||||||||
| 0.66 (0.35) | 1.83 (0.63) | 2.8 | 38391_at | M94345 | Macrophage capping protein/CapG | * | ||||||||||
| 1.72 (0.79) | 4.03 (1.46) | 2.4 | 40771_at | Z98946 | Moesin | |||||||||||
| 3.54 (1.68) | 7.32 (1.67) | 2.1 | 38021_at | U53204 | Plectin | |||||||||||
| 1.29 (0.63) | 2.73 (0.66) | 2.1 | 36902_at | X61587 | RhoG | |||||||||||
| 9.27 (2.62) | 19.47 (6.77) | 2.1 | 34091_s_at | Z19554 | Vimentin | * | ||||||||||
| Immune system | ||||||||||||||||
| 0.31 (0.06) | 1.65 (0.70) | 5.3 | 36661_s_at | X06882 | CD14 | * | * | |||||||||
| 0.96 (0.36) | 3.85 (1.03) | 4.0 | 31870_at | X14046 | CD37 | |||||||||||
| 0.37 (0.18) | 1.15 (0.87) | 3.1 | 31438_s_at | Z22971 | CD163/M130 | * | * | |||||||||
| 0.42 (0.41) | 1.16 (0.39) | 2.8 | 36889_at | M33195 | Fc-ɛ receptor γ-chain | |||||||||||
| 0.09 (0.05) | 1.26 (1.90) | 14.0 | 38194_s_at | M63438 | Immunoglobulin kappa | * | * | |||||||||
| 0.33 (0.21) | 1.60 (2.22) | 4.9 | 33274_f_at | M18645 | Immunoglobulin lambda | * | ||||||||||
| 0.34 (0.28) | 0.89 (0.19) | 2.6 | 34660_at | AI142565 | Ribonuclease K6 | * | * | |||||||||
| Other | ||||||||||||||||
| 1.35 (0.85) | 2.76 (0.72) | 2.0 | 33804_at | U43522 | Cell adhesion kinase beta | |||||||||||
| 1.21 (0.74) | 2.58 (0.62) | 2.1 | 41168_at | AF029750 | CNPase | |||||||||||
| 0.35 (0.25) | 1.08 (0.28) | 3.1 | 38788_at | M82827 | Fusion protein | * | * | |||||||||
| 1.06 (0.51) | 2.19 (0.48) | 2.1 | 40054_at | D43949 | KIAA0082 | |||||||||||
| 0.23 (0.31) | 1.15 (0.45) | 4.9 | 32317_s_at | U34804 | STP2 | * | ||||||||||
| 0.69 (0.53) | 1.63 (0.34) | 2.3 | 39693_at | N53547 | Unknown | |||||||||||
| 0.20 (0.13) | 0.94 (1.06) | 4.8 | 41827_f_at | AI932613 | Unknown | * | ||||||||||
Average normalized SV, and (SD) for each probe set is indicated for the control and SIVE groups, followed by the fold change (SIVE/control). The GenBank (www.ncbi.nlm.nih.gov) or Institute for Genomic Research (www.tigr.org) accession number from which each probe set was derived, the name of the Affymetrix probe set (sequences of the probes sets and links to gene information can be obtained at www.affymetrix.com), and the name of the gene represented by the probe set, are indicated.
*indicates up-regulation of the gene probe sets in occipital lobe (OL), midbrain (MB), and cerebellum (CB).
Acknowledgments
We thank Drs. Keith Reimann and Jörn Schmitz for their assistance and input into the CD8-depletion protocol; Dr. Ernest Borden for ISG15 antisera; Steve Head, Jeff Chismar, Tom Whisenant, and Tony Mondala for their valuable expertise in microarray experiments; Rebecca Mahady for manuscript preparation; and the authors of all of the publications not able to be included as references in this article because of the sheer numbers needed for investigation of all of the genes of interest.
Footnotes
Address reprint requests to Howard S. Fox, Department of Neuropharmacology, CVN-1, The Scripps Research Institute, 10550 North Torrey Pines Rd., La Jolla, CA 92037. E-mail: hsfox@scripps.edu.
Supported by the National Institutes of Health (grants MH59468, MH61224, MH61692, MH62261, and RR13150).
This is manuscript no. 15012-NP from The Scripps Research Institute.
References
- 1.Glass JD, Fedor H, Wesselingh SL, McArthur JC: Immunocytochemical quantitation of human immunodeficiency virus in the brain: correlations with dementia. Ann Neurol 1995, 38:755-762 [DOI] [PubMed] [Google Scholar]
- 2.Masliah E, Heaton RK, Marcotte TD, Ellis RJ, Wiley CA, Mallory M, Achim CL, McCutchan JA, Nelson JA, Atkinson JH, Grant I: Dendritic injury is a pathological substrate for human immunodeficiency virus-related cognitive disorders. HNRC Group. The HIV Neurobehavioral Research Center. Ann Neurol 1997, 42:963-972 [DOI] [PubMed] [Google Scholar]
- 3.Burudi EME, Fox HS: Simian immunodeficiency virus model of HIV-induced central nervous system dysfunction. Buchmeier MJ Campbell I eds. Advances in Virus Research. 2001:pp 431-464 Academic Press [DOI] [PubMed]
- 4.Zink MC, Spelman JP, Robinson RB, Clements JE: SIV infection of macaques—modeling the progression to AIDS dementia. J Neurovirol 1998, 4:249-259 [DOI] [PubMed] [Google Scholar]
- 5.Schmitz JE, Kuroda MJ, Santra S, Sasseville VG, Simon MA, Lifton MA, Racz P, Tenner-Racz K, Dalesandro M, Scallon BJ, Ghrayeb J, Forman MA, Montefiori DC, Rieber EP, Letvin NL, Reimann KA: Control of viremia in simian immunodeficiency virus infection by CD8+ lymphocytes. Science 1999, 283:857-860 [DOI] [PubMed] [Google Scholar]
- 6.Williams K, Alvarez X, Lackner AA: Central nervous system perivascular cells are immunoregulatory cells that connect the CNS with the peripheral immune system. Glia 2001, 36:156-164 [DOI] [PubMed] [Google Scholar]
- 7.Kaul M, Garden GA, Lipton SA: Pathways to neuronal injury and apoptosis in HIV-associated dementia. Nature 2001, 410:988-994 [DOI] [PubMed] [Google Scholar]
- 8.Chismar JD, Mondala T, Fox HS, Roberts E, Langford D, Masliah E, Salomon DR, Head SR: Analysis of result variability from high-density oligonucleotide arrays comparing same-species and cross-species hybridizations. Biotechniques 2002, 33:516-524 [DOI] [PubMed] [Google Scholar]
- 9.Kayo T, Allison DB, Weindruch R, Prolla TA: Influences of aging and caloric restriction on the transcriptional profile of skeletal muscle from rhesus monkeys. Proc Natl Acad Sci USA 2001, 98:5093-5098 [DOI] [PMC free article] [PubMed] [Google Scholar]
- 10.Schenkel AR, Mamdouh Z, Chen X, Liebman RM, Muller WA: CD99 plays a major role in the migration of monocytes through endothelial junctions. Nat Immunol 2002, 14:143-150 [DOI] [PubMed] [Google Scholar]
- 11.Wenzel I, Roth J, Sorg C: Identification of a novel surface molecule, RM3/1, that contributes to the adhesion of glucocorticoid-induced human monocytes to endothelial cells. Eur J Immunol 1996, 26:2758-2763 [DOI] [PubMed] [Google Scholar]
- 12.Akimov SS, Belkin AM: Cell surface tissue transglutaminase is involved in adhesion and migration of monocytic cells on fibronectin. Blood 2001, 98:1567-1576 [DOI] [PubMed] [Google Scholar]
- 13.Giachelli CM, Lombardi D, Johnson RJ, Murry CE, Almeida M: Evidence for a role of osteopontin in macrophage infiltration in response to pathological stimuli in vivo. Am J Pathol 1998, 152:353-358 [PMC free article] [PubMed] [Google Scholar]
- 14.Heyes MP, Saito K, Lackner A, Wiley CA, Achim CL, Markey SP: Sources of the neurotoxin quinolinic acid in the brain of HIV-1-infected patients and retrovirus-infected macaques. EMBO J 1998, 12:881-896 [DOI] [PubMed] [Google Scholar]
- 15.Tsirka SE, Gualandris A, Amaral DG, Strickland S: Excitotoxin-induced neuronal degeneration and seizure are mediated by tissue plasminogen activator. Nature 1995, 377:340-344 [DOI] [PubMed] [Google Scholar]
- 16.Weihofen A, Binns K, Lemberg MK, Ashman K, Martoglio B: Identification of signal peptide peptidase, a presenilin-type aspartic protease. Science 2002, 296:2215-2218 [DOI] [PubMed] [Google Scholar]
- 17.Belloir B, Kovari E, Surini-Demiri M, Savioz A: Altered apolipoprotein D expression in the brain of patients with Alzheimer disease. J Neurosci Res 2001, 64:61-69 [DOI] [PubMed] [Google Scholar]
- 18.Terrisse L, Poirier J, Bertrand P, Merched A, Visvikis S, Siest G, Milne R, Rassart E: Increased levels of apolipoprotein D in cerebrospinal fluid and hippocampus of Alzheimer’s patients. J Neurochem 1998, 71:1643-1650 [DOI] [PubMed] [Google Scholar]
- 19.Aukrust P, Bjornsen S, Lunden B, Otterdal K, Ng EC, Ameln W, Ueland T, Muller F, Solum NO, Brosstad F, Froland SS: Persistently elevated levels of von Willebrand factor antigen in HIV infection. Downregulation during highly active antiretroviral therapy. Thromb Haemost 2000, 84:183-187 [PubMed] [Google Scholar]
- 20.Gollin PA, Kalaria RN, Eikelenboom P, Rozemuller A, Perry G: Alpha 1-antitrypsin and alpha 1-antichymotrypsin are in the lesions of Alzheimer’s disease. Neuroreport 1992, 3:201-203 [DOI] [PubMed] [Google Scholar]
- 21.Tooyama I, Sato H, Yasuhara O, Kimura H, Konishi Y, Shen Y, Walker DG, Beach TG, Sue LI, Rogers J: Correlation of the expression level of C1q mRNA and the number of C1q-positive plaques in the Alzheimer disease temporal cortex. analysis of C1q mRNA and its protein using adjacent or nearby sections. Dement Geriatr Cogn Disord 2001, 12:237-242 [DOI] [PubMed] [Google Scholar]
- 22.McArthur JC, McClernon DR, Cronin MF, Nance-Sproson TE, Saah AJ, St Clair M, Lanier ER: Relationship between human immunodeficiency virus-associated dementia and viral load in cerebrospinal fluid and brain. Ann Neurol 1997, 42:689-698 [DOI] [PubMed] [Google Scholar]
- 23.Gelman BB, Wolf DA, Rodriguez-Wolf M, West AB, Haque AK, Cloyd M: Mononuclear phagocyte hydrolytic enzyme activity associated with cerebral HIV-1 infection. Am J Pathol 1997, 151:1437-1446 [PMC free article] [PubMed] [Google Scholar]
- 24.Origasa M, Tanaka S, Suzuki K, Tone S, Lim B, Koike T: Activation of a novel microglial gene encoding a lysosomal membrane protein in response to neuronal apoptosis. Brain Res Mol Brain Res 2001, 88:1-13 [DOI] [PubMed] [Google Scholar]
- 25.Schroder HC, Ugarkovic D, Merz H, Kuchino Y, Okamoto T, Muller WE: Protection of HeLa-T4+ cells against human immunodeficiency virus (HIV) infection after stable transfection with HIV LTR-2′, 5′-oligoadenylate synthetase hybrid gene. EMBO J 1990, 4:3124-3130 [DOI] [PubMed] [Google Scholar]
- 26.Henderson AJ, Connor RI, Calame KL: C/EBP activators are required for HIV-1 replication and proviral induction in monocytic cell lines. Immunity 1996, 5:91-101 [DOI] [PubMed] [Google Scholar]
- 27.Payne J, Maher F, Simpson I, Mattice L, Davies P: Glucose transporter Glut 5 expression in microglial cells. Glia 1997, 21:327-331 [DOI] [PubMed] [Google Scholar]
- 28.Bernard G, Raimondi V, Alberti I, Pourtein M, Widjenes J, Ticchioni M, Bernard A: CD99 (E2) up-regulates alpha4beta1-dependent T cell adhesion to inflamed vascular endothelium under flow conditions. Eur J Immunol 2000, 30:3061-3065 [DOI] [PubMed] [Google Scholar]
- 29.Weber GF, Zawaideh S, Hikita S, Kumar VA, Cantor H, Ashkar S: Phosphorylation-dependent interaction of osteopontin with its receptors regulates macrophage migration and activation. J Leukoc Biol 2002, 72:752-761 [PubMed] [Google Scholar]
- 30.Chabas D, Baranzini SE, Mitchell D, Bernard CC, Rittling SR, Denhardt DT, Sobel RA, Lock C, Karpuj M, Pedotti R, Heller R, Oksenberg JR, Steinman L: The influence of the proinflammatory cytokine, osteopontin, on autoimmune demyelinating disease. Science 2001, 294:1731-1735 [DOI] [PubMed] [Google Scholar]
- 31.Karpuj MV, Becher MW, Springer JE, Chabas D, Youssef S, Pedotti R, Mitchell D, Steinman L: Prolonged survival and decreased abnormal movements in transgenic model of Huntington disease, with administration of the transglutaminase inhibitor cystamine. Nat Med 2002, 8:143-149 [DOI] [PubMed] [Google Scholar]
- 32.Williams KC, Hickey WF: Central nervous system damage, monocytes and macrophages, and neurological disorders in AIDS. Annu Rev Neurosci 2002, 25:537-562 [DOI] [PubMed] [Google Scholar]
- 33.Benveniste EN: Cytokine circuits in brain. Implications for AIDS dementia complex. Res Publ Assoc Res Nerv Ment Dis 1994, 72:71-88 [PubMed] [Google Scholar]
- 34.Van den Heuvel MM, Tensen CP, van As JH, Van den Berg TK, Fluitsma DM, Dijkstra CD, Dopp EA, Droste A, Van Gaalen FA, Sorg C, Hogger P, Beelen RH: Regulation of CD 163 on human macrophages: cross-linking of CD163 induces signaling and activation. J Leukoc Biol 1999, 66:858-866 [DOI] [PubMed] [Google Scholar]
- 35.Cicala C, Arthos J, Selig SM, Dennis G, Jr, Hosack DA, Van Ryk D, Spangler ML, Steenbeke TD, Khazanie P, Gupta N, Yang J, Daucher M, Lempicki RA, Fauci AS: HIV envelope induces a cascade of cell signals in non-proliferating target cells that favor virus replication. Proc Natl Acad Sci USA 2002, 99:9380-9385 [DOI] [PMC free article] [PubMed] [Google Scholar]
- 36.Janciauskiene S: Conformational properties of serine proteinase inhibitors (serpins) confer multiple pathophysiological roles. Biochim Biophys Acta 2001, 1535:221-235 [DOI] [PubMed] [Google Scholar]
- 37.Pasternack JM, Abraham CR, Van Dyke BJ, Potter H, Younkin SG: Astrocytes in Alzheimer’s disease gray matter express alpha 1-antichymotrypsin mRNA. Am J Pathol 1989, 135:827-834 [PMC free article] [PubMed] [Google Scholar]
- 38.Nebuloni M, Pellegrinelli A, Ferri A, Bonetto S, Boldorini R, Vago L, Grassi MP, Costanzi G: Beta amyloid precursor protein and patterns of HIV p24 immunohistochemistry in different brain areas of AIDS patients. Aids 2001, 15:571-575 [DOI] [PubMed] [Google Scholar]
- 39.Wong LH, Sim H, Chatterjee-Kishore M, Hatzinisiriou I, Devenish RJ, Stark G, Ralph SJ: Isolation and characterization of a human STAT1 gene regulatory element. Inducibility by interferon (IFN) types I and II and role of IFN regulatory factor-1. J Biol Chem 2002, 277:19408-19417 [DOI] [PubMed] [Google Scholar]
- 40.Labrada L, Liang XH, Zheng W, Johnston C, Levine B: Age-dependent resistance to lethal alphavirus encephalitis in mice: analysis of gene expression in the central nervous system and identification of a novel interferon-inducible protective gene, mouse ISG12. J Virol 2002, 76:11688-11703 [DOI] [PMC free article] [PubMed] [Google Scholar]
- 41.Bigger CB, Brasky KM, Lanford RE: DNA microarray analysis of chimpanzee liver during acute resolving hepatitis C virus infection. J Virol 2001, 75:7059-7066 [DOI] [PMC free article] [PubMed] [Google Scholar]
- 42.Zhu H, Cong JP, Mamtora G, Gingeras T, Shenk T: Cellular gene expression altered by human cytomegalovirus: global monitoring with oligonucleotide arrays. Proc Natl Acad Sci USA 1998, 95:14470-14475 [DOI] [PMC free article] [PubMed] [Google Scholar]
- 43.Geimonen E, Neff S, Raymond T, Kocer SS, Gavrilovskaya IN, Mackow ER: Pathogenic and nonpathogenic hantaviruses differentially regulate endothelial cell responses. Proc Natl Acad Sci USA 2002, 99:13837-13842 [DOI] [PMC free article] [PubMed] [Google Scholar]
- 44.Piacentini M: Tissue transglutaminase: a candidate effector element of physiological cell death. Curr Top Microbiol Immunol 1995, 200:163-175 [DOI] [PubMed] [Google Scholar]
- 45.Bergamini A, Capozzi M, Piacentini M: Macrophage-colony stimulating factor (M-CSF) stimulation induces cell death in HIV-infected human monocytes. Immunol Lett 1994, 42:35-40 [DOI] [PubMed] [Google Scholar]
- 46.Nishiyama A, Matsui M, Iwata S, Hirota K, Masutani H, Nakamura H, Takagi Y, Sono H, Gon Y, Yodoi J: Identification of thioredoxin-binding protein-2/vitamin D(3) up-regulated protein 1 as a negative regulator of thioredoxin function and expression. J Biol Chem 1999, 274:21645-21650 [DOI] [PubMed] [Google Scholar]
- 47.Junn E, Han SH, Im JY, Yang Y, Cho EW, Um HD, Kim DK, Lee KW, Han PL, Rhee SG, Choi I: Vitamin D3 up-regulated protein 1 mediates oxidative stress via suppressing the thioredoxin function. J Immunol 2000, 164:6287-6295 [DOI] [PubMed] [Google Scholar]
- 48.Heyes MP, Ellis RJ, Ryan L, Childers ME, Grant I, Wolfson T, Archibald S, Jernigan TL: Elevated cerebrospinal fluid quinolinic acid levels are associated with region-specific cerebral volume loss in HIV infection. Brain 2001, 124:1033-1042 [DOI] [PubMed] [Google Scholar]
- 49.Burudi EM, Marcondes MC, Watry DD, Zandonatti M, Taffe MA, Fox HS: Regulation of indoleamine 2, 3-dioxygenase expression in simian immunodeficiency virus-infected monkey brains. J Virol 2002, 76:12233-12241 [DOI] [PMC free article] [PubMed] [Google Scholar]
- 50.Siao CJ, Tsirka SE: Tissue plasminogen activator mediates microglial activation via its finger domain through annexin II. J Neurosci 2002, 22:3352-3358 [DOI] [PMC free article] [PubMed] [Google Scholar]
- 51.Jee Y, Kim G, Tanuma N, Matsumoto Y: STAT expression and localization in the central nervous system during autoimmune encephalomyelitis in Lewis rats. J Neuroimmunol 2001, 114:40-47 [DOI] [PubMed] [Google Scholar]
- 52.Kim IJ, Beck HN, Lein PJ, Higgins D: Interferon gamma induces retrograde dendritic retraction and inhibits synapse formation. J Neurosci 2002, 22:4530-4539 [DOI] [PMC free article] [PubMed] [Google Scholar]
- 53.Piacentini M, Farrace MG, Piredda L, Matarrese P, Ciccosanti F, Falasca L, Rodolfo C, Giammarioli AM, Verderio E, Griffin M, Malorni W: Transglutaminase overexpression sensitizes neuronal cell lines to apoptosis by increasing mitochondrial membrane potential and cellular oxidative stress. J Neurochem 2002, 81:1061-1072 [DOI] [PubMed] [Google Scholar]
- 54.Karpuj MV, Becher MW, Steinman L: Evidence for a role for transglutaminase in Huntington’s disease and the potential therapeutic implications. Neurochem Int 2002, 40:31-36 [DOI] [PubMed] [Google Scholar]
- 55.Dedeoglu A, Kubilus JK, Jeitner TM, Matson SA, Bogdanov M, Kowall NW, Matson WR, Cooper AJ, Ratan RR, Beal MF, Hersch SM, Ferrante RJ: Therapeutic effects of cystamine in a murine model of Huntington’s disease. J Neurosci 2002, 22:8942-8950 [DOI] [PMC free article] [PubMed] [Google Scholar]
- 56.Lin X, Antalffy B, Kang D, Orr HT, Zoghbi HY: Polyglutamine expansion down-regulates specific neuronal genes before pathologic changes in SCA1. Nat Neurosci 2000, 3:157-163 [DOI] [PubMed] [Google Scholar]
- 57.Fisher RP: CDKs and cyclins in transition(s). Curr Opin Genet Dev 1997, 7:32-38 [DOI] [PubMed] [Google Scholar]
- 58.Farnham PJ, Slansky JE, Kollmar R: The role of E2F in the mammalian cell cycle. Biochim Biophys Acta 1993, 1155:125-131 [DOI] [PubMed] [Google Scholar]
- 59.Adams PD, Kaelin WG, Jr: The cellular effects of E2F overexpression. Curr Top Microbiol Immunol 1996, 208:79-93 [DOI] [PubMed] [Google Scholar]
- 60.Giovanni A, Wirtz-Brugger F, Keramaris E, Slack R, Park DS: Involvement of cell cycle elements, cyclin-dependent kinases, pRb, and E2F x DP, in B-amyloid-induced neuronal death. J Biol Chem 1999, 274:19011-19016 [DOI] [PubMed] [Google Scholar]
- 61.Jordan-Sciutto KL, Wang G, Murphy-Corb M, Wiley CA: Induction of cell-cycle regulators in simian immunodeficiency virus encephalitis. Am J Pathol 2000, 157:497-507 [DOI] [PMC free article] [PubMed] [Google Scholar]
- 62.Jordan-Sciutto KL, Wang G, Murphey-Corb M, Wiley CA: Cell cycle proteins exhibit altered expression patterns in lentiviral-associated encephalitis. J Neurosci 2002, 22:2185-2195 [DOI] [PMC free article] [PubMed] [Google Scholar]
- 63.Mendelsohn AR, Hamer JD, Wang ZB, Brent R: Cyclin D3 activates caspase 2, connecting cell proliferation with cell death. Proc Natl Acad Sci USA 2002, 99:6871-6876 [DOI] [PMC free article] [PubMed] [Google Scholar]
- 64.Garden GA, Budd SL, Tsai E, Hanson L, Kaul M, D’Emilia DM, Friedlander RM, Yuan J, Masliah E, Lipton SA: Caspase cascades in human immunodeficiency virus-associated neurodegeneration. J Neurosci 2002, 22:4015-4024 [DOI] [PMC free article] [PubMed] [Google Scholar]