

Abstract
In this study, we describe the growth arrest DNA damage-inducible gene 45β (GADD45β), whose expression was significantly down-regulated in the hepatocellular carcinoma (HCC) microarray study and confirmed by Northern blot analysis. The results suggested that expression of GADD45β was decreased in human liver cancer cell lines HepG2 and Hep3B, but not in normal human embryonic liver cell line CL-48 or normal liver tissue. Histochemistry study and real-time PCR further confirmed that GADD45β staining in HCC was significantly decreased when compared to surrounding non-neoplastic liver tissue. In further studies of multiple human cancer tissues, GADD45β strongly stained tissues such as colon cancer, breast cancer, prostate cancer, squamous cell cancer, lymphoma, and leiomyosarcoma, suggesting that the decreased expression of GADD45β is specific to HCC. Eighty-five cases of primary HCC were further examined by immunohistochemistry and statistical analyses demonstrated that HCC scored lower than matched non-neoplastic liver tissues consistently and significantly. No staining occurred in 12.94% of HCC cases (score = 0, n = 11); 42.35% had weak staining (score = 1, n = 36); 27.06% had moderate staining (score = 2, n = 23); and 17.65% had staining as strong as normal tissue (score = 3, n = 15). Overall, surrounding non-neoplastic liver tissue was highly positive for GADD45β compared to adjacent neoplastic liver tissues (P < 0.01). We further observed that down-regulation of GADD45β expression was strongly correlated with differentiation (P < 0.01) and high nuclear grade (P < 0.01). Moreover, we found that expression of GADD45β was inversely correlated to the presence of mutant p53 in HCC tissue (P < 0.05). Thus, the results of our study suggest that GADD45β, which is down-regulated in most cases of HCC, remains an ideal candidate for development as a molecular marker in the diagnosis of HCC and as a potential therapeutic target.
Despite recent advances in diagnostic and therapeutic management, prognosis of hepatocellular carcinoma (HCC) still remains poor. 1 Many risk factors, such as viral hepatitis, alcohol abuse, biliary disease, metabolic disorders, drugs, and toxins are related to carcinogenesis of HCC. These risk factors result in hepatocellular injury and replacement of normal acini by nodules. Regenerative hyperplasias of fibrous tissue and acini nodules profoundly disturb the hepatic parenchymal structure and vascular network, which can directly or indirectly contribute to carcinogenesis as a final stage of liver disease. Therefore, carcinogenesis and the development of HCC constitute a long and complex course related to hepatocyte damage and the repair process, which involves multiple oncogenes and tumor suppressor genes.
Radical surgical resection of the tumor is considered the only effective treatment for liver cancer, and provides a 5-year survival rate of 31%. 2 Cirrhosis is a major limiting factor in the surgical resection of liver tumors. Without treatment, mean survival from the onset of symptoms is 1 to 4 months. 2 Total hepatectomy with liver transplantation may benefit a select group of patients not amenable to partial hepatic resection. However, the rate of recurrence may be as high as 50%. 3 Transarterial chemoembolization, 4 and percutaneous ethanol injection of tumors may provide some survival benefit in unresectable tumors. 5 However, less than 20% of liver cancer patients are diagnosed when surgery is still an option. Of those who undergo surgery, the relapse rate remains as high as 50% in 5 years. 2 Thus, it is critical to diagnose liver cancer at an early stage and establish biochemical markers to follow cirrhosis status before cancer development. Up to now, α-fetoprotein (AFP) level remains the most useful marker in the screening and diagnosis of liver cancer. Unfortunately, AFP levels have a false negative rate of 30% in liver cancer. 2 On the other hand, AFP may be elevated with teratocarcinoma, yolk sac tumors, or other liver diseases. Therefore, it is worth seeking new molecular markers for HCC diagnosis, especially in the early stages.
Currently, there are several staging methods used in HCC diagnosis including recognition of morphological features and prediction prognosis. 6 The pathological tumor-node-metastasis (TNM) system is widely used to stratify pathological stage on the basis of tumor size, location, number of nodules, and vascular invasion. These stage features are correlated with the degree of malignancy and prognosis. The Edmondson and Steiner grading system 6 is mostly applied in description of histological determinants of HCC. With this scheme, tumors are pathologically staged according to factors such as tumor architecture, mitotic activity, growth interface, tumor necrosis, and microvascular invasion. In some cases, however, even though morphological features may show well differentiation or a low TNM stage, the prognosis comes out differently due to high recurrence. Therefore, it is important to understand the process of neoplastic transformation of hepatocytes and how the expression of oncogenes and tumor suppressor genes during this period directly impacts hepatocarcinogenesis. Ultimately, this will be helpful in the identification of new diagnostic, prognostic markers, and therapeutic interventions.
As one of the new molecular technologies to study gene expression profiles in a global setting, DNA microarrays make it possible to screen thousands of genes rapidly and efficiently. Based on the panel of genes provided in the DNA microarray, further studies can be performed to determine the function of genes identified to be significantly enriched or decreased and the results can be used to discover new target genes for improvement of HCC prognosis. 7 This technology has been applied successfully in the identification of key genes in neoplastic transformation and as a diagnosis tool in molecular pathology. 8,9
In this study, we used a DNA microarray to compare the gene expression profile of HCC tissue with that of matched non-neoplastic tissue. We identified one candidate gene, GADD45β, which is associated with cell growth control and cellular responses to DNA damage, that had significantly decreased expression in liver cancer tissue, and confirmed the observation by Northern blot. Our results indicated that down-regulation of GADD45β was associated with differentiation and nuclear grade of HCC and that it was specific to HCC. Our study suggests that the DNA damage and repair-related gene GADD45β may be considered as a new marker for HCC diagnoses, or as a target gene in gene therapy for HCC in the future.
Materials and Methods
RNA Isolation, cRNA Preparation, and Microarray Hybridization
For gene expression microarray analysis, four cases of fresh HCC tissues, coupled with non-neoplastic liver tissues from each individual, were obtained from City of Hope National Medical Center and St. Vincent Hospital. Tissue samples were cut into small pieces and snap-frozen in liquid nitrogen immediately. All of the samples were submitted for routine pathology evaluation and diagnosis confirmation. One-hundred mg of frozen tissue was homogenized and total RNA was extracted using TRIzol (Life Technologies, Rockville, MD). Poly-A mRNA was then isolated from 1 mg of total RNA using Oligotex mRNA Spin-Column Mini Kit (Qiagen, Valencia, CA), according to the manufacturer’s recommended protocol. Double-stranded cDNA was created using the SuperScript Choice System (Life Technologies). A T7-oligonucleotide was used to prime synthesis of first-strand cDNA from poly-A mRNA. The cDNA was purified by PLG spin column, precipitated with 0.5 volumes of 7.5 mol/L of ammonia acetate and 2.5 volumes of 100% ethanol. Two μg of cDNA was used to synthesize cRNA in vitro using T7 RNA polymerase and four biotin-labeled ribonucleotides. After incubation at 37°C for 5 hours, the labeled cRNA was purified with the RNeasy Mini Kit (Qiagen). RNA was tested at every step by separation in a 1.2% MOPS/formaldehyde agarose gel, and the amount was estimated based on the OD 260/280 reading. RNA was stored in DEPC water with 10 mmol/L DTT and RNasin 1 U/ml in −70°C. The biotinylated cRNA was hybridized to the Affymetrix HU95A oligonuleotide probe microarray gene chip (Affymetrix, Santa Clara, CA) for 16 hours at 45°C, which represented 12,588 full-length human genes and oligo EST sequences. The pattern of gene expression in the microarray was confirmed in four separate samples.
Microarray Analyses
All of the analyses were performed at the Microarray Core Facility, Children’s Hospital Los Angeles. Fluorescence intensities from biotinylated probes were detected with streptavidin-phycoerythrin (Molecular Probes, Eugene, OR) and quantitative scanning was performed using the HP Agilgent 2200 confocal scanner. The data were analyzed using Affymetrix Microarray Software Suite (Version 4.0). The average difference values representing perfect match-mismatch for each gene were normalized after scaling the total chip intensities to an average of 1500 units. The data were further analyzed by GeneSpring software (Silicon Genetics, Redwood City, CA). The comparison of the hybridization efficiency and its complementary sequence was used to determine the presence of target gene. A single reference sample composed of a pool of DNA from HCC and non-neoplastic liver tissue was used throughout all hybridizations. Mismatch probes were used for specificity control and both the background and cross-hybridization signals were extracted directly. Measurement values were extracted for signal intensities as normalized ratios of sample versus reference, which represented the relative mRNA for each gene in each sample compared with the common reference.
Defective spots, ones that were substandard on the scanned imager or had negative values after background was subtracted, were first excluded. To minimize the effects of measurement variations introduced by artificial sources during experiments, we only included spots that had significant signals in both channels. The significance cutoff for the signal/background ratio is 1.4. For each spot, the median ratio was used in subsequent analyses. Spots representing housekeeping genes were used to normalize the entire slide so that all slides could be compared directly. For each sample, at least two hybridizations were carried out. The average of median ratios from replicates was calculated for each spot. We then used 2.0 SD as our cutoff for the determination of expression outlines.
Cell Culture, Northern Blot Analyses, and Preparation of GADD45β Probe
Northern blot was used to confirm the level of GADD45β expression. Normal human embryonic liver cell line CL-48 and the human hepatoma cell lines, HepG2 and Hep3B, were purchased from ATCC (American Type Culture Collection) and cultured in high glucose DMEM, 10% fetal bovine serum (FBS), and 1% P/S (100 units/ml penicillin and 100 μg/ml streptomycin) at 37°C and 5% CO2. Total RNA was isolated from the HCC and non-neoplastic liver tissues used for microarray analysis and from logarithmically growing CL-48, HepG2, and Hep3B cells using RNeasy Mini Kit (Qiagen). The RNA was electrophoresed in a 1.2% formaldehyde-agarose gel, blotted to a Hybond-N membrane (Amersham, Arlington, IL) and UV-cross-linked. 32P-labeled GADD45β probe was prepared according to the protocol of the random priming probe kit from Roche (Indianapolis, IN). The blots were hybridized for 1 hour at 68°C, washed twice with 2X SSC/0.1% SDS at room temperature, and then washed twice with 0.1X SSC/0.1% SDS at 60°C. After hybridization, membranes were exposed for 18 to 48 hours to Kodak XAR-5 film (Eastman Kodak, Rochester, NY) with intensifying screens and exposed to a phosphorimager screen for 18 hours, then read by a phosphorimager scanner. All experiments were repeated three times for confirmation. The DNA probe for GADD45β was generated by RT-PCR from CL-48 total RNA with the following primers: 5′- GGA CCC AGA CAG CGT GGT CCT CTG-3′ (sense primer starting with GADD45β cDNA nucleotide 247) and 5′-GTG ACC AGG AGA CAA TGC AGG TCT-3′ (antisense primer starting with GADD45β nucleotide 445). The 222-bp PCR product included GADD45β exon 3 sequence (according to the GADD45β sequence AF078077 in GenBank). The PCR conditions were as follows: 1 cycle of 50°C for 30 minutes; 1 cycle of 94°C for 2 minutes; 35 cycles of 94°C for 40 seconds, 60°C for 40 seconds, 72°C for 2 minutes; and 1 cycle of 72°C for 10 minutes. The product was purified and cleansed using a Gel Extract and Purification Kit (Qiagen).
Multiple Tissue Northern Blot Analyses of GADD45β
Multiple tissue Northern blots (MTN), obtained from Clontech (Palo Alto, CA), are hybridization-ready Northern blots prepared using Clontech’s high quality Premium RNA. The MTN membranes, which contain various normal human tissues (pancreas, kidney, skeletal muscle, liver, lung, placenta, brain, heart, leukocyte, colon, small intestine, ovary, testis, prostate, thymus, and spleen), were bound with approximately 2 μg/lane of full-length poly-A mRNA with no detectable genomic DNA contamination. To compare with the expression of GADD45α, another member of the GADD45 family, RT-PCR was used to synthesize DNA from normal CL-48 RNA with the primers: 5′- GCG AGA ACG ACA TCA ACA TC -3′ (sense primer starting with GADD45α cDNA nucleotide 531) and 5′- ATT GAT CCA TGT AGC GAC TT -3′ (antisense primer starting with GADD45α nucleotide 730), generating a 219-bp product according to the GADD45α sequence XM_001607 in GenBank. The RT-PCR parameters were the same as those used for GADD45β. Preparation of 32P-labeled probes and the conditions for the Northern blot hybridization the same as described above. A 32P-labeled β-actin probe was used as loading control. Membranes were exposed for 24 hours to Kodak XAR-5 film and phosphorimager screen, then scanned by phosphorimager scanner. The experiment was performed in duplicate for confirmation.
Patients and Specimens
For immunohistochemical studies, 85 cases of HCC were retrieved from surgical pathology files at City of Hope National Medical Center, St. Vincent Hospital, Eastern Hepatobiliary Surgery Hospital, and Ruijin Hospital. All samples were maintained in a highly controlled manner, insuring patient confidentiality. The tissues had been routinely fixed in 10% neutral formalin and embedded in paraffin. Multiple 4.0-μm sections were cut. A hematoxylin and eosin (H&E)-stained section was examined to confirm the diagnosis and tumor type. For specific expression study, colon cancer, breast cancer, prostate cancer, squamous cell cancer, lymphoma, and leiomyosarcoma tissues were used and 12 cases for each type of cancer were selected in the immunohistochemistry (IHC) study for GADD45β expression.
Immunohistochemistry Study of GADD45β, GADD45α, and Mutant p53 Protein
Paraffin sections were deparaffinized in xylene and rehydrated in a graded alcohol series followed by blocking in 1:20 normal horse serum. The primary goat anti-human polyclonal GADD45β antibody (200 μg/ml, Santa Cruz Biotechnology, Santa Cruz, CA) was used irretrievably in a 1:8000 dilution in a humid container overnight and washed three times (5 minutes each) with phosphate-buffered saline plus 0.2% Tween (PBST). The slides were then incubated with biotinylated anti-goat IgG antibody (Vector Laboratories, Burlingame, CA) at a dilution of 1:200 followed by three washes (5 minutes each) of PBST. Then, after a 45-minute incubation with AB Complex (Vector Elite Kit, 1:200 dilution) and three washes, DAB (0.05g DAB and 100 μl 30% H2O2 in 100 ml PBS) and 1% copper sulfate were applied for 5 and 10 minutes, respectively. Each slide was counterstained with Mayer’s hematoxylin. The primary rabbit anti-human polyclonal GADD45α antibody (200 μg/ml, 1:10 dilution, Santa Cruz Biotechnology) was used as a control for IHC. To examine the relationship between GADD45β and mutant p53, the primary mouse anti-human p53 protein mutant forms monoclonal antibody (NCL-p53-DO7, 1:300 dilution, Novocastra Laboratories, United Kingdom) was used for IHC study, which represents the multiple mutant forms p53 mutant protein; the method of staining was conducted as described above. For all IHC studies, PBS was used as a negative control. Granular cytoplasmic stain was accessed as positive. The evaluation of staining intensity was performed by three independent observers.
Scoring and Data Analysis
The diagnosis of HCC, tumor cell differentiation, the nuclear grade and growth pattern were assessed based on the examination of H&E-stained sections, according to the Edmondson’s grade and nuclear grade criteria. 6,10 Briefly, well differentiated HCC was composed of cells with minimal atypia and an increased nuclear/cytoplasmic ratio. In moderately differentiated HCC, tumor cells were arranged in trabeculae of three or more cells in thickness and had abundant eosphilic cytoplasm and round nuclei with distinct nucleoli. In poorly differentiated HCC, tumor cells have an increased nuclear/cytoplasmic ratio, frequent pleomorphism and bizarre giant cells. Nuclear grade was classified in a four-tiered system. Nuclear grade I HCC was comprised of adenoma-like cells that had abundant cytoplasm and showed little variation in size and shape and was closely similar to benign hepatocyte nuclei, with an even distribution of chromatin. Nuclear grade II HCC contained cells with large, prominent nucleoli, some degree of nuclear membrane irregularity, and chromatin clumping. Usually greater nuclear pleomorphism, angulated nuclei, and occasional multinucleated cells characterized grade III. Grade IV was noted for its distinct pleomorphism, hyperchromatism, and anaplastic giant cells. Tumor growth pattern was also classified according to its architecture: trabecular, compact, pseudoglandular, cirrhosis, and solide. In cases that had several architectural patterns, the predominant one was captured for the statistics. The staining pattern of GADD45β was classified in a subjective spectrum of 0 to 3: 0, negative expression in tumor tissue; 1, weak staining; 2, moderate staining; and 3, strong staining. For each level of staining, the percentage of cells with that score was estimated visually. A combined weighed score, consisting of the sum of the percentage of cells staining at each intensity level, was calculated for each sample. In each case, staining of GADD45β in matched surrounding non-neoplastic hepatocytes was evaluated at the same time. For GADD45α staining, the difference between neoplastic cells and non-neoplastic hepatocytes was compared in the same manner. Statistical tests of expression differences for GADD45β in HCC and surrounding non-neoplastic liver tissue were conducted using the non-parametric Wilcoxon signed rank test. The association between the expression of GADD45β and clinicopathologic parameters was examined with the Kruskal-Wallis test. The relationship of patients’ demographic features, such as age, gender, and hepatitis B status, to GADD45β expression was examined with the F-statistic test for linear effects and non-parametric Kruskal-Wallis test for singly ordered tables. S-Plus 6.0 and StatXact-4 statistical analysis software were used and significance was defined as P < 0.05.
Quantitative Analysis of mRNA Expression of GADD45β by Real-Time PCR
To further confirm and validate the results of IHC study, quantitative real-time PCR was used to measure the GADD45β mRNA expression in liver cancer tissue and matched non-neoplastic liver tissue. The six fresh-frozen HCC tissues and corresponding non-neoplastic tissues for real-time PCR were selected from 85 HCC cases. The tissues were confirmed by histopathological examination to validate the adequate HCC cells in the tumor samples. No HCC cells contaminated in non-neoplastic liver tissues were reassured before further approach. RNAs isolated from the selected samples were treated using RNA-free Dnase I (Promega, Madison, WI) according to the protocol to remove contaminated DNA. The cDNA was reverse-transcribed from total RNA using AMVRT and Oligo(dT)12–18 primer. To avoid the background of products amplified from genomic DNAs, primers and TaqMan probes for detecting expressions of GADD45β and GAPDH were designed to exist on two different exons. The forward primer 5′-GGG, TGT, ACG, AGT, CGG, CCA, A-3′, reverse primer 5′-TGG, CCA, AGA, GGC, AGA, GGA-3′, and probe 5′-FAM-TTG, ATG, AAT, GTG, GAC, CCA, GAC, AGC, GTG-TAMRA-3′ were used for amplification of GADD45β. The Pre-Developed TaqMan Assay Reagents Control Kit (Perkin-Elmer Applied Biosystems, Foster City, CA), that includes forward, reverse primer, and VIK-probe of GAPDH, was used as internal control. As positive control, GADD45β-pEGFP plasmid and GAPDH-pT7T3D-PAC plasmid, which contains the full-length GADD45β and GAPDH structure genes, respectively, were used to generate the standard curve. The PCR reaction solution included cDNA, 5 pmol of forward and reverse primers, 10 pmol of probe and TaqMan Universal PCR Master Mix. The PCR conditions were as follows: 1 cycle of 50°C for 2 minutes, 95°C for 10 minutes; 40 cycles of 95°C for 15 seconds, 60°C for 60 seconds. Each data point was performed in duplicate.
Quantitation of gene expression was performed using the ABI PRISM 7700 Sequence Detection System (Perkin-Elmer Applied Biosystems) according to the Pre-Developed TaqMan Assay Reagents Gene Expression Quantification Protocol. The normalized reporter signal was defined as the ratio of intensity of fluorescence reporter dye FAM or VIK and the passive reference dye TRMRA. The threshold line was determined as 10 times the SD of the baseline fluorescence signal. After reaching the threshold, the sample was designed positive, and threshold cycle (Ct) was defined as cycle number at this point. Standard curves for GADD45β and GAPDH were generated using serial dilution. The mRNA amount of GADD45β and GAPDH were calculated according to the standard curve. The transcripts of GADD45β were standardized using quantitation of GAPDH transcripts. The ratio of GADD45β mRNA and GAPDH mRNA determined the normalized mRNA amount of GADD45β.
Results
Analysis of Microarray Result of Human HCC and Matched Non-Neoplastic Liver Tissue
To understand the characterization of gene expression in HCC and to better identify the processes involved in the cellular transformation from normal to neoplastic, global gene expression profiling with microarray was used to analyze the expression level change of 12,588 genes and oligos in HCC tissue and matched non-neoplastic liver tissue. The result of microarray was confirmed at four replicates and analyzed by designated software. To identify genes that exhibited the most significantly different expression in HCC compared to matched non-neoplastic liver cell, we normalized the gene expression ratio as described in the Material and Methods section. There were a total of 59 genes that met the analysis criteria for differential expression, 30 genes for overexpression, and 29 genes for underexpression. The list of gene over- and underexpression profiles was outlined in Table 1 ▶ .
Table 1.
Difference of Gene Expression Level in HCC Compared with Normal Liver in Microarray Analysis
| Gene name | Coding no. |
|---|---|
| Least expressed genes in hepatocellular carcinoma | |
| GADD45beta | 39822 |
| Human retina cDNA sequence | 33845 |
| Homo sapien mRNA for prealbumin | 32252 |
| Human fetal brain cDNA clone | 39033 |
| Human insulin-like growth factor binding protein gene | 1232 |
| Homo sapien mRNA for TGF-betaIIR alpha | 1815 |
| Human pre-B cell enhanceing factor mRNA | 33849 |
| Human glucose-6-phosphatase mRNA | 36421 |
| Human mRNA for Apo1 | 33631 |
| Beta-fibrinogen precursor | 37019 |
| Human mRNA for putative progesterone binding protein | 38802 |
| Human monoamine oxidase A mRNA | 41772 |
| Cytochrome P-450 HFLa | 32705 |
| Homo sapien zinc finger protein 216 splice variant 1 mRNA | 41542 |
| Homo sapien gene for serum amyloid P component | 38890 |
| Heterogeneoys nuclear ribonucleprotein H | 41292 |
| ADH beta-1-subunit | 35730 |
| Human phosphoenolpyruvate carboxykinase gene | 33703 |
| Human mRNA for alpha 1-acid glycoprotein (orosomucoid) | 35315 |
| Aldehyde dehydrogenase 1 | 32747 |
| Human flavin-containing monooxygenase form II | 40665 |
| Human mRNA for fibronectin | 31719 |
| Human glycerol-3-phosphate dehydrogenase | 33991 |
| Beta-2-glycoprotein I | 39393 |
| Polyubiquitin Ubc | 32334 |
| Homo sapiens mRNA for beta 2-microglobulin | 34644 |
| Nucleic acid binding protein gene | 32841 |
| Homo sapiens mRNA for haptoglobin related protein | 36984 |
| Human IL-6 beta protein | 1052 |
| Most overexpressed genes in hepatocellular carcinoma | |
| Xeroderma pigmentosum group E (XPE) | 1641 |
| Creatine kinase B | 40862 |
| Ribosomal protein | 33676 |
| Translational intiation factor EIF-2, alpha subunit | 1154 |
| Homo sapiens GTP binding protein mRNA complete code | 38708 |
| Alpha collagen precursor | 35379 |
| BAX delta | 1998 |
| Human cytochrome P450 (CYP2A13) | 1552 |
| Homo sapiens mRNA for lipocortin II | 769 |
| Liver-type ATP synthase gamma-subunit | 40115 |
| Human mRNA for elongation factor-1-beta | 35748 |
| Human CDC2-related protein kinase mRNA | 1793 |
| Elongation factor-1-gamma | 1676 |
| Human phosphogluconate dehydrogenase | 36963 |
| mRNA for erythropoietin receptor | 396 |
| Homo sapiens mitochondrial proteolipid | 38967 |
| Human G protein-coupled receptor | 1097 |
| Proton pump 58kD subunit | 32959 |
| Thioredoxin reductase | 39425 |
| alpha 1 (VIII) collagen | 37459 |
| Glutathione S-transferase | 31919 |
| Homo sapiens NADH-ubiquinone oxidoreductase subunit CI-SGDH | 32232 |
| Prothymosin alpha 1 | 38590 |
| Beta-thromboglobulin-like protein precursor | 35372 |
| Nucleoside diphosphate kinase | 35005 |
| Phosphoglycerate mutase | 41221 |
| H3.3 histone | 254 |
| Angiotensin II type 1 b receptor | 346 |
| Major centromere autoantigen CENP-B | 37931 |
| Zinc-finger DNA-binding protein | 315 |
In further comparison and analyses, we divided 59 over- or underexpressed genes into four classes: housekeeping, functional, and structure genes in normal liver; abnormally expressed genes which are associated with precancerous tissue, such as liver cirrhosis; other genes which have not shown any strong association with cancer; and tumor-related genes which changed drastically in the process of hepatocarcinogenesis. In class 1 genes, we found that glucose-6-phophatase gene, Apo1 lipoprotein gene, aldehyde dehydrogenase 1 gene, phosphoenolpyruvate carboxykinase gene, glycerol-3-phosphate dehydrogenase gene, cytochrome P-450 HFLa, monoamine oxidase A, and many other liver function or structure-related gene were down-regulated in HCC. On the other hand, such genes as phosphogluconate dehydrogenase gene, liver-type ATP synthase γ-subunit gene, erythropoietin receptor, G protein-coupled receptor NADH-ubiquinone oxidoreductase, and others, were overexpressed in HCC. These results revealed the functional change in HCC and were consistent with decline of liver function in advance liver diseases or/and liver regenerational repair response. In class 2 genes, several precancerous tissue-related genes were identified in the overexpression profile, such as α collagen precursor, α 1 collagen gene, and the BAX gene. In the class 3 profile, there are many genes identified expression change, however, these genes were barely reported previously and little data are available about the detailed function or regulation of these genes that need further study and may be important in observing the mechanisms behind the evolution of cancer.
We took a close look at the expression change of tumor-related gene in class 4 profiling. Among them, GADD45β, a DNA damage and cell cycle arrest-related gene, represented the most significantly low expression in HCC. Down-regulated human retina gene may correlate with progression of ocular melanoma metastasis to liver. The XPE gene, which is involved in DNA repair, has been reported to overexpress in human cancer. Identification of EIF-α subunit up-regulation in HCC is expected because EIF-2 is a key upstream signal cascade regulator in response to stress. Although the overexpressed genes represent greater potential as targets for design of small molecular inhibitors, the underexpressed genes are possible candidates for gene therapy. Therefore, in this study, we focused on the validation of underexpressed gene, GADD45β, and tried to understand the mechanism between DNA damage and HCC.
Northern Blot Validation of Expression of GADD45β in Human HCC, Matched Non-Neoplastic Liver Tissue, and Cell Lines
To validate the microarray data, we further investigated the expression of GADD45β, which showed down-regulated expression in the DNA microarray, using Northern blots. The GADD45β gene exhibited very strong expression in non-HCC liver tissue as opposed to matched liver cancer tissue. The GADD45β was down-regulated in HepG2 and Hep3B HCC cancer cell clones but was strongly expressed in CL-48 human normal embryonic liver cell lines, which further reinforced the hypothesis that this down-regulation is HCC-specific. Under the Image Quantity measurement, the expression of GADD45β from HCC tissue or cell lines was approximately 1% of its expression in non-neoplastic liver tissue or CL-48 cells relative to the internal control by GAPDH (Figure 1) ▶ . Therefore, our Northern blot analysis tended to agree with the expression patterns generated by microarray data.
Figure 1.

Northern blot validation of GADD45β expression in matched non-neoplastic liver tissue and cell lines. RNA from liver cancer tissue and matched non-neoplastic liver tissue, and from the cell lines HepG2, Hep3B, and CL-48 were analyzed by Northern blot to confirm the DNA microarray results. The blot was probed with a 222-bp PCR product that included GADD45β exon 3. The RT-PCR product was generated based on the GADD45β sequence AF078077 in GenBank. GAPDH was used as an internal control for RNA loading.
Distinct Tissue-Specific Expression of GADD45β and GADD45α in Normal Human Tissues
To determine whether GADD45 gene family members are differentially expressed in a tissue-specific manner, we examined the expression of the human GADD45β and GADD45α mRNAs in human normal multiple tissue blot membranes that contain 16 tissues using 32P-radioactive-labeled cDNA probe. As shown in Figure 2 ▶ , the GADD45β mRNA was readily detected in kidney, liver, and lung, suggesting that GADD45β gene expression may be associated with detoxifying tissues. Like GADD45β, GADD45α mRNA was detected in most tissues, but it was notably increased in skeletal muscle tissue. Interestingly, less GADD45 expression in digestive organs (such as pancreas, colon, and small intestine) with the exception of the liver suggests a different biological function of GADD45 gene in the liver. The quantitative analysis was performed using ImageQuant Version 5.0 and results were shown in Figure 2 ▶ . Although the presence of widely varied expression levels, GADD45α and β both had the highest expression in normal liver tissue, which suggests that both genes may primarily function in the liver.
Figure 2.

Expression of GADD45β and GADD45α varies in different normal human tissues. The expression of GADD45α and GADD45β in several different normal human tissues was studied by Northern blot. A commercially available multiple tissue blot was probed for GADD45α and GADD45β as described in the Materials and Methods section. The quantitative analysis was performed using ImageQuant Version 5.0 and β-actin was used as loading control.
Immunohistochemistry Study of GADD45β and GADD45α in Liver Cancer and Matched Non-Neoplastic Liver Tissue
To validate the specificity of DNA microarray and Northern blot, the IHC analyses were performed in paraffin sections of HCC with surrounding non-neoplastic liver tissues (Figure 3) ▶ . Immunostaining was counted by reviewing 10 high power fields (×400). The analysis was performed in the most densely cellular areas. Areas having necrosis or fibrosis were excluded. Of 85 HCC cases, cirrhotic, trabecular, psuedoglandular, solid, compact, and undifferentiated type had 5, 39, 8, 14, 18, and 1 cases, respectively. The H&E staining was examined first and used as control. The staining pattern of GADD45β was a diffuse brownish cytoplasmic one. Less intense staining in stromal cells and vascular bundles were observed. Bile ductal epithelial cells, vascular epithelial cells and fibrotic tissue lacked detectable staining. Infiltrated lymphocytes, Kupffer’s cells, and smooth muscle cells show weak staining. The GADD45β immunostaining was predominantly localized in the non-neoplastic hepatic cells, with lower levels in the cirrhotic tissues. The difference in the distribution of GADD45β staining in the HCC area and non-neoplastic liver tissue was noticeable (Figure 3) ▶ . The staining pattern of GADD45α was examined and demonstrated a granular yellowish tint in cytoplasm. The immunostaining of GADD45α was mainly localized in the cytoplasm of non-neoplastic liver cells, but there was no apparent decrease in cancer tissue (Figure 3) ▶ . The results were analyzed by three observers and represent the typical finding here.
Figure 3.
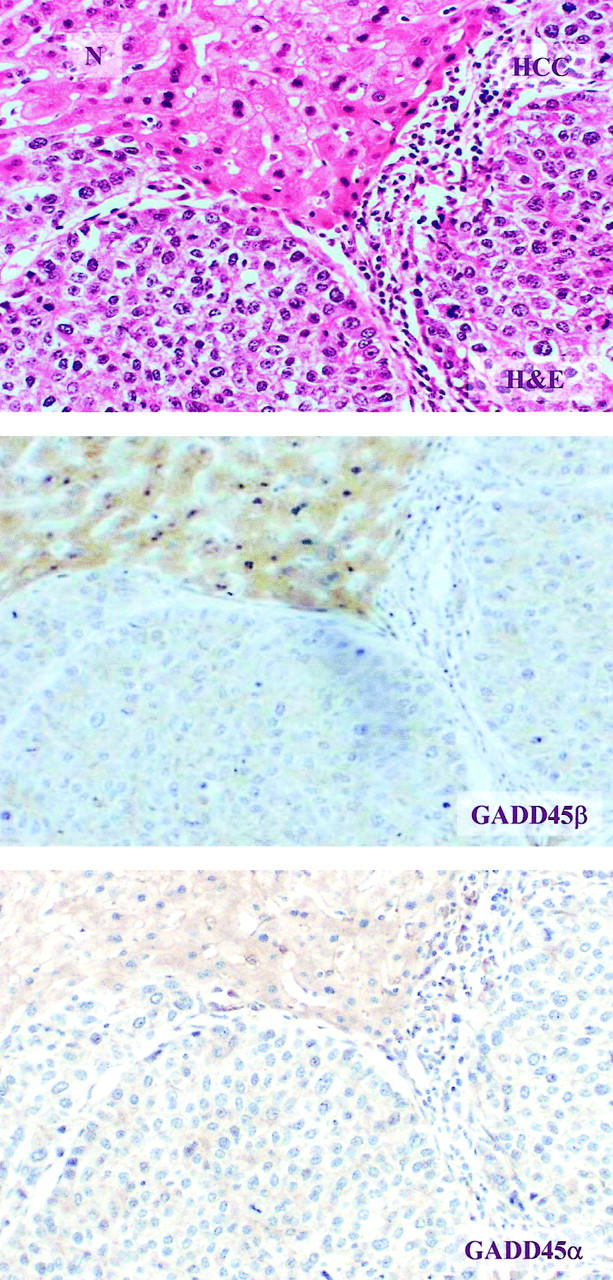
IHC of GADD45α and GADD45β in HCC and matched non-neoplastic liver tissue. The top panel shows an H&E-stained sample (×200). The N indicates normal liver tissue and HCC indicates liver cancer tissue. The middle panel is stained for GADD45β and shows a diffuse yellowish tint, predominantly in cytoplasm of normal cells (×200). The bottom panel is stained for GADD45α and shows a granular yellowish color in the cytoplasm of both normal and HCC cells (×200). The boundary between cancer tissue and non-cancerous tissue was separated by fibrotic tissue.
Quantitative Analysis of mRNA Expression of GADD45β by Real-Time PCR
The standard curve formulas Y = 40.722–3.885X (r2 = 0.984) for GADD45β and Y = 43.128–4.248X (r2 = 0.993) for GAPDH were derived from the lines of the calibration curves. The results from six liver cancer tissues and matched non-neoplastic liver tissue were plotted on the standard curve. The mRNA amount of GADD45β was calculated as mentioned above. The mean ratio GADD45β mRNA and GAPDH mRNA of HCC tissue was 0.0213, and the ratio of non-neoplastic liver tissue was 0.3432. The average mRNA amount of significantly less than that of non-neoplastic liver tissue (P < 0.01), compared with almost the same amount of GAPDH. The typical analysis result was shown in Figure 4 ▶ .
Figure 4.
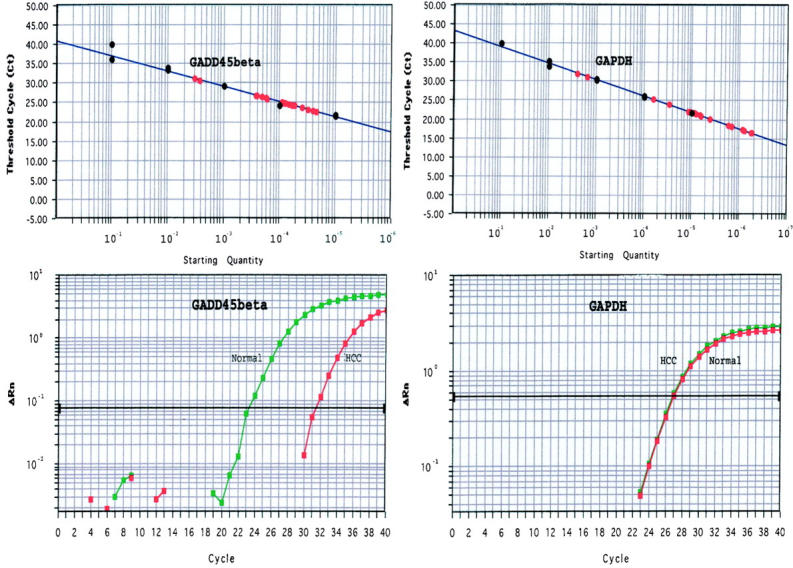
Standard curve and amplification plots of GADD45β and GAPDH of quantitative real-time PCR. The standard curves of GADD45β and GAPDH were shown in the two top panels and the x axis and y axis represent the dilution of RNA starting amount and Ct. The two bottom panels were the amplification plots of GADD45β and GAPDH from one pair of HCC tissue and non-neoplastic liver tissue. The x axis and y axis present the cycle number and Rn respectively. The GADD45β mRNA of HCC tissue is significantly lower than that of non-neoplastic liver tissue, compared with almost the same GAPDH mRNA amount of both tissues.
Low Expression of GADD45β is Liver Cancer-Specific
To confirm that the GADD45β expression is indeed specifically associated with HCC, multiple human tumor samples were cross-examined. Twelve cases of each different type of cancer were employed in this study by using IHC technique. This result confirmed that GADD45β exhibited high levels of staining in colon cancer, breast cancer, prostate cancer, lymphoma, squamous cell carcinoma, and leiomyosarcoma (data shown in part in Figure 5 ▶ ). There was no significant difference in the distribution of GADD45β staining in these neoplastic tissues and non-neoplastic surrounding cells. The staining was also predominant in the cytoplasm of benign cells and accumulated more in the nucleus of malignant cells. In the leiomyosarcoma and lymphoma, the GADD45β staining was predominately diffuse in the cytoplasm, and was more focal in breast cancer and colon cancer cells. Thus, our finding further suggested that underexpression of GADD45β was liver cancer-specific.
Figure 5.
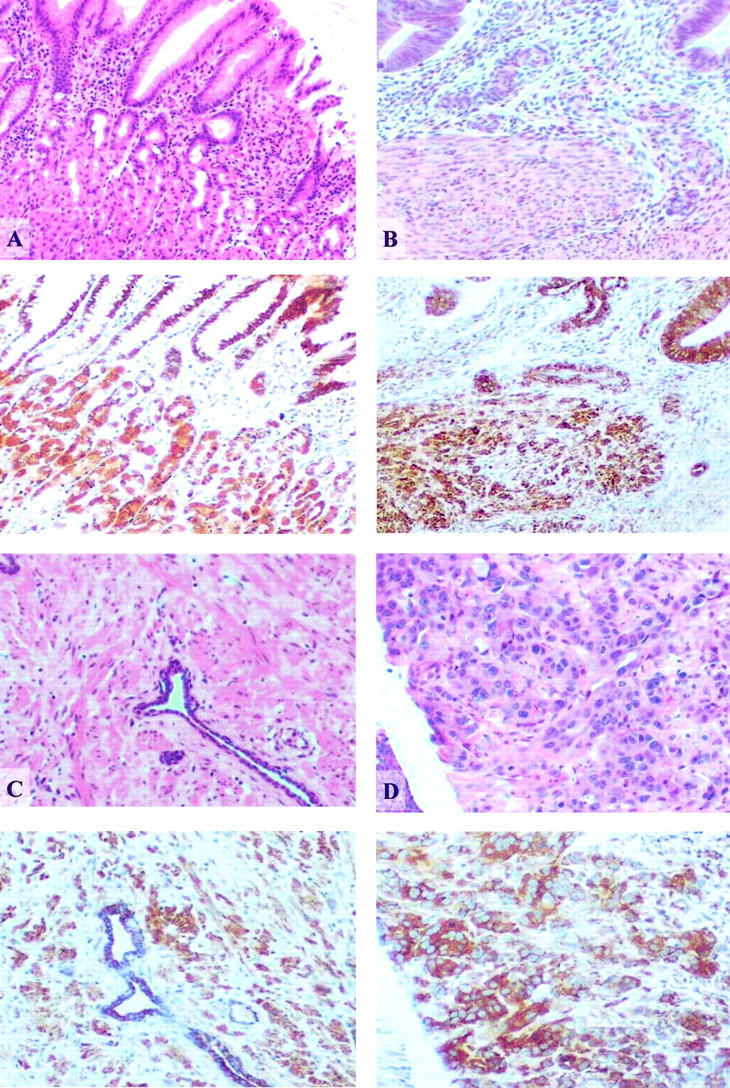
Down-regulation of GADD45β expression is HCC-specific. Immunohistochemical staining of various human cancer tissues confirmed that GADD45β was highly expressed in colon cancer (A), breast cancer (B), prostate cancer (C), and lymphoma (D). For each tissue type, the top panel is H&E-stained and the bottom panel is stained for GADD45β (yellowish color) (×100).
Clinicopathological Features Correlated with GADD45β Expression
We further examined the expression of GADD45β in 85 cases of HCC samples to confirm our above finding. Table 2 ▶ summarized the patients’ demographics, pathological factors, and GADD45β expression. The ages of the patients ranged from 26 to 89 years with a median age of 57.03 years. Sixty-seven percent were men (57 of 85) and 33% were women (28 of 85). The percentage of hepatitis B-positive status was 74% (63 of 85). The results of analysis of 85 HCC studied by IHC showed that GADD45β expression was decreased in 70 of 85 cases of HCC samples (82.35%). The majority of HCC cases had grade 1 staining (42.35%, 36 of 85). The grade 0 staining, which means lack of GADD45β expression in tumor tissue, was recorded in 12.94% (11 of 85) of the HCC. The 23 samples showed moderate staining (27.06%, 23 of 85) and the 15 samples showed as strong staining (17.65%, 15 of 85) as seen in normal liver tissue. The comparison of patients’ age was examined using the F-statistic test, and no significant difference exists (P = 0.6). Gender and the hepatitis B status were examined with non-parametric Kruskal-Wallis test for singly ordered tables, and results indicated no statistic significance (P > 0.05) associated with GADD45β expression.
Table 2.
Patient Demographic Features and GADD45β Expression (n = 85)
| Demographic features | n = 85 |
|---|---|
| Age (average) | 57.03 |
| Gender | |
| Male | 57 |
| Female | 28 |
| Hepatitis B | |
| Positive | 63 |
| Negative | 22 |
| GADD45β expression | |
| 0 | 11 (12.94%) |
| + | 36 (42.35%) |
| ++ | 23 (27.06%) |
| +++ | 15 (17.65%) |
Table 3 ▶ compared the expression of GADD45β in HCC and surrounding non-neoplastic liver tissues. Because some non-neoplastic liver tissues in paraffin blocks were inadequate for comparison, we compared expression of GADD45β between HCC and surrounding non-neoplastic liver tissue in only 63 cases. In comparison with HCC tissue, the surrounding non-neoplastic liver tissue showed 22.22% (14 of 63) moderate and 76.19% (48 of 63) strong staining for GADD45β. These results indicated significant down expression of GADD45 in malignant versus benign tissue (P < 0.01).
Table 3.
Comparing GADD45β Expression between HCC and Non-Neoplasmic Liver Tissue (n = 63)*
| GADD45β expression | HCC | Surrounding non-neoplastic liver tissue | |
|---|---|---|---|
| 0 | 6 | 0 | P < 0.01 |
| + | 28 | 1 | |
| ++ | 17 | 14 | |
| +++ | 12 | 48 |
* Due to some non-neoplastic liver tissues in slides being inadequate for comparison, the total case number was 63.
In addition, we examined the correlation between GADD45β expression and clinicopathological features, and results were summarized in Table 4 ▶ . The higher expression of GADD45β was observed in most well and moderately differentiated HCC samples. In 11 cases that lacked GADD45β expression, nine of them were poorly differentiated samples. In all well differentiated HCC samples, no deficiencies of GADD45β expression were found. In the same manner, higher nuclear grade samples demonstrated less GADD45β expression. A significant correlation was observed between cancer differentiation (P < 0.01) and nuclear grade (P < 0.01) based on Kruskal-Wallis statistical analysis. These findings suggested that HCC could be distinguished by a significant decrease of GADD45β, which is compatible with pathological factors in current clinical parameters. The association of GADD45β staining and HCC differentiation and nuclear grade was further illustrated in Figure 6 ▶ . The upper panels exhibit well-differentiated HCC and nuclear grade 1 while the lower panels show poor differentiation and nuclear grade 4. Staining of GADD45β is much greater for nuclear grade 1 HCC (top panel).
Table 4.
Relationship between GADD45β Expression, HCC Differentiation, and Nuclear Grade (n = 85)
| GADD45β expression | |||||
|---|---|---|---|---|---|
| 0 | + | ++ | +++ | ||
| Differentiation | |||||
| Well | 0 | 0 | 1 | 5 | P < 0.01 |
| Moderate | 2 | 13 | 19 | 7 | |
| Poor | 9 | 23 | 3 | 3 | |
| Nuclear grade | |||||
| 1 | 0 | 0 | 1 | 4 | P < 0.01 |
| 2 | 3 | 13 | 17 | 8 | |
| 3 | 7 | 22 | 5 | 3 | |
| 4 | 1 | 1 | 0 | 0 | |
Figure 6.
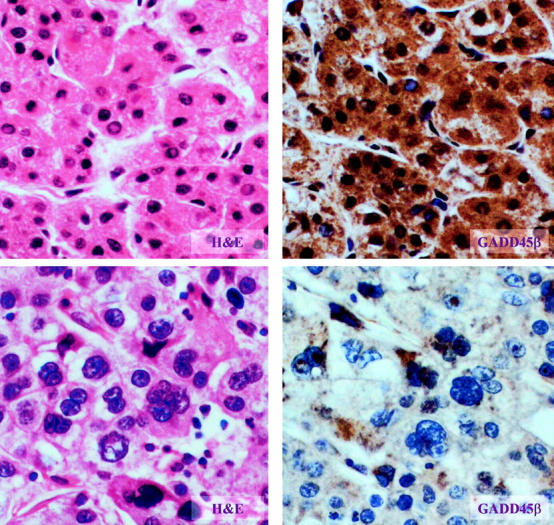
The association of GADD45β staining and HCC differentiation and nuclear grade. The association between GADD45β and HCC differentiation and nuclear grade was examined by IHC. The left panels are H&E-stained and the right panels are stained for GADD45β. The top panels exhibit well differentiated HCC and nuclear grade 1 (×200) while the bottom panels show poor differentiation and nuclear grade 4 (×400). Staining of GADD45β is much greater for nuclear grade 1 HCC (top panel).
The correlation between p53 and GADD45β was also explored and demonstrated in Figure 7 ▶ . The staining mode of p53 protein mutant forms was demonstrated in the black tint in nucleus of cells. The immunostaining of mutant p53 was mainly found in the HCC tissue and surrounding non-neoplastic tissue was negative for staining. The relationship between low expression of GADD45β and the mutant of p53 was then calculated using Fisher’s exact test and data summarized in Table 5 ▶ . In 85 cases of HCC, 65 cases were p53 mutant and 20 cases were p53 wild type. High expression of GADD45β was found in 14 of 20 cases of p53 wild type (70%, 14 of 20), whereas, in 65 cases of p53 mutant type, high expression of GADD45β was only observed in 24 cases (36.92%, 24 of 65). These results suggested that the expression of GADD45β may closely associate with the p53 mutant negatively (P < 0.05) (Table 5) ▶ . On the other hand, another member of GADD gene family, GADD45α, revealed no significant difference in its expression between HCC and non-neoplastic liver tissue (data not shown). These findings suggest that the down-regulation of GADD45β plays a critical role in HCC development.
Figure 7.
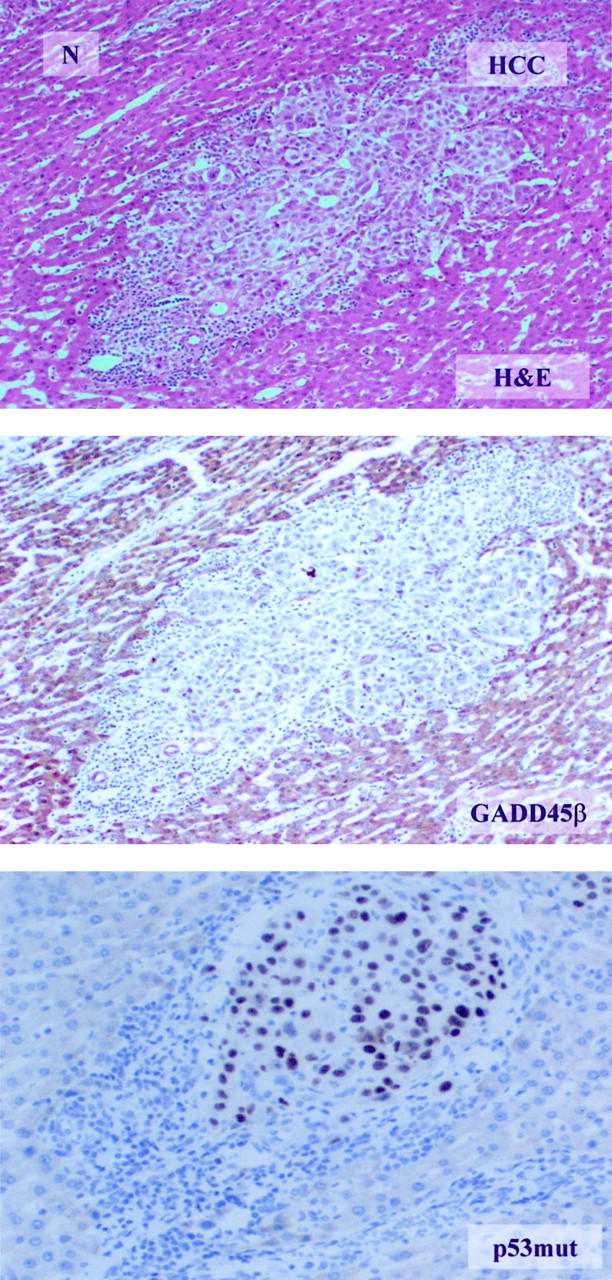
p53 mutant protein associated with down expression of GADD45β in HCC samples. The relationship between p53 mutation and GADD45β expression in HCC tissues is shown by IHC (×200). The top panel is H&E-stained. N indicates normal liver tissue and HCC indicates liver cancer tissue. GADD45β is stained in the middle panel while the bottom panel is stained with an antibody specific for mutant p53. Mutant p53 staining appears as a black tint in the nucleus of HCC cells while GADD45β staining appears only in the normal tissue.
Table 5.
Relationship between GADD45β Expression and p53 Mutant (n = 85)
| n | GADD45β expression | |||
|---|---|---|---|---|
| Low (0∼+) | High (++∼+++) | |||
| p53 mutant | 65 | 41 | 24 | P < 0.05 |
| p53 wild type | 20 | 6 | 14 | |
Discussion
To analyze genetic alterations in HCC, we compared the expression of 12,588 genes and oligos in four pairs of HCC tissue and matched non-neoplastic liver tissue. The microarray results were further confirmed by Northern blot. Among up- or down-regulated genes in HCC tissue relative to non-neoplastic liver tissue, GADD45β was the most significantly down-regulated gene. Because malignant cells are characterized by a failure to control growth, genes that are overexpressed in malignant cells and not detectable in normal tissues are frequently studied and used as targets for small molecule therapy. 11 However, since the accumulation of DNA damage and repair defects leads to late-stage carcinogenesis, reduced gene expression associated with functional defects or abnormal transcriptional regulation may represent a major influence in cell growth and provide good targets for gene therapy. Therefore, GADD45β, a negative growth-control gene that is implicated in DNA damage, cell cycle arrest, and apoptosis, was focused on here.
Eighty-five cases of HCC were studied to assess whether the down-regulation of GADD45β found in the microarray analyses reflected the clinical situation. Statistical analysis confirmed that decreased expression of GADD45β correlated significantly with pathological factors including HCC differentiation and nuclear grade (P < 0.01). In precancerous tissue, liver cirrhosis displayed partial down-regulation of GADD45β, whereas in non-neoplastic liver tissues, GADD45β expression was stronger. Compared to GADD45β, GADD45α had relatively high expression, not only in non-neoplastic liver tissue but also in HCC tissue. We further examined the expression of GADD45β in other cancer tissues of both epithelial and mesenchymal origin. Low expression of GADD45β was specifically associated with HCC and not seen in other human cancers. IHC results were further validated by quantitative real-time PCR study. Therefore, GADD45β may be a unique marker associated with the DNA damage repair process of hepatocarcinogenesis.
Up to now, three members of GADD45 gene family, GADD45α, GADD45β, and GADD45γ, have been identified based on the extensive region of conserved sequence and induction following DNA damage and/or other environmental stresses. 12-15 GADD45β was first identified as a myeloid differentiation primary response gene activated in murine myeloid leukemia cells (M1) by IL-6 on induction of terminal differentiation and associated with growth arrest and apoptosis. 16 GADD45β shares the common function of GADD45 family which has been associated with influence over cell growth control, apoptotic cell death, and cellular response to DNA damage. 16-19 Overexpression of GADD45β has been shown to inhibit cell growth in a variety of human tumor cell lines and in NIH3T3 fibroblasts, resulting in suppression of colony formation. 16 GADD45α is required for the activation of a G2/M checkpoint induced by either UV radiation or alkylating agents in a p53-dependent pattern. 17,18,20 Although GADD45β and GADD45α share extensive sequence similarity and appear to have very similar biological and biochemical effects, the individual family members display distinct patterns of expression and regulation. 15,17,21,22 In our study, GADD45β showed low expression only in HCC while GADD45α was expressed at similar levels in both tumor and non-tumor tissue. This finding suggests that different members of the GADD45 gene family have different tumor specificity as well as tissue specificity. Thus, their roles in response to genotoxic stresses may be different.
In some human cancers, epidemiological and molecular studies show that loss of DNA repair capacity is associated with specific hereditary tumor types. For example, mismatch repair defects are associated with hereditary non-polypsis colon cancer and nucleotide excision repair defects found in xeroderma pigmentosum. 23 However, DNA damage and repair defects that lead to increased tumorogenesis involve multiple factors. Defects in p53, p21, cyclins, or growth suppression genes such as the GADD45 gene family could be involved. 24 Since the liver is a very important metabolic organ in humans, hepatocytes are readily damaged by such things as chemical agents, viral infections, or accumulated metabolic products. In many cases, HCC is known to result from environmental exposures such as hepatitis virus, alfatoxin, alcohol, or other in vivo or in vitro genotoxins. However, the data to support a role for DNA damage in hepatocarcinogenesis is still quite limited. 21 The human HCC-prone disorders, such as liver cirrhosis, share a very close relationship with genotoxic DNA damage and mutations of known DNA repair genes. 25 In our study, we found that HCC had a very specific and unique low expression of the DNA damage and apoptosis control gene, GADD45β, which was consistent with the pathological assessment of the malignancy. This result suggested that HCC cells might lack a proper response to DNA damage, leading to a failure to inhibit atypical cell growth and trigger apoptosis. In this scenario, under chronic genotoxic stress, the failure to initiate DNA repair and control growth may contribute to liver carcinogenesis. In the precancerous disease, liver cirrhosis, we observed a partial decrease in the expression of GADD45β, which could lead to insufficient DNA repair and failure to arrest cell cycle, triggering hepatocarcinogenesis (data not shown).
The p53-associated DNA damage repair pathway constitutes a very complicated network and the GADD45 gene family has been reported to be a downstream effecter of p53 required for cell cycle arrest following DNA damage. 26 GADD45β plays an important role in this network by interacting with PCNA, p21, 24,27 the core histones, the stress-inducible MTK1/MEKK4 kinase, and Cdk1, 12 but how this multitude of interactions modulates negative growth control has not been established. In our study, low expression of GADD45β in HCC cells was associated with mutant p53. These results support the viewpoint that normal p53 function is involved in the regulation of this gene. The suppression of GADD45β led to dysfunction of damage recognition, cell cycle arrest, and apoptosis initiation, all of which are important in carcinogenesis. Based on these observations, we hypothesize that suppression of GADD45β may be p53-dependent, supporting the involvement of p53 in hepatocarcinogenesis. Therefore, in a multi-stage model of liver carcinogenesis, changes in GADD45β expression may compromise growth control mechanisms making cells susceptible to malignant transformation by additional cellular events.
In summary, GADD45β was significantly underexpressed in HCC when compared to matched non-neoplastic liver tissue. The decreased expression of GADD45β was specific to HCC and consistent with the degree of HCC malignancy. Therefore, our results suggest that reduced expression of GADD45β plays an important role in HCC carcinogenesis. The induction of GADD45β expression and transcriptional regulation in HCC are under investigation. The molecular basis of the down-regulation of GADD45β in liver disease will be further elucidated and could lead to newer diagnostic tools, prognostic markers, and therapeutic modulation for HCC.
Footnotes
Address reprint requests to Yun Yen, M.D., Ph.D., F.A.C.P., City of Hope National Medical Center, 1500 E. Duarte Road, Duarte, CA 91010-3000. E-mail: yyen@coh.org.
Supported by the Parsons Foundation.
References
- 1.El-Serag HB, Mason AC: Rising incidence of hepatocellular carcinoma in the United States. N Engl J Med 1999, 340:745-750 [DOI] [PubMed] [Google Scholar]
- 2.Crabtree TD, Foley EF, Sawyer RG: Liver. Crabtree TD eds. General Surgery. 2000:pp 354-358 Maryland, Lippincott Williams & Wilkins Baltimore
- 3.Venook AP: Hepatocellular carcinoma. Curr Treat Options Oncol 2000, 1:407-415 [DOI] [PubMed] [Google Scholar]
- 4.Camma C, Schepis F, Orlando A, Albanese M, Shahied L, Trevisani F, Andreone P, Craxi A, Cottone M: Transarterial chemoembolization for unresectable hepatocellular carcinoma: meta-analysis of randomized controlled trials. Radiology 2002, 224:47-54 [DOI] [PubMed] [Google Scholar]
- 5.Kao JH, Chen DS: Recent research progress in hepatocellular carcinoma. J Formos Med Assoc 2002, 101:239-248 [PubMed] [Google Scholar]
- 6.Edmondson H, Steiner P: Primary carcinoma of the liver: a study of 100 cases among 48,900 biopsies. Cancer 1954, 7:462-503 [DOI] [PubMed] [Google Scholar]
- 7.Moch H, Kononen T, Kallioniemi OP, Sauter G: Tissue microarrays: what will they bring to molecular and anatomic pathology? Adv Anat Pathol 2001, 8:14-20 [DOI] [PubMed] [Google Scholar]
- 8.Snijders AM, Meijer GA, Brakenhoff RH, van den Brule AJ, van Diest PJ: Microarray techniques in pathology: tool or toy? Mol Pathol 2000, 53:289-294 [DOI] [PMC free article] [PubMed] [Google Scholar]
- 9.Graveel CR, Jatkoe T, Madore SJ, Holt AL, Farnham PJ: Expression profiling and identification of novel genes in hepatocellular carcinomas. Oncogene 2001, 20:2704-2712 [DOI] [PubMed] [Google Scholar]
- 10.Lauwers GY, Terris B, Balis UJ, Batts KP, Regimbeau JM, Chang Y, Graeme-Cook F, Yamabe H, Ikai I, Cleary KR, Fujita S, Flejou JF, Zukerberg LR, Nagorney DM, Belghiti J, Yamaoka Y, Vauthey JN: The International Cooperative Study Group on Hepatocellular Carcinoma. Prognostic histologic indicators of curatively resected hepatocellular carcinomas: a multi-institutional analysis of 425 patients with definition of a histologic prognostic index. Am J Surg Pathol 2002, 26:25-34 [DOI] [PubMed] [Google Scholar]
- 11.Cole KA, Krizman DB, Emmert-Buck MR: The genetics of cancer: a 3D model. Nat Genet 1999, 21(Suppl 1):38-41 [DOI] [PubMed] [Google Scholar]
- 12.Takekawa M, Saito H: A family of stress-inducible GADD45-like proteins mediate activation of the stress-responsive MTK1/MEKK4 MAPKKK. Cell 1998, 95:521-530 [DOI] [PubMed] [Google Scholar]
- 13.Nakayama K, Hara T, Hibi M, Hirano T, Miyajima A: A novel oncostatin M-inducible gene OIG37 forms a gene family with MyD118 and GADD45 and negatively regulates cell growth. J Biol Chem 1999, 274:24766-24772 [DOI] [PubMed] [Google Scholar]
- 14.Zhan Q, Lord KA, Alamo I, Jr, Hollander MC, Carrier F, Ron D, Kohn KW, Hoffman B, Liebermann DA, Fornace AJ, Jr: The GADD and MyD genes define a novel set of mammalian genes encoding acidic proteins that synergistically suppress cell growth. Mol Cell Biol 1994, 14:2361-2371 [DOI] [PMC free article] [PubMed] [Google Scholar]
- 15.Zhang W, Bae I, Krishnaraju K, Azam N, Fan W, Smith K, Hoffman B, Leibermann DA: CR6: a third member in the MyD118 and GADD45 gene family which functions in negative growth control. Oncogene 1999, 18:4899-4907 [DOI] [PubMed] [Google Scholar]
- 16.Abdollahi A, Lord KA, Hoffman-Liebermann B, Liebermann DA: Sequence and expression of a cDNA encoding MyD118: a novel myeloid differentiation primary response gene induced by multiple cytokines. Oncogene 1991, 6:165-167 [PubMed] [Google Scholar]
- 17.Fornace AJ, Jr, Jackman J, Hollander MC, Hoffman-Liebermann B, Leibermann DA: Genotoxic-stress-response genes and growth-arrest genes. GADD, MyD, and other genes induced by treatments eliciting growth arrest. Ann NY Acad Sci 1992, 663:139-153 [DOI] [PubMed] [Google Scholar]
- 18.Heinemeyer T, Chen X, Karas H, Kel AE, Kel OV, Liebich I, Meinhardt T, Reuter I, Schacherer F, Wingender E: Expanding the TRANSFAC database towards an expert system of regulatory molecular mechanisms. Nucleic Acids Res 1999, 27:318-322 [DOI] [PMC free article] [PubMed] [Google Scholar]
- 19.Selvakumaran M, Lin HK, Sjin RT, Reed JC, Liebermann DA, Hoffman B: The novel primary response gene MyD118 and the proto-oncogenes myb, myc, and bcl-2 modulate transforming growth factor β1-induced apoptosis of myeloid leukemia cells. Mol Cell Biol 1994, 14:2352-2360 [DOI] [PMC free article] [PubMed] [Google Scholar]
- 20.Hollander MC, Alamo I, Jackman J, Wang MG, McBride OW, Fornace AJ, Jr: Analysis of the mammalian GADD45 gene and its response to DNA damage. J Biol Chem 1993, 268:24385-24393 [PubMed] [Google Scholar]
- 21.Hollander MC, Kovalsky O, Salvador JM, Kim KE, Patterson AD, Haines DC, Fornace AJ, Jr: Dimethylbenzanthracene carcinogenesis in GADD45a-null mice is associated with decreased DNA repair and increased mutation frequency. Cancer Res 2001, 61:2487-2491 [PubMed] [Google Scholar]
- 22.Zhan Q, Antinore ML, Wang XW, Carrier F, Smith ML, Harris CC, Fornace AJ, Jr: Association with Cdc2 and inhibition of Cdc2/Cyclin B1 kinase activity by the p53-regulated protein GADD45. Oncogene 1999, 18:2892-2900 [DOI] [PubMed] [Google Scholar]
- 23.Ishikawa T, Ide F, Qin X, Zhang S, Takahashi Y, Sekiguchi M, Tanaka K, Nakatsuru Y: Importance of DNA repair in carcinogenesis: evidence from transgenic and gene targeting studies. Mutat Res 2001, 477:41-49 [DOI] [PubMed] [Google Scholar]
- 24.Smith ML, Ford JM, Hollander MC, Bortnick RA, Amundson SA, Seo YR, Deng CX, Hanawalt PC, Fornace AJ, Jr: p53-mediated DNA repair responses to UV radiation: studies of mouse cells lacking p53, p21, and/or GADD45 genes. Mol Cell Biol 2000, 20:3705-3714 [DOI] [PMC free article] [PubMed] [Google Scholar]
- 25.Rocken C, Carl-McGrath S: Pathology and pathogenesis of hepatocellular carcinoma. Dig Dis 2001, 19:269-278 [DOI] [PubMed] [Google Scholar]
- 26.Kastan MB, Zhan Q, el-Deiry WS, Carrier F, Jacks T, Walsh WV, Plunkett BS, Vogelstein B, Forance AJ, Jr: A mammalian cell cycle checkpoint pathway utilizing p53 and GADD45 is defective in ataxia-telangiectasia. Cell 1992, 71:587-597 [DOI] [PubMed] [Google Scholar]
- 27.Vairapandi M, Balliet AG, Fornace AJ, Jr, Hoffman B, Liebermann DA: The differentiation primary response gene MyD118, related to GADD45, encodes for a nuclear protein which interacts with PCNA and p21WAF1/C1P1. Oncogene 1996, 12:2579-2594 [PubMed] [Google Scholar]