

Abstract
Connective tissue growth factor (CTGF) is a polypeptide implicated in the extracellular matrix synthesis. Previous studies have provided evidence that angiotensin II (Ang II) promotes collagen synthesis and regulates collagen degradation. We investigated whether or not CTGF mediates the profibrotic effects of Ang II in the heart and kidneys and the role of calcineurin-dependent pathways in CTGF gene regulation. In transgenic rats harboring human renin and angiotensinogen genes, Ang II induced an age-dependent increase in myocardial CTGF expression, which was 3.5-fold greater compared to normotensive Sprague Dawley (SD) rats. CTGF overexpression correlated closely with the Ang II-induced rise in blood pressure. CTGF mRNA and protein were located predominantly in areas with leukocyte infiltration, myocardial, and vascular lesions and co-localized with TGFβ1, collagen I, and collagen III mRNA expressions. Ang II induced CTGF mRNA and protein to a lesser extent in the kidneys, predominantly in glomeruli, arterioles, and in the interstitium with ample inflammation. However, no expression was found in the right ventricle or pulmonary arteries. Blockade of calcineurin activity by cyclosporine A completely normalized Ang II-induced CTGF overexpression in heart and kidney, suppressed the inflammatory response, and mitigated Ang II-induced cell proliferation and apoptosis. In contrast, blockade of mTOR (target of rapamycin) pathway by everolimus, further increased the expression of CTGF even though everolimus ameliorated cell proliferation and T-cell-mediated inflammation. Our findings provide evidence that CTGF mediates Ang II-induced fibrosis in the heart and kidneys via blood pressure and calcineurin-dependent pathways.
Hypertensive heart disease includes myocyte and non-myocyte growth that lead to an adverse structural remodeling of the intramural coronary arteries and extracellular matrix. 1 The accumulation of excess fibrillar collagen is believed to be an important pathophysiological process that also contributes to congestive heart failure and end-stage renal disease. 2,3 The precise mechanisms responsible for extracellular matrix protein accumulation in the heart and kidneys are poorly understood. However, in addition to mechanical load, autocrine, paracrine, and endocrine factors such as angiotensin II (Ang II), aldosterone, endothelin-1 (ET-1), bradykinin, nitric oxide (NO), and prostaglandins, play important roles in the regulation of cell growth, apoptosis, cell differentiation, and matrix turnover. 1 The structural homogeneity of the heart and kidneys may thus be regulated by the balance between stimulatory and inhibitory factors. 4
Much attention has been paid to the central role of transforming growth factor β1 (TGFβ1) in the pathogenesis of myocardial and renal fibrosis. 5,6 Connective tissue growth factor (CTGF), a member of the recently described CCN (CYR61/CEF10, CTGF/FISP-12, and nov) gene family, 7 is a novel cysteine-rich fibrogenic protein induced by TGFβ1. CTGF is overexpressed in various fibrotic disorders such as renal fibrosis, myocardial infarction, and atherosclerosis. 8-10 The mechanisms of CTGF action at the cellular level are poorly understood. Previous studies have demonstrated that adhesion of endothelial cells, platelets, and fibroblasts to CTGF is mediated through integrin receptors. 11 Recently Segarini et al 12 identified the low density lipoprotein receptor-related protein/α2-macroglobulin receptor (LRP2) as receptor for CTGF.
The renin-angiotensin system (RAS) also participates in the regulation of collagen synthesis, and cross-talks with local growth factors. 3 Ang II induces extracellular matrix protein synthesis and accumulation via AT1-receptor stimulation. The effects of Ang II on fibrillar collagen synthesis are principally mediated through TGFβ1 and endothelin-1 (ET-1). 13-16 Whether or not Ang II induces CTGF gene expression is currently unknown. Ang II may also regulate collagen degradation by attenuating matrix metalloproteinase activities, and by enhancing the production of TIMP-1. 17-20
We investigated CTGF in transgenic rats harboring human renin and angiotensinogen genes (dTGR). We then examined whether or not calcineurin-dependent pathways participate in regulating CTGF gene expression. Since Ang II-induced protein synthesis and vascular hypertrophy are strongly dependent on p70 S6 kinase activation, 21,22 we also studied the effects of p70 S6 inhibition by SDZ RAD (everolimus).
Materials and Methods
Experimental Animals, Drug Treatments, and Sample Preparation
We used 3- to 4-week-old male dTGR and age-matched normotensive Sprague Dawley (SD) rats. The dTGR are described elsewhere. 23,24 The protocols were approved by the Animal Experimentation Committee of the University of Helsinki, Finland, whose standards correspond to those of the American Physiological Society. The rats had free access to chow (NaCl 0.8%) and drinking water. Blood pressure- and body weight-matched dTGR and normotensive SD control rats were divided into four groups: dTGR control group (n = 15), dTGR + cyclosporine A (CsA) group (n = 10), dTGR + SDZ RAD group (n = 10), and SD control group (n = 10). CsA (2 mg/kg/d s.c.) (Novartis, Basel, Switzerland) and SDZ RAD (2.5 mg/kg/d p.o.) (Novartis, Basel, Switzerland) were given for 3 weeks. 25,26 As an additional control group, a parallel dTGR group was treated with valsartan (30 mg/kg/day p.o., Novartis, Basel, Switzerland) for 3 weeks. 27 The temporal expression of CTGF mRNA in the heart and kidney was examined in dTGR and SD samples taken between postnatal weeks 4 and 7. Systolic blood pressure was measured from pretrained rats by using a tail cuff blood pressure analyzer (Apollo-2AB Blood Pressure Analyzer, Model 179–2AB, IITC Life Science, Woodland Hills, CA, USA). At the age of 4, 5.5, and 7 weeks, urine was collected over 24 hours in metabolic cages for albumin measurements. Rats were then anesthetized with CO2/O2 (AGA, Riihimäki, Finland) and decapitated. The heart and kidneys were excised, washed with ice-cold saline, blotted dry, and weighed. The right ventricle and pulmonary artery were also harvested. Tissue samples were snap-frozen in liquid nitrogen and samples for immunohistochemistry in isopentane (− 35°C). Samples for conventional morphology, determination of apoptosis, and in situ hybridization were fixed with 10% formaline and processed in paraffin with routine techniques.
Myocardial and Renal Morphology
Our histological techniques for kidney and heart morphology are described elsewhere. 28,29 We relied on a quantitative grading scale for kidneys viewed by a pathologist unaware of the regimens as follows: 0) normal arteriologlomerular unit with open capillary lumens and a normal afferent arteriole, arcuate and interlobular vessels normal, no tubular atrophy, interstitial inflammation, or interstitial fibrosis; 1) slight thickening of the media of the afferent arteriole, some mesangial thickening, open capillary lumens in the glomerulus, patchy atrophy of tubular epithelium, small interstitial fibrotic scars, minimal medial thickening in larger vessels, no signs of inflammation; 2) marked mesangial thickening, partly collapsed capillaries in the glomerulus, arteriolar thickening, diffuse tubular atrophy and small interstitial fibrotic scars, clear medial thickening in larger vessels, occasional inflammatory infiltrate in the interstitium; 3) necrotic arteriologlomerular units with medial and intimal thickening of the arteriolar wall, diffuse tubular atrophy with proteinaceous casts, patches of interstitial fibrosis, sometimes fibrinoid necrosis of larger vessels, inflammatory infiltrate in the interstitium; and 4) necrotic arteriologlomerular units, necrosis of afferent arteries, fibrinoid necrosis and occlusion of the interlobular or arcuate arteries with thrombotic material, atrophic and necrotic tubuli, evident interstitial fibrosis, strong interstitial inflammation.
Furthermore, for the hearts, the arteries and ventricular fibrous tissue formation were also evaluated in a blinded fashion. Each sample was scored from 0 to 4 according to morphological changes as follows: 0) myocardial vessels normal, no excessive ventricular connective tissue formation; 1) normal intima, media slightly thickened or normal, slight increase of connective tissue around the epicardial and intramuscular arteries; 2) normal intima, clear medial thickening and adventitial scarring in epicardial and intramuscular arteries, patchy increase of slender connective tissue bundles; 3) intimal hyperplasia, clear medial thickening and adventitial scarring in epicardial and intramuscular arteries, evident myocardial infarcts/scars with inflammation; and 4) intimal hyperplasia, fibrinoid necrosis of the arteries with marked medial thickening and adventitial scarring, evident myocardial infarcts/scars with inflammation.
Northern Blots
Total RNA was collected from the heart and kidney of 7-week-old rats by the method of Chomczynski and Sacchi. 30 Total RNA were size-separated by electrophoresis on agarose gels whence it was blotted to nylon membranes (MagnaGraph Nylon Transfer Membrane; Micron Separations Inc., Westborough, MA; PosiBlot, Stratagene, La Jolla, CA). The membranes were UV-crosslinked and stored at 4°C until hybridization. The cDNA clones for human CTGF mRNA 1.1kb in pRc/CMV, rat proα1 (I) collagen mRNA (α1 R2), rat TGFβ1, rat proα1 (III) collagen mRNA (pRGR5), and rat GAPDH mRNA as a reference probe were labeled with (32P) dCTP by random priming (High Prime DNA labeling kit, Boehringer Mannheim, Mannheim, Germany). The hybridization was performed at 42°C for 18 hours. The filters were washed and the bound probes were detected by autoradiography at −70°C using Kodak X-omat films (Eastman Kodak Company, Rochester, NY). The films were developed and scanned. The band intensities were measured with computer densitometry (Bio Image Intelligent Quantifier, B. I. Systems Corp., Ann Arbor, MI). The amount of detected mRNA for CTGF, TGFβ1, proα1 (I) collagen, and proα1 (III) collagen were calculated in relation to the expression of GAPDH mRNA of the corresponding sample.
Quantitative Real-Time Reverse Transcriptase PCR Assay (RT-PCR) for CTGF
Total RNA from the hearts of 4-week-old SD and dTGR and from the right ventricle of 7-week-old SD and dTGR were collected, treated with DNAase 1 (Deoxyribonuclease 1, Sigma Chemical Co., St. Louis, MO, USA), and reverse-transcribed to cDNA by incubation for 50 minutes at 45°C in the presence of reverse transcriptase (Enhanced Avian HS RT-PCR kit, Sigma). Two μl of cDNA was subjected to a quantitative real time polymerase chain reaction (PCR) by Lightcycler Instrument (Roche Diagnostics, Neuilly sur Seine, France) for the detection of CTGF mRNA and GAPDH mRNA. Samples were amplified using FastStart DNA Master SYBR Green 1 (Roche Diagnostics) in the presence of 0.5 μmol/L forward and reverse primers. The following RT-PCR primers for CTGF and GAPDH were used: CTGF forward GGCAGGGCCAACCACTGTGC; CTGF reverse CAGTGCACTTGCCTGGATGG; GAPDH forward TGGGGCAGCCCAGAACATCA; GAPDH reverse GCCGCCTGCTTCACACCTT (Sigma Genosys, United Kingdom). PCR amplifications consisted of 10 minutes at 95°C following 40 cycles of 15 seconds at 95°C, 5 seconds at 57°C, 10 seconds at 72°C for CTGF, amplified product 167 bp in size; 10 minutes at 95°C following 37 cycles of 15 seconds at 95°C, 5 seconds at 66°C, 18 seconds at 72°C for GAPDH, amplified product 198 bp in size. After amplification, the quality of the PCR products were analyzed with a melting step consisting of 95°C for 0 seconds, cooling to 63°C for 15 seconds, and finally a slow rise in the temperature to 95°C with continuous acquisition of fluorescence decline. The quantities of CTGF and GAPDH PCR products were quantified with an external standard curve amplified from a purified PCR product.
In Situ Hybridization
In situ hybridization analysis was performed as described previously. 31 In brief, cDNA clones specific for human CTGF mRNA (1.1 kb in pRc/CMV, provided kindly by G. Grotendorst, University of Miami, USA), rat TGFβ1 mRNA, rat proα1 (I) collagen mRNA (α1 R2), and proα1 (III) collagen mRNA (pRGR5) were used for hybridization. Paraffin sections (5 μm) of the heart, kidney, and pulmonary artery were deparaffinized and hydrated. Pretreatment included incubation with 10 μg/ml proteinase K and 4% paraformaldehyde post-fixation. Sections were hybridized with labeled RNA-probe at 50°C for 18 hours. The slides were washed under stringent conditions including treatment with RNase A. Digoxigenin-labeled probes were detected following the methods from DIG-detection kit (Boehringer Mannheim, Mannheim, Germany). After 16 hours of color substrate incubation, the slides were counterstained with hematoxylin and mounted. Staining was accepted positive when seen with the antisense probe only.
Immunohistochemistry
Cryosections (5 μm) were treated with acetone (10 minutes at −20°C), chloroform (30 minutes at room temperature) and air-dried. Primary antibodies (mouse anti-rat ED1, ED2, CD4, CD8 (Serotec Ltd, Oslo, Norway), anti-rat CTGF (for paraffin sections) (Abcam, Cambridge, UK) and anti-mouse PCNA (Stressgen Biotechnologies Corp., Victoria, British Columbia, Canada), were applied for 30 minutes at room temperature. The slides were then treated with secondary antibody (peroxidase-conjugated rabbit anti-mouse immunoglobulins; DAKO A/S, Glostrup, Denmark) for 30 minutes at room temperature. After treatment with the third antibody (HRP-F(ab′)2 goat anti-rabbit (Zymed, San Francisco, CA) for 30 minutes at room temperature, the reaction was made visible by an AEC (3-amino-9-ethyl carbazole) solution containing hydrogen peroxidase. Finally, the samples were counterstained with hematoxyline and mounted. From the processed renal samples, the whole cortical and medullary area was photographed and the relative amount of primary antibody-positive label per sample was determined with computerized densitometry (Leica IM500 and Leica QWIN software; Leica Microsystems AG, Heerbrugg, Switzerland). In situ detection of DNA fragmentation was made by the TUNEL method according to the procedures in Apoptosis Detection Kit (Apoptag Peroxidase in Situ Apoptosis Detection Kit, Intergen Company, Oxford, UK). In brief, cardiac and renal sections (5 μm) were deparaffinized, hydrated, and treated with proteinase K. Endogenous peroxidase was quenched with 3% hydrogen peroxide. Terminal deoxynucleotidyl transferase (TdT) enzyme was applied on the specimens and incubated at 37°C for 1 hour. The sections were labeled with anti-digoxigenin conjugate and developed with peroxidase substrate. Finally, the slides were counterstained with hematoxyline, dehydrated, and mounted. The degree of apoptosis was measured by counting the number of apoptotic cells (excluding leukocytes) in 10 high-powered fields for each slide.
Biochemical Determinations
Urinary albumin was measured by ELISA using rat albumin as a standard (Celltrend, Luckenwalde, Germany). Serum lactate dehydrogenase activity was determined by UV-kinetic analysis (Hitachi 912, United Laboratories, Helsinki, Finland).
Statistical Analysis
Data are presented as mean ± SEM. Statistically significant differences in mean values were tested by analysis of variance and the Fisher’s least significant difference test (LSD) was used for comparisons between the groups. The differences were considered significant when P < 0.05. The data were analyzed by using SYSTAT statistical software (SYSTAT Inc, Evanston, IL).
Results
Four-week-old dTGR had 25 mm Hg higher systolic blood pressure, 27% higher cardiac weight to body weight ratio, and 10-fold increased urinary albumin excretion compared to age-matched normotensive SD rats (Figure 1) ▶ . Untreated dTGR developed marked hypertension and pronounced cardiac hypertrophy during the follow-up period (Table 1 ▶ , Figure 2A ▶ ). At the age of 7 weeks, 24 hour albuminuria in dTGR was 100-fold as compared to normotensive SD rats (Table 1) ▶ . Hearts of the untreated dTGR showed severe pathological alterations (Figure 3B ▶ , Table 1 ▶ ). Epicardial and intramuscular arteries had adventitial scarring and medial thickening. In addition, some intramuscular arteries had marked medial/intimal hyperplasia leading to vessel occlusion. The ventricular muscle had patches of scars and signs of recent infarcts with inflammation. Cell proliferation as well as apoptosis was increased in the hearts of untreated dTGR (Figure 4, C and D) ▶ . The kidneys of untreated dTGR had also severe histopathological changes as indicated by increased renal damage index (Table 1) ▶ . The glomeruli were either sclerotic or necrotic. There was also marked perivascular and periglomerular inflammation characterized by an abundance of ED1, ED2, CD4, and CD8 immunopositive cells (Table 2) ▶ . Intrarenal arteries had varying degrees of medial/intimal hyperplasia and fibrinoid necrosis of the vessel wall. The tubules were affected to a minor extent. There were some necrotic tubules and a part of the tubules had peritubular fibrosis with inflammation. In the kidneys, Ang II-induced cell proliferation located in the intrarenal arteries and in the interstitium. Apoptotic cells located primarily in the epithelium of the proximal tubules. Treatment with AT1 receptor antagonist valsartan prevented the Ang II-induced hypertension (SBP, 122 ± 8 mm Hg) and renal inflammatory response (ED-1, 0.26 ± 0.04; ED-2, 0.16 ± 0.02) (All variables P < 0.05 compared to dTGR). Albuminuria (1.3 ± 0.5 mg/d) as well as manifest morphological damage in the heart (1.1 ± 0.2) and kidney (1.1 ± 0.2) were also prevented by valsartan (All variables P < 0.05 compared to dTGR).
Figure 1.
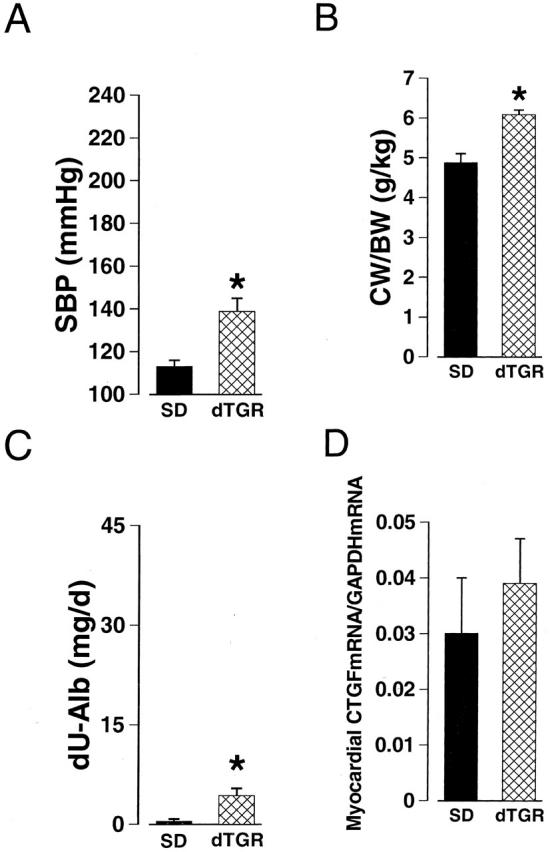
Systolic blood pressure (SBP, A), cardiac hypertrophy (CW/BW, B), 24-hour albuminuria (dU-Alb, C), and myocardial CTGF mRNA expression (D) in SD and dTGR in postnatal week 4. dTGR had higher blood pressure, cardiac weight-to-body weight ratio, and urinary albumin excretion rate compared to SD rats. Myocardial CTGF mRNA expression was similar in SD and dTGR. CTGF mRNA expression was measured by real-time RT-PCR and calculated in relation to GAPDH mRNA expression of the corresponding sample. Values are mean ± SEM. *, P < 0.05 vs. SD, n = 6 to 10.
Table 1.
Blood Pressure, Cardiac Hypertrophy, Albuminuria, Serum Lactate Dehydrogenase Concentration (s-LDH), and Tissue Damage Indexes in Normotensive Sprague Dawley Rats (SD), Double Transgenic Rats Harboring Human Renin and Angiotensinogen Genes (dTGR), dTGR Treated with CsA (CsA), and in dTGR Treated with SDZ RAD (SDZ RAD)
| Variable | SD | dTGR | CsA | SDZ RAD | P, ANOVA |
|---|---|---|---|---|---|
| Systolic BP (mmHg) | 108 ± 3 | 211 ± 8* | 176 ± 11*† | 191 ± 15* | <0.001 |
| Heart weight/body weight (g/kg) | 3.11 ± 0.08 | 5.52 ± 0.14* | 4.72 ± 0.13* | 5.60 ± 0.40* | 0.04 |
| Albuminuria (mg/d) | |||||
| Week 4 | 0.4 ± 0.4 | 4.3 ± 0.1* | 0.7 ± 0.1† | 2.7 ± 0.1* | 0.041 |
| Week 5.5 | 0.3 ± 0.1 | 11.6 ± 0.2* | 1.5 ± 0.1*† | 3.7 ± 0.1*† | 0.001 |
| Week 7 | 0.3 ± 0.1 | 35.9 ± 0.8* | 3.5 ± 0.2*† | 6.1 ± 0.1*† | <0.001 |
| s-LDH (U/l) | 930 ± 87 | 1580 ± 232* | 999 ± 128† | 2938 ± 1195*†‡ | 0.003 |
| Cardiac damage index | 0.9 ± 0.3 | 2.4 ± 0.2* | 2.1 ± 0.3* | 3.8 ± 0.3*†‡ | 0.014 |
| Renal damage index | 0.5 ± 0.2 | 2.7 ± 0.4* | 1.3 ± 0.2*† | 3.3 ± 0.5*‡ | <0.001 |
Values are mean ± SEM, n = 4–10 in each group.
*, P < 0.05 vs. SD;
†P < 0.05 vs. dTGR;
‡P < 0.05 vs. CsA-treated dTGR.
Figure 2.

Systolic blood pressure (SBP, A), 24-hour albuminuria (dU-Alb, B), and CTGF gene expressions in the heart and kidney (C) in dTGR during postnatal weeks 4 to 7. CTGF mRNA expression was measured by Northern blot and calculated in relation to GAPDH mRNA expression of the corresponding sample. There was a age-dependent increase in blood pressure, albuminuria, and CTGF mRNA expression in dTGR. Values are mean ± SEM, n = 4 to 10 in each group.
Figure 3.
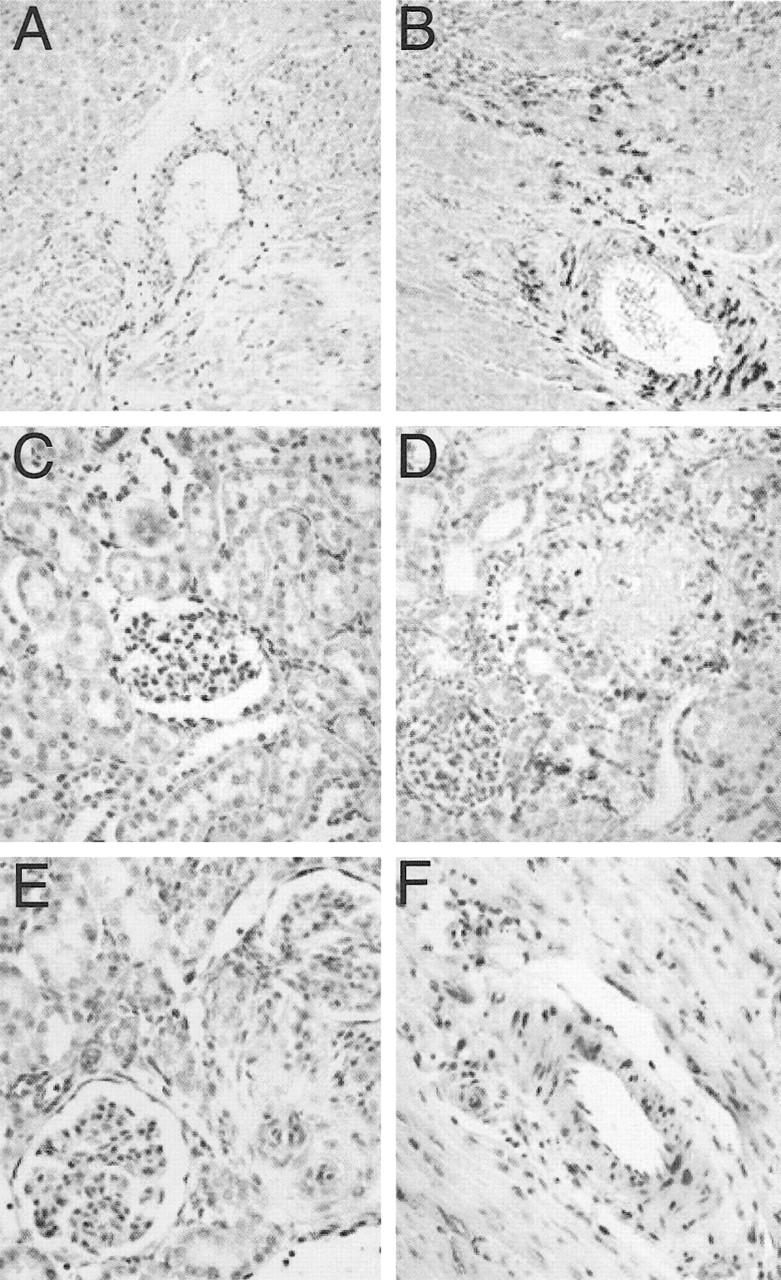
Representative photomicrographs of the CTGF mRNA and protein expressions in the kidney and heart of dTGR and SD rats. Faint CTGF mRNA expression was found in the heart (A) and kidney (C) of SD rat, whereas in dTGR, myocardial (B), and renal (D) CTGF mRNA expressions were intense. In situ hybridization with hematoxyline counterstaining. CTGF mRNA-positive label can be seen especially in the vascular media and in areas with inflammatory response (magnification, ×200). E and F show the CTGF protein expression in the kidney and heart of dTGR, respectively. Immunopositive label locates mainly in the vasculature. Hematoxyline counterstaining (magnification, ×400).
Figure 4.
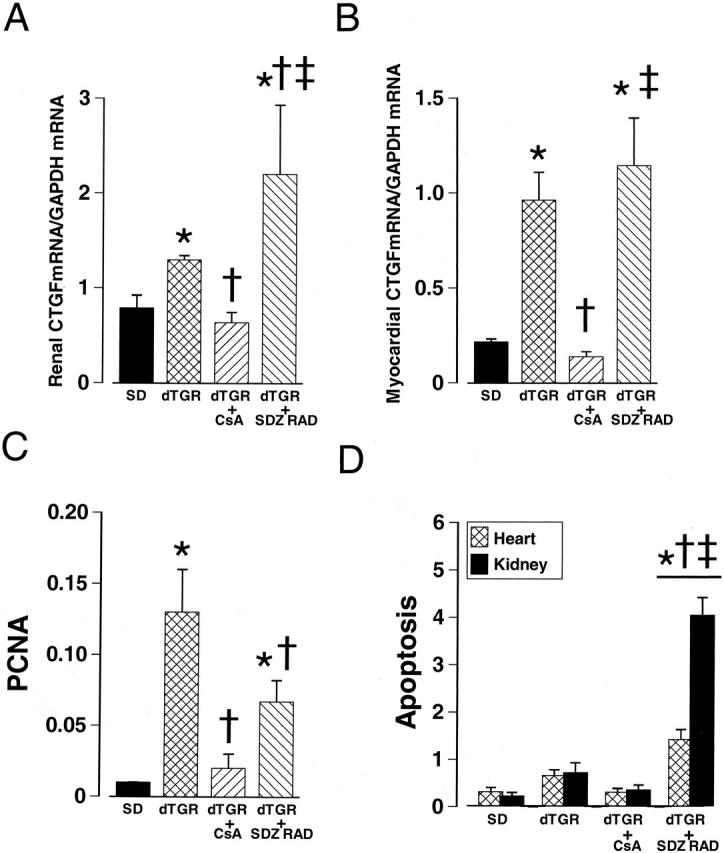
Effects of CsA and SDZ RAD treatments on CTGF gene expression in the kidney (A) and heart (B), on cell proliferation (C) and apoptosis (D) in dTGR. Cell proliferation in the kidney was assessed by anti-PCNA immunohistochemistry. Values represent the percentage of positive signal per total surface area. The number of apoptotic cells (excluding leukocytes) was counted in 10 randomly selected high-power fields per sample (n = 4 to 6). CsA prevented Ang II-induced increases in renal and myocardial CTGF mRNA expressions, cell proliferation, and apoptosis. Values are mean ± SEM. *, P < 0.05 compared to SD controls; †, P < 0.05 compared to dTGR; ‡, P < 0.05 compared to CsA-treated dTGR.
Table 2.
Immunohistochemical Markers of Renal Leukocyte Infiltration (ED1, ED2, CD4, and CD8) and Cell Proliferation (PCNA) in Normotensive Sprague Dawley Rats (SD), Double Transgenic Rats Harboring Human Renin and Angiotensinogen Genes (dTGR), dTGR Treated with CsA (CsA), and in dTGR Treated with SDZ RAD (SDZ RAD)
| Variable | SD | dTGR | CsA | SDZ RAD | P, ANOVA |
|---|---|---|---|---|---|
| ED1 | 0.19 ± 0.05 | 1.20 ± 0.16* | 0.27 ± 0.06† | 1.35 ± 0.25*‡ | <0.001 |
| ED2 | 0.15 ± 0.03 | 0.41 ± 0.07* | 0.19 ± 0.03† | 0.37 ± 0.08*‡ | 0.006 |
| CD4 | 0.12 ± 0.01 | 0.38 ± 0.07* | 0.14 ± 0.02† | 0.25 ± 0.06*‡ | 0.001 |
| CD8 | 0.08 ± 0.02 | 0.28 ± 0.08* | 0.09 ± 0.01† | 0.07 ± 0.01† | 0.004 |
| PCNA | 0.01 ± 0.00 | 0.13 ± 0.03* | 0.02 ± 0.01† | 0.07 ± 0.02*† | <0.001 |
Values are expressed as the percentage of the immunopositive label per total surface area.
Means ± SEM are given, n = 4–6 in each group.
*P < 0.05 vs. SD;
†P < 0.05 vs. dTGR;
‡P < 0.05 vs. CsA-treated dTGR.
Temporal Expression of CTGF mRNA in the Heart and Kidneys
At age 4 weeks, the myocardial CTGF mRNA expression in dTGR was 34% higher compared to SD rats; however, this difference did not reach statistical significance (Figure 1D) ▶ . Both in the heart and kidney of dTGR, the temporal expression of CTGF mRNA revealed a strong up-regulation in the gene expression between postnatal weeks 4 and 5.5 (Figure 2C) ▶ . The difference in CTGF mRNA expression between weeks 5.5 and 7 was less pronounced. At the age of 7 weeks, CTGF mRNA expression in the heart and kidneys of untreated dTGR was 3.5- and 1.65-fold higher as compared to normotensive SD rats, respectively.
Myocardial CTGF, TGFβ1, Col I, and Col III Gene Expressions
In untreated dTGR, CTGF mRNA expression was markedly up-regulated especially in the arterial media (Figure 3B ▶ and Figure 4B ▶ ). A strong CTGF mRNA expression was also detected in the scars and infarcts of the ventricle, where the positive label located in the outer boundaries (fresh infarct) or throughout the area (scar). In the SD group, a faint CTGF mRNA expression was detected in the media of epicardial and intramuscular arteries. In the ventricular muscle only a few positively labeled cells were seen. In contrast, the CTGF mRNA expression in the right ventricle of SD and dTGR rats (Figure 5C) ▶ indicated a notable but not significant increase in the amount of CTGF mRNA in dTGR. In the pulmonary arteries of SD and dTGR rats (Figure 5, A and B) ▶ the CTGF mRNA-positive signal was almost absent, indicating no differences between these groups.
Figure 5.

CTGF mRNA expression in the pulmonary artery and right ventricle of dTGR and SD rats. There was only a faint CTGF mRNA expression in the pulmonary arteries of SD rats (A) and dTGR (B). CTGF mRNA in situ hybridization (magnification, ×400). No significant difference in CTGF mRNA expression was found in the right ventricle of SD and dTGR rats (C).
Although the amount of TGFβ1 mRNA-positive label was very modest in the heart, it co-localized closely with CTGF. In general, Col I and Col III mRNA-positive signal was located in the adventitia of the arteries. In the untreated dTGR hearts, there was also Col I and Col III-positive signals in the myocardial scars. Valsartan prevented Ang II-induced CTGF gene expression completely (0.31 ± 0.05, P < 0.05 vs. dTGR). However, valsartan had no effect on the gene expression of TGFβ1 (0.15 ± 0.02), Col I (0.93 ± 0.11), or Col III (0.45 ± 0.09).
Renal CTGF, TGFβ1, Col I, and Col III Gene Expressions
In the kidneys of dTGR, CTGF mRNA expression localized mainly in the renal corpuscles, arteries, and in the interstitium (Figure 3D ▶ and Figure 4A ▶ ). There was a marked up-regulation of CTGF mRNA expression in the media of the intrarenal arteries. Also, an enhanced expression was detected in the interstitial and glomerular areas with inflammation, necrosis, or fibrosis. The SD group had a slight CTGF mRNA-positive signal mainly in the same areas as in dTGR rats (Figure 3C) ▶ . However, there was no detectable signal in the tubules or interstitium, whereas a diffuse signal was expressed in the vascular media. The location of TGFβ1 mRNA in the kidneys of dTGR closely resembled the pattern found with CTGF mRNA, even though the amount of positive label was less than that seen with the CTGF probe (Table 3) ▶ . In the SD group, in situ hybridization indicated Col III mRNA expression mainly in the adventitia of intrarenal arteries. Neither glomeruli nor interstitium had any marked Col III expression. The amount of Col III expression was moderately up-regulated in the dTGR group (Table 3) ▶ . This increment was localized in the interstitium and thickened adventitial layers of arteries. The glomeruli had different amounts of positive label. Necrotic glomeruli had the largest amount of Col III mRNA expression surrounding the Bowman’s capsule, whereas fibrotic glomeruli were thoroughly positively labeled. The interstitium had abundant label in the cortical fibrotic areas surrounding the atrophied tubuli and damaged glomeruli. The expression of Col I resembled the expression of Col III, though the amount of positive label was consistently less than with the Col III probe. Treatment with valsartan protected effectively against Ang II-induced increases in CTGF (0.78 ± 0.09), TGFβ1 (0.79 ± 0.19), and Col III (0.83 ± 0.19) gene expressions (all values P < 0.05 vs. dTGR). Col I expression was suppressed to a lesser extent by valsartan (0.82 ± 0.09).
Table 3.
Myocardial and Renal mRNA Expressions of Collagen I, Collagen III, and TGFβ1 in Normotensive Sprague Dawley Rats (SD), Double Transgenic Rats Harboring Human Renin and Angiotensinogen Genes (dTGR), dTGR Treated with CsA (CsA), and in dTGR Treated with SDZ RAD (SDZ RAD), GAPDH mRNA Expression Was Used for Normalization
| Variable | SD | dTGR | CsA | SDZ RAD | P, ANOVA |
|---|---|---|---|---|---|
| Heart | |||||
| Collagen I | 0.53 ± 0.1 | 0.99 ± 0.16* | 0.36 ± 0.1† | 1.31 ± 0.31*‡ | 0.003 |
| Collagen III | 0.17 ± 0.03 | 0.62 ± 0.1* | 0.51 ± 0.1 | 1.31 ± 0.34*†‡ | 0.001 |
| TGFβ1 | 0.22 ± 0.07 | 0.18 ± 0.03 | 0.19 ± 0.04 | 0.71 ± 0.42*†‡ | 0.13 |
| Kidney | |||||
| Collagen I | 0.59 ± 0.13 | 1.27 ± 0.05* | 0.83 ± 0.11 | 2.11 ± 0.45*†‡ | 0.001 |
| Collagen III | 0.76 ± 0.14 | 1.33 ± 0.32* | 0.76 ± 0.09† | 2.34 ± 0.27*†‡ | 0.001 |
| TGFβ1 | 0.73 ± 0.18 | 1.41 ± 0.29 | 0.99 ± 0.27 | 2.67 ± 0.57*†‡ | 0.006 |
Means ± SEM are given, n = 4–6 in each group.
*P < 0.05 vs. SD;
†P < 0.05 vs. dTGR;
‡P < 0.05 vs. CsA-treated dTGR.
Effects of Calcineurin Inhibition on Ang II-Induced Tissue Damage and CTGF mRNA Expression
CsA produced a modest decrease in blood pressure (−35 mm Hg), partially prevented the development of cardiac hypertrophy (− 14%), and decreased albuminuria by 90% (Table 1) ▶ . CsA treatment protected against perivascular inflammation (Table 2) ▶ , cell proliferation, and apoptosis (Figure 4, C and D) ▶ . CsA treatment had no major effect on the cardiac morphology. Although CsA seemed to protect against the inflammation and ventricular infarcts, arteries were still affected. In contrast, Ang II-induced renal damage was effectively prevented. CsA suppressed the Ang II-induced CTGF mRNA overexpression both in the heart and kidneys. The amount and location of the CTGF mRNA-positive label was similar to the SD group. CsA also totally prevented the induction of Col I gene and Col III to a partial extent (Table 3) ▶ .
Effects of mTOR Inhibition on Ang II-Induced Tissue Damage and CTGF mRNA Expression
Everolimus did not significantly affect blood pressure or cardiac hypertrophy in dTGR (Table 1) ▶ . Although everolimus partially prevented the development of albuminuria in dTGR (Table 1) ▶ , it increased mortality (6 of 10 in the everolimus group vs. 4 of 15 in dTGR control group). Interestingly, the myocardial damage score as well as the renal damage score tended to be increased by everolimus (Table 1) ▶ . In the everolimus group there were numerous infarcts with marked accumulation of leukocytes. Intramuscular arteries had evident medial/intimal hyperplasia occluding the vessels. The larger epicardial arteries were notably thickened and had areas of fibrinoid necrosis and inflammation. Lesions of the intrarenal arteries were similar but more severe than in the dTGR group. Proximal tubules were necrotic and patches of interstitial fibrosis and ED1/ED2-positive inflammatory cells were seen throughout the sample. However, everolimus partially attenuated T-cell-mediated inflammatory response and cell proliferation in the kidneys (Table 2 ▶ , Figure 4C ▶ ).
Everolimus-treated dTGR showed very intense CTGF mRNA expression in the heart. As in the untreated dTGR group, the CTGF mRNA expression located mainly in the infarcted areas and vascular media. There was also a marked induction of TGFβ1, Col I, and Col III genes in the heart of everolimus-treated dTGR that co-localized with CTGF mRNA expression (Table 3) ▶ . Treatment with everolimus resulted in a marked induction of CTGF gene also in the kidneys, especially in the inflamed areas of interstitium, glomeruli, and arteries. Similar to cardiac samples, the expression of TGFβ1 Col I, and Col III genes were markedly up-regulated in the everolimus-treated dTGR. Everolimus increased the number of apoptotic cells both in the heart and kidneys (Figure 4D) ▶ .
Discussion
CTGF is a novel cysteine-rich growth factor of the CCN family, which is involved in cell proliferation, migration, and extracellular matrix production. 32,7 The important finding in our study was that, in dTGR, Ang II induces myocardial and renal CTGF mRNA and protein expression via AT1 receptor. The effect appeared to be age- and blood pressure-dependent. Although the myocardial CTGF mRNA expression was similar in 4-week-old juvenile SD and dTGR rats, an intense Ang II-induced CTGF mRNA overexpression was found in dTGR already at age 5.5 weeks when the rats had not yet developed malignant hypertension. Our findings thus underscore the importance of CTGF in the early pathogenesis of Ang II-induced hypertension and tissue fibrosis. We here also demonstrated that CTGF mRNA expression was more pronounced in the heart compared to the kidney, and co-localized very closely with leukocyte infiltration, as well as TGFβ1, Col I, and Col III gene expressions. Our study thus provides evidence that Ang II-induced CTGF gene expression may also be mediated by the inflammatory response in the vascular wall. Finally, the complete normalization of myocardial and renal CTGF mRNA overexpression in dTGR by cyclosporine A indicated that calcineurin-dependent pathways are involved in the CTGF gene regulation.
Hypertension, vascular inflammation, and end-organ damage in dTGR are due to increased Ang II synthesis by the human RAS transgenes. Ang II concentrations in the circulation and in tissues are about fivefold higher in dTGR compared to non-transgenic SD controls. 27,33 We have previously shown that myocardial, renal, and vascular damage in dTGR are age-dependent. In fact, immediately after weaning at age 3 to 4 weeks, myocardial and renal tissue morphology by light microscopy are indistinguishable between dTGR and normotensive SD rats. However, blood pressure, cardiac hypertrophy, and 24-hour albuminuria, are slightly increased in dTGR already at that age. Furthermore, marked inflammatory cell recruitment, mainly consisting of monocytes and macrophages, as well as up-regulation of adhesion molecules VCAM-1, ICAM-1, and the extracellular matrix component fibronectin, are present in the early age of dTGR. 27,34 These findings suggest that Ang II triggers inflammatory response and exerts direct pro-inflammatory effects in part by blood pressure-independent mechanisms related to activation of the redox-sensitive transcription factors NF-κB and AP-1 as well as oxidative stress. In the present study, CTGF mRNA was also expressed in the heart, kidneys, and vasculature in a time-dependent manner. Myocardial CTGF mRNA expression was similar in 4-week-old SD and dTGR rats. Marked up-regulation of myocardial and renal CTGF gene expression occurred between postnatal weeks 4 and 5.5, and to a lesser extent between weeks 5.5 and 7. Our findings thus provide evidence that the up-regulation of CTGF gene occurs at the onset of Ang II-induced hypertension before overt myocardial and renal damage. To further elucidate the role of blood pressure in regulating the expression of CTGF gene, we examined the CTGF mRNA level in the right ventricle of 7-week-old SD and dTGR rats. The amount of right ventricular CTGF mRNA in dTGR was not significantly higher than in the SD rats. In addition, the almost complete absence of CTGF mRNA-positive signal in the pulmonary arteries of SD and dTGR suggest an important role for Ang II-induced rise in blood pressure in the regulation of CTGF gene expression. Furthermore, we showed earlier that myocardial CTGF mRNA expression correlated with systolic blood pressure in SHR. 29 Cell culture studies have also revealed that static pressure enhances CTGF gene expression. 35 Chronic valsartan treatment completely prevented CTGF overexpression both in the heart and kidney. Our findings thus indicate that the profibrotic effects of Ang II are blood pressure-dependent and mediated via AT1-receptor.
The CTGF gene contains several regulatory elements such as AP-1, CaG, TATA, M-TAT, SPI, and a unique TGFβ1-response element. 7,32 Although several factors are capable of regulating CTGF gene expression, CTGF appears to be transcriptionally activated primarily through TGFβ1. Besides TGFβ1, CTGF gene expression is also regulated by high glucose, TNFα, VEGF, cortisol, cAMP, thrombin, prostaglandin E2, drugs such as iloprost and statins, as well as with cytomegalovirus infection. 36-45 Furthermore, other growth factors such as PDGF, EGF, and FGF also activate CTGF gene expression at the transcriptional level. 7,32 Previous studies have provided compelling evidence that Ang II induces fibrosis in the heart and kidneys primarily through the TGFβ1 pathway. 3,17,19 Therefore, the marked up-regulation of cardiac and renal CTGF mRNA and protein expression found in dTGR is likely to be mediated through TGFβ1. The close co-localization of CTGF gene expression with Col I and Col III mRNA expressions supports this notion. However, we were able to demonstrate a marked increase in TGFβ1 mRNA expression by Northern blot only in the kidneys suggesting that, in the myocardium, CTGF gene may have been activated via alternative transcriptional pathways.
CTGF transcriptional gene regulation may also be linked to Ang II-induced oxidative stress. Ang II stimulates NADPH oxidase to produce reactive oxygen species (ROS), which participate in the regulation of VSMC growth, induction of vascular inflammatory response, impairment of endothelial-dependent vascular relaxation, and pathogenesis of cardiac hypertrophy. 46 The mechanisms whereby Ang II induces NADPH oxidase are not completely understood. Previous studies by Touyz et al 47,48 have provided evidence that Ang II-induced activation of NADPH oxidase is linked to activation of phospholipase D and protein kinase C, phosphorylation of p47phox, translocation of cytosolic subunits, and de novo protein synthesis. Interestingly, Ang II alone, even at micromolar concentrations, has little if any effect on CTGF mRNA level in cardiac fibroblasts. 49 Previously we have shown that in dTGR, Ang II-mediated leukocyte infiltration and adhesion molecule overexpression are due to Ang II-induced ROS formation and activation of the redox-sensitive transcription factors NF-κB and AP-1. 50 Very recently, we showed that Ang II controls the migration of mature dendritic MHC II-positive cells whose maturation process seemed to be controlled by TNFα. 51 In contrast, blood pressure did not influence the maturation process as the infiltration of immune cells and resultant vascular damage was prevented by dexamethasone without lowering of blood pressure. 51
We noticed that myocardial CTGF mRNA expression in dTGR was markedly up-regulated in the vascular media and in the infarcted areas. Renal CTGF mRNA was localized mainly in the medial layer of the arteries, in the interstitium, and in the necrotic glomeruli. Interestingly, both in the heart and kidneys, CTGF expression co-localized very closely with infiltrated leukocytes suggesting an important role for inflammatory response in CTGF gene regulation. The increased CTGF mRNA expression in areas with local inflammation could have resulted from the release of ROS, thrombospondin-1, and TGFβ1 from the mononuclear phagocytes. In support of this notion, ROS induced CTGF gene expression in human lens epithelial cells. 52 In addition, CTGF is up-regulated in sclerodermal skin fibroblasts that also release more O2 and H2O2 in vitro compared to normal fibroblasts. 53,54 Recently Candido et al demonstrated a marked vascular CTGF overexpression in diabetic APO-E knock-out mice, which was inhibited by ACE inhibitor therapy. This finding suggests a role for Ang II-induced inflammatory response and oxidative stress in the pathogenesis of CTGF gene regulation. 55
The calcium-calmodulin, Ser/Thr protein phosphatase calcineurin (PP2B) and its downstream transcriptional effector nuclear factor of activated T cells (NFAT) play pivotal roles in the immune response. Activation of calcineurin phosphatase leads to dephosphorylation and nuclear translocation of NFAT and regulation of several inducible genes in T cells. In the present study we investigated the role of calcineurin-dependent pathways in CTGF gene regulation. We showed that the calcineurin inhibitor, CsA, effectively prevented Ang II-induced CTGF mRNA overexpression in the heart and kidneys, as well as the inflammatory response. Our findings are thus in good agreement with our previous study showing marked attenuation of Ang II-induced inflammation and end-organ damage in dTGR by CsA. 56 However, they appear to contradict previous studies demonstrating a pronounced up-regulation of TGFβ1 and development of renal fibrosis by CsA in sodium-depleted rats. 57 We believe that the powerful immunomodulatory action of CsA characterized by complete normalization of Ang II-induced leukocyte infiltration, possibly through the down-regulation of adhesion molecules in the arterial wall 56 as well as blockade of the synthesis of IL-2 and granulocyte-macrophage-colony stimulating factor (GM-CSF), were responsible for preventing the induction of CTGF gene. Our findings suggest the involvement of macrophage-derived TGFβ1 and ROS in controlling the expression of CTGF gene. Interestingly, we also noticed that CsA prevented the Ang II-induced increase in the number of apoptotic cardiomyocytes and renal tubular cells in dTGR. Previous studies have revealed that CTGF induces apoptosis via down-regulation of the anti-apoptotic genes. 35 Hence the beneficial effects of CsA on Ang II-induced apoptosis may have been mediated, at least in part, through normalization of CTGF mRNA and protein expression.
A common response of cells to both mitogenic and hypertrophic factors is the activation of protein synthesis. Previous studies have provided strong evidence that p70 S6 protein kinase plays an important role in Ang II-induced protein synthesis and vascular hypertrophy. 21,22 Mammalian TOR (target of rapamycin) regulates cell growth predominantly via activation of the p70 S6 kinase. 58 The novel immunosuppressant everolimus is a proliferation signal inhibitor that blocks growth factor-driven proliferation of T cells, B cells, and VSMC by inhibiting activation of p70 S6 kinase. 59 Everolimus has been shown to reduce acute rejection, limit CsA-induced nephrotoxicity, protect against cytomegalovirus infections, and inhibit vascular remodeling. 59 Everolimus effectively prevented the development of albuminuria in dTGR without any marked changes in systemic blood pressure. Everolimus also partially blocked the Ang II-induced accumulation of T cells and cell proliferation. However, everolimus had no effect on monocyte/macrophage infiltration. Furthermore, CTGF and TGFβ1 mRNA expressions, as well as the number of apoptotic cells, were increased by everolimus. Several mechanisms could be considered. First, unlike calcineurin inhibitors, everolimus does not influence leukocyte chemotaxis and therefore is unable to prevent perivascular monocyte/macrophage infiltration in the heart and kidneys. In experimental mesangial proliferative glomerulonephritis and acute renal failure, mTOR inhibitors have been shown to cause inflammation and apoptosis. 60,61 Myocardial infarctions have also been noted. 62 Second, cardiomyocytes have high need for oxygen provided by blood vessels. Inhibition of mTOR by rapamycin has been shown to diminish the action of VEGF and thus inhibit angiogenesis. 63 Therefore mTOR inhibition may have induced local hypoxia in dTGR, which, in turn, could act as an inducer of CTGF gene expression.
We believe that our findings have clinical implications. CTGF has not received much attention as a mediator of hypertension-induced or Ang II-induced end-organ damage. CTGF co-localized very closely with infiltrated leukocytes, as well as with TGFβ1, collagen I, and collagen III mRNA expressions. Calcineurin inhibition completely normalized CTGF overexpression in dTGR indicating an important role for calcineurin pathways in CTGF gene regulation. The induction of CTGF gene in the heart and kidneys occurred before any manifest histopathological damage suggesting a possible diagnostic role for CTGF in diseases accompanied with inflammation and/or connective tissue accumulation. CTGF may develop into a therapeutic target, albeit not necessarily via the drugs used here.
Acknowledgments
We thank Ms. Toini Siiskonen, Ms. Anneli von Behr, and Ms. Sari Laakkonen for skillful technical assistance. The gift of valsartan, cyclosporine, and SDZ RAD by Novartis Ltd, Basel, Switzerland, is gratefully acknowledged.
Footnotes
Address reprint requests to Eero Mervaala, M.D., Ph.D., Assistant Professor, Institute of Biomedicine, Pharmacology, Biomedicum Helsinki, P.O. Box 63 (Haartmaninkatu 8), FIN-00014 University of Helsinki, Finland. E-mail: eero.mervaala@helsinki.fi.
Supported by the Academy of Finland, the Sigrid Jusélius Foundation, and the Helsinki University Central Hospital Fund.
References
- 1.Weber KT: Cardioreparation in hypertensive heart disease. Hypertension 2001, 38:588-591 [DOI] [PubMed] [Google Scholar]
- 2.Mezzano SA, Ruiz-Ortega M, Egido J: Angiotensin II and renal fibrosis. Hypertension 2001, 38:635-638 [DOI] [PubMed] [Google Scholar]
- 3.Dostal DE: Regulation of cardiac collagen: angiotensin and cross-talk with local growth factors. Hypertension 2001, 37:841-844 [DOI] [PubMed] [Google Scholar]
- 4.Weber KT: Angiotensin II and connective tissue: homeostasis and reciprocal regulation. Regul Pept 1999, 82:1-17 [DOI] [PubMed] [Google Scholar]
- 5.Lijnen PJ, Petrov VV, Fagard RH: Induction of cardiac fibrosis by transforming growth factor-β(1). Mol Genet Metab 2000, 71:418-435 [DOI] [PubMed] [Google Scholar]
- 6.Yokoi H, Sugawara A, Mukoyama M, Mori K, Makino H, Suganami T, Nagae T, Yahata K, Fujinaga Y, Tanaka I, Nakao K: Role of connective tissue growth factor in profibrotic action of transforming growth factor-β: a potential target for preventing renal fibrosis. Am J Kidney Dis 2001, 38:134-138 [DOI] [PubMed] [Google Scholar]
- 7.Moussad EE, Brigstock DR: Connective tissue growth factor: what’s in a name? Mol Genet Metab 2000, 71:276-292 [DOI] [PubMed] [Google Scholar]
- 8.Ito Y, Aten J, Bende RJ, Oemar BS, Rabelink TJ, Weening JJ, Goldschmeding R: Expression of connective tissue growth factor in human renal fibrosis. Kidney Int 1998, 53:853-861 [DOI] [PubMed] [Google Scholar]
- 9.Ohnishi H, Oka T, Kusachi S, Nakanishi T, Takeda K, Nakahama M, Doi M, Murakami T, Ninomiya Y, Takigawa M, Tsuji T: Increased expression of connective tissue growth factor in the infarct zone of experimentally induced myocardial infarction in rats. J Mol Cell Cardiol 1998, 30:2411-2422 [DOI] [PubMed] [Google Scholar]
- 10.Oemar BS, Werner A, Garnier JM, Do DD, Godoy N, Nauck M, Marz W, Rupp J, Pech M, Luscher TF: Human connective tissue growth factor is expressed in advanced atherosclerotic lesions. Circulation 1997, 95:831-839 [DOI] [PubMed] [Google Scholar]
- 11.Schober JM, Chen N, Grzeszkiewicz TM, Jovanovic I, Emeson EE, Ugarova TP, Ye RD, Lau LF, Lam SC: Identification of integrin α(M)β(2) as an adhesion receptor on peripheral blood monocytes for Cyr61 (CCN1) and connective tissue growth factor (CCN2): immediate-early gene products expressed in atherosclerotic lesions. Blood 2002, 99:4457-4465 [DOI] [PubMed] [Google Scholar]
- 12.Segarini PR, Nesbitt JE, Li D, Hays LG, Yates, III,JR, Carmichael DF: The low density lipoprotein receptor-related protein/α2-macroglobulin receptor is a receptor for connective tissue growth factor. J Biol Chem 2001, 276:40659-40667 [DOI] [PubMed] [Google Scholar]
- 13.Sun Y, Zhang JQ, Zhang J, Ramires FJ: Angiotensin II, transforming growth factor-β1 and repair in the infarcted heart. J Mol Cell Cardiol 1998, 30:1559-1569 [DOI] [PubMed] [Google Scholar]
- 14.Lee AA, Dillmann WH, McCulloch AD, Villarreal FJ: Angiotensin II stimulates the autocrine production of transforming growth factor-β1 in adult cardiac fibroblasts. J Mol Cell Cardiol 1995, 27:2347-2357 [DOI] [PubMed] [Google Scholar]
- 15.Ito H, Hirata Y, Adachi S, Tanaka M, Tsujino M, Koike A, Nogami A, Murumo F, Hiroe M: Endothelin-1 is an autocrine/paracrine factor in the mechanism of angiotensin II-induced hypertrophy in cultured rat cardiomyocytes. J Clin Invest 1993, 92:398-403 [DOI] [PMC free article] [PubMed] [Google Scholar]
- 16.Bohlender J, Gerbaulet S, Kramer J, Gross M, Kirchengast M, Dietz R: Synergistic effects of AT1 and ETA receptor blockade in a transgenic, angiotensin II-dependent, rat model. Hypertension 2000, 35:992-997 [DOI] [PubMed] [Google Scholar]
- 17.Everett AD, Tufro-McReddie A, Fisher A, Gomez RA: Angiotensin receptor regulates cardiac hypertrophy and transforming growth factor-β 1 expression. Hypertension 1994, 23:587-592 [DOI] [PubMed] [Google Scholar]
- 18.Fakhouri F, Placier S, Ardaillou R, Dussaule JC, Chatziantoniou C: Angiotensin II activates collagen type I gene in the renal cortex and aorta of transgenic mice through interaction with endothelin and TGF-β. J Am Soc Nephrol 2001, 12:2701-2710 [DOI] [PubMed] [Google Scholar]
- 19.Funck RC, Wilke A, Rupp H, Brilla CG: Regulation and role of myocardial collagen matrix remodeling in hypertensive heart disease. Adv Exp Med Biol 1997, 432:35-44 [DOI] [PubMed] [Google Scholar]
- 20.Chua CC, Hamdy RC, Chua BH: Angiotensin II induces TIMP-1 production in rat heart endothelial cells. Biochim Biophys Acta 1996, 1311:175-180 [DOI] [PubMed] [Google Scholar]
- 21.Giasson E, Meloche S: Role of p70 S6 protein kinase in angiotensin II-induced protein synthesis in vascular smooth muscle cells. J Biol Chem 1995, 270:5225-5231 [DOI] [PubMed] [Google Scholar]
- 22.Takano H, Komuro I, Zou Y, Kudoh S, Yamazaki T, Yazaki Y: Activation of p70 S6 protein kinase is necessary for angiotensin II-induced hypertrophy in neonatal rat cardiac myocytes. FEBS Lett 1996, 379:255-259 [DOI] [PubMed] [Google Scholar]
- 23.Ganten D, Wagner J, Zeh K, Bader M, Michel JP, Paul M, Zimmermann F, Ruf P, Hilgenfeldt U, Ganten U, Kaling M, Bachmann S, Fukamizu A, Mullins JJ, Murakami K: Species specificity of renin kinetics in transgenic rats harboring human renin and angiotensinogen genes. Proc Natl Acad Sci USA 1992, 89:7806-7810 [DOI] [PMC free article] [PubMed] [Google Scholar]
- 24.Bohlender J, Fukamizu A, Lippoldt A, Nomura T, Dietz R, Ménard J, Murakami K, Luft FC, Ganten D: High human renin hypertension in transgenic rats. Hypertension 1997, 29:428-434 [DOI] [PubMed] [Google Scholar]
- 25.Rovenska E, Svik K, Stancikova M, Rovensky J: Enzyme and combination therapy with cyclosporin A in the rat developing adjuvant arthritis. Int J Tissue React 1999, 21:105-111 [PubMed] [Google Scholar]
- 26.Reis A, Megahed M, Reinhard T, Godehardt E, Braunstein C, Sundmacher R: Synergism of RAD and cyclosporin A in prevention of acute rat corneal allograft rejection. Cornea 2002, 21:81-84 [DOI] [PubMed] [Google Scholar]
- 27.Müller DN, Mervaala EM, Dechend R, Fiebeler A, Park JK, Schmidt F, Theuer J, Breu V, Mackman N, Luther T, Schneider W, Gulba D, Ganten D, Haller H, Luft FC: Angiotensin II (AT(1)) receptor blockade reduces vascular tissue factor in angiotensin II-induced cardiac vasculopathy. Am J Pathol 2000, 157:111-122 [DOI] [PMC free article] [PubMed] [Google Scholar]
- 28.Pere A-K, Lindgren L, Tuomainen P, Krogerus L, Rauhala P, Laakso J, Karppanen H, Vapaatalo H, Ahonen J, Mervaala EMA: Dietary potassium and magnesium supplementations in cyclosporine-induced hypertension and nephrotoxicity. Kidney Int 2000, 58:2462-2472 [DOI] [PubMed] [Google Scholar]
- 29.Finckenberg P, Lassila M, Inkinen K, Pere A-K, Krogerus L, Lindgren L, Mervaala E, Vapaatalo H, Nurminen M-L, Ahonen J: Cyclosporine induces myocardial connective tissue growth factor in spontaneously hypertensive rats on high sodium diet. Transplantation 2001, 71:951-958 [DOI] [PubMed] [Google Scholar]
- 30.Chomczynski P, Sacchi N: Single-step method of RNA isolation by acid guanidium thiocyanate-phenol-chloroform extraction. Anal Biochem 1987, 162:156-159 [DOI] [PubMed] [Google Scholar]
- 31.Inkinen K, Wolff H, von Boguslawski K, Ahonen J: Type V collagen in experimental granulation tissue. Connect Tissue Res 1999, 39:281-294 [DOI] [PubMed] [Google Scholar]
- 32.Brigstock DR: The connective tissue growth factor/cysteine-rich 61/nephroblastoma overexpressed (CCN) family. Endocr Rev 1999, 20:189-206 [DOI] [PubMed] [Google Scholar]
- 33.Mervaala EMA, Müller DN, Schmidt F, Park J-K, Gross V, Bader M, Breu V, Ganten D, Haller H, Luft FC: Blood pressure-independent effects in rats with human renin and angiotensinogen genes. Hypertension 2000, 35:587-594 [DOI] [PubMed] [Google Scholar]
- 34.Mervaala EMA, Müller DN, Park JK, Schmidt F, Lohn M, Breu V, Dragun D, Ganten D, Haller H, Luft FC: Monocyte infiltration and adhesion molecules in a rat model of high human renin hypertension. Hypertension 1999, 33:389-395 [DOI] [PubMed] [Google Scholar]
- 35.Hishikawa K, Oemar BS, Nakaki T: Static pressure regulates connective tissue growth factor expression in human mesangial cells. J Biol Chem 2001, 276:16797-16803 [DOI] [PubMed] [Google Scholar]
- 36.Murphy M, Godson C, Cannon S, Kato S, Mackenzie HS, Martin F, Brady HR: Suppression subtractive hybridization identifies high glucose levels as a stimulus for expression of connective tissue growth factor and other genes in human mesangial cells. J Biol Chem 1999, 274:5830-5834 [DOI] [PubMed] [Google Scholar]
- 37.Abraham DJ, Shiwen X, Black CM, Sa S, Xu Y, Leask A: Tumor necrosis factor α suppresses the induction of connective tissue growth factor by transforming growth factor-β in normal and scleroderma fibroblasts. J Biol Chem 2000, 275:15220-15225 [DOI] [PubMed] [Google Scholar]
- 38.Suzuma K, Naruse K, Suzuma I, Takahara N, Ueki K, Aiello LP, King GL: Vascular endothelial growth factor induces expression of connective tissue growth factor via KDR, Flt1, and phosphatidylinositol 3-kinase-akt-dependent pathways in retinal vascular cells. J Biol Chem 2000, 275:40725-40731 [DOI] [PubMed] [Google Scholar]
- 39.Pereira RC, Durant D, Canalis E: Transcriptional regulation of connective tissue growth factor by cortisol in osteoblasts. Am J Physiol Endocrinol Metab 2000, 279:E570-E576 [DOI] [PubMed] [Google Scholar]
- 40.Duncan MR, Frazier KS, Abramson S, Williams S, Klapper H, Huang X, Grotendorst GR: Connective tissue growth factor mediates transforming growth factor β-induced collagen synthesis: down-regulation by cAMP. EMBO J 1999, 13:1774-1786 [PubMed] [Google Scholar]
- 41.Howell DC, Goldsack NR, Marshall RP, McAnulty RJ, Starke R, Purdy G, Laurent GJ, Chambers RC: Direct thrombin inhibition reduces lung collagen, accumulation, and connective tissue growth factor mRNA levels in bleomycin-induced pulmonary fibrosis. Am J Pathol 2001, 159:1383-1395 [DOI] [PMC free article] [PubMed] [Google Scholar]
- 42.Ricupero DA, Rishikof DC, Kuang PP, Poliks CF, Goldstein RH: Regulation of connective tissue growth factor expression by prostaglandin E(2). Am J Physiol 1999, 277:1165-1171 [DOI] [PubMed] [Google Scholar]
- 43.Stratton R, Shiwen X, Martini G, Holmes A, Leask A, Haberberger T, Martin GR, Black CM, Abraham D: Iloprost suppresses connective tissue growth factor production in fibroblasts and in the skin of scleroderma patients. J Clin Invest 2001, 108:241-250 [DOI] [PMC free article] [PubMed] [Google Scholar]
- 44.Eberlein M, Heusinger-Ribeiro J, Goppelt-Struebe M: Rho-dependent inhibition of the induction of connective tissue growth factor (CTGF) by HMG CoA reductase inhibitors (statins). Br J Pharmacol 2001, 133:1172-1180 [DOI] [PMC free article] [PubMed] [Google Scholar]
- 45.Inkinen K, Soots A, Krogerus L, Lindroos P, Bruggeman C, Ahonen J, Lautenschlager I: Cytomegalovirus infection enhances connective tissue growth factor mRNA expression in a rat model of chronic renal allograft rejection. Transplant Proc 2001, 33:379. [DOI] [PubMed] [Google Scholar]
- 46.Griendling KK, Sorescu D, Ushio-Fukai M: NAD(P)H oxidase: role in cardiovascular biology and disease. Circ Res 2000, 86:494-501 [DOI] [PubMed] [Google Scholar]
- 47.Touyz RM, Schiffrin EL: Ang II-stimulated superoxide production is mediated via phospholipase D in human vascular smooth muscle cells. Hypertension 1999, 34:976-982 [DOI] [PubMed] [Google Scholar]
- 48.Touyz RM, Chen X, Tabet F, Yao G, He G, Quinn MT, Pagano PJ, Schiffrin EL: Expression of a functionally active gp91phox-containing neutrophil-like NAD(P)H oxidase in smooth muscle cells from human resistance arteries: regulation by angiotensin II. Circ Res 2002, 90:1205-1213 [DOI] [PubMed] [Google Scholar]
- 49.Chen MM, Lam A, Abraham JA, Schreiner GF, Joly AH: CTGF expression is induced by TGF-β in cardiac fibroblasts and cardiac myocytes: a potential role in heart fibrosis. J Mol Cell Cardiol 2000, 32:1805-1819 [DOI] [PubMed] [Google Scholar]
- 50.Müller DN, Dechend R, Mervaala EMA, Park J-K, Schmidt F, Fiebeler A, Theuer J, Breu V, Ganten D, Haller H, Luft FC: NF-κB inhibition ameliorates angiotensin II-induced inflammatory damage in rats. Hypertension 2000, 35:193-201 [DOI] [PubMed] [Google Scholar]
- 51.Müller DN, Shagdarsuren E, Park JK, Dechend R, Mervaala E, Hampich F, Fiebeler A, Ju X, Finckenberg P, Theuer J, Viedt C, Kreuzer J, Heidecke H, Haller H, Zenke M, Luft FC: Immunosuppressive treatment protects against angiotensin II-induced renal damage. Am J Pathol 2002, 161:1679-1693 [DOI] [PMC free article] [PubMed] [Google Scholar]
- 52.Park SK, Kim J, Seomun Y, Choi J, Kim DH, Han IO, Lee EH, Chung SK, Joo CK: Hydrogen peroxide is a novel inducer of connective tissue growth factor. Biochem Biophys Res Commun 2001, 284:966-971 [DOI] [PubMed] [Google Scholar]
- 53.Igarashi A, Nashiro K, Kikuchi K, Sato S, Ihn H, Fujimoto M, Grotendorst GR, Takehara K: Connective tissue growth factor gene expression in tissue sections from localized scleroderma, keloid, and other fibrotic skin disorders. J Invest Dermatol 1996, 106:729-733 [DOI] [PubMed] [Google Scholar]
- 54.Sambo P, Baroni SS, Luchetti M, Paroncini P, Dusi S, Orlandini G, Gabrielli A: Oxidative stress in scleroderma: maintenance of scleroderma fibroblast phenotype by the constitutive up-regulation of reactive oxygen species generation through the NADPH oxidase complex pathway. Arthritis Rheum 2001, 44:2653-2664 [DOI] [PubMed] [Google Scholar]
- 55.Candido R, Jandeleit-Dahm KA, Cao Z, Nesteroff SP, Burns WC, Twigg SM, Dilley RJ, Cooper ME, Allen TJ: Prevention of accelerated atherosclerosis by angiotensin-converting enzyme inhibition in diabetic apolipoprotein E-deficient mice. Circulation 2002, 106:246-253 [DOI] [PubMed] [Google Scholar]
- 56.Mervaala EMA, Müller DN, Park JK, Dechend R, Schmidt F, Fiebeler A, Bieringer M, Breu V, Ganten D, Haller H, Luft FC: Cyclosporin A protects against angiotensin II-induced end-organ damage in double transgenic rats harboring human renin and angiotensinogen genes. Hypertension 2000, 35:360-366 [DOI] [PubMed] [Google Scholar]
- 57.Shihab FS, Andoh TF, Tanner AM, Noble NA, Border WA, Franceschini N, Bennett WM: Role of transforming growth factor-β 1 in experimental chronic cyclosporine nephropathy. Kidney Int 1996, 49:1141-1151 [DOI] [PubMed] [Google Scholar]
- 58.Schmelzle T, Hall MN: TOR, a central controller of cell growth. Cell 2000, 103:253-262 [DOI] [PubMed] [Google Scholar]
- 59.Nashan B: The role of Certican (everolimus, rad) in the many pathways of chronic rejection. Transplant Proc 2001, 33:3215-3220 [DOI] [PubMed] [Google Scholar]
- 60.Daniel C, Ziswiler R, Frey B, Pfister M, Marti HP: Proinflammatory effects in experimental mesangial proliferative glomerulonephritis of the immunosuppressive agent SDZ RAD, a rapamycin derivative. Exp Nephrol 2000, 8:52-62 [DOI] [PubMed] [Google Scholar]
- 61.Lieberthal W, Fuhro R, Andry CC, Rennke H, Abernathy VE, Koh JS, Valeri R, Levine JS: Rapamycin impairs recovery from acute renal failure: role of cell-cycle arrest and apoptosis of tubular cells. Am J Physiol Renal Physiol 2001, 281:693-706 [DOI] [PubMed] [Google Scholar]
- 62.Chan CC, Martin DF, Xu D, Roberge FG: Side effects of rapamycin in the rat. J Ocul Pharmacol Ther 1995, 11:177-181 [DOI] [PubMed] [Google Scholar]
- 63.Guba M, von Breitenbuch P, Steinbauer M, Koehl G, Flegel S, Hornung M, Bruns CJ, Zuelke C, Farkas S, Anthuber M, Jauch KW, Geissler EK: Rapamycin inhibits primary and metastatic tumor growth by antiangiogenesis: involvement of vascular endothelial growth factor. Nat Med 2002, 8:128-135 [DOI] [PubMed] [Google Scholar]