

Abstract
The lymph node paracortex is composed of a network of fibroblastic reticular cells (FRC) and reticular fibers linking sinuses to blood vessels. Using immunostaining for the inducible enzyme/adhesion molecule tissue transglutaminase (TG), we demonstrate coordinate regulation of multiple stromal cell types of this reticular network including FRC, endothelial cells and sinus lining cells. Tissue transglutaminase is expressed at low levels in the paracortex around primary follicles but is markedly up-regulated in stromal cells around hyperplastic germinal centers and then down-regulated around regressing follicles. In cultured FRC, TG is induced 5- to 20-fold and becomes colocalized with matrix proteins by treatment with interleukin-4, but not by other cytokines that are commonly increased in lymph upon immune activation. Coordinate TG up-regulation is observed surrounding nodules of follicular lymphoma (14 of 15 cases) and in the FRC and endothelium of classical Hodgkin’s disease, two tumor types that also showed an activated paracortical phenotype. Small lymphocytic lymphoma showed minimal TG staining, with other lymphoma types showing patterns suggesting differential TG regulation. Using TG as a stromal marker, we have identified differential modulation of the phenotype of the lymph node reticular network that parallels change in the B-cell compartment.
The regulation of the germinal center reaction has been the primary focus of study in lymph node biology. Recently, the role of the extrafollicular regions of lymph node in regulating immune function have received more attention. 1 In the lymph node paracortex, there is a dense reticular network, lined by fibroblastic reticular cells (FRC), that spans the lymph node from the subcapsular sinus to the medullary blood vessels. FRC ensheath, maintain, and are supported by reticulin fibers that crisscross the entire lymph node space, with the exception of the follicles. The reticular network, originally demonstrated by electron microscopy studies, has also been functionally defined by a combination of structural and tracer studies. 2
The nodal reticular network has been conceptualized by Anderson and Shaw 1 as a concentric arrangement of nested cylinders or “corridors” of FRC that encircle nodal blood vessels and radiate outwards to the sinuses. A potential space between the FRC and the reticular fibers, termed a “conduit”, has been postulated to mediate fluid flow directly from the sinuses to the perivascular space. 3 Several studies have demonstrated that soluble molecules, including cytokines and chemotactic chemokines, can follow the conduit system and rapidly move from the lymph node sinuses to blood vessels deep in the lymph node. 2,4 Soluble mediators can thus be delivered to the abluminal side of the high endothelial venules (HEV), the blood vessels which mediate entry of lymphocytes from the bloodstream. In this way, cytokines entering the lymph from sites of inflammation can rapidly modulate the adhesive properties of HEV and increase the trafficking of leukocytes into the lymph node. 4,5
The functional state of the lymph node could also be differentially regulated by controlling the phenotype of the reticular network which provides the “corridor” where antigen-presenting cells and lymphocytes migrate and interact. To search for such dynamic changes in this network occurring during the immune reaction, we use immunostaining for an inducible enzyme, tissue transglutaminase (TG), a protein involved in mediating extracellular matrix production, and integrin adhesion. We demonstrate coordinate regulation of TG in sinus lining cells (SLC), FRC, and endothelial cells of the reticular network in various reactive and neoplastic lymph node conditions and in cultured FRC by interleukin (IL)-4 treatment.
Materials and Methods
Lymph Node Samples
Representative cases of normal and neoplastic lymph nodes were selected from the pathology files of the University of Texas M.D. Anderson Cancer Center. We included histologically and immunophenotypically typical cases of follicular hyperplasia with progressive transformation of germinal centers (PTGC, n = 4), follicular hyperplasia without PTGC (n = 6), chronic lymphocytic leukemia/small lymphocytic lymphoma (CLL/SLL, n = 12), including 3 cases with increased prolymphocytes, follicular lymphoma (n = 15), mantle cell lymphoma (MCL, n = 4), nodal marginal zone B-cell lymphoma (MZL, n = 4), lymphoplasmacytic lymphoma/Waldenström macroglobulinemia (n = 3), diffuse large B-cell lymphoma (n = 8), Burkitt lymphoma (n = 1), nodular sclerosis Hodgkin’s disease (n = 4), nodular lymphocyte predominant Hodgkin’s disease (LPHD, n = 4) and diffuse LPHD/T-cell/histiocyte-rich large B-cell lymphoma (n = 3). This study was conducted in accordance with an approved protocol by the institutional review board; investigations were performed in accord with the Helsinki Declaration of 1975.
Immunohistochemistry and Immunofluorescence Studies
Immunostaining was performed on deparaffinized tissue sections of formalin-fixed material following microwave-enhanced antigen retrieval. Detection used avidin-biotinylated peroxidase-conjugated regents (Vectastain Elite, Vector, Burlingame, CA or LSAB+ kit, Dako, Carpinteria, CA) with 3,3′-diaminobenzidine tetrahydrochloride as the chromogenic substrate. The primary antibodies, including transglutaminase and working dilutions, are summarized in Table 1 ▶ . 24
Table 1.
Antibodies Utilized
| Antigen | Clone | Source | Concentration/dilution (retrieval method) |
|---|---|---|---|
| Actin (α+γ) | HHF-35 | Novocastra | 1:500 (citrate) |
| CD21 | IF8 | Dako | 1:200 |
| CD31 | JC/70A | Dako | 1:60 (citrate) |
| CD68 | PG-M1, KP-1 | Dako | 1:200 |
| CD90/Thy-1 | 5E10 | PharMingen | 1:200 |
| CLA | HECA-452 (rat IgM) | PharMingen | 1:100 (citrate) |
| DC-SIGN | h209 (rat IgG2a) | Ebioscience | 1:50 |
| Desmin | D33 | Dako | 1:50 (citrate) |
| Factor XIIIa | Rabbit polyclonal | Calbiochem | 1:300 (citrate) |
| Fascin | 55K-2 | Dako | 1:1000 |
| Fibronectin | FN-3E2 | Sigma | 1:400 (citrate) |
| Keratin | Cam5.2 | Dako | 1:10 (citrate) |
| Prolyl hydroxylase-β | 3-2-B12 | ICN | 1:200 (citrate) |
| S100 | Rabbit polyclonal | Dako | 1:200 (citrate) |
| Tenascin | TN2 | Dako | 1:50 (trypsin-EDTA) |
| Transglutaminase (guinea pig liver) | Goat polyclonal | Reference 24 | 5 μg/ml (citrate) |
| Transglutaminase (guinea pig liver) | CUB7402 | Neomarkers | 1:300 (citrate) |
For immunofluorescence, the primary antibodies were applied for one hour, followed by a mixture of biotinylated horse anti-goat immunoglobulin (Ig) (1:200; Vector) and, depending on the primary antibody used, FITC-labeled rabbit anti-mouse IgG (1:100; Sigma) to detect monoclonal primary antibodies, or Cy2-labeled donkey anti-rabbit IgG (1:200; The Jackson Laboratory, Bar Harbor, ME) to detect rabbit primary antibodies. As the third step, Texas Red-labeled streptavidin (TXR-SAV, 1:200; Jackson) and Cy2-labeled donkey anti-rabbit IgG (1:100; Jackson) were used. In some double-labeling experiments two monoclonal mouse primary antibodies (mAb) were used. In such cases the first primary mAb was followed by biotinylated horse anti-mouse IgG (1:200; Vector), and blocked by the Mouse on Mouse kit (Vector). This was followed by the second primary mAb, FITC-labeled rabbit anti-mouse IgG (1:100; Sigma), and simultaneously applied TXR-SAV and Cy2-labeled donkey anti-mouse IgG (1:100; both from Jackson). Slides were viewed in a Nikon Optiphot fluorescent microscope using epifluorescence illumination with appropriate filters.
Cell Culture and Cytokine Stimulation
Fibroblastic reticular cells were isolated from human benign hyperplastic lymph nodes following manual dissection of the cortex away from the medullary areas and the capsule. The stroma was partially depleted of lymphocytes by manual disaggregation. Stromal fragments were then treated with the enzymes hyaluronidase and a mixed collagenase solution to obtain a cell suspension. The culture was depleted of monocytes and dendritic cells by briefly adhering tissue fragments to plastic. Similar cultures of primary dermal fibroblasts were obtained from a skin biopsy specimen following enzymatic digestion. The purity of established cultures was assessed by immunohistochemistry and immunofluorescence for CD21, CD31, CD68, CD90/Thy-1, muscle-specific actin (HHF-35), desmin, and S100 protein.
Adherent fibroblastic cultures were maintained by continuous passage at 37°C in a 5% CO2 atmosphere in RPMI1640 medium (Life Technologies, Inc., Grand Island, NY) containing 15% fetal bovine serum, 2 mmol/L L-glutamine (Life Technologies, Inc.), 10 mmol/L 4-(2-Hydroxyethyl)-1-piperazineethanesulfonic acid (HEPES) (FisherBiotech, Fair Lawn, NJ), and a combination antibiotic-antimycotic (all from Life Technologies, Inc.). At time of cytokine stimulation, FRC cultures were between 31 and 50 days old and were assayed in 6-well plates or in multiwell glass slide chambers. Cytokines tested included human tumor necrosis factor (TNF, 20 ng/ml; BD Biosciences, Woburn, MA), interferon-γ (Sigma), IL-4 (10 ng/ml; Peprotech, Rocky Hill, NJ) and IL-6 (10 ng/ml; Peprotech). RNA was extracted after 4, 24, and 72 hours of culture with cytokines.
RNA Analysis by Quantitative RT-PCR
Total RNA was extracted using Trizol reagent (Gibco-BRL, Gaithersburg, MD) and dissolved in 20 μl of 1X polymerase chain reaction (PCR) buffer supplemented with 5 mmol/L MgCl2, 10 mmol/L dithiothreitol (DTT), 4 units of RNasin (Promega, Madison, WI), 3 units of DNase I (Gibco-BRL) and incubated for 30 minutes at 37°C to digest contaminating DNA. An additional 20 μl of distilled water was added and DNase I was inactivated at 75°C for 10 minutes.
Reverse transcription (RT) and PCR were run in 96-well plates. The reaction was carried out in 10 μl buffer containing 2 μl extracted cellular RNA, 500 μmol/L of each dNTP, 200–300 nmol/L of reverse primer, 10 mmol/L DTT and 10 units of Superscript II reverse transcriptase (Life Technologies). The reaction mixture was incubated at 50°C for 30 minutes followed by heat inactivation at 72°C for 10 minutes. The entire 10-μl RT reaction mixture was used for subsequent PCR amplification by adding 40 μl of PCR master mix to the same wells. The PCR reaction mixture included 1X PCR buffer, 200 μmol/L of each dNTP, and 1.25 units Taq polymerase (Roche Molecular Biochemicals, Indianapolis, IN) in a final volume of 50 μl. The optimal concentration of MgCl2, primers, and the fluorogenic Taqman probe varied depending on the target transcript. The oligonucleotide sequences and reaction conditions are summarized in Table 2 ▶ . Amplification and data acquisition were performed in an ABI Prism 7700 Sequence Detector (Applied Biosystems, Foster City, CA) using the following cycle conditions: initial denaturation at 95°C for 1 minute, followed by 40 cycles of denaturation at 95°C for 12 seconds, and annealing at 60°C for 1 minute.
Table 2.
Oligonucleotide Sequences and Reaction Conditions for qRT-PCR
| Primer position | Probe position | Primer cc (nM) | Probe cc (nM) | Mg2+ cc (mM) | Sequence | |
|---|---|---|---|---|---|---|
| β-actin | 1020+ | 100 | 4 | ATCAAGATCATGCTCCTCCTGAGCGC | ||
| 997+ | 400 | CCCTGGCACCCAGCAC | ||||
| 1067− | 400 | GCCGATCCACACGGAGTAC | ||||
| TG | 564− | 100 | 4 | TCCAGGTACACAGCATCCGCTGGG | ||
| 537+ | 300 | CTTCATTTGCTCTTCAACGC | ||||
| 614− | 300 | ACATACTCCTGCCGCTCCTC |
RT-PCR reactions were run in triplicate for the standards and in duplicate for unknown samples. For each duplicate reaction a “no-RT” control was run, which included all components of the RT mixture except reverse transcriptase. Each run consisted of a synthetic RNA (sRNA) or DNA standard (typically 200 fg to 20 attog) in triplicate, 20 to 25 unknown samples in duplicate, one “no-RT” well for each duplicate unknown to control for tissue-derived DNA contamination, and a “no template” control well consisting of all of the components of the RT and PCR reaction mixtures, except RNA, to control for extraneous DNA contamination. To enable us to determine the number of molecules in the starting material, sRNA (for TG) or single-strand DNA (for β-actin) was used to construct standard curves. sRNA was transcribed from TG cDNA that was tailed via PCR to introduce the promoter of the T7 RNA polymerase using the MEGAshortscript Kit (Ambion, Austin, TX) as previously described. Tenfold serial dilutions of the sRNA or single-strand DNA were used to generate the TG and β-actin standard curves, respectively.
Statistics
We used Students’s t-test for paired samples to evaluate the statistical significance of measured mRNA differences between control and IL4-treated cell cultures.
Results
Transglutaminase Immunostaining of the Paracortical Axis of Lymph Node
Paraffin-section immunostaining of sections from all 10 reactive lymph nodes studied detected variable TG immunoreactivity in at least four stromal cell types: SLC, endothelial cells, FRC, and rare histiocytoid/dendritic forms that included occasional epithelioid histiocytes in follicles. Transglutaminase staining was strongest in the FRC and HEV and showed weaker staining of other endothelium and weak staining of rare histiocytoid/dendritic cells (Figure 1) ▶ . Transglutaminase was negative in lymphocytes and largely absent in lymphoid follicles with the exception of scattered histiocytes and endothelium of rare blood vessels.
Figure 1.
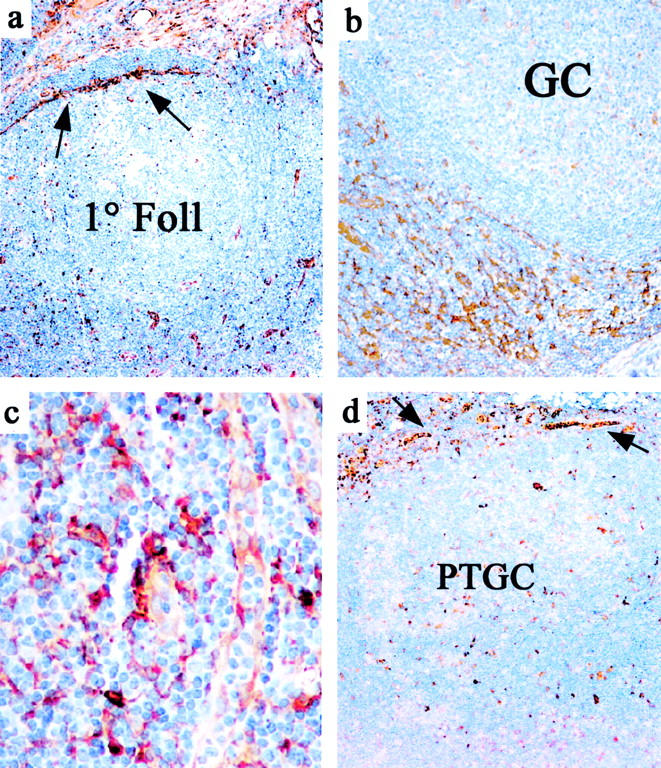
Changes in tissue transglutaminase staining in reticular cells during the course of the germinal center reaction. a: TG staining pattern around a subcapsular primary follicle (1° Foll) is restricted largely to inner SLC (indicated by arrows). b: Around a hyperplastic germinal center (GC), TG staining shows strong staining of interfollicular FRC and many blood vessels. c: High magnification shows variable TG staining in the paracortical area which is strongest in FRC and weaker in endothelium and occasional interstitial histiocytoid/dendritic cells. d: TG expression is decreased in stroma around a progressively transformed follicle (PTGC) but is seen in scattered histiocytoid/dendritic cells within the altered follicle and in the inner SLC and capsular fibroblasts (arrows)
There were three distinct patterns of reticular network staining by TG that showed regional variations within the lymph node, usually corresponding to the stage of maturation of the follicles in that area. Surrounding primary follicles, there was prominence of strongly TG+ SLC (Figure 1a) ▶ but minimal staining of FRC network and paracortical blood vessels. In contrast, around hyperplastic germinal centers, the HEV and perifollicular FRC network were strongly TG+ (Figure 1b) ▶ . HEV around well-developed germinal centers sometimes demonstrated polarized TG staining with the apical cytoplasm more intensely positive for TG. Endothelium of other blood vessels showed more uniform (and weaker) cytoplasmic staining for TG (Figure 1c) ▶ .
The pattern of TG staining around late-stage germinal centers depended on the pattern of follicular dissolution. Around regressed germinal centers, TG immunostaining was often restricted to endothelium in small blood vessels with minimal FRC staining. In cases with PTGC, the perifollicular areas showed strong TG only in endothelium and histiocytoid cells (Figure 1d) ▶ . Three PTGC cases also showed increased numbers of CLA+ TG+ histiocytoid/dendritic cells within the transformed follicles.
Modulated Expression of Tissue Transglutaminase in Different Reticular Cell Types
The reticular network of lymph nodes can be conceptualized as a continuous network linking the sinuses to the abluminal side of the HEV through the corridors created by the reticular network (Figure 2) ▶ . We used dual-labeling immunofluorescence to examine variations in TG staining in all stromal cell types comprising this reticular network (Table 3) ▶ .
Figure 2.
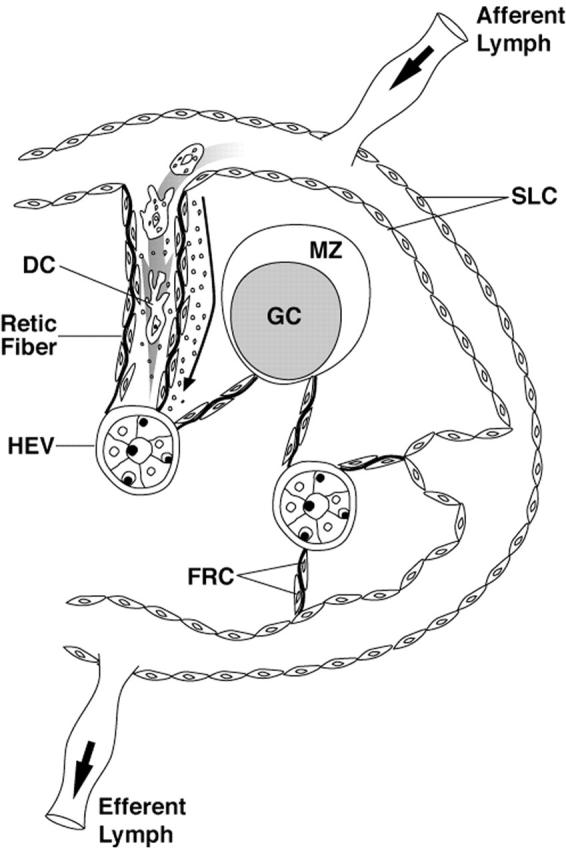
A model of the lymph node reticular network extending from SLC to the HEV. At the upper left, an expanded view of the proposed structure is shown with a dendritic cell (DC) migrating from the subcapsular sinus through a corridor created by reticular fibers lined by FRC. Solute, represented as small dots, is shown spreading down a conduit between the FRC and the reticular fiber. The reticular network does not extend into the GC (Adapted from the model of Anderson and Shaw).
Table 3.
Tissue Transglutaminase Staining Pattern of Reticular Cell Types in Reactive Lymph Node
| Cell type | Surrounding primary follicle | Surrounding secondary follicle | Surrounding regressed follicle |
|---|---|---|---|
| FRC | TG− | TG++ | TG−/+ |
| SLC | TG++, plump | TG+, flattened | TG+, inconspicuous |
| CLA+ HEV | TG−/+, inconspicuous | TG++, prominent | TG−/+, variable |
| TG+ dendritic forms | Few | Few | Increased in PTGC follicles |
Staining intensity of tissue TG was graded as intense (++), moderately intense (+), variably positive (−/+), and dim/negative (−).
To analyze the FRC network, dual-immunofluorescence for TG combined with actin, desmin, keratin, CD90/Thy-1, and prolyl hydroxylase-β was used. The FRC network including the perivenular fibroblast, a single-layer stromal cell sheath around the HEV, was positive for TG (Figure 3,a and b) ▶ . Regional phenotypic variations in the FRC network were noted with desmin positivity most pronounced in the deep paracortex and TG expression highest in those FRC adjacent to the sinuses (Figure 3a) ▶ . 6 Keratin/CAM5.2 highlighted only a small subset of TG+ FRC in the deep paracortex (not shown). Dual-staining with components of the reticular fibers (ie, tenascin and fibronectin) show close relationship of TG+ FRC with the reticular fibers throughout the interfollicular zones of the lymph node, but abruptly ending at the follicle.
Figure 3.
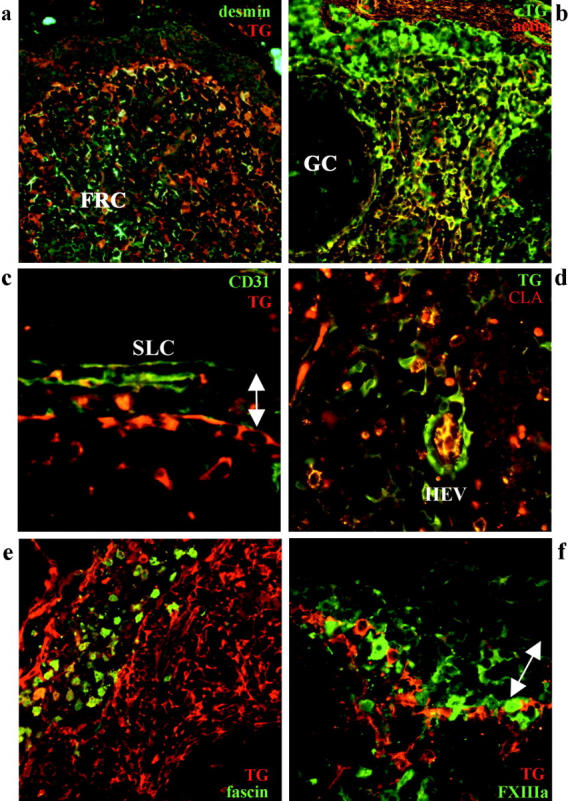
Immunofluorescent analysis of tissue transglutaminase-positive cells in reactive lymph node. a: The FRC network shows strongest TG (red) immunoreactivity in the subcapsular areas with the reverse pattern seen with desmin (green), detected with goat anti-TG/TXR; desmin/Cy2. b: The FRC network shows strong immunoreactivity for both actin (red) and TG (green), generating a yellow signal (detected with mouse anti-TG/Cy2; actin/TXR). c: The inner SLC are positive for TG (red) and negative for CD31 (green), with the reverse pattern seen for the outer SLC (detected with goat anti-TG/TXR; CD31/Cy2). d: Among blood vessels, HEV show the strongest staining for TG (green) with the endothelium also positive for CLA (red), thus appearing as yellow (detected with mouse anti-TG/Cy2; CLA/TXR). e: Dendritic cells and histiocytes in an intranodal sinus are strongly positive for fascin (green) but variably positive for TG (red) (goat anti-TG/TXR; fascin/Cy2). f: Migrating DC of various stages show variable staining for Factor XIIIa but are mostly negative for TG (red) (goat anti-TG/TXR; FXIIIA/Cy2). The arrow indicates the location of subcapsular sinus.
SLC were analyzed using TG and CD31 and Factor XIIIa and showed polarized TG staining, with the CD31+ outer SLC on the capsular side of the sinus showing no immunoreactivity for TG, in contrast to the strong TG staining of the inner SLC (Figure 3c) ▶ . Transglutaminase staining was strongest in the plump, protruding SLC noted in sinuses in quiescent areas of the lymph node, whereas weaker TG staining was noted in the flattened SLC adjacent to well developed follicles. TG was positive in all CD31+ endothelium with the strongest staining noted in the CLA+ endothelium of HEV surrounding hyperplastic germinal centers (Figure 3d) ▶ . Dual-labeling with TG and Factor XIIIa, S100 protein, DC-SIGN, Factor XIIIa, or fascin to detect dendritic and histiocytic forms revealed partial TG staining of fascin+ dendritic cells within sinuses but an absence of TG staining in intranodal interdigitating dendritic cells (Figure 3e) ▶ suggesting strongest TG expression in the intrasinusoidal dendritic cell subset. The FXIIIa+ subset of dendritic cells were also largely negative for TG (Figure 3f) ▶ . The fascin+, S100+/- histiocytes of the germinal centers (ie, tingible-body macrophages) were usually weakly TG+.
The results are consistent with up-regulation of TG in FRC, dendritic cells and blood vessels in the sinusoidal and paracortical areas subtending hyperplastic germinal centers. In the reticular network surrounding follicles in the later stages of the germinal center reaction, TG expression was down-regulated in most cells, expressed only in SLC and at the basal level seen in non-activated endothelium.
Cytokine Induction of Tissue Transglutaminase in Primary FRC
We next examined the effect on TG expression of several cytokines that are highly increased in the lymph during immune activation. These included TNF, interferon gamma (IFN-γ), IL-4, and IL-6. We tested the effects of each of these cytokines, alone and in combination, on early-passage primary cultures of FRC isolated from reactive lymph node (Figure 4) ▶ .
Figure 4.
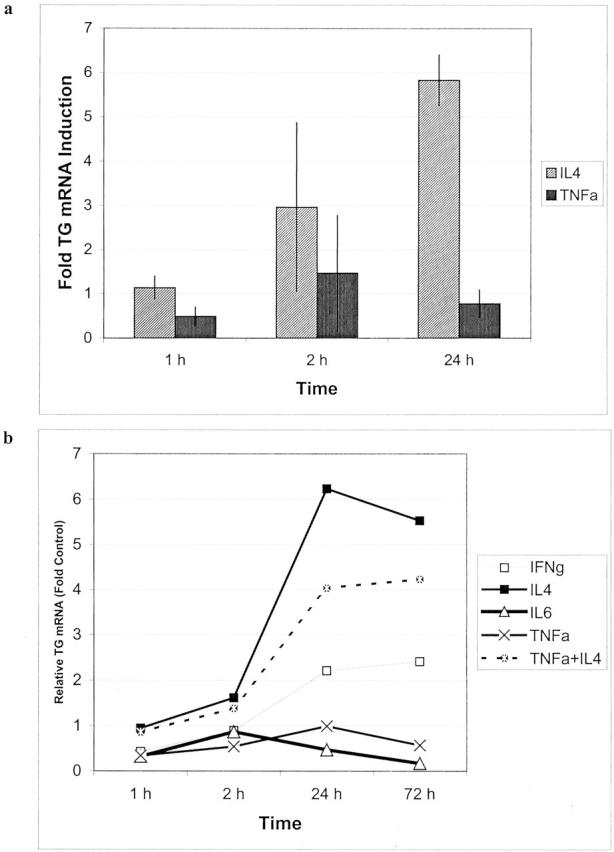
Transcriptional regulation of tissue transglutaminase in cultured FRC as determined by qRT-PCR. a: TG transcriptional induction in FRC to response to IL-4 treatment as compared to TNF (average of two experiments). b: A representative experiment comparing TG expression in FRC following exposure to different proinflammatory cytokines.
Primary lymph node fibroblast cultures were uniformly positive for CD90/Thy-1 and negative for S100, CD21, and CD31 (Figure 5a ▶ , inset). As shown in Figure 4a ▶ , IL-4 treatment of cultured FRC for 1, 2, and 24 hours resulted in dramatic increases in TG mRNA levels as assayed by qRT-PCR. IFN-γ treatment induced minimal TG up-regulation and IL-6 and TNF did not induce TG transcription (Figure 4b) ▶ . In contrast, TNF treatment strongly up-regulated transcription of a number of other genes tested including the chemokine gene GROα, which showed 100-fold induction (not shown), Thus, the cultured FRC were appropriately responsive to stimulatory cytokines. Cultured dermal fibroblasts showed a similar pattern of TG induction with IL-4 (not shown).
Figure 5.

Tissue transglutaminase up-regulation and redistribution in cultured FRC following IL-4 treatment. a: Immunofluoresence pattern in untreated FRC shows low-level diffuse TG immunoreactivity. Inset shows uniform membrane staining of cultures for CD90/Thy-1. b: FRC cultures treated with 10 ng/ml of IL-4 for 72 hours show marked up-regulation and redistribution of TG. Inset shows variable staining of FRC for smooth muscle actin. c: Fibronectin staining pattern in unstimulated FRC shows deposition in extracellular matrix fibrils. d: Fibronectin staining pattern in IL-4 stimulated FRC shows an similar distribution with cellular TG staining at points of contact with extracellular matrix. Dual-staining showed TG colocalization with fibronectin (not shown).
Figure 5 ▶ shows the results of immunofluorescence analysis of primary FRC cultures treated with 10 ng/ml of IL-4 for 72 hours. In untreated FRC cultures, TG was weakly expressed (Figure 5a) ▶ . In IL-4-treated cells, cell spreading and cytoplasmic TG content were enhanced (Figure 5b) ▶ . In addition, a redistribution of TG was seen, with most of the reactivity deposited along delicate fibrillar extracellular structures. Labeling for fibronectin showed a similar pattern supporting colocalization of TG with extracellular matrix. Immunofluorescence with muscle-specific actin revealed only scattered strongly positive myofibroblastic cells comprising approximately 10% of all cells, with a pattern of staining distinct from that of TG (Figure 5b ▶ , inset).
Reticular Network Staining Patterns in Lymphoma
We next analyzed stromal phenotypes in lymph nodes involved by lymphoma (summarized in Table 4 ▶ ). In all cases of CLL/SLL, most blood vessels, including CLA+ HEV, did not express TG and TG+ FRC were largely indiscernible (Figure 6a) ▶ . CLL cases showed open sinuses with plump, TG+ SLC (Figure 6a ▶ inset). This pattern of prominent TG+ SLC, TG-negative HEV and virtual absence of FRC in CLL/SLL resembled the pattern seen around unstimulated primary follicles.
Table 4.
Tissue Transglutaminase Staining Patterns of Stroma in B-Cell Non-Hodgkin’s Lymphoma and Hodgkin’s Disease
| Cell type | SLL/CLL | FL, classical HD | MCL, MZL |
|---|---|---|---|
| FRC | TG−/+, inconspicuous | TG++, prominent | TG−/+, inconspicuous |
| SLC | TG++, plump | TG+, flattened | Inconspicuous |
| HEV endothelium | TG−/+, inconspicuous | TG++, prominent | TG−/+, variable |
| TG+ dendritic forms | Present in sinuses, frequently FXIIIa+ | Scattered in paracortex, FXIIIa− | Numerous, usually FXIIIa− |
Staining intensity of tissue TG was graded as intense (++), moderately intense (+), variably positive (−/+), and dim/negative (−).
Figure 6.

Tissue TG staining in lymphoma. a: Small lymphocytic lymphoma show a virtual absence of staining in HEV and the FRC network with strong TG immunoreactivity limited to SLC (inset). b: Follicular lymphoma with strongly TG+ FRC network, blood vessels and dendritic cells surrounding neoplastic follicles. c: Mantle cell lymphoma shows numerous TG+ histiocytoid cells with the FRC network negative for TG. d: Nodular sclerosis Hodgkin’s disease show intensely TG+ myofibroblasts in perinodular areas extending into adjacent uninvolved parenchyma (inset).
In follicular lymphoma, there was uniform and marked up-regulation of TG in the entire FRC network in 14 of 15 cases (Figure 6b) ▶ , and a prominence of strongly TG+ HEV in 12 of 15 cases. TG+ SLC were inconspicuous in 11 of 15 cases. This pattern resembled that seen around hyperplastic germinal centers, but in contrast to reactive lymph nodes, this pattern was uniformly present around neoplastic follicles without regional variations in a given lymph node. Both MCL and MZL showed weak-to-negative TG staining of the FRC network but prominent FXIIIA−/TG+ histiocytoid cells. CLA+ HEV were present, but typically only weakly TG+ (Figure 6c) ▶ .
In nodular sclerosis Hodgkin’s disease, strong TG staining was seen surrounding tumor nodules in all stromal cell types, including FRC, HEV and interstitial dendritic cells as well as capsular fibroblasts (Figure 6d) ▶ . Nodular LPHD showed the lowest levels of TG stromal staining of any tumor type, with only TG+ SLC and occasionally weakly TG+ blood vessels. In contrast, the 3 cases of diffuse LPHD/T-cell/histiocyte-rich large B-cell lymphoma were associated with strong expression of TG in FRC, blood vessels and histiocytes (not shown).
Discussion
We used immunostaining for the inducible enzyme TG to highlight changes occurring in the reticular network of normal and neoplastic lymph nodes. In reactive follicular hyperplasia, we noted coordinated up-regulation of TG expression in the paracortical FRC network and blood vessels surrounding hyperplastic follicles at the peak of B-cell expansion. Similarly, the paracortical areas surrounding nodules in follicular lymphoma showed marked TG staining of blood vessels and FRC. In contrast, the areas surrounding follicles where the germinal center reaction was terminating (either regressed or transformed follicles) showed down-regulation of TG in endothelium and the FRC network.
Transglutaminase staining thus uncovers coordinate regulation of cell types of the reticular network in tandem with the various stages of the germinal center reaction. This effect was often variable within a single lymph node; one area with multiple well-developed germinal centers will show strong paracortical TG expression, whereas an adjacent area with mostly regressing follicles will show minimal TG expression in the paracortex. It is likely that up-regulation of TG is a marker of functional paracortical activation because high TG expression in endothelial cells is associated with strong CLA staining and activated HEV morphology. 7
Transglutaminase had been previously characterized as a cytokine- and retinoid-inducible molecule and it has diverse intracellular and extracellular activities that include stabilization of the extracellular matrix related to its cross-linking activity, activation of cell adhesion, signal transduction, and participation in (or protection against) apoptosis. 8-10 The type and duration of the antigenic stimuli usually determine the particular cytokines that appear in a sequential fashion in lymph draining into the subcapsular sinuses. These cytokines include IL-1, TNF, IFN-γ, IL-4, and IL-6. 11 Comparing these factors, we have shown that IL-4 is capable of markedly inducing TG expression in cultured nodal FRC and results in redistribution of surface TG to areas of extracellular matrix deposition. This suggests that IL-4 induction of TG may play a role in formation and dynamic reorganization of the reticular fiber network. Interestingly, lack of TG induction by TNF, a cytokine that is a potent inducer of TG in epithelial cell types, 12 suggests a site-specific action of lymph-derived cytokines.
A current model of lymph node structure postulates that the reticular network can mediate rapid delivery of cytokines and chemokines entering the lymph node to the HEV. 2 Our finding of phenotypic modulation of FRC network by cytokines coupled with the known myofibroblastic nature of FRC would support an expanded model of paracortical function that incorporates rapid functional plasticity. Under some conditions, the local FRC network may be in an “open” state, supporting high-throughput of cells and solutes to the areas around the developing follicle. This state, correlated with the peak of the germinal center reaction, would be associated with up-regulation of TG uniformly throughout the paracortex, possibly to aid in cell motility. At other times, a “closed” state of the reticular network might restrict cell migration from the sinuses. At these times, the paracortex would be isolated from extranodal inputs, with TG expression restricted to the SLC.
Previous investigators have stressed that the paracortex can function with the germinal center as part of a single functional unit. 13,14 The coordinate and localized regulation of the paracortex in tandem with the follicle microenvironment likely has important consequences for follicle formation as well as germinal center function. Subcortical primary follicles, lacking blood vessels and histiocytes, are believed to act as the nidus for developing secondary follicles. 15 However, germinal center formation is dependent on the production of several cytokines, particularly lymphotoxin-β, by localized populations of nodal stromal cells. 16,17 During the initial stages of germinal center formation cytokine activation of the paracortex, occurring contemporaneously with the B-cell-antigen processing cell interactions, could induce reorganization of the local paracortical FRC/blood vessel network, thus accommodating germinal center expansion.
The characteristic pattern of TG staining in the stroma of different lymphoma types suggests that a breakdown in the normal regulation of the reticular network occurs in most tumor types. An exception is follicular lymphoma, in which TG staining paralleled that seen around secondary follicles in hyperplastic lymph nodes. However, compared with secondary follicles, FL showed a more exaggerated and persistent pattern of TG up-regulation. This could be due to T-cell and B-cell derived IL-4 that, in addition to modulating stromal cell function, may also directly stimulate growth and/or survival of follicular lymphoma cells. 18-22 The strong TG staining pattern in nodular sclerosis Hodgkin’s disease likely reflects the fibroblastic and myofibroblast proliferations produced by the abundant cytokines (including IL-4 and IL-13), 23 secreted both by tumor cells and admixed non-neoplastic T-cells. In contrast, CLL/SLL showed down-regulation of TG in all but the subcapsular SLC. This pattern resembles the pattern seen in unstimulated areas of a normal lymph node. The staining patterns of MCL and MZL were reminiscent of those seen around regressing follicles and PTGC with increased TG+ histiocytes and low expression in HEV and FRC.
Overall, TG immunostaining demonstrates that the immunophenotype of the reticular cells of the lymph node paracortex is highly regulated over the course of the normal immune response and in lymphoma. In reactive lymph nodes, paracortical changes parallel the stages of follicular maturation but this complex expression pattern becomes perturbed and simplified in lymphomas of different types.
Acknowledgments
We thank Kausholi Patel and Michael H. Fernandez for technical assistance.
Footnotes
Address reprint requests to Dan Jones, M.D., Ph.D., Department of Hematopathology, Box 72, University of Texas M.D. Anderson Cancer Center, 1515 Holcombe Blvd, Houston, TX 77030. E-mail: dajones@mdanderson.org.
Supported by research grant CA16672 from the National Cancer Institute, Department of Health and Human Services.
This work was presented, in part, at the 2002 Annual Meeting of the United States and Canadian Society of Pathology, in Chicago, Ilinois.
References
- 1.Anderson AO, Shaw S: T cell adhesion to endothelium: the FRC conduit system and other anatomic and molecular features which facilitate the adhesion cascade in lymph node. Semin Immunol 1993, 5:271-282 [DOI] [PubMed] [Google Scholar]
- 2.Gretz JE, Norbury CC, Anderson AO, Proudfoot AE, Shaw S: Lymph-borne chemokines and other low molecular weight molecules reach high endothelial venules via specialized conduits while a functional barrier limits access to the lymphocyte microenvironments in lymph node cortex. J Exp Med 2000, 192:1425-1440 [DOI] [PMC free article] [PubMed] [Google Scholar]
- 3.Kaldjian EP, Gretz JE, Anderson AO, Shi Y, Shaw S: Spatial and molecular organization of lymph node T cell cortex: a labyrinthine cavity bounded by an epithelium-like monolayer of fibroblastic reticular cells anchored to basement membrane-like extracellular matrix. Int Immunol 2001, 13:1243-1253 [DOI] [PubMed] [Google Scholar]
- 4.Palframan RT, Jung S, Cheng G, Weninger W, Luo Y, Dorf M, Littman DR, Rollins BJ, Zweerink H, Rot A, von Andrian UH: Inflammatory chemokine transport and presentation in HEV: a remote control mechanism for monocyte recruitment to lymph nodes in inflamed tissues. J Exp Med 2001, 194:1361-1373 [DOI] [PMC free article] [PubMed] [Google Scholar]
- 5.Janatpour MJ, Hudak S, Sathe M, Sedgwick JD, McEvoy LM: Tumor necrosis factor-dependent segmental control of MIG expression by high endothelial venules in inflamed lymph nodes regulates monocyte recruitment. J Exp Med 2001, 194:1375-1384 [DOI] [PMC free article] [PubMed] [Google Scholar]
- 6.Jones D, Jorgensen JL, Shahsafaei A, Dorfman DM: Characteristic proliferations of reticular and dendritic cells in angioimmunoblastic lymphoma. Am J Surg Pathol 1998, 22:956-964 [DOI] [PubMed] [Google Scholar]
- 7.Jones D: Dismantling the germinal center: comparing the processes of transformation, regression, and fragmentation of the lymphoid follicle. Adv Anat Pathol 2002, 9:129-138 [DOI] [PubMed] [Google Scholar]
- 8.Chiocca EA, Davies PJ, Stein JP: The molecular basis of retinoic acid action: transcriptional regulation of tissue transglutaminase gene expression in macrophages. J Biol Chem 1988, 263:11584-11589 [PubMed] [Google Scholar]
- 9.Aeschlimann D, Thomazy V: Protein crosslinking in assembly and remodelling of extracellular matrices: the role of transglutaminases. Connect Tissue Res 2000, 41:1-27 [DOI] [PubMed] [Google Scholar]
- 10.Nanda N, Iismaa SE, Owens WA, Husain A, Mackay F, Graham RM: Targeted inactivation of Gh/tissue transglutaminase II. J Biol Chem 2001, 276:20673-20678 [DOI] [PubMed] [Google Scholar]
- 11.Premier RR, Meeusen EN: Lymphocyte surface marker and cytokine expression in peripheral and mucosal lymph nodes. Immunology 1998, 94:363-367 [DOI] [PMC free article] [PubMed] [Google Scholar]
- 12.Kuncio GS, Tsyganskaya M, Zhu J, Liu SL, Nagy L, Thomazy V, Davies PJ, Zern MA: TNF-α modulates expression of the tissue transglutaminase gene in liver cells. Am J Physiol 1998, 274:G240-G245 [DOI] [PubMed] [Google Scholar]
- 13.van den Oord JJ, de Wolf-Peeters C, Desmet VJ: The composite nodule: a structural and functional unit of the reactive human lymph node. Am J Pathol 1986, 122:83-91 [PMC free article] [PubMed] [Google Scholar]
- 14.van der Oord JJ, de Wolf-Peeters C, de Vos R, Desmet VJ: The paracortical area in dermatopathic lymphadenitis and other reactive conditions of the lymph node. Virchows Arch B Cell Pathol Incl Mol Pathol 1984, 45:289-99 [DOI] [PubMed] [Google Scholar]
- 15.Balogh P, Aydar Y, Tew JG, Szakal AK: Ontogeny of the follicular dendritic cell phenotype and function in the postnatal murine spleen. Cell Immunol 2001, 214:45-53 [DOI] [PubMed] [Google Scholar]
- 16.Mackay F, Browning JL: Turning off follicular dendritic cells. Nature 1998, 395:26-27 [DOI] [PubMed] [Google Scholar]
- 17.Alimzhanov MB, Kuprash DV, Kosco-Vilbois MH, Luz A, Turetskaya RL, Tarakhovsky A, Rajewsky K, Nedospasov SA, Pfeffer K: Abnormal development of secondary lymphoid tissues in lymphotoxin β-deficient mice. Proc Natl Acad Sci USA 1997, 94:9302-9307 [DOI] [PMC free article] [PubMed] [Google Scholar]
- 18.Levens JM, Gordon J, Gregory CD: Micro-environmental factors in the survival of human B-lymphoma cells. Cell Death Differ 2000, 7:59-69 [DOI] [PubMed] [Google Scholar]
- 19.Choe J, Li L, Zhang X, Gregory CD, Choi YS: Distinct role of follicular dendritic cells and T cells in the proliferation, differentiation, and apoptosis of a centroblast cell line, L3055. J Immunol 2000, 164:56-63 [DOI] [PubMed] [Google Scholar]
- 20.Schmitter D, Koss M, Niederer E, Stahel RA, Pichert G: T-cell derived cytokines co-stimulate proliferation of CD40-activated germinal centre as well as follicular lymphoma cells. Hematol Oncol 1997, 15:197-207 [DOI] [PubMed] [Google Scholar]
- 21.Kelly KA, Bucy RP, Nahm MH: Germinal center T cells exhibit properties of memory helper T cells. Cell Immunol 1995, 163:206-214 [DOI] [PubMed] [Google Scholar]
- 22.Johansson-Lindbom B, Borrebaeck CA: Germinal center B cells constitute a predominant physiological source of IL-4: implication for Th2 development in vivo. J Immunol 2002, 168:3165-3172 [DOI] [PubMed] [Google Scholar]
- 23.Maggio E, van den Berg A, Diepstra A, Kluiver J, Visser L, Poppema S: Chemokines, cytokines and their receptors in Hodgkin’s lymphoma cell lines and tissues. Ann Oncol 2002, 13:52-56 [DOI] [PubMed] [Google Scholar]
- 24.Murtaugh MP, Dennison O, Stein JP, Davies PJ: Retinoic acid-induced gene expression in normal and leukemic myeloid cells. J Exp Med 1986, 163:1325-1330 [DOI] [PMC free article] [PubMed] [Google Scholar]