

Abstract
The aim of this study was to develop and validate a molecular index for the diagnosis of hepatocellular carcinoma (HCC) based on genes whose specificity and level of expression are the most discriminating for the diagnosis of HCC. The level of expression of 219 genes was assessed with a real-time reverse transcription-polymerase chain reaction approach in a training set of samples including normal livers (15), cirrhosis (12), and HCC (16). The most informative genes were selected for the molecular index. This index was prospectively validated in a new set of 40 samples (testing set) and in a set of 45 cirrhotic macronodules. 44 out of the 219 genes were differentially expressed in HCC. 13 out of these 44 genes were finally selected for the molecular index according to their diagnostic performance and after exclusion of most redundant genes. Using this index, 42 out of 43 samples of the training set and 39 out of the 40 samples of the testing set were correctly ranked as HCC or not HCC (normal liver or cirrhosis). The index also enabled correct ranking of 44 out of 45 cirrhotic macronodules into 2 groups: benign (including macroregenerative and dysplastic macronodules) and malignant macronodules. This molecular diagnostic index is an efficient tool both for identification of overt HCC as well as minute lesions (cirrhotic macronodules). It might be useful to correctly diagnose borderline lesion or small well-differentiated hepatocellular carcinomas whose diagnosis is often difficult on a histopathological basis.
Hepatocellular carcinoma (HCC) is one of the most common malignancies worldwide. Development of most HCCs results from a multi-step process of carcinogenesis from normal liver to cirrhosis and to cancer that involves a number of successive and additional genetic and epigenetic events. 1-3 Although the diagnosis of HCC is generally easy for the pathologist, some difficulties are still encountered, especially on small tissue samples and in cases of early, borderline, or well-differentiated tumors. Within cirrhosis, HCC may develop from large regenerative nodules, also called macronodules. Although significant efforts have been made in the standardization of classification of cirrhotic precancerous macronodules, the biological behavior of these early lesions is difficult to predict, based only on their morphological characteristics. 4-6 Global genomic analysis could provide valuable help for the diagnosis of these difficult cases by assessing the expression of genes known to be specifically deregulated in HCC. This requires the identification of gene markers differentially expressed in HCC versus non-tumoral tissue, including normal and cirrhotic liver. Genomic-wide cDNA microarrays studies have attempted to describe changes in gene expression profiles associated with the different steps of liver carcinogenesis but results provided potential diversity of molecular changes according to patient, etiology, or tumor size. 7-12 Quantitative real-time reverse transcription-polymerase chain reaction (RT-PCR) method is another approach. Although investigation is limited to a choice of target genes, it is a more easy-to-use method and a sensitive and highly quantitative approach. It allows accurate detection of very low levels of changes in gene expression within multiple samples in a one-step method. 13-15
The aim of the present study was to define the most efficient molecular markers of HCC to establish a specific molecular diagnostic index of HCC. To address this issue, we performed a large-scale quantitative gene expression study of more than 200 genes using real-time RT-PCR in series of HCC, normal liver, and cirrhosis. These genes were chosen because they cover the most pertinent metabolic pathways involved in liver carcinogenesis 16-19 and also after selection of genes that are mainly regulated at the transcriptional level. In an initial screening, using pools of HCC and non-HCC samples, 44 genes were selected according to their significant different expression level in HCC. A further selection among these genes was performed according to their diagnostic accuracy as tested in individual samples and after elimination of redundant genes. Using this approach, a final molecular diagnostic index for the diagnosis of HCC was constructed using the 13 most performant genes in HCC. This index was further validated in a prospective study including normal livers, cirrhosis and HCC as well as in a series of macronodules representative of the different histological types (benign, dysplastic and malignant).
Materials and Methods
Human Tissue Samples and Cell Lines
Tissue samples from 15 normal livers (10 females, 5 males; mean age, 49 years; age range, 2 to 68), 12 cirrhosis (12 males; mean age, 67 years; age range, 46 to 72) related to virus C (6 cases), virus B chronic infection (1 case), or alcohol abuse (5 cases), and 16 HCCs (16 males; mean age, 63 years; age range, 40 to 78) developed within virus C-(14 cases) or alcohol-related cirrhosis (2 cases) were retrieved from the files of the Pathology departments of Beaujon and Bicêtre hospitals. This constituted the training set of samples that was used to set up the molecular index. HCC tumor size varied from 2.5 cm to 20 cm (mean size, 8 cm). All specimens were obtained from surgical liver resections. Normal livers were obtained at a distance from benign lesions (focal nodular hyperplasia or giant hemangiomas). In each case, both immediately frozen tissues (for total RNA extraction) and fixed paraffin-embedded tissues (for histological diagnosis) were available. A stained section was systematically performed from each frozen block to check the adequate sampling of the frozen tissue before total RNA extraction.
Another set of cases (testing sample), including 10 cases of normal liver, 10 cases of cirrhosis, and 20 cases of HCC developed in 14 virus C, 2 virus B, and 4 alcohol-related cirrhosis was studied for the prospective validation of the molecular HCC index.
Furthermore, 45 macronodules from cirrhotic livers, measuring less than 2 cm in diameter and representative of different grades of malignancy, were retrieved from the files of the Pathology department of Pellegrin hospital. These lesions were categorized by three experienced pathologists (V.P., P.B.S., P.B.) into macroregenerative benign (n = 24), low grade dysplastic (n = 8), high grade dysplastic (n = 3) and minute HCC (n = 10). The gene expression profile was also determined in 3 hepatoma-derived cell lines (HepG2, Hep3B, and HuH7).
RNA Extraction
Total RNA was extracted from all frozen liver specimens (100 to 300 mg of frozen tissue) using the acid-phenol guanidium method. The quality of the total RNA samples was determined by electrophoresis through agarose gels and staining with ethidium bromide, and the 18S and 28S RNA bands were visualized under ultraviolet light.
Real-Time Quantitative RT-PCR
Theoretical Basis
Quantitative values are obtained from the cycle number (Ct value) at which the increase in fluorescent signal associated with exponential growth of PCR products starts to be detected by the laser detector of the ABI Prism 7700 Sequence Detection system (PerkinElmer Applied Biosystems, Foster City, CA) using PE Biosystems analysis software according to the manufacturer’s manuals. Each sample was normalized on the basis of its TBP content which was used as the RNA control gene [NM_003194]. Tissue samples were considered eligible for evaluation only if the TBP Ct value fell between 25 and 26, suggesting an appropriate starting amount and quality of total RNA. Results, expressed as N-fold differences in target gene expression relative to the TBP gene, termed “Ntarget”, were determined by the formula:
 |
where the ΔCt value of the sample was determined by subtracting the Ct value of the target gene from the average Ct value of the TBP gene. The Ntarget values of the samples were subsequently normalized such that the mean ratio of the normal liver samples would equal a value of 1.
Primers and Controls
Primers for TBP and the 219 target genes were chosen with the assistance of the computer programs Oligo 5.0 (National Biosciences, Plymouth, MN). They were mainly selected according to results of previous studies based on serial analysis of gene expression or cDNA array procedures in liver tissue. 10-12,20 The list of genes and the design of primers had been validated in a previous study. 15
cDNA Synthesis and PCR Amplification
The real-time RT-PCR protocol was previously detailed. 15 Briefly, all PCR reactions were performed using an ABI Prism 7700 Sequence Detection system (PerkinElmer Applied Biosystems) and the SYBR Green PCR Core Reagents kit (PerkinElmer Applied Biosystems). All reverse transcription was performed with a starting amount of 1 μg of total RNA in a final volume of 20 microliters. Ten microliters of 50-fold diluted cDNA samples were added to 15 μl of the PCR master mix. The thermal cycling conditions comprised an initial denaturation step at 95°C for 10 minutes, 50 cycles at 95°C for 15 seconds, and 65°C for 1 minute.
Strategy of Analysis
As a first approach, RNA pools of each group of normal and diseased livers (normal liver, cirrhosis, and HCC) were constituted by mixing aliquots of equivalent RNA amounts of each fragment of the training samples. Expression of the 219 genes was assessed in each pool to select genes displaying the most robust differential expression, ie, more or less than a threefold variation, in HCC versus normal livers. The expression level of these selected genes was then assessed in each individual sample to check for a potential heterogeneity within each pool and to determine their diagnostic performance (HCC versus normal and cirrhotic livers) with receiving operative curves (ROC) and determination of Area Under Curve (AUC). To limit as much as possible the number of genes to be included into the index, a final selection was performed taking into account those genes with highest AUC (≥ 0.8) and after elimination of redundant gene as shown by gene clustering analysis.
Statistical Analysis
All statistics were performed using NCSS 6.0 software. The comparison of the gene expression level in different groups was performed by independent sample t-test, Mann-Whitney, analysis of variance, and Bonferoni multiple comparison test. Results are expressed as mean ± SE. A P value less than 0.05 was considered significant. The diagnostic performance of each gene for the diagnosis of HCC versus the group of normal and cirrhotic livers was assessed using receiving operative curves (ROC). Comparison of overall diagnostic value of markers was by area under curves (AUC). Hierarchical clustering was performed using GenANOVA software. 21 The data sets were rank-transformed before analysis by theunweighted pair group method of analysis (UPGMA) method.
Results
Gene Expression Profile in HCC
Initially, the relative RNA expression level of 219 genes was quantified by a real-time RT-PCR procedure and compared between the pools of normal liver, cirrhosis, HCC and HepG2 cell line. Results were normalized to the level of expression in the pool of normal livers. Significant differential expression in cirrhosis, HCC and HepG2 cells, as high as threefold the value of normal liver, was observed for 12, 44, and 139 genes with an up-regulation for 11, 25, and 21 genes, respectively. Interestingly, almost all of the deregulated genes in HCC were also deregulated in the HepG2 cell line (Table 1) ▶ .
Table 1.
RNA Expression Level in Hepatocellular Carcinomas and Hep G2 Cell Line of 44 Selected Genes with Significant Up- or Down-Regulation in Pool of Hepatocellular Carcinomas (<0.33 or >3)
| Gene | Access number | Hepatocellular carcinoma (pool) | Hep G2 | Hepatocellular carcinoma (individual) |
|---|---|---|---|---|
| Down-regulated | ||||
| PAI2/SERPINB2 | NM-002575 | 0.07 | 0.06 | 0.24 (0.12–1.27) |
| LYVE1/XLKD1 | NM-006691 | 0.08 | 0 | 0.03 (0.01–0.32) |
| IGF2 | NM-000612 | 0.13 | 0.11 | 0.05 (0–0.66) |
| ESR1 | NM-000125 | 0.15 | 0 | 0.17 (0.01–0.91) |
| NRG3 | AL096706 | 0.16 | 0 | 0.09 (0.00–1.59) |
| AR | NM-000044 | 0.16 | 0 | 0.24 (0.00–0.74) |
| APOA1 | NM-000039 | 0.19 | 0.03 | 0.20 (0.00–0.92) |
| Thrombospondin 1/THBS1 | NM-003246 | 0.20 | 0.03 | 0.11 (0.02–0.92) |
| CXCL12 | NM-000609 | 0.20 | 0 | 0.09 (0.02–1.59) |
| TIAM1 | NM-003253 | 0.21 | 0 | 0.23 (0.04–0.97) |
| RET | NM-000323 | 0.22 | 0 | 0.20 (0.11–0.45) |
| HAS2 | NM-005328 | 0.22 | 0.01 | 0.12 (0.02–1.09) |
| A2M | NM-000014 | 0.25 | 0.18 | 0.23 (0–1.1) |
| Tie2/TEK | NM-000459 | 0.26 | 0 | 0.23 (0.07–0.88) |
| PDGFRA | NM-006206 | 0.27 | 0.10 | 0.15 (0.04–3.85) |
| Connexin 26/GJB2 | NM-004004 | 0.28 | 0 | 0.40 (0.01–0.81) |
| Plasminogen/PLG | NM-000301 | 0.28 | 0 | 0.25 (0–1.1) |
| Haptoglobin/HP | NM-005143 | 0.28 | 0 | 0.31 (0.08–0.97) |
| NRG1 | NM-013964 | 0.29 | 0 | 0.09 (0.00–1.59) |
| Up-regulated | ||||
| Angiopoetin 1/ANGPT1 | NM-001146 | 3.15 | 0 | 4.08 (0.11–8.11) |
| PLAU | NM-002658 | 3.67 | 0.19 | 4.2 (2.34–10.35) |
| ITGA6 | NM-000210 | 3.73 | 1.99 | 3.34 (1.06–13.44) |
| MAD2L1 | NM-002358 | 3.98 | 9.54 | 2.22 (0.84–6.64) |
| KISSI | NM-002256 | 4.33 | 6.49 | 3.21 (0.06–8.34) |
| Stathmin/STMN1 | NM-005563 | 4.69 | 5.79 | 2.26 (0.44–15.36) |
| p15/CDKN2B | NM-004936 | 4.70 | 2.56 | 4.22 (0.15–26.65) |
| Claudin 4/CLDN4 | NM-001305 | 4.73 | 4.12 | 3.60 (2.67–13.56) |
| CCNE1 | NM-001238 | 5.85 | 16.54 | 3.88 (1.93–9.31) |
| MMP9 | NM-004994 | 6.25 | 0 | 4.22 (2.66–11.35) |
| GPR54/KISSR | NM-032551 | 6.67 | 200.50 | 7.45 (4.22–42.21) |
| NRG2 | NM-004883 | 8.46 | 1.68 | 12.21 (4.22–23.90) |
| MKI67 | NM-002417 | 9.41 | 21.79 | 6.08 (0.34–29.99) |
| E1AF/ETV4 | NM-001986 | 9.70 | 89.04 | 6.21 (1.79–35.26) |
| SCG10/STMN2 | NM-007029 | 10.12 | 0.19 | 3.05 (0.08–113.52) |
| RHAMM/HMMR | NM-012484 | 14.01 | 34.26 | 5.53 (0.40–26.39) |
| Midkine/MDK | NM-002391 | 15.72 | 7.40 | 12.68 (0.86–58.04) |
| TOP2A | NM-001067 | 16.00 | 42.31 | 7.31 (0.92–31.84) |
| MUC1 | NM-002456 | 17.11 | 0.07 | 14.24 (4.56–45.82) |
| Relaxin 1/RLN1 | NM-006911 | 21.70 | 0.31 | 24.42 (3.32–123.37) |
| Stratifin/SFN | NM-006142 | 23.66 | 42.75 | 4.72 (0.15–85.68) |
| Survivin/BIRC5 | NM-001168 | 26.31 | 74.06 | 9.02 (1.02–53.56) |
| p14ARF/CDKN2A | NM-058195 | 30.65 | 0.83 | 13.98 (0.42–77.72) |
| EGF | NM-001963 | 49.72 | 7.10 | 23.23 (3.39–231.72) |
| TERT | NM-003219 | 1022.20 | 404.40 | 9.57 (0–1287) |
Median value and range of individual samples is also shown.
The 44 genes showing a significant differential expression level in the pool of HCC were then separately quantified in each sample of the training set (15 normal livers, 12 cirrhosis, and 16 HCC). The median value calculated from the individual samples was very close to the value obtained from the pool sample, indicating the appropriateness of the initial evaluation from pooled samples (Table 1) ▶ .
Intratumoral Heterogenity
Since malignant tumors usually show intratumoral morphological heterogeneity, which could reflect different patterns of gene expression, we compared the expression level of selected genes within a single tumor. Genes were chosen to cover a wide expression pattern (up, down, or variable expression). Expression of the following genes was quantified in 7 different samples obtained from a unique large HCC: TERT, IGF2, Stathmin/STMN1, E-cadherin/CCNE1, and MKI67. Mean value and SD for each gene were 91.1 ± 43.6, 0.07 ± 0.03, 2.9 ± 0.5, 0.46 ± 0.2, and 31.9 ± 11-fold the normal liver, respectively. Results, presented in Figure 1 ▶ , suggest that the expression level of the different genes was fairly homogeneous within a given tumor.
Figure 1.

Sampling variability of the RNA expression level of 5 genes (TERT, IGF2, Stathmin/STMN1, E-cadherin/CCNE1, and MKI67) within 7 different samples of a unique hepatocellular carcinoma.
HCC Molecular Index
After assessment of gene expression level of the 44 selected genes within each sample of the training set, their diagnostic efficiency for the diagnosis of HCC versus normal and cirrhotic livers was further assessed in the training samples by ROC curves and AUC. Among the 44 genes differentially expressed, 27 displayed an AUC value >0.8 (Figure 2) ▶ . Thirteen of them were finally selected according to gene clustering analysis which withdrew strongly associated genes. Dendrogram of the 44 genes with their individual AUC values is shown in Figure 2 ▶ . The selected genes included in the molecular index are reported in Table 2 ▶ .
Figure 2.

Dendrogram with AUC value of the 44 genes differentially expressed in the training sample. 27 genes (bold) had an AUC value upper than 0.8. *, genes selected for the molecular index after exclusion of other closely associated genes but with a lower AUC.
Table 2.
List of the 13 Genes Selected for the HCC Molecular Index of Hepatocellular Carcinoma
| Gene | Gene definition | Function |
|---|---|---|
| TERT | Telomerase reverse transcriptase | Reverse transcriptase |
| IGF2 | Insulin-like growth factor 2 | Growth factor |
| Connexin 26/GJB2 | Connexin 26 | Gap junction molecule |
| Tie2/TEK | Tie2/TEK tyrosine kinase | Tyrosine kinase receptor |
| TIAM1 | T-cell lymphoma invasion and metastasis 1 | GDP-GTP exchange factor |
| CXCL12 | Chemokine (C-X-C motif) ligand 12 | Chemokine |
| TOP2A | Topoisomerase (DNA) II α | DNA topoisomerase |
| A2M | α-2-macroglobulin | Protease inhibitor |
| PLG | Plasminogen | Proenzyme |
| p14ARF/CDKN2A | Alternative reading frame p14 | Cell cycle control |
| PDGFRA | Platelet-derived growth factor receptor α | Tyrosine kinase receptor |
| MKI67 | Antigen identified by monoclonal antibody ki-67 | Cell proliferation |
| THBS1 | Thrombospondin 1 | Cell adhesion molecule |
For a given sample, its molecular index was defined according to the number of genes showing a differential, significant expression in HCC (ie, <3 or >3-fold normal liver). For each gene showing such a differential expression, a value of 1 was given; therefore the molecular index ranged from 0 to 13. For TERT, whose RNA is undetectable in normal liver, values lower than 0.33 were not considered as abnormal and a molecular index of 1 was given only when expression was over 3.
In the training set, the index of both normal livers and cirrhosis cases ranged from 0 to 3. All samples of HCC displayed an index of 5 or greater except one case (HCC 52; index, 2). This case was a well-differentiated grade I HCC, 3 cm in diameter. Therefore, the cut-off of malignancy was chosen as 5 or greater. The molecular index of hepatoma-derived cell lines was 11 (HepG2) and 12 (Hep3B and HuH7). Detailed data are reported in Table 3 ▶ .
Table 3.
Gene Expression Level and Molecular Index in the Training Samples
| Sample | No. | Gene | Index | ||||||||||||
|---|---|---|---|---|---|---|---|---|---|---|---|---|---|---|---|
| TERT | IGF2 | GJB2 | TEK | TIAM1 | CXCL12 | TOP2A | A2M | PLG | ARF | PDGFRA | MKI67 | THBS1 | |||
| Normal liver | N1 | 0 | 0.58 | 1.69 | 0.75 | 0.91 | 0.92 | 3.42 | 0.85 | 0.86 | 1.64 | 1.06 | 2.42 | 0.29 | 2 |
| N3 | 0 | 0.97 | 1.10 | 0.99 | 1.27 | 1.64 | 1.08 | 0.43 | 1.04 | 2.00 | 0.84 | 1.15 | 0.27 | 1 | |
| N4 | 0 | 1.53 | 0.77 | 0.59 | 0.60 | 0.56 | 3.39 | 1.33 | 0.66 | 0.49 | 0.51 | 3.70 | 0.80 | 2 | |
| N5 | 0 | 0.76 | 1.08 | 0.81 | 0.39 | 0.30 | 1.03 | 0.52 | 0.63 | 1.62 | 1.79 | 0.76 | 0.41 | 1 | |
| N7 | 0 | 2.33 | 0.83 | 1.84 | 0.75 | 0.80 | 0.53 | 2.13 | 1.68 | 1.55 | 1.25 | 0.42 | 5.19 | 1 | |
| N8 | 0 | 0.84 | 0.57 | 1.45 | 1.06 | 0.75 | 0.48 | 0.61 | 1.22 | 0.57 | 1.06 | 0.28 | 0.34 | 1 | |
| N9 | 0 | 1.13 | 1.20 | 1.30 | 0.93 | 1.15 | 0.90 | 1.04 | 1.34 | 0.62 | 0.86 | 0.83 | 0.24 | 1 | |
| N36 | 0 | 1.43 | 0.91 | 0.58 | 1.94 | 0.57 | 0.70 | 1.01 | 1.34 | 1 | 0.64 | 0.74 | 0.71 | 0 | |
| N37 | 0 | 0.85 | 0.97 | 1.00 | 1.07 | 0.91 | 0.27 | 1.26 | 1.00 | 0.82 | 0.79 | 0.37 | 0.41 | 1 | |
| N43 | 0 | 0.76 | 0.78 | 0.98 | 1.10 | 1.59 | 0.29 | 1.19 | 0.78 | 0.65 | 1.01 | 0.27 | 0.61 | 2 | |
| N53 | 0 | 0.41 | 0.86 | 0.95 | 1.01 | 1.06 | 0.48 | 1.13 | 0.80 | 0.56 | 0.97 | 0.66 | 0.96 | 0 | |
| N55 | 0 | 0.81 | 1.49 | 0.75 | 1.06 | 1.51 | 1.04 | 0.81 | 0.94 | 1.41 | 0.90 | 1.85 | 1.24 | 0 | |
| N62 | 0 | 0.75 | 0.76 | 1.16 | 0.81 | 1.69 | 0.59 | 0.93 | 0.90 | 1.13 | 1.48 | 0.64 | 1.28 | 0 | |
| N63 | 0 | 1.53 | 1.42 | 1.11 | 1.12 | 1.08 | 0.49 | 1.02 | 1.04 | 0.60 | 0.91 | 0.56 | 1.00 | 0 | |
| N65 | 0 | 0.32 | 0.58 | 0.75 | 0.98 | 0.47 | 0.32 | 0.74 | 0.75 | 0.32 | 0.94 | 0.35 | 1.26 | 3 | |
| Cirrhosis | CI20 | 0 | 0.57 | 0.93 | 0.83 | 0.68 | 0.81 | 0.20 | 1.95 | 0.73 | 2.22 | 1.32 | 0.41 | 0.37 | 0 |
| CI21 | 0 | 0.48 | 0.47 | 0.83 | 0.87 | 2.02 | 0.72 | 2.09 | 0.54 | 1.72 | 4.37 | 0.13 | 0.67 | 2 | |
| CI23 | 0 | 1.32 | 0.76 | 0.72 | 0.57 | 1.17 | 1.16 | 2.16 | 0.46 | 3.84 | 1.65 | 1.82 | 0.46 | 1 | |
| CI24 | 0 | 1.17 | 0.63 | 0.87 | 0.69 | 1.03 | 1.96 | 0.90 | 0.50 | 2.23 | 1.55 | 2.53 | 1.54 | 0 | |
| CI38 | 0 | 0.28 | 0.86 | 0.76 | 0.77 | 1.37 | 0.56 | 1.07 | 0.45 | 1.97 | 5.05 | 1.03 | 0.69 | 2 | |
| CI26 | 0 | 1.06 | 0.58 | 0.94 | 0.79 | 1.28 | 0.68 | 4.03 | 1.02 | 2.28 | 1.97 | 0.87 | 1.28 | 1 | |
| CI35 | 0 | 0.37 | 0.79 | 0.63 | 0.44 | 0.72 | 1.00 | 0.59 | 0.60 | 1.43 | 1.17 | 1.28 | 0.57 | 0 | |
| CI40 | 1.03 | 0.26 | 0.82 | 1.03 | 0.68 | 1.34 | 1.91 | 0.72 | 0.40 | 2.66 | 2.72 | 2.76 | 0.71 | 1 | |
| CI49 | 0 | 1.02 | 1.03 | 1.18 | 0.61 | 1.35 | 1.95 | 0.78 | 0.95 | 1.61 | 2.47 | 2.71 | 1.98 | 0 | |
| CI58 | 0 | 0.69 | 0.72 | 1.34 | 0.79 | 2.28 | 1.74 | 1.45 | 1.02 | 2.64 | 5.23 | 1.68 | 1.03 | 1 | |
| CI46 | 0 | 0.38 | 0.83 | 0.68 | 0.46 | 1.17 | 2.27 | 0.81 | 0.54 | 1.91 | 0.90 | 2.61 | 0.40 | 0 | |
| CI42 | 0 | 1.26 | 0.75 | 1.06 | 0.89 | 0.84 | 0.45 | 0.95 | 1.45 | 0.45 | 2.36 | 0.54 | 0.15 | 1 | |
| HCC | HCC27 | 1287 | 0.03 | 0.51 | 0.07 | 0.09 | 0.09 | 31.84 | 0.07 | 0.16 | 30.28 | 0.08 | 29.99 | 0.08 | 12 |
| HCC29 | 5.06 | 0.02 | 0.54 | 0.19 | 0.04 | 0.08 | 0.96 | 0.07 | 0.49 | 3.81 | 0.13 | 1.04 | 0.02 | 9 | |
| HCC31 | 2.99 | 0.18 | 0.53 | 0.28 | 0.26 | 0.07 | 6.47 | 0.58 | 0.59 | 24.59 | 0.15 | 3.36 | 0.10 | 9 | |
| HCC32 | 3.61 | 0.16 | 0.18 | 0.50 | 0.81 | 0.29 | 4.36 | 0.56 | 0.28 | 1.45 | 1.77 | 0.34 | 0.37 | 6 | |
| HCC33 | 0 | 0.22 | 0.42 | 0.13 | 0.15 | 0.07 | 0.92 | 0.08 | 0.65 | 15.56 | 0.15 | 0.82 | 0.23 | 8 | |
| HCC34 | 140.1 | 0.66 | 0.38 | 0.37 | 0.30 | 0.04 | 2.83 | 0.37 | 0.71 | 13.64 | 0.04 | 3.33 | 0.11 | 7 | |
| HCC25 | 7.26 | 0.63 | 0.81 | 0.81 | 0.97 | 1.59 | 8.83 | 3.64 | 1.10 | 7.57 | 2.47 | 7.82 | 0.35 | 5 | |
| HCC39 | 22.63 | 0.00 | 0.28 | 0.11 | 0.21 | 0.07 | 6.88 | 0.10 | 0.10 | 24.09 | 0.08 | 7.05 | 0.07 | 13 | |
| HCC54 | 18.25 | 0.02 | 0.01 | 0.15 | 0.04 | 0.02 | 11.49 | 0.51 | 0.00 | 0.42 | 0.11 | 6.48 | 0.12 | 11 | |
| HCC61 | 6.06 | 0.01 | 0.42 | 0.23 | 0.27 | 0.11 | 13.20 | 0.12 | 0.22 | 27.86 | 0.12 | 5.68 | 0.06 | 12 | |
| HCC66 | 11.88 | 0.01 | 0.11 | 0.13 | 0.09 | 0.07 | 9.47 | 0.21 | 0.14 | 16.45 | 0.15 | 8.50 | 0.04 | 13 | |
| HCC71 | 1.47 | 0.02 | 0.13 | 0.22 | 0.24 | 0.05 | 29.71 | 0.06 | 0.16 | 14.32 | 0.23 | 10.68 | 0.08 | 12 | |
| HCC74 | 11.96 | 0.06 | 0.34 | 0.59 | 0.31 | 0.27 | 7.74 | 0.24 | 0.21 | 11.01 | 0.98 | 8.67 | 0.92 | 9 | |
| HCC73 | 178.5 | 0.00 | 0.07 | 0.08 | 0.10 | 0.09 | 31.40 | 0.02 | 0.00 | 77.72 | 0.20 | 29.38 | 0.11 | 13 | |
| HCC52 | 1.13 | 0.43 | 0.56 | 0.88 | 0.62 | 1.27 | 1.50 | 0.87 | 0.55 | 2.55 | 3.85 | 1.53 | 0.25 | 2* | |
| HCC75 | 13.83 | 0.07 | 0.44 | 0.50 | 0.21 | 0.44 | 4.12 | 0.34 | 0.45 | 11.01 | 0.58 | 4.31 | 0.25 | 7 | |
| Cell lines | HEPG2 | 44.32 | 0.06 | 0.00 | 0.00 | 0.00 | 51.02 | 0.14 | 0.00 | 0.64 | 0.00 | 32.82 | 0.04 | 12 | |
| HEP3B | 61.82 | 0.49 | 0.08 | 0.00 | 0.00 | 0.07 | 12.49 | 0.02 | 0.00 | 39.40 | 0.03 | 5.19 | 0.52 | 11 | |
| HUH7 | 58.89 | 0.85 | 0.01 | 0.00 | 0.00 | 0.00 | 18.04 | 0.05 | 0.01 | 24.94 | 0.04 | 21.36 | 0.04 | 12 | |
Values are normalized to level of gene expression in normal liver.
Asterisk, case incorrectly ranked with the molecular index; Bold characters, down-regulated genes; Italic characters, up-regulated genes.
To validate this molecular diagnostic index, RNA of the selected 13 genes was prospectively quantified in a new set of 40 samples (testing samples), including cases of HCC (n = 20), cirrhosis (n = 10), and normal liver (n = 10) blinded initially to the histological diagnosis. The molecular index was evaluated for each case. All cases except one (HCC 105, a moderately differentiated grade II HCC, 6 cm in diameter, with a molecular index of 3) were correctly classified according to the molecular index as either HCC or non-HCC. Detailed data are given in Table 4 ▶ . In addition, distribution of the case samples on the basis of similarities in their gene patterns was checked by a hierarchical clustering analysis. The resulting dendrogram showed two cluster branches corresponding to normal liver or cirrhosis and HCC, respectively. Interestingly, the case of HCC displaying a low molecular index (HCC 105) was located in the correct branch but another HCC (HCC 83) was assigned a wrong branch (Figure 3) ▶ .
Table 4.
Gene Expression Level and Molecular Index in the Testing Samples. Values are Normalized to Level of Gene Expression in Normal Liver
| Sample | No. | Gene | Index | ||||||||||||
|---|---|---|---|---|---|---|---|---|---|---|---|---|---|---|---|
| TERT | IGF2 | GJB2 | TEK | TIAM1 | CXCL12 | TOP2A | A2M | PLG | ARF | PDGFRA | MKI67 | THBS1 | |||
| Normal liver | N95 | 0 | 1.14 | 1.23 | 1.62 | 2.22 | 0.98 | 0.33 | 1.51 | 1.15 | 0.82 | 1.70 | 0.42 | 0.97 | 0 |
| N130 | 0.38 | 0.82 | 0.86 | 0.89 | 0.95 | 0.63 | 1.24 | 0.78 | 0.99 | 0.58 | 1.20 | 1.09 | 0.54 | 0 | |
| N123 | 0.36 | 0.84 | 0.97 | 0.98 | 0.91 | 0.87 | 2.44 | 1.23 | 0.82 | 1.13 | 1.0 | 2.41 | 1.52 | 0 | |
| N122 | 0.83 | 0.94 | 0.99 | 1.00 | 0.73 | 1.28 | 2.65 | 3.10 | 0.77 | 2.61 | 1.02 | 3.14 | 1.49 | 2 | |
| N120 | 0 | 0.81 | 1.04 | 1.44 | 1.48 | 0.90 | 0.83 | 0.71 | 1.03 | 0.76 | 1.25 | 0.78 | 0.67 | 0 | |
| N114 | 0.81 | 0.51 | 0.69 | 0.82 | 1.56 | 0.83 | 0.35 | 0.65 | 0.74 | 0.32 | 0.58 | 0.41 | 0.68 | 1 | |
| N104 | 0.91 | 0.60 | 0.55 | 1.10 | 0.97 | 0.92 | 1.71 | 0.71 | 0.62 | 1.59 | 1.33 | 3.29 | 0.48 | 1 | |
| N103 | 0 | 0.28 | 0.71 | 2.05 | 2.93 | 2.27 | 0.99 | 1.14 | 0.69 | 0.86 | 2.19 | 0.98 | 0.69 | 1 | |
| N102 | 0 | 0.70 | 0.60 | 1.05 | 0.97 | 0.63 | 1.61 | 0.58 | 0.98 | 1.05 | 1.35 | 1.33 | 0.87 | 0 | |
| N100 | 0.29 | 0.83 | 0.65 | 1.23 | 1.91 | 1.58 | 0.49 | 1.34 | 0.80 | 1.05 | 2.35 | 0.69 | 1.28 | 0 | |
| Cirrhosis | CIR94 | 1.91 | 0.33 | 0.47 | 0.88 | 0.85 | 0.99 | 1.57 | 0.70 | 0.21 | 2.18 | 6.56 | 1.90 | 1.28 | 2 |
| CIR90 | 0 | 0.49 | 0.64 | 0.48 | 1.16 | 0.90 | 1.38 | 0.79 | 0.47 | 0.89 | 1.10 | 1.57 | 2.33 | 0 | |
| CIR88 | 0.63 | 0.54 | 0.85 | 0.70 | 0.71 | 1.52 | 4.69 | 1.54 | 0.69 | 4.22 | 1.64 | 5.09 | 1.98 | 3 | |
| CIR84 | 1.25 | 0.52 | 0.79 | 0.76 | 0.88 | 1.06 | 2.92 | 2.47 | 0.45 | 5.30 | 5.44 | 3.18 | 0.39 | 3 | |
| CIR82 | 0 | 0.47 | 0.53 | 0.63 | 0.77 | 0.23 | 1.35 | 1.33 | 0.32 | 2.28 | 5.59 | 1.88 | 0.76 | 3 | |
| CIR79 | 13.80 | 0.89 | 0.79 | 0.99 | 1.07 | 1.22 | 2.71 | 0.87 | 0.47 | 4.07 | 8.47 | 3.31 | 0.59 | 4 | |
| CIR125 | 0.19 | 0.35 | 0.63 | 0.45 | 0.35 | 0.88 | 0.77 | 0.78 | 0.28 | 1.45 | 4.0 | 0.76 | 0.66 | 2 | |
| CIR121 | 0.76 | 0.30 | 0.26 | 1.77 | 1.06 | 2.71 | 1.83 | 0.76 | 0.22 | 1.95 | 3.5 | 2.08 | 2.57 | 4 | |
| CIR112 | 1.47 | 0.46 | 0.74 | 0.83 | 1.09 | 1.09 | 2.13 | 0.69 | 0.41 | 3.62 | 3.54 | 2.05 | 0.62 | 2 | |
| CIR111 | 24.37 | 0.94 | 0.66 | 0.74 | 0.87 | 0.80 | 4.95 | 0.79 | 0.34 | 2.32 | 1.19 | 4.59 | 0.64 | 3 | |
| HCC | HCC99 | 7.40 | 0.01 | 0.18 | 0.18 | 0.10 | 0.08 | 2.03 | 0.10 | 0.33 | 1.22 | 0.47 | 1.76 | 0.16 | 8 |
| HCC93 | 7.76 | 0.01 | 0.13 | 0.22 | 0.29 | 0.10 | 8.33 | 0.06 | 0.18 | 15.2 | 0 | 7.77 | 0.05 | 13 | |
| HCC92 | 28.19 | 0.08 | 0.55 | 0.50 | 0.64 | 0.37 | 4.40 | 0.25 | 0.36 | 20.9 | 1.18 | 5.50 | 0.48 | 7 | |
| HCC91 | 8.86 | 0.02 | 0.35 | 0.14 | 0.22 | 0.03 | 4.34 | 0.33 | 0.37 | 6.85 | 0.07 | 4.17 | 0.12 | 10 | |
| HCC89 | 94.15 | 0.02 | 1.03 | 0.08 | 0.29 | 0.01 | 40.45 | 0.72 | 0.33 | 35.6 | 0.7 | 26.88 | 0.02 | 9 | |
| HCC87 | 19.66 | 0.01 | 0.36 | 0.09 | 0.05 | 0.05 | 8.21 | 0.08 | 0.13 | 8.55 | 0 | 7.56 | 0.15 | 12 | |
| HCC86 | 4.46 | 0.71 | 0.83 | 0.23 | 0.33 | 0.02 | 13.34 | 0.06 | 0.34 | 48.3 | 0 | 9.12 | 0.04 | 9 | |
| HCC85 | 8.62 | 0.01 | 0.37 | 0.57 | 0.59 | 0.17 | 3.24 | 0.40 | 0.21 | 25.2 | 1.25 | 3.65 | 0.46 | 7 | |
| HCC83 | 13.43 | 8.44 | 0.08 | 0.44 | 2.06 | 0.14 | 6.81 | 1.31 | 0.07 | 1.84 | 1.35 | 10.77 | 1.00 | 7 | |
| HCC81 | 0.16 | 0.16 | 0.22 | 0.21 | 0.05 | 0.02 | 6.31 | 0.05 | 0.11 | 12.2 | 0.01 | 2.88 | 0.19 | 11 | |
| HCC77 | 12.18 | 0.15 | 0.48 | 0.20 | 0.16 | 0.15 | 3.48 | 0.15 | 0.48 | 16.3 | 0.37 | 2.44 | 0.07 | 9 | |
| HCC126 | 39.31 | 0.05 | 0.14 | 0.24 | 0.26 | 0.22 | 8.62 | 0.85 | 0.39 | 26.2 | 0.3 | 8.39 | 0.38 | 10 | |
| HCC115 | 25.94 | 0.16 | 0.53 | 0.58 | 0.45 | 1.04 | 3.89 | 0.63 | 0.30 | 1.04 | 4.45 | 3.16 | 0.33 | 5 | |
| HCC113 | 4.49 | 0.13 | 0.77 | 0.35 | 0.36 | 0.35 | 4.19 | 0.24 | 0.25 | 19.6 | 0.31 | 3.53 | 0.19 | 9 | |
| HCC110 | 273.78 | 0.12 | 0.15 | 0.38 | 0.44 | 0.28 | 9.24 | 0.23 | 0.01 | 9.56 | 2.1 | 7.25 | 2.27 | 9 | |
| HCC109 | 257.23 | 11.86 | 0.49 | 0.02 | 0.13 | 0.04 | 30.87 | 0.22 | 0.08 | 10.9 | 0.01 | 36.72 | 0.04 | 12 | |
| HCC108 | 165.77 | 0.27 | 0.24 | 0.10 | 0.46 | 0.11 | 1.86 | 0.09 | 0.48 | 21.3 | 0.13 | 2.97 | 0.03 | 9 | |
| HCC107 | 877.28 | 0.01 | 0.25 | 0.09 | 0.27 | 0.04 | 10.11 | 0.60 | 0.09 | 0.34 | 0.05 | 7.88 | 0.07 | 11 | |
| HCC106 | 11.06 | 0.14 | 0.29 | 0.44 | 0.46 | 0.46 | 1.84 | 0.63 | 0.23 | 5.27 | 2.78 | 2.25 | 0.60 | 5 | |
| HCC105 | 10.98 | 0.46 | 0.59 | 0.38 | 0.37 | 0.40 | 0.90 | 0.23 | 0.66 | 11.3 | 0.47 | 1.03 | 0.43 | 3* | |
Asterisk, case incorrectly classified by the molecular index; Bold characters, down-regulated genes; Italic characters, up-regulated genes.
Figure 3.
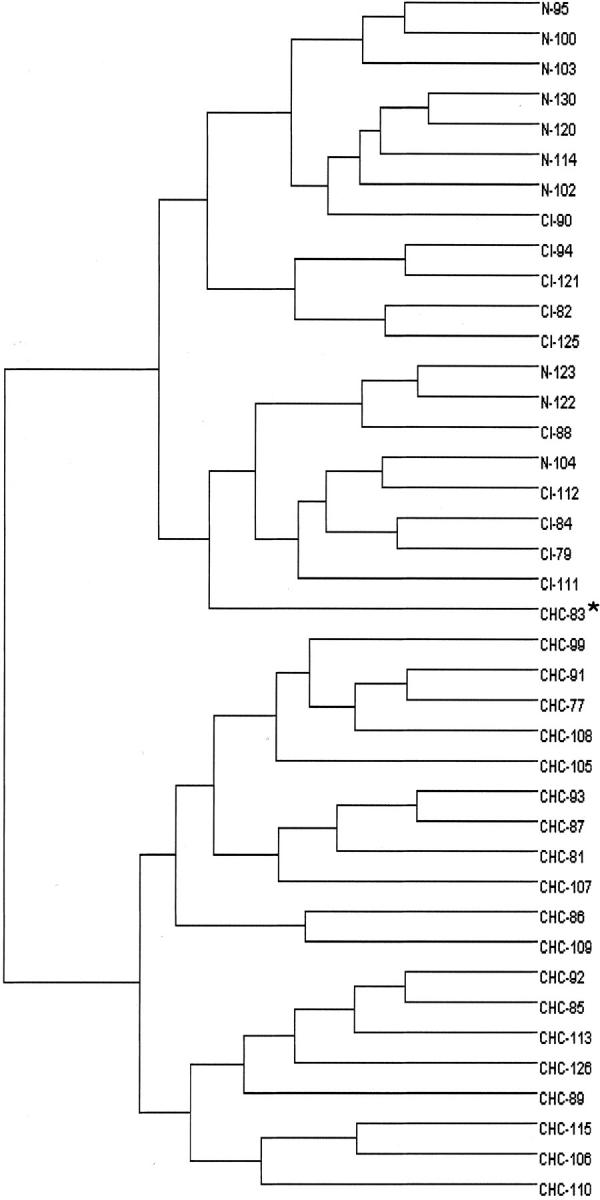
Dendrogram of the testing samples including 10 normal livers, 10 cirrhosis, and 20 HCC constructed using hierarchical UPGMA clustering according to the 13 selected genes expression. Clustering analysis shows that all HCC except HCC83 on one side and normal liver and cirrhosis on the other side cluster in the two main branches.
Correlations with Clinical Data
No significant correlation was found between the molecular index value and the characteristics of the 35 HCC of the training and testing samples taken together, including size and grade of differentiation. Molecular index was 8.5 ± 0.5 in the 15 HCC smaller than 5 cm in diameter and 9.8 ± 0.5 in the 20 other HCC (p = not significant). Index was 7 ± 1.7 in the 5 HCC of grade I, 9.6 ± 0.5 in the 23 grade II cases, and 9.6 ± 1 in the 7 grade III cases.
Molecular Index of Cirrhotic Macronodules
Since the molecular index combining the 13 genes was very accurate in the diagnosis of overt HCC, we investigated its performance in the diagnosis of minute lesions and, in particular, cirrhotic macronodules. All of the 24 benign macroregenerative nodules had an index below the threshold of malignancy (<5) and all except 1 of 10 malignant macronodules had a molecular index ≥5. Interestingly, all of the dysplastic nodules, whether low (8 cases) or high grade (3 cases), had an index below the threshold of malignancy (range, 0 to 4). Results are detailed in Table 5 ▶ .
Table 5.
Gene Expression Level and Molecular Index in the Macronodules
| Histopathology | Gene | Index | ||||||||||||
|---|---|---|---|---|---|---|---|---|---|---|---|---|---|---|
| TERT | IGF2 | GJB2 | TEK | TIAM1 | CXCL12 | TOP2A | A2M | PLG | ARF | PDGFRA | MKI67 | THBS1 | ||
| Macroregenerative nodule | 0.16 | 3.10 | 0.71 | 0.39 | 0.56 | 1.14 | 0.52 | 1.36 | 0.36 | 2.94 | 1.41 | 0.95 | 1.03 | 1 |
| 0.12 | 0.47 | 0.54 | 0.58 | 0.71 | 1.46 | 0.48 | 1.69 | 0.40 | 1.45 | 2.75 | 0.97 | 0.58 | 0 | |
| 0.16 | 0.95 | 1.02 | 0.52 | 0.55 | 0.53 | 0.70 | 0.81 | 0.82 | 0.92 | 0.48 | 0.99 | 0.09 | 1 | |
| 0.00 | 0.65 | 1.21 | 0.46 | 0.36 | 0.87 | 0.36 | 1.04 | 0.65 | 3.28 | 0.99 | 0.59 | 0.40 | 1 | |
| 0.25 | 2.02 | 0.74 | 0.45 | 0.97 | 0.69 | 1.09 | 1.02 | 0.29 | 2.80 | 1.02 | 1.54 | 0.33 | 1 | |
| 0.17 | 0.48 | 0.88 | 0.61 | 0.32 | 0.89 | 0.31 | 0.58 | 0.52 | 1.88 | 1.16 | 0.47 | 0.40 | 2 | |
| 0.00 | 0.38 | 0.59 | 0.67 | 0.58 | 0.94 | 0.42 | 0.91 | 0.59 | 2.76 | 1.33 | 0.93 | 0.14 | 1 | |
| 0.33 | 0.18 | 0.73 | 0.65 | 0.53 | 0.53 | 0.41 | 1.03 | 0.44 | 2.23 | 1.34 | 0.47 | 1.17 | 1 | |
| 1.29 | 1.14 | 0.51 | 0.51 | 0.60 | 1.46 | 0.80 | 1.36 | 0.41 | 2.94 | 1.48 | 1.38 | 0.23 | 1 | |
| 0.18 | 0.51 | 0.64 | 0.54 | 0.70 | 1.44 | 0.42 | 1.39 | 0.37 | 1.45 | 1.79 | 0.88 | 0.20 | 1 | |
| 1.87 | 0.09 | 0.45 | 0.45 | 0.69 | 1.27 | 0.47 | 1.30 | 0.45 | 2.21 | 1.90 | 0.72 | 0.94 | 1 | |
| 1.03 | 1.72 | 0.60 | 0.66 | 0.75 | 1.10 | 0.84 | 0.76 | 0.25 | 1.44 | 2.44 | 1.51 | 0.54 | 1 | |
| 0.00 | 0.77 | 0.60 | 0.43 | 0.49 | 0.42 | 0.56 | 1.72 | 0.57 | 1.81 | 0.94 | 1.38 | 0.18 | 1 | |
| 0.67 | 1.47 | 0.64 | 0.56 | 0.49 | 1.32 | 0.61 | 0.76 | 0.31 | 1.85 | 1.70 | 1.29 | 1.52 | 1 | |
| 0.00 | 0.60 | 0.78 | 0.34 | 1.00 | 0.56 | 2.14 | 0.90 | 0.63 | 2.61 | 0.92 | 2.38 | 0.00 | 1 | |
| 0.00 | 0.13 | 0.66 | 0.60 | 0.46 | 1.45 | 0.47 | 0.58 | 0.44 | 1.99 | 5.77 | 1.01 | 0.81 | 2 | |
| 0.00 | 0.45 | 0.76 | 1.05 | 0.55 | 0.36 | 1.81 | 2.09 | 1.11 | 4.97 | 0.66 | 1.39 | 0.09 | 2 | |
| 1.95 | 1.46 | 0.66 | 0.49 | 0.79 | 1.07 | 1.19 | 2.03 | 0.65 | 3.26 | 0.86 | 2.02 | 0.17 | 2 | |
| 0.00 | 0.12 | 0.52 | 0.61 | 0.75 | 1.95 | 0.48 | 0.97 | 0.44 | 5.92 | 2.34 | 0.53 | 0.57 | 2 | |
| 0.74 | 0.23 | 1.16 | 0.22 | 0.37 | 0.60 | 0.78 | 1.64 | 0.37 | 0.86 | 0.73 | 1.50 | 0.35 | 2 | |
| 0.00 | 0.20 | 1.13 | 0.20 | 0.31 | 0.63 | 0.39 | 1.65 | 0.42 | 1.21 | 0.90 | 0.77 | 0.55 | 3 | |
| 0.35 | 0.19 | 0.48 | 0.30 | 0.56 | 0.73 | 0.42 | 1.52 | 0.43 | 1.64 | 2.56 | 0.62 | 0.20 | 3 | |
| 0.00 | 0.91 | 0.72 | 0.50 | 1.42 | 1.69 | 4.91 | 0.76 | 0.99 | 6.79 | 3.55 | 4.41 | 1.94 | 4 | |
| 0.00 | 0.11 | 0.52 | 0.33 | 0.75 | 1.96 | 0.46 | 0.79 | 0.28 | 0.92 | 5.34 | 1.33 | 0.16 | 4 | |
| Dysplastic low grade | 0.00 | 0.73 | 1.04 | 0.58 | 0.37 | 0.68 | 0.41 | 1.77 | 0.85 | 1.66 | 0.50 | 0.55 | 0.36 | 0 |
| 0.00 | 0.38 | 0.74 | 0.34 | 0.43 | 0.89 | 0.21 | 0.64 | 0.36 | 2.21 | 0.96 | 0.56 | 0.13 | 2 | |
| 0.24 | 0.55 | 0.85 | 0.50 | 0.53 | 1.04 | 0.42 | 1.74 | 0.41 | 2.03 | 1.38 | 1.10 | 0.26 | 1 | |
| 0.00 | 0.41 | 1.09 | 0.52 | 0.70 | 0.37 | 0.69 | 1.39 | 0.82 | 1.90 | 0.74 | 0.63 | 0.12 | 1 | |
| 0.00 | 0.44 | 0.70 | 0.44 | 0.56 | 1.05 | 2.14 | 0.46 | 0.51 | 6.61 | 2.84 | 1.26 | 2.51 | 1 | |
| 0.00 | 0.42 | 0.45 | 0.40 | 0.29 | 0.60 | 0.22 | 1.46 | 0.50 | 2.08 | 0.72 | 0.42 | 0.26 | 3 | |
| 1.92 | 0.29 | 0.66 | 0.81 | 0.65 | 0.91 | 0.65 | 2.01 | 0.41 | 4.01 | 2.41 | 1.17 | 1.83 | 2 | |
| 4.44 | 0.79 | 1.00 | 0.47 | 0.49 | 0.46 | 1.43 | 0.34 | 0.55 | 3.42 | 0.66 | 1.89 | 0.04 | 3 | |
| Dysplastic high grade | 0.00 | 0.38 | 0.52 | 0.45 | 0.36 | 1.25 | 0.75 | 0.39 | 0.28 | 2.09 | 2.36 | 0.99 | 0.66 | 1 |
| 0.00 | 0.53 | 1.21 | 0.67 | 0.61 | 1.07 | 0.51 | 1.07 | 0.49 | 4.74 | 1.75 | 0.53 | 0.16 | 2 | |
| 0.00 | 0.77 | 0.63 | 0.32 | 0.32 | 0.39 | 0.47 | 0.69 | 0.62 | 0.94 | 0.29 | 0.73 | 0.15 | 4 | |
| Minute hepatocellular carcinoma | 572.66 | 0.58 | 0.67 | 0.42 | 0.23 | 0.44 | 0.92 | 0.38 | 0.42 | 11.43 | 0.42 | 1.15 | 0.06 | 4* |
| 0.12 | 0.13 | 0.50 | 0.33 | 0.78 | 1.76 | 0.31 | 0.84 | 0.24 | 0.63 | 4.16 | 1.09 | 0.27 | 5 | |
| 0.11 | 0.08 | 0.38 | 0.30 | 0.65 | 1.73 | 0.22 | 0.74 | 0.22 | 0.80 | 3.94 | 0.70 | 0.25 | 6 | |
| 14.44 | 3.69 | 1.47 | 0.28 | 0.47 | 0.25 | 0.92 | 0.56 | 0.39 | 28.33 | 1.00 | 1.49 | 0.12 | 6 | |
| 11.33 | 0.10 | 0.84 | 0.24 | 1.09 | 0.12 | 1.09 | 0.75 | 0.40 | 12.33 | 0.38 | 1.82 | 0.20 | 6 | |
| 0.26 | 0.30 | 0.53 | 0.23 | 0.27 | 0.39 | 0.21 | 0.09 | 0.23 | 2.61 | 0.15 | 0.49 | 0.10 | 8 | |
| 17.90 | 0.13 | 0.58 | 0.59 | 0.83 | 0.12 | 3.50 | 0.93 | 0.25 | 26.44 | 1.13 | 4.35 | 0.44 | 7 | |
| 58.55 | 2.96 | 1.02 | 0.18 | 0.15 | 0.06 | 2.06 | 0.20 | 0.33 | 25.36 | 0.03 | 2.89 | 0.06 | 8 | |
| 22.81 | 0.02 | 0.49 | 0.24 | 0.81 | 0.09 | 11.84 | 0.42 | 0.17 | 27.56 | 1.64 | 7.84 | 0.03 | 9 | |
| 8.18 | 0.00 | 0.54 | 0.21 | 0.40 | 0.05 | 3.17 | 0.30 | 0.27 | 8.19 | 0.14 | 3.21 | 0.07 | 11 | |
Values are normalized to level of gene expression in normal liver.
Asterisk, cases incorrectly classified by the molecular index; Bold characters, down-regulated genes; Italic characters, up-regulated genes.
Discussion
For pathologists, the histological diagnosis of HCC is sometimes challenging, especially for cirrhotic macronodules and well-differentiated HCC. To provide further reliable markers helpful in difficult cases, we sought to define the most discriminating genes for the diagnosis of HCC by a large-scale gene expression study and use them in a diagnostic index. Interestingly, among 219 genes quantified by a real-time RT-PCR assay, a molecular index based on the expression level of 13 genes was efficient at categorizing liver tissue samples as normal or cirrhotic liver versus HCC.
Gene expression profiling methods have successfully provided new insights into the molecular pathogenesis of several human malignancies, including HCC. 7,8,10,11,16,19,21 Indeed, previous studies highlighted several dozen genes differentially regulated in HCC, some of which play a significant prognostic role. 8 Many of these studies were carried out through cDNA microarray analysis that enables investigation of the expression of thousands of genes at a time. Although more targeted, real-time RT-PCR assay appears to be an alternative and powerful technique, especially due to its performance in the accuracy and reproducibility of quantitation. 13,22 The quantitation of a large set of selected genes, such as we performed in the present study, make it a valid large-scale investigation technique but also an easy-to-use method when investigation is limited to a few genes. Using the same approach, we were able to demonstrate a significant and specific deregulation of the balance of ANGPT1/ANGPT2 expression in focal nodular hyperplasia, suggesting that these vasculogenic molecules may be involved in the pathogenesis of this lesion. 15
To our knowledge, this is the first study which sought to classify human liver samples as HCC or non-HCC according to their gene expression profile. Interestingly, HCC molecular diagnosis can be achieved by the determination of a simple molecular index combining 13 genes among 44 selected differentially expressed genes. Indeed, this index, initially defined in a training set of samples, was further validated in an additional independent testing set of samples, a procedure that supported the performance of the molecular index of HCC. Only two cases (one in the training and one in the testing sample) displayed discordant results between histological analysis and the molecular index. Such discordance raises the issue of intratumoral molecular heterogeneity, as had been previously suggested in several studies using microarray analysis. 10 However, this hypothesis is not supported in our experiment since, at least in several different areas of a large HCC and for a limited number of genes, RNA expression level showed no significant discrepancies within the different samples.
Hepatocarcinogenesis is a multistep process in which large nodules within cirrhosis, so-called macronodules, may represent a premalignant condition. 23,24 Although many efforts have been made to define histological classifications which differentiate macronodules according to their morphological characteristics, their behavior remains difficult to predict. Therefore, we applied the molecular index to cirrhotic macronodules obtained from different cirrhotic specimens. Our results showed that all histopathologically benign macronodules (regenerative macronodule) and all except one malignant macronodules (minute HCC), were correctly classified as HCC or non-HCC according to their molecular index. This suggests that this molecular analysis is a reliable tool not only for large and overt HCC but also for minute lesions. Regarding borderline nodules, all low and high grade dysplastic macronodules displayed a molecular index below 5.
In conclusion, this study demonstrates the reliability of a simple molecular index in the diagnosis of liver tumors, including minute lesions. Such results can be achieved because of the very high accuracy and sensitivity of the real-time RT-PCR procedure, and may be routinely useful for the diagnosis of very small lesions or well-differentiated HCC.
Footnotes
Address reprint requests to Valérie Paradis, M.D., Service d’anatomie pathologique, Hôpital Beaujon, 100 Bd General Leclerc, 92110, Clichy, France. E-mail: vparadis@teaser.fr.
Supported by grants from the Association pour la Recherche contre le Cancer and Association Nationale de la Recherche contre le SIDA and Caisse d’assurance maladie des professions libérales de province.
References
- 1.Tsuda H, Zhang W, Shimosato Y, Yokota J, Terada M, Sugimura T, Miyumara T, Hirohashi S: Allele loss on chromosome 16 associated with progression of human hepatocellular carcinoma. Proc Natl Acad Sci 1990, 87:6791-6794 [DOI] [PMC free article] [PubMed] [Google Scholar]
- 2.Fujimoto Y, Hampton LL, Wirth PJ, Wang NJ, Xie JP, Thorgeirsson SS: Alterations of tumor suppressor genes and allelic losses in human hepatocellular carcinomas in China. Cancer Res 1994, 54:281-285 [PubMed] [Google Scholar]
- 3.Boige V, Laurent-Puig P, Fouchet P, Flejou JF, Monges G, Bedossa P, Bioulac-Sage P, Capron F, Schmitz A, Olschwang S, Thomas G: Concerted nonsyntenic allellic losses in hyperploid hepatocellular carcinoma as determined by a high-resolution allelotype. Cancer Res 1997, 57:1986-1990 [PubMed] [Google Scholar]
- 4.Terasaki S, Kaneko S, Kobayashi K, Nonomura A, Nakanuma Y: Histological features predicting malignant transformation of nonmalignant hepatocellular nodules: a prospective study. Gastroenterology 1998, 115:1216-1222 [DOI] [PubMed] [Google Scholar]
- 5.Aihara T, Noguchi S, Sasaki Y, Nakano H, Imaoka S: Clonal analysis of regenerative nodules in hepatitis C virus-induced liver cirrhosis. Gastroenterology 1994, 107:1805-1811 [DOI] [PubMed] [Google Scholar]
- 6.Paradis V, Laurendeau I, Vidaud M, Bedossa P: Clonal analysis of macronodules in cirrhosis. Hepatology 1998, 28:953-958 [DOI] [PubMed] [Google Scholar]
- 7.Shirota Y, Kaneko S, Honda M, Kawai HF, Kobayashi K: Identification of differentially expressed genes in hepatocellular carcinoma with cDNA microarrays. Hepatology 2001, 33:832-840 [DOI] [PubMed] [Google Scholar]
- 8.Okabe H, Satoh S, Kato T, Kitahara O, Yanagawa R, Yamaoka Y, Tsunoda T, Furukawa Y, Nakamura Y: Genome-wide analysis of gene expression in human hepatocellular carcinomas using cDNA microarray: identification of genes involved in viral carcinogenesis and tumor progression. Cancer Res 2001, 61:2129-2137 [PubMed] [Google Scholar]
- 9.Xiao S-Y, Wang HL, Hart J, Fleming D, Beard MR: CDNA arrays and immunohistochemistry identification of CD10/CALLA expression in hepatocellular carcinoma. Am J Pathol 2001, 159:1415-1421 [DOI] [PMC free article] [PubMed] [Google Scholar]
- 10.Xu L, Hui L, Wang S, Gong J, Jin Y, Wang Y, Ji Y, Wu X, Han Z, Hu G: Expression profiling suggested a regulatory role of liver-enriched transcription factors in human hepatocellular carcinomas. Cancer Res 2001, 61:3176-3181 [PubMed] [Google Scholar]
- 11.Graveel CR, Jatkoe T, Madore SJ, Holt AL, Farnham PJ: Expression profiling and identification of novel genes in hepatocellular carcinomas. Oncogene 2001, 20:2704-2712 [DOI] [PubMed] [Google Scholar]
- 12.Delpuech O, Trabut JB, Carnot F, Feuillard J, Brechot C, Kremsdorf D: Identification, using cDNA macroarray analysis, of distinct gene expression profiles associated with pathological and virological features of hepatocellular carcinoma. Oncogene 2002, 21:2926-2937 [DOI] [PubMed] [Google Scholar]
- 13.Holland PM, Abrason RD, Watson R, Gelfand DH: Detection of specific polymerase chain reaction product by utilizing the 5′-3′ exonuclease activity of Thermus aquaticus DNA polymerase. Proc Natl Acad Sci USA 1991, 88:7276-7280 [DOI] [PMC free article] [PubMed] [Google Scholar]
- 14.Lie YS, Petropoulos CJ: Advances in quantitative PCR technology: 5′ nuclease assays. Curr Opin Biotechnol 1998, 9:43-48 [DOI] [PubMed] [Google Scholar]
- 15.Paradis V, Bieche I, Dargere D, Laurendeau I, Nectoux J, Degott C, Belghiti J, Vidaud M, Bedossa P: A quantitative gene expression study suggests a role for angiopoietins in focal nodular hyperplasia. Gastroenterology 2003, 124:651-659 [DOI] [PubMed] [Google Scholar]
- 16.Schena M, Schalon D, Davis RW, Brown PO: Quantitative monitoring of gene expression patterns with a cDNA microarray. Science 1995, 270:467-470 [DOI] [PubMed] [Google Scholar]
- 17.DeRisi JL, Iyer V, Brown PO: Exploring the metabolic and genetic control of gene expression on a genomic scale. Science 1997, 278:680-686 [DOI] [PubMed] [Google Scholar]
- 18.Chen JJ, Wu R, Yang PC, Huang JY, Sher YP, Han MH, Kao WC, Lee PJ, Chiu TF, Chang F, Chu YW, Wu CW, Peck K: Profiling expression patterns and isolating differentially expressed genes by cDNA microarray system with colorimetry detection. Genomics 1998, 51:313-324 [DOI] [PubMed] [Google Scholar]
- 19.Alizadeh AA, Eisen MB, Davis RE, Ma C, Lossos IS, Resenwald A, Boldrick JC, Sabet H, Tran T, Yu X, Powell JI, Yang L, Marti GE, Moore T, Hudson J, Lu L, Lewis DB, Tibshirani R, Sherlock G, Chan WC, Greiner TC, Weisenburger DD, Armitage JO, Warnke R, Staudt LM: Distinct types of diffuse large B-cell lymphoma identified by gene expression profiling. Nature 2000, 403:503-511 [DOI] [PubMed] [Google Scholar]
- 20.Yamashita T, Kaneko S, Hashimoto S-I, Sato T, Nagai S, Toyoda N, Suzuki T, Kobayashi K, Matsuhima K: Serial analysis of gene expression in chronic hepatitis C and hepatocellular carcinoma. Biochem Biophys Res Commun 2001, 282:647-654 [DOI] [PubMed] [Google Scholar]
- 21.Didier G, Brezellec P, Remy E: Henaut A: Gene ANOVA-gene expression analysis of variance. Bioinformatics 2002, 18:490-491 [DOI] [PubMed] [Google Scholar]
- 22.Higuchi R, Fockler C, Dollinger G, Watson R: Kinetic PCR analysis: real-time monitoring of DNA amplification reactions. Biotechnology 1993, 11:1026-1030 [DOI] [PubMed] [Google Scholar]
- 23.Furuya K, Nakamura M, Yamamoto Y, Togei K, Otsuka H: Macroregenerative nodule of the liver: a clinicopathologic study of 345 autopsy cases of chronic liver disease. Cancer 1988, 61:99-105 [DOI] [PubMed] [Google Scholar]
- 24.Okuda K: Hepatocellular carcinoma: recent progress. J Hepatol 2002, 32:225-237 [DOI] [PubMed] [Google Scholar]