

Abstract
Adult soft tissue sarcomas are a heterogeneous group of tumors, including well-described subtypes by histological and genotypic criteria, and pleomorphic tumors typically characterized by non-recurrent genetic aberrations and karyotypic heterogeneity. The latter pose a diagnostic challenge, even to experienced pathologists. We proposed that gene expression profiling in soft tissue sarcoma would identify a genomic-based classification scheme that is useful in diagnosis. RNA samples from 51 pathologically confirmed cases, representing nine different histological subtypes of adult soft tissue sarcoma, were examined using the Affymetrix U95A GeneChip. Statistical tests were performed on experimental groups identified by cluster analysis, to find discriminating genes that could subsequently be applied in a support vector machine algorithm. Synovial sarcomas, round-cell/myxoid liposarcomas, clear-cell sarcomas and gastrointestinal stromal tumors displayed remarkably distinct and homogenous gene expression profiles. Pleomorphic tumors were heterogeneous. Notably, a subset of malignant fibrous histiocytomas, a controversialhistological subtype, was identified as a distinct genomic group. The support vector machine algorithm supported a genomic basis for diagnosis, with both high sensitivity and specificity. In conclusion, we showed gene expression profiling to be useful in classification and diagnosis, providing insights into pathogenesis and pointing to potential new therapeutic targets of soft tissue sarcoma.
Soft tissue sarcomas (STS) define a group of histologically and genetically diverse cancers that account for approximately 1% of all adult malignancies with an annual incidence in the United States of approximately 8000 cases. 1 There are over 50 subtypes of this disease, which are currently diagnosed by genetic and morphological criteria. 2,3 Those most frequently seen include liposarcoma, leiomyosarcoma, malignant fibrous histiocytoma (MFH), fibrosarcoma, and synovial sarcoma. 4 The molecular classification of STS includes two major categories on the basis of 1) a single recurrent genetic alteration, such as chromosomal translocations (synovial sarcoma, myxoid/round-cell liposarcoma, clear-cell sarcoma) or activating mutation (KIT), or 2) non-recurrent genetic aberrations, which form part of a complex abnormal karyotype. 5
It is possible to classify some STS by their recurrent chromosomal translocations or somatic mutation, 6 such as the presence of SYT-SSX fusion transcript in synovial sarcoma, 7,8 EWS-ATF1 in clear-cell sarcoma, 9,10 TLS-CHOP in myxoid/round-cell liposarcoma 11,12 and ASPL-TFE3 in alveolar soft-part sarcoma. 13 Most of these translocations produce chimeric transcription factors, which presumably deregulate the expression of several target genes. 14 In the case of gastrointestinal stromal tumors (GIST), a distinct somatic mutation has been described in KIT, 15-17 which leads to ligand-independent constitutive activation of its encoded receptor tyrosine kinase. This in turn results in altered cell proliferation and tumorigenesis.
The group of tumors characterized by numerous, non-recurrent chromosomal alterations includes MFH, conventional fibrosarcoma, leiomyosarcoma, de-differentiated liposarcoma and pleomorphic liposarcoma. In particular, the diagnosis of MFH has been long controversial. Originally described in the 1960s as a fibrous xanthoma, 18-20 MFH was considered a true histiocytic tumor displaying facultative fibroblastic properties. Subsequent ultrastructural evaluation found the predominant cell type to be in fact a fibroblast or one of its variants, leading to the conclusion that MFH should be reclassified as pleomorphic fibrosarcoma. 21,22 Others consider MFH to be a final common pathway for certain types of STS and represent tumor progression or de-differentiation. 23-25
The molecular classification of cancer has recently been prompted by the sequencing and annotation of the human genome and technical advancement in gene transcription profiling. 26-28 These profound scientific advancements have permitted high-throughput analysis and molecular correlation between tumors that provides insight into molecular pathways and mechanisms. The support vector machine (SVM) model has, in particular, been shown to be useful in classification tasks using gene expression data. 29-31
In this study, we investigated the gene expression profiles of 51 high-grade STS, representing nine different histological subtypes. We focused on high-grade lesions, as these often pose a diagnostic challenge and would potentially benefit from molecular-based classification and a diagnostic algorithm. Using hierarchical cluster analysis, multidimensional scaling and SVM analysis, we determined the molecular relationship of STS and compared this to the current histological classification, for the purpose of a novel biology-based model of STS.
Materials and Methods
Tumor Specimens
Tumor specimens, obtained from 51 patients undergoing surgery at Memorial Sloan-Kettering Cancer Center, included MFH (n = 11), conventional fibrosarcoma (n = 8), leiomyosarcoma (n = 6), round-cell liposarcoma (n = 4), pleomorphic liposarcoma (n = 3), de-differentiated liposarcoma (n = 5), clear-cell sarcoma (n = 4), synovial sarcoma (n = 5), and GIST (n = 5). Specimens were collected under an IRB-approved tissue procurement protocol. Representative tumor tissue was embedded in OCT compound and frozen as tissue blocks using liquid nitrogen. Tumor specimens were selected for analysis according to validation of histological diagnosis. Round-cell liposarcoma, de-differentiated liposarcoma and pleomorphic liposarcoma were dissected from microscopically identified regions within the frozen tumor block, to ensure selection of high-grade areas only. Prior therapy was not considered an exclusion criterion, as we showed in a pilot study that tumors did not cluster differently by prior treatment. For additional details on genotype, subtype, prior therapy, site and stage, see Supplemental Data at http://www.amjpathol.org, or http://www.mskcc.org/genomic.sts. 32 Tumor specimens have been used in a similar study in the classification of clear-cell sarcoma. 33
Histological and Molecular Diagnosis
In all cases histological slides were available from the primary resection specimen and were reviewed independently by two soft-tissue pathologists (C.R.A., J.M.W.). Histological diagnosis was supported in every case by an appropriate immunohistochemical panel and/or molecular genetic evaluation. RT-PCR using total RNA extracted from frozen tissue was performed for detection of specific fusion transcripts such as SYT-SSX, TLS-CHOP, and EWS-ATF1, used in the molecular diagnosis of synovial sarcoma, 34 myxoid/round-cell liposarcoma, 12 and clear-cell sarcoma, 10 respectively. All GIST tumors were tested for the presence of KIT mutations, using PCR amplification of genomic DNA, followed by direct sequencing. 35 These studies were performed in the laboratories of the Division of Molecular Pathology, Memorial Sloan-Kettering Cancer Center.
RNA Isolation and Gene Expression Profiling
Cryopreserved tumor sections were homogenized under liquid nitrogen by mortar and pestle. Total RNA was extracted in Trizol reagent and purified using the Qiagen Rneasy kit. RNA quality was assessed on ethidium bromide agarose gel electrophoresis. cDNA was then synthesized in the presence of oligo(dT)24-T7 from Genset Corp. (La Jolla, CA). cRNA was prepared using biotinylated UTP and CTP and hybridized to HG U95A oligonucleotide arrays (Affymetrix Inc., Santa Clara, CA). Fluorescence was measured by laser confocal scanner (Agilent, Palo Alto, CA) and converted to signal intensity by means of Affymetrix Microarray Suite v4.0 software. For complete expression data, see Supplemental Data at http://www.amjpathol.org, or http://www.mskcc.org/genomic.sts. 32
Hierarchical Cluster Analysis
Hierarchical cluster analysis was performed using XCluster (http://genome-www.stanford.edu/∼sherlock/cluster.html), using a centered Pearson correlation coefficient distance metric and average linkage to measure cluster distances during partitioning. 36 A nonparametric bootstrap was used to estimate confidence of the cluster structure. 37 For each bootstrap sample, the clustering obtained was compared to the clustering obtained with the original data set. Two clusters (branches of the hierarchy) were considered identical if they contained the same members.
Multidimensional Scaling Analysis
As an alternative and independent way of visualizing the cluster structure of the data a multidimensional scaling analysis was done. To deal with both the large range and the negative values of the expression data we took as the distance function 1/2(1 – r), where r is the Spearman rank-order correlation coefficient. The multidimensional scaling was done using S-PLUS 38 projecting the data into three dimensions.
Support Vector Machine Analysis
The ability of a machine-learning algorithm to correctly classify each tumor type was measured using SVM analysis with hold-one-out cross-validation. 29,30 In brief, during the training phase the SVM takes as input a microarray data matrix, and labels each sample as either belonging to a given class (positive) or not (negative). The SVM treats each sample in the matrix as a point in a high-dimensional feature space, where the number of genes on the microarray determines the dimensionality of the space. The SVM learning algorithm then identifies a hyperplane in this space that best separates the positive and negative training examples. The trained SVM can then be used to make predictions about a test sample’s membership in the class. This approach allows us to collect unbiased measurements of the ability of the SVM to classify each sample. We used a standard “hold-one-out” training/testing scheme, in which the SVM is trained separately on training sets made up of all but one of the samples, and then tested on the single “held out” sample. Because a classifier’s performance can be hindered by the inclusion of irrelevant data, we used feature selection to identify genes that are most important for classification. The genes in the training data set were ranked in order of their proposed importance in distinguishing the positives from the negatives, as described in more detail in the next section, and the top N genes were taken for each trial. The value N was varied in 12 powers of 2, ranging from 4 to 8192. Thus, the SVM was run 51 times on each of 12 different numbers of features (genes), for each of the tumor classes. Each held-out test sample was counted as either a false positive, false negative, true positive, or true negative.
Gene Ranking for Feature Selection
To select genes that were the most informative for the SVM, we tested a variety of methods including the Fisher score method 30 and parametric and nonparametric statistics. Data reported here were derived from Student’s t-test, because it yielded the best SVM performance overall. Each gene in each training data set was subjected to the following procedure. A standard Student’s t-test was used to compare the expression in one tumor type to that in the remaining samples. The resulting P values were then used to rank the genes, and the desired number of genes was then selected for use. The corresponding data from the training set was used to train the SVM, and the same genes were used for the test data. It is important to note that the genes were selected solely on the basis of the training data. Finally, a t-test statistic as determined for all samples was used to provide an overall ranking of the genes in order of relevance for each tumor classification. This ranking was used to provide an overview of the most important genes for distinguishing the class.
Results
Cluster Analysis
We determined the gene expression profile of 51 adult soft tissue sarcomas using 12,559 oligonucleotide probe sets on the U95A GeneChip from Affymetrix. Tumor specimens included nine different histological subtypes, which taken together cover more than 75% of STS cases diagnosed in the United States.
We explored three approaches to data analysis. In the first, we used unsupervised cluster analysis to identify groups of tumors related by similarity in overall gene expression profile using all genes represented on the U95A GeneChip (Figure 1) ▶ . We identified two principal clusters that discriminate specimens by karyotypic and morphological features. STS characterized by non-recurrent genetic aberrations and karyotypic complexity show poor overall similarity in both gene expression profile and bootstrap analyses. In contrast, STS characterized by single recurrent genetic events clustered distinctly in strong groups. This was shown for all cases of GIST, synovial sarcoma, clear-cell sarcoma and round-cell liposarcoma. Similarly, visualized using multidimensional scaling analysis once again using all genes represented on the U95A GeneChip (MDS) (Figure 2) ▶ .
Figure 1.

Hierarchical cluster analysis of 51 soft tissue sarcoma specimens using global gene expression profiles revealed distinct clusters for GIST, synovial sarcoma, clear cell sarcoma and round cell liposarcoma. Several conventional fibrosarcoma were observed in close proximity to synovial sarcoma, albeit with weaker correlation. Pleomorphic specimens exhibited weak overall correlation and consistency by bootstrap analysis. Predominant clusters were similarly observed for MFH and leiomyosarcoma. Numbers represent consistency obtained in 100 bootstrap iterations. Cases are shown on the x axis.
Figure 2.

Multidimensional scaling analysis of 51 soft tissue sarcoma specimens. The plot displays the position of each tumor specimen in three-dimensional space, where the distance between cases reflects their approximate degree of correlation. Two views of this three-dimensional figure demonstrated separate groups of clear-cell sarcoma (blue), round-cell liposarcoma (yellow), GIST (green) and synovial sarcoma (brown). Several fibrosarcomas (purple) were seen in close proximity to the synovial sarcoma cluster. Pleomorphic specimens were poorly distinguished using this data visualization technique.
Five of 8 conventional fibrosarcomas were observed to cluster in close proximity to the synovial sarcoma cluster. These 5 specimens were retrospectively tested for the presence of SYT-SSX fusion transcript by RT-PCR, and were found to be negative. Similarly, a single case of pleomorphic liposarcoma was observed to cluster in proximity to the round-cell liposarcoma group and was shown to be negative for the TLS-CHOP fusion transcript (data not shown).
Although the pleomorphic STS were not strongly related overall by gene expression profile, predominant groups were observed on hierarchical cluster analysis in concordance with histological classification. In particular, 5 of 6 leiomyosarcoma specimens (S20-S24) co-clustered with a de-differentiated liposarcoma (S29). This de-differentiated liposarcoma was noted previously to contain divergent leiomyosarcomatous differentiation on routine histological and immunohistochemical assessment. These 6 specimens were designated as “genomic leiomyosarcoma group #1” for further discussion. Similarly, 9 of 11 MFH specimens (S36-S40, S43-S46), including 5 of 6 lesions with myxoid features, clustered together with a single fibrosarcoma (S5). This was designated as “genomic MFH group” for further discussion. The remaining specimens appeared heterogeneous.
Support Vector Machine Analysis
Our second approach incorporated the use of SVM analysis to explore the outcome of genomic diagnosis in both previously-defined histological subtypes and potential novel genomic groups. Specimens were divided into two groups to establish training classes for each diagnostic category. The positive class contained all specimens that belong to a specific category. The negative class contained the remaining specimens. We performed hold-one-out cross-validation, in which one specimen was hidden from the SVM during training and was subsequently given to the “machine” as a test specimen. This was performed over a range of gene numbers to identify the range in which the “machine” operates optimally in diagnosing an unknown specimen. The outcome of the analysis was compared to the predicted subtype of the test specimen and indicated as true/false positive or true/false negative.
SVM analysis achieved both high sensitivity and high specificity in GIST, synovial sarcoma, round-cell liposarcoma, and clear-cell sarcoma. In the case of MFH, leiomyosarcoma, and de-differentiated liposarcoma, genomic reclassification of these tumors by cluster analysis improved SVM performance (Figure 3) ▶ . Interestingly, de-differentiated liposarcomas were diagnosed accurately using as few as four genes, but only up to 64 genes. This limited range of sensitivity is consistent with a genomic-based relationship over few genes that is sufficient for SVM diagnosis yet insufficient to generate clusters using global gene expression. In the case of leiomyosarcoma, the designated “genomic leiomyosarcoma group #1” behaved poorly in SVM analysis, as observed by consistent misclassifications as false positive and false negative. We explored this further by hypothesizing an alternative “genomic leiomyosarcoma group #2” which included the outlier leiomyosarcoma specimens S26. This hypothetical cluster gained support by demonstrating consistently perfect SVM performance over a large range in the number of genes used. These results, taken together, demonstrate the efficacy of a diagnostic algorithm in validating and, in particular, exploring the outcome of cluster analysis techniques.
Figure 3.

Diagnostic performance of support vector machine analysis for histological and genomic subtypes of soft tissue sarcoma is shown as true positive outcome versus true negative as indicators of the sensitivity and specificity respectively. Perfect performance was achieved over a large range of genes in GIST, round cell liposarcoma (RCL), clear cell sarcoma (CSS), and synovial sarcoma (SS). Poor sensitivity and specificity were observed for fibrosarcoma (Fib) and the histological group of MFH (MFH-H). The latter improved using a genomic-based classification scheme (MFH-G). A similar improvement in SVM performance was shown for de-differentiated liposarcoma (D.Lipo-H versus D.Lipo-G) that demonstrated sensitivity using up to 64 genes. In the case of leiomyosarcoma (Leio-H), the introduction of genomic classification by cluster analysis (Leio-G#1) further improved SVM outcome by reintroducing a histological specimen that did not group together with remaining leiomyosarcoma specimens on hierarchical cluster analysis (Leio-#2). P.Lipo, pleomorphic liposarcoma. Blue circle, predicted true positive; orange circle, predicted false positive; vertical line, actual true positive.
Gene with Potential Biological and Therapeutic Relevance
Our third approach to data analysis was the identification of genes, consistent with each tumor subtype for the purpose of useful biological discovery (Figure 4) ▶ . In the case of MFH, leiomyosarcoma, and de-differentiated liposarcoma, genomic classification was used. This was performed using Student’s t-test analysis and cross-referencing the top scoring 500 genes against both the published literature and the gene ontology consortium database (http://www.geneontology.org/) using NetAffx (http://www.affymetrix.com). We further limited this analysis to the top 50 genes for any particular STS subtype. We identified the known genetic markers for distinct subtypes of STS, including KIT (GIST), SYT-SSX (synovial sarcoma), PPARγ (round-cell liposarcoma) and MITF (clear-cell sarcoma). In addition, we discovered several genes that are implicated in diverse biological processes, pathways, and states of differentiation.
Figure 4.
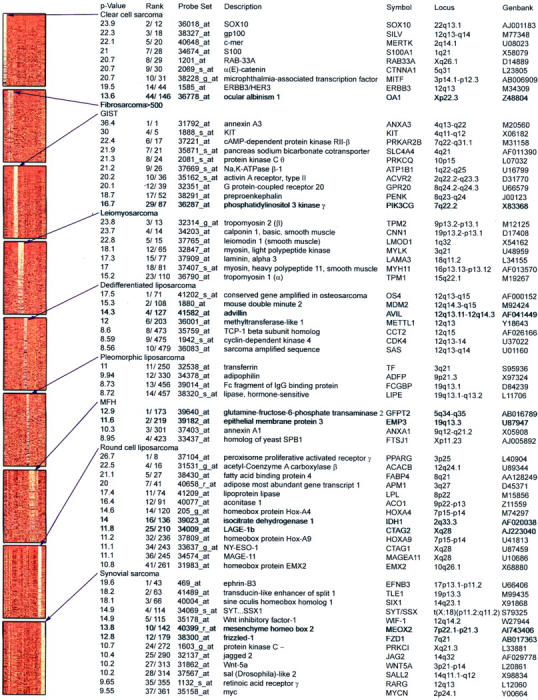
Identification of genes for biological discovery. The thumbnail panels represent the top 500 genes for each tumor type scored by Student’s t-test analysis and sorted by increasing P value (shown as negative log P value). The second column shows rank according to P value where a higher value corresponds to a lower P value; the first value indicates rank within genes that discriminate the particular tumor subtype; the second value indicates rank within all genes that discriminate any tumor subtype. Light to dark color variation in the left panel represents high to low levels of expression. Annotated genes were selected according to biological interest from the top 500 genes that discriminate any STS subtype. All genes for fibrosarcoma failed to satisfy this criterion. See Supplemental Data at http://www.amjpathol.org for detailed gene lists.
GISTs were characterized by genes involved in receptor tyrosine kinase signal pathways, including KIT, putative G protein-coupled receptor, and activin type II A receptor. We similarly observed genes encoding ion channels, as well as the neuropeptide precursor preproenkephalin. Enkephalin has been implicated in gastrointestinal motility, 39 consistent with GISTs deriving from the interstitial cell of Cajal (ICC). We next searched for genes that were selectively expressed in the KIT pathway and identified phosphatidylinositol 3 (PI-3) kinase γ 40 in 5 of 5 specimens and the KIT ligand, stem cell factor (SCF), in 2 of 5 specimens (S15, S17). This finding was not related to any particular mutation in KIT (Table 1) ▶ .
Table 1.
Gene Mutation in KIT and KIT, SCF Expression
| Specimen | KIT mutation | KIT expression | SCF expression |
|---|---|---|---|
| S13 | Exon 11 del: 557,558 WK | + | − |
| S14 | Exon 9 ins: 6 bp | + | − |
| S15 | Exon 11 del: 557,558 WK | + | + |
| S17 | Exon 11 ins: 45 bp duplication | + | + |
| S18 | Exon 11 point mutation: 559, V to G | + | − |
Synovial sarcomas were characterized by genes expressed in early developmental pathways involving WNT and notch signaling, including TLE1, FZD1, WNT5A, and JAG2. Several developmentally related homeobox genes, such as SIX1, MEOX2, and SALL2 were also identified. Other genes of interest in synovial sarcoma included the retinoic acid receptor γ and MYC oncogene. Clear-cell sarcomas demonstrated several genes associated with their melanocytic lineage, 33 including SOX10, gp100, and MITF.
De-differentiated liposarcoma were characterized by genes located on 12q, including CDK4 and MDM2. Round-cell liposarcomas were characterized by lipid metabolism and adipogenic profiles and included several homeobox genes. Leiomyosarcomas were characterized by genes implicated in the smooth-muscle phenotype. For complete gene list data, see Supplemental Data at http://www.amjpathol.org, or http://www.mskcc.org/genomic.sts. 32
Discussion
We report here the genomic profiling of adult STS using oligonucleotide array analysis. This study attempts to provide an overall molecular perspective on the similarities and differences as well as unique characteristics of STS. We have sought to clarify relationships across the spectrum of histological distinctness from that of the well-defined GIST to the more controversial MFH lesions.
Data from this analysis demonstrates that STS characterized by specific translocations display remarkably homogenous and distinct global gene expression profiles, as evident in the case of synovial sarcomas, round-cell liposarcomas and clear-cell sarcomas. This phenomenon was similarly observed in GISTs, characterized by recurrent genetic mutations in KIT. The observation of distinct gene expression profiles in these tumors is striking, in particular their consistent ability to cluster using different algorithms. This finding in GIST is consistent with a previous study that showed 13 GISTs to display a distinct gene expression profile relative to 6 spindle-cell sarcomas. 41 Furthermore, the GIST separated from leiomyosarcoma, including intraabdominal tumors, in support of their different histogenesis. Our findings are supported in a recent study by Nielsen et al. 42 Using cDNA microarray technology to profile 41 soft tissue tumors, their study identified GIST, synovial sarcoma and a subset of leiomyosarcoma as distinct groups on hierarchical cluster analysis.
Synovial sarcomas were furthermore shown to be distinct subtypes of STS in recent studies by Allander et al 43 and Nagayama et al. 44 Interestingly, the latter study suggests synovial sarcoma to be related to MPNST. We identified close proximity of several fibrosarcoma specimens to synovial sarcoma. These three tumor types are often indistinguishable on routine light microscopy and may indeed represent a common class of primitive mesenchymal tumors.
The present study also describes the use of a supervised learning algorithm, SVM analysis, in the diagnosis of STS. The diagnosis of tumors characterized by specific genetic events was highly accurate using as few as between 4 and 32 genes. Errors were predominantly confined to reduced specificity at low gene numbers and an eventual drop-off in sensitivity between 1000 and 8000 genes. These findings suggest that, aside from pathognomonic genetic changes that have been reported for these tumors, collective information from an extremely diverse number of genes may be considered in their diagnosis and underlying biology.
Data from this report also reveal that STS characterized by pleomorphic phenotypes and complex karyotypes display relatively inconsistent gene expression profiles, in keeping with their cytogenetic heterogeneity. However, within this group of pleomorphic STS, leiomyosarcoma and a subset of MFH were distinguished by their ability to cluster. This particular finding prompted us to explore the possibility of diagnosing these tumors using a genomic platform. SVM analysis attained perfect performance over a limited range in gene number when diagnosing genomic MFH compared to histological MFH. This observation supports our claim that the genomic group MFH is distinct and amenable to objective diagnosis. Since MFH is diagnosed at different rates by different pathologists we do not have a good sense nationwide or worldwide if specific drugs are better for this subtype or not, beyond just using doxorubicin, ifosfamide, DTIC, or combinations thereof. The identification of a subset of MFH with a particular characteristic expression profile could potentially facilitate an objective diagnosis of this tumor type and assist in subsequent therapeutic studies.
Unlike genomic MFH, improved SVM performance with specimens selected by genomic classification was not initially shown for leiomyosarcoma. The above findings were intriguing for two reasons. First, it provided further support that the ability to diagnose the genomic MFH group by SVM analysis was not only a consequence of their ability to cluster, but in fact demonstrated that the other tumors in this study were sufficiently different so as not to be misdiagnosed as MFH by SVM analysis. Second, the observation of a consistent misclassification of genomically defined leiomyosarcoma prompted us to repeat this SVM analysis including the specimen that was excluded on cluster analysis. This removed the false positive occurrence in SVM analysis and also improved overall performance.
These observations that SVM performance improved when diagnosing genomic groups versus histological groups was not surprising as these tumors were selected largely on the basis of genomic correlation. However, this finding was significant and demonstrated an important and logical extension of genomic profiling. It illustrated that genomic correlation between tumors may be exploited to recognize novel classifications, against which meaningful biological/clinical correlates may be considered. We concluded that the genomic classification by cluster analysis of adult STS and SVM support is feasible and presents a user-independent reproducible mechanism by which to establish biology-based classification of soft tissue sarcoma.
Further inspection of the gene lists that discriminate subtypes of STS was particularly informative for biological discovery. In particular we identified features consistent with autocrine growth loops in a subset of GIST, involving SCF and KIT, and in synovial sarcoma, involving WNT5a and components of the downstream signaling pathway, including FRIZZLED-1.
Mutations in the KIT occur somatically in many sporadic GISTs. These mutations activate the tyrosine kinase activity of KIT and induce constitutive signaling. Inhibition of the tyrosine kinase activity of KIT by imatinib mesylate induces tumor regression in GISTs. 45 The finding of SCF, also known as KIT ligand, in subset of GISTs is a novel and noteworthy finding that may have implications in understanding potential autocrine growth effects in GIST involving the KIT pathway.
The recent study by Nagayama et al 44 similarly identified several genes related to the WNT signaling pathway in synovial sarcoma, including WNT inhibitory factor 1 and Frizzled homolog 10. The finding of PRAME as a discriminating gene in several independent studies 42-44 in synovial sarcoma suggests a particularly robust association of the tumor antigen and this STS subtype.
Results of this analysis point to current treatment strategies for patients with STS, including imatinib (STI-571) for GIST and PPARγ agonists for myxoid/round-cell liposarcomas and suggest additional therapeutic considerations. These include blockade of PI-3 kinase with wortmannin or similar compounds in GIST, and the use of retinoid agonists/antagonists or blockade of WNT signaling in synovial sarcoma.
Whereas Allander et al 43 identified a strong association between ERBB2 expression and synovial sarcoma, we did not identify a similar association. This discrepant finding is likely based on tumor subtype selection as we included only monophasic synovial sarcoma in our study and their group identified ERBB2 to be predominantly expressed in biphasic synovial sarcoma.
We have approached the challenge of sarcoma classification using a combination of clustering techniques to propose novel groups and supervised diagnostic techniques to test the proposed grouping. This combined approach allows us to consider the distinction between groups of tumors in terms of diagnostic sensitivity and specificity rather than by similarity in gene expression profile alone. The classification of STS will continue to evolve as additional subtypes of this disease are introduced into the molecular classification scheme. More detailed analysis of the gene expression profiles of each of the more than 50 subtypes of STS will clarify the biological differences within STS and will hopefully propose therapies specific for each subclass of STS, if not therapy specific for an individual patient’s tumor. The present study proposes multiple molecular pathways that may become potential targets for therapeutic intervention, and represents one step toward a comprehensive molecular understanding of this rare and heterogeneous group of diseases.
Supplementary Material
Acknowledgments
We thank Dr. Agnes Viale of the Genomic Core Laboratory and her staff, Juan Li and Liliana Villafania, as well as Dr. Niccolas Socci for preliminary data analysis. We areparticularly appreciative to the staff of the tumor procurement service, Barbara Kaye-Injeian, Alwyn Maynard, Raul Meliton, and Cora Mariano for collection and cryopreservation of specimens.
Footnotes
Address reprint requests to Neil H. Segal c/o Carlos Cordon-Cardo, Division of Molecular Pathology, Memorial Sloan-Kettering Cancer Center, Rm S801, 1275 York Avenue, New York, NY, 10021. E-mail: segaln01@med.nyu.edu.
Supported by the National Institutes of Health (grant CA-47179 to M.F.B., A.N.H., and C.C.C.), the Etta Weinheim Memorial Fund, and the National Science Foundation (grant IIS-0093302 to W.S.N.).
References
- 1.Jemal A, Thomas A, Murray T, Thun M: Cancer statistics, 2002. CA Cancer J Clin 2002, 52:23-47 [DOI] [PubMed] [Google Scholar]
- 2.Brennan M, Alektiar K, Maki R: Sarcomas of soft tissue and bone: soft tissue sarcoma. Cancer: Principles and Practice of Oncology. 2001:pp 1841-1891 Williams and Wilkins, Philadelphia
- 3. Weiss S Goldblum J eds. Enzinger and Weiss’s Soft Tissue Tumors. 2001:pp 1-19 Mosby, St. Louis
- 4.Brennan M, Lewis J: Dunitz M eds. Diagnosis and Management of Soft Tissue Sarcoma. 2002.
- 5.Mertens F, Fletcher CD, Dal Cin P, De Wever I, Mandahl N, Mitelman F, Rosai J, Rydholm A, Sciot R, Tallini G, Van den Berghe H, Vanni R, Willen H: Cytogenetic analysis of 46 pleomorphic soft tissue sarcomas and correlation with morphologic and clinical features: a report of the CHAMP study group: chromosomes and morphology. Genes Chromosomes Cancer 1998, 22:16-25 [DOI] [PubMed] [Google Scholar]
- 6.Tomescu O, Barr FG: Chromosomal translocations in sarcomas: prospects for therapy. Trends Mol Med 2001, 7:554-559 [DOI] [PubMed] [Google Scholar]
- 7.Clark J, Rocques PJ, Crew AJ, Gill S, Shipley J, Chan AM, Gusterson BA, Cooper CS: Identification of novel genes, SYT and SSX, involved in the t(X;18)(p11.2;q11.2) translocation found in human synovial sarcoma. Nat Genet 1994, 7:502-508 [DOI] [PubMed] [Google Scholar]
- 8.Fligman I, Lonardo F, Jhanwar SC, Gerald WL, Woodruff J, Ladanyi M: Molecular diagnosis of synovial sarcoma and characterization of a variant SYT-SSX2 fusion transcript. Am J Pathol 1995, 147:1592-1599 [PMC free article] [PubMed] [Google Scholar]
- 9.Zucman J, Delattre O, Desmaze C, Epstein AL, Stenman G, Speleman F, Fletchers CD, Aurias A, Thomas G: EWS and ATF-1 gene fusion induced by t(12;22) translocation in malignant melanoma of soft parts. Nat Genet 1993, 4:341-345 [DOI] [PubMed] [Google Scholar]
- 10.Antonescu CR, Tschernyavsky SJ, Woodruff JM, Jungbluth AA, Brennan MF, Ladanyi M: Molecular diagnosis of clear cell sarcoma: detection of EWS-ATF1 and MITF-M transcripts and histopathological and ultrastructural analysis of 12 cases. J Mol Diagn 2002, 4:44-52 [DOI] [PMC free article] [PubMed] [Google Scholar]
- 11.Crozat A, Aman P, Mandahl N, Ron D: Fusion of CHOP to a novel RNA-binding protein in human myxoid liposarcoma. Nature 1993, 363:640-644 [DOI] [PubMed] [Google Scholar]
- 12.Antonescu CR, Tschernyavsky SJ, Decuseara R, Leung DH, Woodruff JM, Brennan MF, Bridge JA, Neff JR, Goldblum JR, Ladanyi M: Prognostic impact of P53 status, TLS-CHOP fusion transcript structure, and histological grade in myxoid liposarcoma: a molecular and clinicopathologic study of 82 cases. Clin Cancer Res 2001, 7:3977-3987 [PubMed] [Google Scholar]
- 13.Ladanyi M, Lui MY, Antonescu CR, Krause-Boehm A, Meindl A, Argani P, Healey JH, Ueda T, Yoshikawa H, Meloni-Ehrig A, Sorensen PH, Mertens F, Mandahl N, van den Berghe H, Sciot R, Cin PD, Bridge J: The der(17)t(X;17)(p11;q25) of human alveolar soft part sarcoma fuses the TFE3 transcription factor gene to ASPL, a novel gene at 17q25. Oncogene 2001, 20:48-57 [DOI] [PubMed] [Google Scholar]
- 14.May WA, Lessnick SL, Braun BS, Klemsz M, Lewis BC, Lunsford LB, Hromas R, Denny CT: The Ewing’s sarcoma EWS/FLI-1 fusion gene encodes a more potent transcriptional activator and is a more powerful transforming gene than FLI-1. Mol Cell Biol 1993, 13:7393-7398 [DOI] [PMC free article] [PubMed] [Google Scholar]
- 15.Longley BJ, Reguera MJ, Ma Y: Classes of c-KIT activating mutations: proposed mechanisms of action and implications for disease classification and therapy. Leuk Res 2001, 25:571-576 [DOI] [PubMed] [Google Scholar]
- 16.Miettinen M, Lasota J: Gastrointestinal stromal tumors–definition, clinical, histological, immunohistochemical, and molecular genetic features and differential diagnosis. Virchows Arch 2001, 438:1-12 [DOI] [PubMed] [Google Scholar]
- 17.Berman J, O’Leary TJ: Gastrointestinal stromal tumor workshop. Hum Pathol 2001, 32:578-582 [DOI] [PubMed] [Google Scholar]
- 18.Kauffman SL, Stout AP: Histiocytic tumors (fibrous xanthoma and histiocytoma) in children. Cancer 1961, 14:469-482 [DOI] [PubMed] [Google Scholar]
- 19.Ozzello L, Stout AP, Murray MR: Cultural characteristics of malignant histiocytomas and fibrous xanthomas. Cancer 1963, 16:331-344 [DOI] [PubMed] [Google Scholar]
- 20.O’Brien JE, Stout AP: Malignant fibrous xanthomas. Cancer 1964, 17:1445-1455 [DOI] [PubMed] [Google Scholar]
- 21.Antonescu CR, Erlandson RA, Huvos AG: Primary fibrosarcoma and malignant fibrous histiocytoma of bone: a comparative ultrastructural study: evidence of a spectrum of fibroblastic differentiation. Ultrastruct Pathol 2000, 24:83-91 [DOI] [PubMed] [Google Scholar]
- 22.Suh CH, Ordonez NG, Mackay B: Malignant fibrous histiocytoma: an ultrastructural perspective. Ultrastruct Pathol 2000, 24:243-250 [DOI] [PubMed] [Google Scholar]
- 23.Brooks JJ: The significance of double phenotypic patterns and markers in human sarcomas: a new model of mesenchymal differentiation. Am J Pathol 1986, 125:113-123 [PMC free article] [PubMed] [Google Scholar]
- 24.Hashimoto H, Daimaru Y, Tsuneyoshi M, Enjoji M: Soft tissue sarcoma with additional anaplastic components. A clinicopathologic and immunohistochemical study of 27 cases. Cancer 1990, 66:1578-1589 [DOI] [PubMed] [Google Scholar]
- 25.Fletcher CD: Pleomorphic malignant fibrous histiocytoma: fact or fiction? A critical reappraisal based on 159 tumors diagnosed as pleomorphic sarcoma. Am J Surg Pathol 1992, 16:213-228 [PubMed] [Google Scholar]
- 26.Lockhart DJ, Dong H, Byrne MC, Follettie MT, Gallo MV, Chee MS, Mittmann M, Wang C, Kobayashi M, Horton H, Brown EL: Expression monitoring by hybridization to high-density oligonucleotide arrays. Nature Biotechnol 1996, 14:1675-1680 [DOI] [PubMed] [Google Scholar]
- 27.Golub TR, Slonim DK, Tamayo P, Huard C, Gaasenbeek M, Mesirov JP, Coller H, Loh ML, Downing JR, Caligiuri MA, Bloomfield CD, Lander ES: Molecular classification of cancer: class discovery and class prediction by gene expression monitoring. Science 1999, 286:531-537 [DOI] [PubMed] [Google Scholar]
- 28.Tamayo P, Slonim D, Mesirov J, Zhu Q, Kitareewan S, Dmitrovsky E, Lander ES, Golub TR: Interpreting patterns of gene expression with self-organizing maps: methods and application to hematopoietic differentiation. Proc Natl Acad Sci USA 1999, 96:2907-2912 [DOI] [PMC free article] [PubMed] [Google Scholar]
- 29.Brown MP, Grundy WN, Lin D, Cristianini N, Sugnet CW, Furey TS, Ares M, Jr, Haussler D: Knowledge-based analysis of microarray gene expression data by using support vector machines. Proc Natl Acad Sci USA 2000, 97:262-267 [DOI] [PMC free article] [PubMed] [Google Scholar]
- 30.Furey TS, Cristianini N, Duffy N, Bednarski DW, Schummer M, Haussler D: Support vector machine classification and validation of cancer tissue samples using microarray expression data. Bioinformatics 2000, 16:906-914 [DOI] [PubMed] [Google Scholar]
- 31.Ramaswamy S, Tamayo P, Rifkin R, Mukherjee S, Yeang CH, Angelo M, Ladd C, Reich M, Latulippe E, Mesirov JP, Poggio T, Gerald W, Loda M, Lander ES, Golub TR: Multiclass cancer diagnosis using tumor gene expression signatures. Proc Natl Acad Sci USA 2001, 98:15149-15154 [DOI] [PMC free article] [PubMed] [Google Scholar]
- 32.Memorial Sloan Kettering Cancer Center 2003: http://www.mskcc.org/genomic.sts
- 33.Segal N, Pavlidis P, Noble W, Antonescu C, Viale A, Wesley U, Busam K, Gallardo H, DeSantis D, Brennan M, Cordon-Cardo C, Wolchok J, Houghton A: Classification of clear cell sarcoma as a subtype of melanoma by genomic profiling. J Clin Oncol 2003, 21:1775-1781 [DOI] [PubMed] [Google Scholar]
- 34.Kawai A, Woodruff J, Healey JH, Brennan MF, Antonescu CR, Ladanyi M: SYT-SSX gene fusion as a determinant of morphology and prognosis in synovial sarcoma. N Engl J Med 1998, 338:153-160 [DOI] [PubMed] [Google Scholar]
- 35.Lasota J, Wozniak A, Sarlomo-Rikala M, Rys J, Kordek R, Nassar A, Sobin LH, Miettinen M: Mutations in exons 9 and 13 of KIT gene are rare events in gastrointestinal stromal tumors: a study of 200 cases. Am J Pathol 2000, 157:1091-1095 [DOI] [PMC free article] [PubMed] [Google Scholar]
- 36.Eisen MB, Spellman PT, Brown PO, Botstein D: Cluster analysis and display of genome-wide expression patterns. Proc Natl Acad Sci USA 1998, 95:14863-14868 [DOI] [PMC free article] [PubMed] [Google Scholar]
- 37.Felsenstein J: Confidence limits on phylogenies: an approach using the bootstrap. Evolution 1985, 39:783-791 [DOI] [PubMed] [Google Scholar]
- 38.Venables WN, Ripley BD: Modern Applied Statistics with S-PLUS. 1999. Springer-Verlag, New York
- 39.Konturek SJ: Opiates and the gastrointestinal tract. Am J Gastroenterol 1980, 74:285-291 [PubMed] [Google Scholar]
- 40.Sattler M, Salgia R, Shrikhande G, Verma S, Pisick E, Prasad KV, Griffin JD: Steel factor induces tyrosine phosphorylation of CRKL and binding of CRKL to a complex containing c-kit, phosphatidylinositol 3-kinase, and p120(CBL). J Biol Chem 1997, 272:10248-10253 [DOI] [PubMed] [Google Scholar]
- 41.Allander SV, Nupponen NN, Ringner M, Hostetter G, Maher GW, Goldberger N, Chen Y, Carpten J, Elkahloun AG, Meltzer PS: Gastrointestinal stromal tumors with KIT mutations exhibit a remarkably homogeneous gene expression profile. Cancer Res 2001, 61:8624-8628 [PubMed] [Google Scholar]
- 42.Nielsen TO, West RB, Linn SC, Alter O, Knowling MA, O’Connell JX, Zhu S, Fero M, Sherlock G, Pollack JR, Brown PO, Botstein D, van de Rijn M: Molecular characterisation of soft tissue tumours: a gene expression study. Lancet 2002, 359:1301-1307 [DOI] [PubMed] [Google Scholar]
- 43.Allander SV, Illei PB, Chen Y, Antonescu CR, Bittner M, Ladanyi M, Meltzer PS: Expression profiling of synovial sarcoma by cDNA microarrays: association of ERBB2, IGFBP2, and ELF3 with epithelial differentiation. Am J Pathol 2002, 161:1587-1595 [DOI] [PMC free article] [PubMed] [Google Scholar]
- 44.Nagayama S, Katagiri T, Tsunoda T, Hosaka T, Nakashima Y, Araki N, Kusuzaki K, Nakayama T, Tsuboyama T, Nakamura T, Imamura M, Nakamura Y, Toguchida J: Genome-wide analysis of gene expression in synovial sarcomas using a cDNA microarray. Cancer Res 2002, 62:5859-5866 [PubMed] [Google Scholar]
- 45.Tuveson DA, Willis NA, Jacks T, Griffin JD, Singer S, Fletcher CD, Fletcher JA, Demetri GD: STI571 inactivation of the gastrointestinal stromal tumor c-KIT oncoprotein: biological and clinical implications. Oncogene 2001, 20:5054-5058 [DOI] [PubMed] [Google Scholar]
Associated Data
This section collects any data citations, data availability statements, or supplementary materials included in this article.