

Abstract
To analyze differential gene expression of putative prostate tumor markers we compared the expression levels of more than 400 cancer-related genes using the cDNA array technique in a set of capsule-invasive prostate tumor and matched normal prostate tissue. The overexpression of Bax inhibitor-1 (BI-1) in prostate carcinoma and prostate cancer cell lines was confirmed by using Northern blot and Western blot analyses. Quantitative real-time reverse transcription-polymerase chain reaction (RT-PCR) on intact RNAs from 17 paired laser-captured microdissected epithelial tissue samples confirmed up-regulated BI-1 expression in 11 of 17 prostate tumors. In addition, it was demonstrated that BI-1 expression is down-regulated in stromal cells as compared to matched normal epithelial cells of the prostate. In situ hybridization experiments on prostate sections also revealed that BI-1 expression is mainly restricted to epithelial cells. Furthermore, quantitative RT-PCR on RNAs derived from five benign prostate hyperplasia (BPH) samples showed no significant difference in BI-1 expression as compared to normal epithelial prostate tissue. To determine the function of BI-1 in vitro, human PC-3, LNCaP, and DU-145 prostate carcinoma cells were transfected with small interfering double-strand RNA (siRNA) oligonucleotides against the BI-1 gene leading to a specific down-regulation of BI-1 expression. Furthermore, transfection of PC-3, LNCaP, and DU-145 cells with BI-1 sequence-specific siRNAs caused a significant increase in spontaneous apoptosis in all cell lines. Taken together, our results indicate that the human BI-1 gene contains the potential to serve as a prostate cancer expression marker and as a potential target for developing therapeutic strategies for prostate cancer.
Prostate cancer is the most frequently diagnosed solid tumor in men, and the second leading cause of cancer death in males from western countries. 1 One of the key issues in prostate cancer research is to develop molecular markers that can effectively detect and distinguish the progression and malignancy of prostate tumors as well as provide insights into prostate tumor development or behavior. Progress in identifying such markers has been markedly accelerated by recent advances in molecular biology technologies, such as cDNA array and microarray techniques, which enabled analyzing the expression of thousands of genes in a single experiment and hold great promise for a better understanding of the molecular genetics and biology of prostate cancers. 2,3 Also, the recent development of laser-capture microdissection (LCM), a technique that allows for the reliable and accurate procurement of cells from specific microscopic regions of tissue sections under direct visualization, now affords the opportunity to perform molecular genetic analysis of pure populations of prostate cancer cells in their native tissue environment. 4
Compelling evidence suggests that the tumorigenic growth of the prostate depends on the evasion of normal homeostatic control mechanisms, because of an increase in cell proliferation and a decrease in apoptotic death. 5,6 Thus, enhancing the apoptotic process emerges as a significant therapeutic target for the effective elimination of both androgen-dependent and androgen-independent prostate cancer cells. 7 Recently, reported adenovirus-mediated Bax overexpression induced apoptosis of LNCaP, PC-3, and DU-145 growing in vitro and in vivo. 8 However, the pro-apoptotic protein Bax seems to be expressed in all prostate cancers evaluated but the expression of several anti-apoptotic members of the bcl-2 gene family increases during progression of prostate cancers. 9 Therefore, it is important to unravel the mechanisms protecting prostate cancer cells from undergoing apoptosis and to identify new therapeutic targets and to develop new treatments. Recently, the novel anti-apoptotic protein Bax inhibitor-1 (BI-1), formerly known as testicular enhanced gene transcript (TEGT), was shown to represent a new type of regulator of cell death pathways controlled by Bcl-2 and Bax. 10 It was demonstrated that BI-1 can interact with Bcl-2 and Bcl-XL but not Bax and Bad, and when overexpressed in mammalian cells, BI-1 suppressed apoptosis induced by Bax, etoposide, staurosporine, and growth factor deprivation, but not by Fas (CD95). 11
In this report, we identified BI-1 overexpression in prostate carcinoma by using the cDNA array technique. These findings were confirmed on RNAs from LCM-derived prostate tumor tissue samples in 12 of 18 patients using either Northern blot or real-time RT-PCR analyses. Moreover, both quantitative RT-PCR and in situ hybridization experiments demonstrated up-regulated BI-1 expression in epithelial cells as compared to stromal cells. In addition, no significant difference was observed in BI-1 expression between normal prostate cells of epithelial origin and from cells derived from BPH samples. Furthermore, we demonstrate that down-regulation of BI-1 expression via sequence-specific siRNA against the human BI-1 gene leads to a significant increase of PC-3, LNCaP, and DU-145 prostate carcinoma cell death. These results indicate an important role for BI-1 in cellular homeostasis of prostate carcinoma and provide a basis for targeting BI-1 as a potential treatment for prostate cancer.
Materials and Methods
Atlas Select Human Tumor Arrays
Total RNA (50 μg) from paired prostate and prostate carcinoma tissue, respectively, was isolated with the RNeasy Mini Kit (Qiagen GmbH, Hilden, Germany) from a 68-year-old patient (Gleason score 5, tumor stage pT3aN0). Total RNA was treated with RNase-free DNase I (BD Biosciences Clontech, Heidelberg, Germany) and checked on a denaturing agarose gel. The 32P-cDNA probes were prepared using the Atlas Pure Total RNA Labeling system (Clontech) according to the user manual and were hybridized side-by-side to two identical Atlas Select Human Tumor Arrays (BD Biosciences Clontech). The Atlas Select Human Tumor Array includes cDNAs for 437 differentially-expressed human genes, 32 control cancer genes, nine housekeeping control genes, and negative controls immobilized on a nylon membrane. The differentially expressed genes included on this array were shown to be up- or down-regulated in human tumors using Clontech PCR-Select cDNA Subtraction in conjunction with an array-based screening method. After overnight hybridization and a high-stringency wash (according to the procedure described in the Atlas Array user manual), arrays were scanned after a 3-day exposure by using a Molecular Imager FX (Bio-Rad GmbH, Munich, Germany) and analyzed by using the Quantity One software (Bio-Rad).
Laser Capture Microdissection and Real-Time RT-PCR Analysis
Tissue specimens from benign prostate hyperplasia (BPH) and radical prostatectomy specimens of patients suffering from prostate cancer were freshly obtained from the urological operation theater of the university hospital. Specimens from radical prostatectomies were immediately cut in 3-mm-thick transversal slices. One slice suspected to contain carcinoma tissue was soaked in RNAlaterreagent (Ambion Europe Ltd., Cambridgeshire, UK). The complete transverse section was mapped and cut into small tissue blocks, which were further stored in RNAlater. The rest of the prostate, especially adjacent prostate slices, were fixed in formalin and embedded in paraffin for standard histological examination. Staging was performed according to the UICC classification. Tumors were graded using the Gleason score. According to the adjacent paraffin sections RNAlater-preserved tissue was selected. Cryostat sections were hematoxylin-eosin stained and the tissue was morphologically characterized. Tumor-containing tissue blocks and tumor-free prostate tissue of the same case were selected for further analysis. Five-μm-thick cryostat sections were mounted on slides coated with a 1.35-μm-thick polyethylene naphtalene membrane (P.A.L.M. Microlaser Technologies, Bernried, Germany). Subsequently, sections were washed for 2 hours in 70% ethanol/DEPC (diethyl pyrocarbonate)-treated water followed by staining with Harris hemalaun. Color was developed by incubation with DEPC-treated tap water for 2 hours. Lastly, slides were dipped in pure ethanol and xylol, air-dried, and subjected to contact-free laser microdissection (P.A.L.M.) at a magnification of ×200. The dissected normal epithelia and carcinoma epithelia were automatically transferred into lids of PCR vials and collected in RLT buffer (Qiagen) substituted with β-mercaptoethanol. LCM-derived tissue samples from stromal cells, from matched normal epithelial cells and from BPH were isolated and treated as described above. Total cellular RNA from LCM samples was extracted with the RNeasy Mini Kit (Qiagen). RNA integrity and quantity was assessed using the Agilent Bioanalyzer 2100 with the RNA Pico LabChip Kit (Agilent Technologies, Waldbronn, Germany). Additional controls were performed by analyzing unstained tissue sections and the remaining tissue after microdissection. Reverse transcription with random hexamer primers was performed with the Sensiscript RT Kit (Qiagen). Quantification of BI-1 and β-actin expression was performed on an iCycler iQ real-time detection system (Bio-Rad, Hercules, CA) using the HotStar TaqDNA Polymerase Kit (Qiagen). The 20-μl reaction from the kit was supplemented with 2 μl cDNA, 0.6 μmol/L gene-specific primers, and 0.2 μmol/L dual-labeled fluorescent probes for BI-1 and β-actin with different fluorophores FAM and Texas Red allowing for duplex PCR. Primers and probes (Operon; Qiagen) were designed using the Primer3 online primer design program (http://www-genome.wi.mit.edu/genome_software/other/primer3.html). Primers used for quantitative RT-PCR were: BI-1 forward primer, 5′-ACGGACTCTGGAACCATGAA-3′; BI-1 reverse primer, 5′-AGCCGCCACAAACATACAA-3′; BI-1 probe, 5′Fam-ATATAACCCCGTCAACGCAGCAGCACC-Tamra-3′; β-actin forward primer, 5′-TCACCCACACTGTGCCCATCTACGA; β-actin reverse primer, GGTAACCGTTACTCGCCAAGGCGAC-3′; β-actin probe, 5′-Texas Red-ATGCCCTCCCCCATGCCATCCTGCGT-BHQ-3′. A standard curve for quantitative PCR was generated with the same reaction set-up using BI-1 and β-actin standard cRNA (0.001 to 1000 attomoles) instead of total cellular RNA. Acquisition of fluorescence signals was monitored on the iCycler and terminated when all reactions reached an amplification plateau while a template-free control stayed at a basal level. Data analysis was performed with the iCycler iQ real-time detection system software (Bio-Rad). To verify that only specific PCR products evoked fluorescence signals, PCR products were run on 2% agarose gels and were analyzed using the E.A.S.Y. Win32 software (Herolab, Wiesloch, Germany). BI-1 mRNA expression was normalized to β-actin mRNA expression to compensate for different sample capacities. The ratio of BI-1 expression is given as factor up-regulation in prostate carcinoma versus normal prostate tissue. In BPH samples where no adjacent disease-free tissue was available BI-1 expression was quantified absolutely in attomoles per pg total cellular RNA.
In Situ Hybridization
In situ hybridization was performed using a digoxigenin-labeled riboprobe of 399 nucleotides corresponding to the published mRNA sequence of the human BI-1 gene (nucleotide position 114–513). 10 For the generation of riboprobes the BI-1 cDNA fragment was cloned into the vector pGEM-T (Promega, Mannheim, Germany). After linearization of the plasmid digoxigenin-labeled riboprobes were generated by in vitro transcription using the SP6 and T7 RNA polymerase (Promega) and the DIG-RNA-labeling mixture (Roche, Mannheim, Germany) according to the manufacturer’s instructions. The labeling efficiency and quality was controlled by dot blot analysis and gel electrophoresis.
Three-μm-thick paraffin sections were mounted on organo-silane coated slides under RNase-free conditions. Sections were deparaffinized and rehydrated, digested with proteinase K (DAKO), and incubated overnight with labeled riboprobes at 50°C. Stringency washings were performed at 60°C in washing solutions containing 1% sodium dodecyl sulfate (SDS) in 2X saline sodium citrate (SSC) and 1% SDS in 1X SSC. RNA hybrids were detected with a sheep polyclonal anti-digoxigenin antibody F(ab)2 fragment conjugated with alkaline phosphatase (Roche). After signal detection with 5-bromo-4-chloro-indolyl phosphate and nitro tetrazolium blue slides were mounted in glycerin gelatin.
Cell Culture and Transfection
PC-3, LNCaP and DU-145 cells were grown in RPMI 1640 medium (PAN-Systems GmbH, Nürnberg, Germany) containing 15% fetal bovine serum (FBS) and 1% penicillin/streptomycin solution (PAN). The cells were cultured at 37°C in a humidified incubator with 5% CO2 and grown to 10% to 20% confluency in 12-well plates before transfection with RNA oligonucleotides.
Transfection of PC-3, LNCaP, and DU-145 cells was accomplished using Oligofectamine Reagent (Invitrogen GmbH, Karlsruhe, Germany) according to the supplier’s instructions with either BI-1 gene-specific siRNA duplex or with single-strand sense and antisense RNA oligonucleotides (IBA GmbH, Goettingen, Germany) (BI-1 sense RNA: 5′-CCCCGUCAACGCAGCAGCAdTdT-3′; BI-1 antisense RNA: 5′-UGCUGCUGCGUUGACGG GGdTdT- 3′) at a concentration of 0.66 μg per 0.5 ml of transfection medium (150 nmol/L). The target region is located 57 nucleotides downstream of the start codon ATG of the human BI-1 gene (GenBank Accession No. X75861). As further controls PC-3 cells were transfected with either siRNA duplex oligonucleotides against the firefly luciferase gene (luc sense RNA: 5′-CGUACGCGGAAUACUUCGATT-3′; luc antisense RNA: 5′-UCGAAGUAUUCCGCGUACGTT-3′) or against the human Mammary tumor, 8 kDa (Mat-8) gene (Mat-8 sense RNA: 5′-CAGUCCUUUCUACUAUGACTT-3′; Mat-8 antisense RNA: 5′-GUCAUAGUAGAAAGGACUGTT-3′). 12 At different time points after transfection (24 hours, 36 hours, and 45 hours), living cells attached to the bottom and cells floating in the medium were collected and used in the following experiments.
LNCaP cells were maintained in phenol red-free DMEM (Invitrogen) supplemented with 10% fetal calf serum (FCS; PAA, Coelbe, Germany), 2% glutamine, 1% sodium-pyruvate, and 1% penicillin-streptomycin. Cells were plated in 6-well plates at a density of 105 cells per well for dihydrotestosterone treatment (final concentration 10−8 M dihydrotestosterone). Cells were harvested after dihydrotestosterone treatment at different time points (1 hour, 2 hours, 4 hours, and 24 hours) by trypsinization and washed with PBS (BioWhittaker, Verviers, Belgium) before RNA extraction and real-time RT-PCR. Cell viability under hormone treatments was measured by using an MTT test. All chemicals were purchased from σ-Aldrich (Taufkirchen, Germany) unless stated otherwise.
Northern Blot Analysis
Total RNA was isolated from tissue samples, PC-3 cells, LNCaP cells, and DU-145 cells with the RNeasy Mini Kit (Qiagen) according to the manufacturer’s instructions, separated on a denaturing agarose gel and transferred to a Hybond-N nylon membrane (Amersham Pharmacia Biotech, Buckinghamshire, UK). The cDNA probes for human β-actin (IMAGp998L23787) and human BI-1 (IMAGp998B10404) were purchased from Deutsches Ressourcenzentrum für Genomforschung GmbH (RZPD, Berlin, Germany). The probes were labeled with [32P]dCTP using the rediprime II labeling kit (Amersham) and hybridized to the membrane in Rapid-hyb buffer (Amersham) together with 100 μg/ml denatured salmon sperm DNA at 65°C for 16 hours. The filters were washed at room temperature for 15 minutes in 2X SSC followed by 5 to 15 minutes in 0.5X SSC and 0.5% SDS (w/v) at 65°C. The hybridization signals were quantified with a Molecular Imager FX by using the Quantity One software (both from Bio-Rad).
Western Blot Analysis
The goat polyclonal antibody against human BI-1 (A-18) was purchased from Santa Cruz Biotechnology Inc. (Heidelberg, Germany), and the mouse monoclonal antibody against α-tubulin was obtained from σ-Aldrich. Parental and transfected PC-3, LNCaP, and DU-145 cells were incubated in the appropriate medium as described above and whole-cell lysates were prepared from lysis buffer containing 50 mmol/L NaCl, 10 mmol/L ethylenediaminetetraacetic acid, 50 mmol/L Tris-HCl pH 7.6, 1% Triton X-100, 1 μg/ml leupeptin, 1 μg/ml aprotinin, and 1 μg/ml phenylmethylsulfonyl fluoride. Fifty μg of total cell lysates were boiled and denatured in sample buffer containing SDS and dithiothreitol (DTT; Invitrogen) followed by gel electrophoresis using the NuPage 10% Bis-Tris pre-cast gel (Invitrogen) in MES buffer (Invitrogen). The proteins were electrotransferred to nitrocellulose membrane Hybond-C (Amersham). The resulting protein-bound membrane was blotted with selectedantibodies as described above and visualized using 5-bromo-4-chloro-3-indolyl phosphate/nitroblue tetrazolium reagents (Carl Roth & Co., Karlsruhe, Germany).
Trypan Blue Staining
Cell death was determined by trypan blue exclusion. After treatment with siRNA duplex or control oligonucleotides 100 μl of a 0.4% solution of trypan blue (Invitrogen) were added to 0.5 ml of a PC-3 cell suspension (1–2 × 10⁵ cells). After 10 to 15 minutes of incubation the suspension was applied to a hemocytometer. Both viable and nonviable cells were counted and the percentage of cell death was determined by counting trypan-blue-positive cells from three independent experiments.
In Situ End-Labeling (ISEL) and DAPI Staining
PC-3 cells (105 cells/ml) were cytocentrifuged on glass slides, dried, fixed in acetone, and incubated with TBS containing 10% FCS and 0.3% H2O2 to block endogenous peroxidase activity. Cells were incubated for 60 minutes at 37°C with 50 μl of the labeling mix (250 U/ml terminal transferase, 20 μl/ml Dig-DNA labeling mix at 10X concentration, and 1 mmol/L CoCl2 in reaction buffer for terminal transferase (Roche, Mannheim, Germany). Labeled DNA nicks were detected with a rabbit horseradish peroxidase (HRP)-conjugated F(ab)2 fragment against digoxigenin (Dako, Hamburg, Germany) at a working dilution of 1:200. Incubation with 3,3′-Diaminobenzidin revealed brown nuclear signals. Controls were stained as above, omitting terminal transferase. As positive controls, lymph nodes with reactive follicular hyperplasia were used. Positive-stained cells were counted under a microscope (BX60; Olympus Optical Co. LTD, Japan) at a magnification of ×100 in five different fields using the analySIS software (Soft Imaging System GmbH, Munster, Germany).
For DAPI staining PC-3, LNCaP, and DU-145 cells (105 cells/ml) were cytocentrifuged on glass slides, dried overnight, and fixed for 10 minutes in 100% acetone. Thereafter, cells were incubated with VECTASHIELD Mounting Medium with DAPI (Vector Laboratories Ltd., Peterborough, England). Stained cells were analyzed and counted under a fluorescent microscope (BX60; Olympus Optical Co., LTD) at a magnification of ×200 in five different fields using the analySIS software (Soft Imaging System GmbH).
Immunocytochemistry
Cytocentrifugated PC-3 cells (105 cells/ml) were dried, fixed in acetone, and incubated with the polyclonal rabbit anti-human antibody against the active caspase-3 (clone AF835, R&D Systems GmbH, Wiesbaden, Germany) followed by incubation with a biotinylated secondary antibody, alkaline phosphatase-conjugated streptavidin (Dako) and by visualization with Fast Red (Dako). Slides were counterstained with hemalaun. Positive cells showed a red cytoplasmic staining around the clearly demarcated nuclei. Controls were stained as above omitting the first or secondary antibody. As a positive control, sections with gout tophi were used, as previously described. 13
Results and Discussion
Array and Northern Blot Analysis of BI-1 Expression in Prostate Carcinoma
To identify genes that are differentially expressed in normal prostate and prostate carcinoma tissues, total RNA from matched prostate and prostate carcinoma were isolated (case 01, pT3aN0). Total RNA prepared from these tissues was used to synthesize 32P-labeled cDNAs by reverse transcription, followed by hybridization to two identical Atlas Select Human Tumor Arrays from BD Biosciences Clontech as described in Materials and Methods. This array contains immobilized cDNAs of differentially-expressed genes from five different human tumors: bladder, breast, liver, lung, and prostate carcinoma. In total, 46 known and unknown differentially-expressed genes were identified to be up- or down-regulated in prostate carcinoma. The known genes showing a differential expression pattern in prostate tumor samples included transcription factors, protooncogenes, and other proteins, eg, Krox 24, c-jun, spermidyne acetyltransferase, ribosomal proteins, clusterin, and prostate secretory protein 94 (data not shown). One of the genes showing increased expression in prostate carcinoma is termed BI-1, which was previously found to be involved in cellular apoptosis. 11 A typical scanned phosphorimage of the arrays representing BI-1 and β-actin expression levels in prostate carcinoma as compared to normal prostate tissue is shown in Figure 1A ▶ . In addition, the isolated BI-1 cDNA was subjected to Northern blot analysis to verify the differential expression pattern in prostate carcinoma as compared to the matched normal prostate and for integrity and equality of the RNA the Northern blot was rehybridized with a human β-actin cDNA probe (Figure 1B) ▶ . Quantification of the Northern blot using a phosphorimager revealed a fourfold up-regulation of both BI-1 transcripts (2.7 kb and 1.2 kb) in cancerous specimen as compared to the matched normal tissue. It is also worth noting that the array-spotted BI-1 cDNA was originally described by BD Biosciences Clontech to be differentially expressed (up-regulated expression) in breast cancer. This finding was supported by a large-scale DNA microarray analysis on primary breast tumors from 117 young patients, showing that BI-1 (TEGT) expression is up-regulated in breast cancer and co-regulates with the expression of the estrogen receptor-α gene. 14 Furthermore, Schmitts and co-workers 15 reported that BI-1 expression was between 5 and 10 times stronger in 16 glioma samples tested compared with normal brain and other normal tissues. Finally, microarray analyses of the expression levels of more than 8900 different human genes in a set of normal and malignant prostate tissues revealed that BI-1 (TEGT) is highly and specifically expressed in malignant samples. 3 Furthermore, using BI-1 cDNA as a probe, Northern blot analysis on RNA isolated from the androgen-dependent cell line LNCaP and the androgen-independent prostate cancer cell lines PC-3 and DU-145 revealed that BI-1 is highly expressed in all prostate cancer cell lines tested as compared to the normal prostate tissue (Figure 1C) ▶ . However, quantification of the Northern blot using a phosphorimager showed an approximately twofold up-regulation of BI-1 mRNA in PC-3 cells as compared to both LNCaP and DU-145 cells (Figure 1D) ▶ . In addition, the overexpression of BI-1 in PC-3 cells could also be confirmed at the protein level (Figure 1E) ▶ . Interestingly, in a previous study it was demonstrated that one interaction partner of BI-1, the antiapoptotic protein Bcl-XL, is also overexpressed in PC-3 cells in comparison with LNCaP and DU-145 cells. 16
Figure 1.

Up-regulation of BI-1 expression in prostate carcinoma (PCa) compared with the benign counterpart (P) from the same gland. Total RNAs were extracted from either prostate carcinoma (case 01, Gleason score 5, pT3aN0) or corresponding normal prostate tissue, reverse-transcribed into cDNA and used in both hybridization experiments described below. A: Representative BI-1 and β-actin hybridization signals obtained from two identical Atlas Select Human Tumor Arrays using 32P-labeled cDNAs as probes. B: Northern blot analysis on total RNA (5 μg each) from both prostate carcinoma (PCa) and matched normal prostate (P) from the same patient is shown which was carried out using a human BI-1 cDNA fragment as a hybridization probe. C: Northern blot on total RNA (5 μg each) from DU-145, LNCaP and PC-3 cells using the same BI-1 cDNA as a probe. For integrity and equality of the RNA Northern blots were rehybridized with a human β-actin cDNA probe. D: The mRNA signals were scanned using the phosphorimager Molecular Imager FX, and the difference in the expression of BI-1 transcripts was calculated relative to the β-actin standards. Results of the analysis for BI-1 are shown in the bar graph. The cell names under the bars correspond to the cell names used in C. E: Western blot analysis of DU-145, LNCaP, and PC-3 cells using BI-1- (top panel) or α-tubulin-specific (bottom panel) antibodies. The Western blot was stripped and re-probed with an α-tubulin antibody to check for equal loading (50 μg) of total protein.
To study a possible involvement of androgens on the expression of BI-1 in prostate carcinoma, LNCaP cells were treated with dihydrotestosterone at different time points (1 hour, 2 hours, 4 hours, and 24 hours) and isolated RNAs from treated and untreated cells were subsequently analyzed by quantitative RT-PCR in triplicate. However, quantitative RT-PCR analyses revealed no differences in the expression of BI-1 in dihydrotestosterone-treated and untreated LNCaP cells, indicating that androgens do not play a role in regulating the expression of BI-1 in prostate cancer cells (data not shown).
BI-1 Expression in Human Prostate Cancer, Stromal Cells, and Benign Prostate Hyperplasia
To confirm BI-1 overexpression detected by array and Northern blot analyses on RNA from bulk tumor tissues, prostate cancer specimens were subjected to both laser-capture microdissection and quantitative RT-PCR analysis. Before quantitative RT-PCR, RNA samples isolated from matched normal prostate and prostate cancer epithelial cells were checked for RNA integrity and RNA amount by analyzing an RNA aliquot on the Agilent Pico LabChip (Figure 2A) ▶ . Subsequently, BI-1 mRNA expression was analyzed by quantitative RT-PCR on RNAs (equal amounts) from LCM-derived samples from 17 radical prostatectomies from cancer patients which were prepared as described in Material and Methods. In 11 of 17 cases BI-1 expression was up-regulated (more than 2 times) up to 12-fold in LCM samples derived from tumorous areas as compared to the paired normal prostate tissues (Figure 2B) ▶ . The quantitative RT-PCR analysis did not show a significant correlation with specific clinicopathological features such as pathological and clinical stage (Figure 2B) ▶ .
Figure 2.

BI-1 expression in prostate carcinoma (PCa) and stromal tissue. A: Before quantitative RT-PCR the amount and integrity of total RNAs derived from paired laser-captured microdissected (LCM) samples were analyzed on an Agilent Pico LabChip. The bands for 28s rRNA and 18s rRNA are indicated (M, Ambion RNA 6000 ladder; P, normal prostate; PCa, prostate carcinoma). B: BI-1 expression and clinicopathological features of the patients analyzed in the present study. Prescreened total RNAs isolated from LCM paired normal prostates and prostate tumors from seventeen radical prostatectomies were analyzed by two-step real-time RT-PCR for BI-1 expression relative to β-actin. Factors of up-regulation of BI-1 expression in tumor specimens as compared to matched normal prostate tissues are shown. (* indicates factor of up-regulation of BI-1 expression in comparison to tumor-free tissue normalized against β-actin). C: BI-1 expression in stromal tissues. Total RNAs derived from LCM paired stromal tissue and epithelial tissue (tumor-free) from five radical prostatectomies were analyzed as described in B (** indicates factor of down-regulation of BI-1 expression in stromal tissue in comparison to tumor-free tissue normalized against β-actin).
Quantitative RT-PCR analysis on isolated RNA of five LCM-derived stromal tissue samples from radical prostatectomies showed a reduced BI-1 expression as compared to corresponding tumor-free epithelia (Figure 2C) ▶ . Moreover, BI-1 expression was analyzed in five cases of benign prostatic hyperplasia (BPH) tissue samples from transurethral resections by using quantitative RT-PCR. Because no corresponding normal tissue was available to which we could relate BI-1, we calculated BI-1 expression absolutely as attomoles per pg total cellular RNA. In these five cases of BPH, BI-1 expression was determined with an average value of 1.1 attomoles per pg RNA. Compared to tumor-free epithelia from radical prostatectomies there seems to be a lower expression of BI-1 in BPH; however, this difference is without statistical significance (n = 5; P = 0.31).
To confirm the results obtained by quantitative RT-PCR analyses and to evaluate the cellular localization of BI-1 transcripts, the non-radioactive in situ hybridization technique was applied on tissue sections from five different prostatectomies using BI-1-specific antisense and sense riboprobes. In all cases BI-1 mRNA expression could be localized within non-transformed epithelial cells and cancer epithelia with the antisense riboprobe, whereas in stromal cells only weak hybridization signals were observed (Figure 3A) ▶ . In contrast, no hybridization signals were observed using the BI-1 riboprobe in the sense orientation as a control (Figure 3B) ▶ . However, in one case inflammatory infiltrates within the stromal compartment were observed showing a strong BI-1 mRNA expression (Figure 3, C and D) ▶ . It is worth mentioning that several Expressed Sequence Tag (EST) clones for BI-1 which are expressed in activated T-cells, Jurkat T-cells, and T-cell lymphomas can be identified in the National Center for Biotechnology Information EST database (Accession numbers: AA352408, AA354085, AA361535, respectively). Additionally, BI-1 expression was also found to be up-regulated in nucleophosmin-anaplastic lymphoma kinase-positive large cell lymphoma. 17
Figure 3.
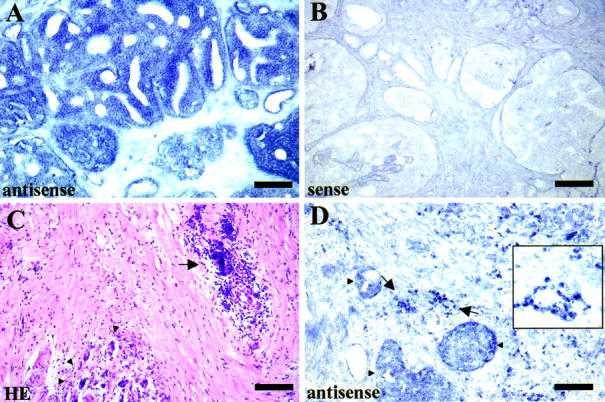
Non-radioactive in situ hybridization of BI-1 mRNA in prostate tissue. A: BI-1mRNA expression is mainly restricted to prostate carcinoma cells, whereas only weak BI-1 expression is observed in the stromal compartment using a BI-1-specific antisense cRNA probe for hybridization (scale bar, 200 μm). B: In situ hybridization using a BI-1-specific sense cRNA probe (negative control) confirms the specificity of the hybridization signals. C and D: In one case an inflammatory infiltrate (arrow) was observed in the vicinity of carcinoma cells (arrowheads) within the prostate stroma after hematoxylin-eosin staining. In situ hybridization with a BI-1 antisense cRNA probe revealed strong expression of BI-1 in infiltrating cells (inset, higher magnification of BI-1 hybridization signals on infiltrating cells).
Taken together, the expression studies clearly demonstrate that BI-1 expression is up-regulated in most cases of prostate cancer specimens (cells of epithelial origin) as compared to normal prostate epithelia and BPH. Furthermore, BI-1 expression in the prostate is mainly restricted to cells of the epithelial compartment, whereas stromal cells express only low BI-1 mRNA levels. However, due to the failure to detect BI-1 protein expression by using two different BI-1-specific antibodies on prostate cancer tissue sections (data not shown), lack of protein data could be a potential important shortcoming of this study.
Down-Regulation of BI-1 Expression Leads to Prostate Cancer Cell Death
RNA interference (RNAi) or RNA silencing is the process whereby double-stranded RNA (dsRNA or duplex RNA) induces the homology-dependent and specific degradation of cognate mRNA. The specific knockdown of expression of several genes was studied in a wide variety of species, such as Caenorahbditis elegans, Drosophila melanogaster, Arabidopsis thaliana, Neurospora crassa, and embryonic cells from mus musculus. 18 More recently, the use of RNAi has been extended to differentiated mammalian cells. 19,20 To evaluate the function of BI-1 in human PC-3, LNCaP, and DU-145 prostate carcinoma cells this novel approach of gene silencing through RNAi was applied. Transfection of PC-3, LNCaP, and DU-145 cells was accomplished with BI-1 sequence-specific siRNA duplex oligonucleotides. As negative controls single-strand sense and antisense RNA oligonucleotides against the BI-1 gene were used, as well as duplex siRNA oligonucleotides against the firefly luciferase gene (Photinus pyralis) and the human Mat-8 gene.
At different time points after transfection (24 hours, 36 hours, and 45 hours for PC-3 cells) or 45 hours after transfection (LNCaP and DU-145 cells), both prostate cancer cells attached to the bottom and cells floating in the medium were collected and used for the determination of down-regulation of BI-1 expression. To test whether transfection of PC-3 cells with BI-1 duplex siRNA could affect the expression of endogenous BI-1 mRNA, we analyzed RNA from duplex siRNA-transfected PC-3, LNCaP, and DU-145 cells with RNA from prostate cancer cells transfected with control oligonucleotides by Northern blot hybridization. We found that the expression of BI-1 in duplex siRNA-transfected (D-BI-1) prostate cancer cells was reduced by 50% to 70% relative to the control-transfected (control) cells (Figure 4, A and B) ▶ . The same membranes were rehybridized with a cDNA probe for human β-actin to verify the integrity and amount of RNA in the samples (Figure 4, A and B) ▶ . To investigate the knockdown of BI-1 expression in BI-1 duplex siRNA-transfected PC-3, LNCaP, and DU-145 cells at the protein level, Western blot analysis using a polyclonal antibody against BI-1 was performed. As shown in Figure 4C ▶ , the expression of BI-1 (45 hours after transfection) was specifically reduced by the cognate duplex siRNA (D-BI-1), but not when control oligonucleotides were used. The expression of a non-targeted housekeeping gene, α-tubulin, was unaffected and the reduction in BI-1 protein was more than 50% to 80% complete as quantified by Western blotting.
Figure 4.

Down-regulation of BI-1 expression in PC-3, LNCaP, and DU-145 cells transfected with sequence-specific duplex siRNA oligonucleotides (D-BI-1) against the BI-1 gene. As negative controls, single-strand BI-1 sense and antisense oligonucleotides, duplex siRNA oligonucleotides against the firefly luciferase gene and the Mat-8 gene were used for transfection experiments (control). After transfection both attached and floating PC-3, LNCaP, and DU-145 cells were collected and used for both RNA and protein isolation, respectively. A: Northern blot analysis of total RNA (5 μg) derived from siRNA-transfected (D-BI-1) and control-transfected PC-3, LNCaP and DU-145 cells was performed using a human BI-1 cDNA fragment as a probe. Rehybridization of the same filter was carried out with a cDNA probe for β-actin. B: The mRNA signals were scanned using the phosphorimager Molecular Imager FX and the difference in the expression of BI-1 transcripts was calculated relative to the β-actin standards. Results of the analysis for BI-1 are shown in the bar graph. The labels for the bars correspond to those used in A. C: Western blot analysis of transfected PC-3, LNCaP, and DU-145 cells using BI-1 (top panel) or α-tubulin-specific (bottom panel) antibodies. The Western blot was stripped and re-probed with an α-tubulin antibody to check for equal loading (50 μg) of total protein.
To assess the effect of BI-1 suppression on viability of PC-3 cells, cell death was studied using four different methods: 1) trypan blue exclusion to detect cell death attributable to membrane damage, 2) analysis of induced caspase-3 activity, 3) in situ end-labeling (ISEL) staining to detect DNA fragmentation, and 4) DAPI staining to detect nuclear changes such as fragmentation and condensation. After treatment of PC-3 cells with duplex siRNA oligonucleotides against BI-1, trypan blue exclusion test was applied where both viable and nonviable cells were counted. The amount of PC-3 cell death was analyzed by comparing the number of trypan-blue-positive cells to the number of unstained cells from three independent experiments. As shown in Figure 6A ▶ , induction of PC-3 cell death by duplex siRNA (D-BI-1) oligonucleotides occurred 24 hours after transfection (13% positively-stained cells), increased at 36 hours after transfection (43% positively-stained cells) and peaked at 45 hours after treatment (59% positively-stained cells). In contrast, control-transfected PC-3 cells (control) showed no increase in cell death over the indicated time period, but remained at a constant level of 4% to 5% dead cells (Figure 6A) ▶ . Next, we wanted to determine whether duplex siRNA oligonucleotides against BI-1 were capable of inducing caspase-3 activity and/or apoptosis in human PC-3 prostate carcinoma cells. Again, induction of caspase-3 activity and measurement of apoptosis were investigated over a period of 45 hours. As can be seen in Figure 5B ▶ , transfection of PC-3 cells with duplex siRNA oligonucleotides (D-BI-1) caused an increase in the activity of caspase-3-like protease in PC-3 cells. The caspase-3 activity appeared at 24 hours (10% caspase-3-positive cells) and reached its maximum at 45 hours after treatment (38% caspase-3-positive cells), whereas control-transfected PC-3 cells (control) showed only low levels (1% to 2%) of caspase-3 activity over the whole time period (Figure 5A ▶ and data not shown). Apoptosis in duplex siRNA (D-BI-1) and control-transfected (control) PC-3 cells was determined by both ISEL and DAPI staining at various time intervals, apoptotic cells being recognized either by brown staining of the nucleus or condensed and fragmented nuclei (Figure 5, D and F ▶ ; Figure 6B ▶ ). In duplex siRNA-treated PC-3 cells, the number of apoptotic cells started to increase 24 hours after transfection (10% to 15% apoptotic cells) and the number of apoptotic cells continued to rise at subsequent sampling points, up to 45 hours (up to 45% apoptotic cells). In control-transfected PC-3 cells (control) apoptotic cells were minimally observed (2% to 4% apoptotic cells) over the indicated time period (Figure 5, C and E ▶ ; Figure 6B ▶ ).
Figure 6.

Induction of PC-3, LNCaP, and DU-145 apoptotic cell death by using siRNAs against the human BI-1 gene. PC-3 cells were transfected with 150 nmol/L duplex siRNA oligonucleotides (D-BI-1) for various time intervals as indicated. As negative controls, 150 nmol/L single-strand BI-1 sense and antisense oligonucleotides and 150 nmol/L duplex siRNA oligonucleotides against the firefly luciferase gene or against the Mat-8 gene were used for transfection experiments, respectively. A: After transfection, PC-3 cells attached to the bottom and cells floating in the medium were collected and percentage of cell death was assessed by trypan blue staining as described in Materials and Methods. Data, means of three independent experiments (±SE). B: Activation of caspase-3 and induction of apoptotic cell death after transfection of PC-3, LNCaP, and DU-145 cells was analyzed as indicated above and as described in Materials and Methods. Bar graphs represent the percentage of positively-stained cells for caspase-3 (PC-3), ISEL (PC-3), and DAPI-stained apoptotic cells (PC-3, LNCaP, and DU-145) at various time points. Data, means of three independent experiments (±SE). The number of both caspase-3 positive cells and apoptotic cells was determined by counting labeled cells in five randomly chosen high-power fields (original magnification ×100 for caspase-3 and ISEL, and ×200 for DAPI-stained cells).
Figure 5.
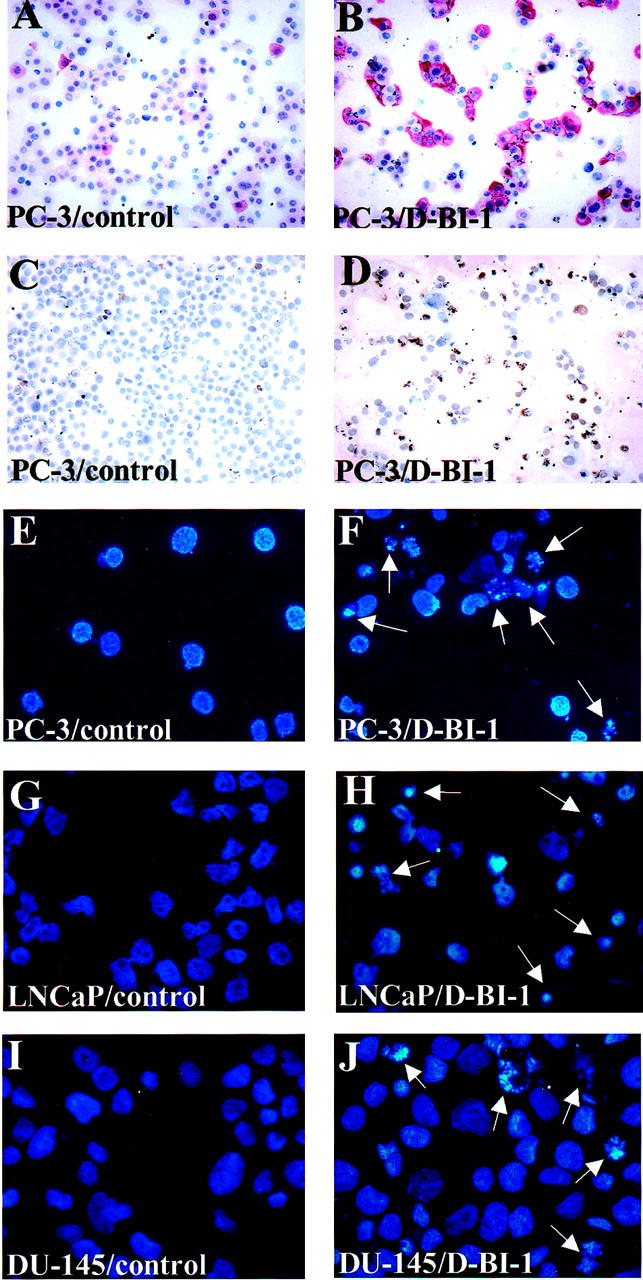
Induction of prostate cancer cell death by using siRNAs against the human BI-1 gene. PC-3, LNCaP, and DU-145 cells were transfected either with 150 nmol/L duplex siRNA oligonucleotides against the BI-1 gene (D-BI-1), with 150 nmol/L single stranded BI-1 sense and antisense oligonucleotides, or with 150 nmol/L duplex siRNA oligonucleotides against the firefly luciferase gene and the Mat-8 gene as negative controls, respectively. Forty-five hours after transfection both attached and floating PC-3, LNCaP, and DU-145 cells were collected and used for apoptosis determination. Caspase-3-stained PC-3 cells of duplex (B-DI-1) siRNA-transfected (B) and control-transfected PC-3 cells (A) were visualized and photographed under a microscope as described in Materials and Methods. Note the red cytoplasmic staining for caspase-3 around the clearly demarcated nuclei. C and D: Control-transfected and ISEL-positive cells of duplex (D-BI-1) siRNA-transfected PC-3 cells. DAPI-stained PC-3 (E and F), LNCaP (G and H), and DU-145 (I and J) control-transfected and duplex (D-BI-1) siRNA-transfected cells were visualized and photographed under a UV-microscope. High numbers of apoptotic cells (arrows) were observed in transfected cells with duplex siRNA oligonucleotides against the BI-1 gene (D-BI-1), whereas only low numbers of apoptotic cells were detectable in control-transfected cells.
Thus, kinetically, the activation of caspase-3 paralleled the induction of apoptosis in duplex siRNA-transfected PC-3 cells. Furthermore, the increase in DNA fragmentation was almost comparable to that of trypan blue positively-stained cells, which suggested that the cytotoxicity induced by duplex siRNA against BI-1 was attributable to both necrotic and apoptotic death. However, it cannot be ruled out that trypan blue staining of PC-3 cells was accomplished due to secondary necrotic cells which are known to be readily formed from apoptotic cells over time. This hypothesis is supported by the fact that only apoptotic cells were observed after DAPI staining of transfected PC-3 cells.
To further test if a specific inhibition of BI-1 expression in other prostate carcinoma cell lines could lead to programmed cell death, LNCaP and DU-145 cells were transfected with duplex siRNA oligonucleotides against the BI-1 gene or control oligonucleotides over the indicated time period (24 hours to 45 hours) and analyzed for cell death by DAPI staining, respectively. Again, after transfection with BI-1 duplex siRNA oligonucleotides (D-BI-1), apoptotic LNCaP and DU-145 cells were detected after DAPI staining (Figure 5, G and J) ▶ , whereas LNCaP and DU-145 cell death was only observed at a basal level after transfection with control oligonucleotides (Figure 5, G and I) ▶ . Comparable to duplex BI-1 siRNA-transfected PC-3 cells, both duplex BI-1 siRNA-transfected LNCaP and DU-145 cells showed an increase of apoptotic cells over the whole time period, however, at a reduced level (Figure 6B) ▶ . Even 45 hours after transfection cell death reached only a maximum level of 18% for LNCaP cells and 15% for DU-145 cells.
In agreement with our results in human PC-3, LNCaP, and DU-145 prostate carcinoma cells, it has been previously demonstrated that BI-1 protein inhibits Bax-induced apoptosis in mammalian cells and when ectopically expressed in yeast. 11 In addition, more recent studies showed that antisense down-regulation of plant NtBI-1 expression in tobacco BY-2 cells induced accelerated cell death and that overexpression of two plant BI-1 homologues suppressed Bax-induced apoptosis in human 293 cells. 21,22 Furthermore, it was shown that BI-1 contains six or seven predicted transmembrane domains and the localization of BI-1 was found to be similar to Bcl-2, exhibiting a nuclear envelope and endoplasmic reticulum (ER)-associated pattern. When overexpressed in human cells, an association of BI-1 with Bcl-2 and Bcl-XL was demonstrated by both chemical cross-linking and co-immunoprecipitation experiments. 11 Moreover, BI-1 was isolated as one of the candidate suppressors of the tumor necrosis factor-related apoptosis-inducing ligand. 23
Among the various prostate cancer cell lines, recent studies demonstrated that PC-3 cells are more resistant to apoptosis than LNCaP cells. 24-26 More recently, Li and co-workers 16 reported that overexpression of Bcl-XL underlies the molecular basis for resistance to staurosporine-induced apoptosis in PC-3 cells. Furthermore, treatment of PC-3 and MCF-7 cells with 5′Bcl-X antisense oligonucleotides sensitized both cell lines to various chemotherapeutic agents and radiation and increased cell death at lower doses of these agents. Finally, it was also reported that recurrent prostate cancer tissue samples expressed higher levels of Bcl-XL than benign prostate tissue. 27 In the present study, PC-3 cells also had the highest levels of BI-1 expression and the majority of clinical specimens (12 of 18) of prostate cancer exhibited increased expression of this gene compared to benign prostate samples and BPH. In addition, the finding that PC-3 cells were more sensitive to BI-1 duplex siRNA-induced cell death, suggests that BI-1 may play a role in the progression of prostate cancer and that cancers that express high levels of BI-1 may benefit from treatment with the duplex siRNA oligonucleotides.
Furthermore, it is a well-known fact that a potential connection exists between the close relative Bcl-2 and hormone-independent prostate cancer. 28,29 Our results presented in this study and the previous results demonstrating in vitro binding of BI-1 with Bcl-XL and Bcl-2 indicate that down-regulation of BI-1 protein in prostate cancer cells could change the balance of BI-1/Bcl-XL/Bcl-2 and Bax proteins and consequently, the cell death pathway can be activated as a Bax-induced apoptotic event. 11 On the other hand, up-regulated BI-1 and Bcl-XL expression in prostate cancer cells (and other cancers) could also lead to an imbalance of BI-1/Bcl-XL/Bcl-2 and Bax proteins, thus inhibiting programmed cell death. In view of the observations reported in this study and of the well-established role of BI-1 as a powerful antiapoptotic factor, further studies are now warranted to address the correlation between BI-1 expression and the various phases of prostate cancer. Additionally, it will be important to understand the details of the signaling pathway regulating BI-1 overexpression in prostate cancer (and other cancers). On the basis of our results, we conclude that down-regulation of BI-1 expression using the novel RNAi technique could serve as an effective approach for the treatment of prostate cancer in the future.
Acknowledgments
We thank S. Zischkau, J. Held, and M. Kickstein for excellent technical assistance.
Footnotes
Address reprint requests to Dr. Peter Burfeind, Institute of Human Genetics, University of Göttingen, Heinrich-Düker Weg 12, 37073 Göttingen, Germany. E-mail: pburfei@gwdg.de.
Supported by a grant from the Deutsche Forschungsgemeinschaft (BU-992/2–2 to P.B.), by the Forschungsförderungsprogramm from the Medical Faculty, University of Göttingen (to P.B.), and by the European Union (E)UROESTROGEN(E)S contract QLK6-CT-200–00565 (to P.T.)
M.G. and P.T. contributed equally to this work.
References
- 1.Greenlee RT, Murray T, Bolden S, Wingo PA: Cancer statistics. CA Cancer J Clin 2000, 50:7-33 [DOI] [PubMed] [Google Scholar]
- 2.Asamoto M, Hokaiwado N, Cho YM, Takahashi S, Ikeda Y, Imaida K, Shirai T: Prostate carcinomas developing in transgenic rats with SV40 T Antigen expression under probasin promoter control are strictly androgen-dependent. Cancer Res 2001, 61:4693-4700 [PubMed] [Google Scholar]
- 3.Welsh JB, Sapinoso LM, Su AI, Kern SG, Wang-Rodriguez J, Moskaluk CA, Frierson HF, Hampton GM: Analysis of gene expression identifies candidate markers and pharmacological targets in prostate cancer. Cancer Res 2001, 61:5974-5978 [PubMed] [Google Scholar]
- 4.Xu LL, Stackhouse BG, Florence K, Zhang W, Shanmugam N, Sesterhenn IA, Zou Z, Srikantan V, Augustus M, Roschke V, Carter K, McLeod DG, Moul JW, Soppett D, Srivastava S: PSGR, a novel prostate-specific gene with homology to a G protein-coupled receptor, is overexpressed in prostate cancer. Cancer Res 2000, 60:6568-6572 [PubMed] [Google Scholar]
- 5.Berges RR, Vucanovic J, Epstein JI, Walsh PC, Isaacs JT: Implication of cell cycle changes during the progression of human prostate cancer. Clin Cancer Res 1995, 1:473-480 [PMC free article] [PubMed] [Google Scholar]
- 6.Tu H, Borkowski A, Jacobs SC, Kyprianou N: Incidence of apoptosis and cell proliferation in prostate cancer: relationship with TGF-β and bcl-2 expression. Int J Cancer 1996, 69:357-363 [DOI] [PubMed] [Google Scholar]
- 7.Bruckheimer EM, Kyprianou N: Apoptosis in prostate carcinogenesis: a growth regulator and a therapeutic target: a review. Cell Tissue Res 2000, 301:153-162 [DOI] [PubMed] [Google Scholar]
- 8.Li X, Marani M, Yu J, Nan B, Roth JA, Kagawa S, Fang B, Denner L, Marcelli M: Adenovirus-mediated Bax overexpression for the induction of therapeutic apoptosis in prostate cancer. Cancer Res 2001, 61:186-191 [PubMed] [Google Scholar]
- 9.Krajewska M, Krajewski S, Epstein JI, Shabaik A, Sauvageot J, Song K, Kitada S, Reed JC: Immunohistochemical analysis of bcl-2, bax, bcl-X, and mcl-1 expression in prostate cancers. Am J Pathol 1996, 148:1567-1576 [PMC free article] [PubMed] [Google Scholar]
- 10.Walter L, Marynen P, Szpirer J, Levan G, Günther E: Identification of a novel conserved human gene, TEGT. Genomics 1995, 28:301-304 [DOI] [PubMed] [Google Scholar]
- 11.Xu Q, Reed JC: Bax inhibitor-1, a mammalian apoptosis suppressor identified by functional screening in yeast. Mol Cell 1998, 1:337-346 [DOI] [PubMed] [Google Scholar]
- 12.Morrison BW, Moorman JR, Kowdley GC, Kobayashi YM, Jones LR, Leder P: Mat-8, a novel phospholemnan-like protein expressed in human breast tumors, induces a chloride conductance in Xenopus oocytes. J Biol Chem 1995, 270:2176-2182 [DOI] [PubMed] [Google Scholar]
- 13.Schweyer S, Hemmerlein B, Radzun HJ, Fayyazi A: Continuous recruitment, co-expression of tumor necrosis factor-α and matrix metalloproteinases, and apoptosis of macrophages in gout tophi. Virchows Archiv 2000, 437:534-539 [DOI] [PubMed] [Google Scholar]
- 14.Van ’t Veer LJ, Dai H, van de Vijver MJ, He YD, Hart AA, Mao M, Peterse HL, van der Kooy K, Marton MJ, Witteveen AT, Schreiber GJ, Kerkhoven RM, Roberts C, Linsley PS, Bernards R, Friend SH: Gene expression profiling predicts clinical outcome of breast cancer. Nature 2002, 415:530-536 [DOI] [PubMed] [Google Scholar]
- 15.Schmits R, Cochlovius B, Treitz G, Regitz E, Ketter R, Preuss KD, Romeike BF, Pfreundschuh M: Analysis of the antibody repertoire of astrocytoma patients against antigens expressed by gliomas. Int J Cancer 2002, 98:73-77 [DOI] [PubMed] [Google Scholar]
- 16.Li XY, Marani M, Mannucci R, Kinsey B, Andriani F, Nicoletti I, Denner L, Marcelli M: Overexpression of Bcl-XL underlies the molecular basis for resistance to staurosporine-induced apoptosis in PC-3 cells. Cancer Res 2001, 61:1699-1706 [PubMed] [Google Scholar]
- 17.Villalva C, Trempat P, Greenland C, Thomas C, Girard JP, Moebius F, Delsol G, Brousset P: Isolation of differentially expressed genes in NPM-ALK-positive anaplastic large cell lymphoma. Br J Haematol 2002, 118:791-780 [DOI] [PubMed] [Google Scholar]
- 18.Hutvagner G, Zamore PD: RNAi: nature abhors a double-strand. Curr Opin Genet Dev 2002, 12:225-232 [DOI] [PubMed] [Google Scholar]
- 19.Elbashir SM, Harborth J, Lendeckel W, Yalcin A, Weber K, Tuschl T: Duplexes of 21-nucleotide RNAs mediate RNA interference in cultured mammalian cells. Nature 2001, 411:494-498 [DOI] [PubMed] [Google Scholar]
- 20.Harborth J, Elbashir SM, Bechert K, Tuschl T, Weber K: Identification of essential genes in cultured mammalian cells using small interfering RNAs. J Cell Sci 2001, 114:4557-4565 [DOI] [PubMed] [Google Scholar]
- 21.Bolduc N, Brisson LF: Antisense down-regulation of NtBI-1 in tobacco BY-2 cells induces accelerated cell death upon carbon starvation. FEBS Lett 2002, 532:111-114 [DOI] [PubMed] [Google Scholar]
- 22.Bolduc N, Ouellett M, Pitre F, Brisson LF: Molecular characterization of two plant BI-1 homologues which suppress Bax-induced apoptosis in human 293 cells. Planta 2003, 216:377-386 [DOI] [PubMed] [Google Scholar]
- 23.Burns TF, El-Deiry WS: Identification of inhibitors of TRAIL-induced death (ITIDs) in the TRAIL-sensitive colon carcinoma cell line SW480 using a genetic approach. J Biol Chem 2001, 276:37879-37886 [DOI] [PubMed] [Google Scholar]
- 24.Marcelli M, Marani M, Li X, Sturgis L, Haidacher SJ, Trial JA, Mannucci R, Nicoletti I, Denner L: Heterogeneous apoptotic responses of prostate cancer cell lines identify an association between sensitivity to staurosporine-induced apoptosis, expression of Bcl-2 family members, and caspase activation. Prostate 2000, 42:260-273 [DOI] [PubMed] [Google Scholar]
- 25.Wang XZ, Beebe JR, Pwiti L, Bielawska A, Smyth MJ: Aberrant sphingolipid signaling is involved in the resistance of prostate cancer cell lines to chemotherapy. Cancer Res 1999, 59:5842-5848 [PubMed] [Google Scholar]
- 26.Chen YR, Zhou G, Tan TH: c-Jun N-terminal kinase mediates apoptotic signaling induced by N-(4-hydroxyphenyl) retinamide. Mol Pharmacol 1999, 56:1271-1279 [DOI] [PubMed] [Google Scholar]
- 27.Mercatante DR, Mohler JL, Kole R: Cellular response to an antisense-mediated shift of Bcl-X pre-mRNA splicing and antineoplastic agents. J Biol Chem , 277:49374-49382 [DOI] [PubMed] [Google Scholar]
- 28.Colombel M, Symmans F, Gil S, O’Toole KM, Chopin D, Benson M, Olsson CA, Korsmeyer S, Buttyan R: Detection of the apoptosis-suppressing oncoprotein bcl-2 in hormone-refractory human prostate cancers. Am J Pathol 1993, 143:390-400 [PMC free article] [PubMed] [Google Scholar]
- 29.McDonnel TJ, Troncoso P, Brisbay SM, Logothesis C, Chang LWK, Hsieh JT, Tu SM, Campbell ML: Expression of the protooncogene bcl-2 in the prostate and its association with emergence of androgen-independent prostate cancer. Cancer Res 1992, 52:6940-6944 [PubMed] [Google Scholar]