

Abstract
Hepatitis C virus (HCV) replication at the cellular level is not fully understood. This study describes an optimized system for quantifying replication of HCV in hepatocytes and in liver tissues. A digital image analysis method was developed to quantify signal intensities of HCV genomic and replicative-intermediate RNAs in infected human liver tissues and to examine their spatial distribution. The average number of viral genomes per productively infected hepatocyte ranged from 7 to 64 RNA molecules. The maximal concentrations of genomic and replicative-intermediate RNAs at the single cell level were 74 and 34 molecules per hepatocyte, respectively. A gradient dispersion of genomes was observed around virus-producing cells, suggesting infection of neighboring hepatocytes as one mechanism of viral spread in the liver. There was no significant difference in total hepatic load of HCV genomes between the post- and nontransplant patients, whereas serum titers in the former group were much higher that that in the latter group. HCV replication varied among infected hepatocytes, occurred in a subset of cells, and proceeded at a low level, confirming one mechanism by which individual hepatocytes are cumulatively able to generate steady state concentrations of millions of HCV genomes per milliliter of blood. Lower viral clearance rates in circulating blood may explain the phenomenon of increased serum titers of viral RNA in posttransplant immunosuppressed patients.
Hepatitis C virus (HCV) infects ∼1.8% of the United States population. Approximately 85% of infected individuals develop long-term viremia. The proliferation of HCV in human liver tissue, combined with the host immune response, leads to various histological outcomes, ranging from minimal liver damage to increasing degrees of hepatic inflammation and fibrosis. Cirrhosis of the liver and hepatocellular carcinoma develop in a significant proportion of chronically infected individuals, making chronic hepatitis C the most common indication for liver transplantation in the United States. 1 Symptomatic differences among infected individuals have generated considerable interest in elucidating the pathogenic mechanisms of HCV disease.
Previous studies have described the levels of HCV genomes in patient sera in cohorts either on therapeutic drug regimens, untreated, or undergoing liver transplantation. As a whole, these studies have failed to find a consistent relationship between serum titers and the degree of hepatic injury. 2-4 The ratios of HCV genome RNA in liver and serum compartments are significantly different among chronically infected patients. 2,5-8 These reports suggest that hepatic injury, serum titers, and intrahepatic viral replication do not display a linear relationship during chronic hepatitis C infection.
HCV is a positive strand RNA virus that is classified as a Hepacivirus within the Flaviviridae family. 9 By analogy with other members of the Flaviviridae, it is assumed that HCV replication requires production of negative strand replicative-intermediate RNA, from which progeny genomic strand RNA is transcribed. The presence of negative strand RNA in cells indicates ongoing HCV replication and synthesis of progeny genomic RNA in these cells. Previously, we and others have used strand-specific in situ hybridization to localize positive strand and negative strand HCV RNAs in infected human liver tissue. 10 The percentage of hepatocytes positive for genomic RNA ranged from 4.8 to 87.6%, 10-12 whereas those positive for replicative-intermediate RNA ranged from 4 to 25%. 10,13 On visualization, the distribution and abundance of genomic RNA appeared to be different from that of replicative-intermediate RNA, suggesting compartmentalization or regulation of replication may occur.
To further characterize HCV replication in liver tissue, we developed an image analysis method to measure quantitative amounts of genomic and replicative-intermediate RNAs in infected liver tissues, and to examine the spatial distribution patterns of the viral RNAs. We further examined the clearance-release ratio of HCV genomes in blood of immunosuppressed and immunocompetent patients.
Materials and Methods
Specimens
Human liver tissues from patients with chronic hepatitis C were stained for HCV genomes and replicative-intermediate RNAs by in situ hybridization, as described previously. 10 Patient A was a liver transplant recipient on the immunosuppressive drug regimen of cyclosporin, prednisone, and azathioprine for 3 years after liver transplantation. Patient A’s 3- and 24-month posttransplant biopsies are designated as specimens A-1 and A-2, respectively. At the time of the biopsies, alanine aminotransferase levels in this patient were 23 U/L and 37 U/L, respectively (normal range, 11 to 39 U/L). Patient B, whose 5- and 24-week posttransplant biopsies are designated as specimen B-1 and B-2, respectively, has been on the same immunosuppressive drugs as patient A for more than 6 years after transplantation. Patient B had elevated alanine aminotransferase levels at each biopsy: 73 U/L and 170 U/L. Specimen C was from a nontransplant patient, whereas specimens D and E were obtained from patients with end-stage hepatitis C at the time of liver transplant. All specimens were genotyped as HCV type 1a, except that A-1 and A-2 were type 1b. Frozen sections (6 μm thick) of liver biopsies or explanted liver tissues were placed on positively charged slides and fixed with formalin. One section of each specimen was probed with anti-sense or sense digoxigenin-labeled riboprobes. The sense and anti-sense riboprobes were synthesized from two clones, containing HCV core and E1 genes, using T7 and Sp6 RNA polymerase, respectively. The chromogen deposition was performed by adding anti-digoxigenin-conjugated alkaline phosphatase and Vector Red. 10 HCV titers in patients’ sera were measured by branched DNA assay version 2.0 (bDNA) (Quantiplex HCV-RNA; Chiron Corp., Emeryville, CA), and published previously. 10 Patient A’s serum drawn at the time of 3 months after transplantation had a viral titer below the detection level of the bDNA assay. Therefore, no estimation of clearance-release ratio was performed on this sample. Cellular integrity was insured by in situ staining for cellular transcripts of the HPRT and β-actin genes. As a positive control cell line, Huh7-hcvAS cells, expressing negative strand RNA of HCV core and E1 genes, were placed on positively charged slides by cytospin and fixed with formalin. HCV RNA was detected with the in situ hybridization method described above. A sensitivity of 7 genome equivalents (Eq) of mRNA per cell was estimated by comparison with an HCV-positive serum sample titered by the bDNA 2.0 assay, and reported in the previous study. 10
Digitized Fluorescent Images
Slides were evaluated with a Zeiss Axiovert microscope using the DeltaVision Image Restoration Microscope System (Applied Precision, Inc., Issaquah, WA) with a ×40/0.85 n.a. or ×63/1.4 n.a. objective lens. Tissues were excited with rhodamine, fluorescein isothiocyanate (FITC), and 4,6-diamidino-2-phenylindole (DAPI) filters at 555 nm (±14 nm), 490 nm (±10 nm), and 360 nm (±20 nm), respectively; images were collected at 617 nm (±37 nm), 528 nm (±19 nm), and 457 nm (±25 nm), respectively. Fluorescent images were collected with a Photometrics PXL-2 monochrome charge-coupled device camera (Photometrics, Tucson, AZ). Linearity for fluorescence on this system was greater than 3 logs (0 to 4095 U). The exposure time used for acquiring fluorescent images was empirically determined based on samples of the strongest and weakest signals. An exposure time was selected such that the signal would fall within the linear range of the digital camera. Rhodamine images were all acquired with the same settings and exposure time. Exposure times were set at 0.1, 1.0, and 1.0 seconds with a ×40 objective lens; and 0.01, 1.0, and 1.0 seconds using a ×63 objective lens, for rhodamine, FITC, and DAPI, respectively. With this exposure time, cytoplasms of cells produced strong autofluorescence using the FITC filter, whereas they illuminated much lower fluorescence using the rhodamine filter. The visualization of nuclei was enhanced using the DAPI filter. Vector Red, the chromagen used for staining HCV RNA-directed positive signals, gave very strong signals using the rhodamine filter. The specificity of Vector Red-directed signal was determined by bright-field microscopy, which helped us exclude fluorescence generated by some pigments in livers. Cellular autofluorescence and various cell sizes in the liver tissue helped differentiate cell types in in situ localization experiments.
From each liver biopsy section, three fields were scanned. Five different cirrhotic nodules were scanned for each explanted liver tissue. Each field was sectionally scanned to yield 20 3-channel z sections, 0.2 μm per section. Tissues of 171 × 171 square μm and 108 × 108 square μm were scanned with ×40 and ×63 objective lenses, respectively, and yielded digital images of 512 × 512 pixels. The resolution for the ×40 and ×63 objective lenses were 0.334 μm and 0.211 μm per pixel, respectively.
The Cyanine 5 (Cy5) filter, instead of DAPI, was used to visualize the nuclei of the Huh7 cell line. Cells were excited with rhodamine, FITC, and Cy5 filters at 555 nm (±14 nm), 490 nm (±10 nm), and 640 nm (±10 nm), respectively; and images were collected at 617 nm (±37 nm), 528 nm (±19 nm), and 685 nm (±20 nm), respectively. Exposure times were set at 0.1, 1.0, and 1.0 seconds with a ×40 objective lens for rhodamine, FITC, and Cy5, respectively.
Calculation of the Adjusted Integrated Intensity
The rhodamine image was used for quantification of RNA signal particles. One z section was chosen for each scanned field. The signal intensity for each pixel position was measured by SoftWoRx 2.5 (Applied Precision, Inc., Issaquah, WA), a Unix-based image analysis software, designed for the output files of the DeltaVision system.
The Examine Data tool’s zoom function was used to facilitate pixel-level visualization of the border of signal particles, and pixel intensity values were used to determine the background threshold. The average intensity of cytoplasmic autofluorescence was also obtained by averaging five random areas totaling more than 6000 pixels, and it was used later to subtract from positive signal intensity values to correct for autofluorescence.
The 2-D Polygon Finder tool of the DeltaVision image analysis software grouped and numbered clusters of signal particles with intensities greater than the positive threshold value using 8-bit connectivity. 14 The program then assigned a number and generated data describing integrated signal intensity, area, and x and y position for each positive signal particle. The average signal intensities per pixel were obtained for each particle by dividing its integrated intensity by its area (in pixels). The average intensity of cytoplasmic autofluorescence was subtracted from the average signal intensity per pixel. This difference (adjusted average intensity per pixel) was multiplied by the original area to obtain an adjusted integrated intensity (AII) for each positive signal particle. The output file of each image was further used to calculate the number of signal particles and average AII for each image.
Conversion of Adjusted Integrated Intensity to Molecules of HCV RNA
To obtain a reference intensity value, estimation of the fluorescent HCV RNA signal was performed on five images of Huh7-hcvAS cells. The sum of AII for each HCV signal particle was obtained the same way as described above. The Cy5 image was exported to the NIH Image program (National Institutes of Health, Bethesda, MD) for calculation of the number of nuclei, in lieu of cell number. The Particle Analysis program calculated the size of individual full or partial nuclei. The sum of the areas of all nuclei for each image divided by the average size of full nuclei gave the number of cells per image. The average of AII per cell for each image was then obtained by dividing the total AII of each image by the number of cells. The grand mean of five means was further calculated along with the SD.
The Adjusted Integrated Intensities (AII) of All Signal Particles in Each Image Were Converted to RNA Molecules
Both tissue sections and Huh7-hcvAS cells, which were used as reference were compressed after dehydration and permanent mounting at the last step of the in situ hybridization procedure and reduced to ∼2 μm in thickness as estimated by the DeltaVision system. One z section image was used as a representative for each field scanned. Each field was generated from liver tissues of an original volume of ∼1.75 × 10⁻⁷ ml (171 × 171 × 6 cubic μm). In adults, the average liver weighs 1400 to 1600 g, 15 with an average volume of 1400 ml. 16-18 HCV RNA molecules per g of liver tissue for each patient was then derived from our first measurement of HCV RNA molecules per ml of liver tissue, assuming the density of an adult liver is 1 g/ml.
Huh7-hcvAS was first reported to contain an average of seven Eq HCV subgenomic negative strand RNAs per cell. Because 1 MEq was defined as the amount of HCV RNA generating light emission equivalent to that generated by 106 copies of HCV RNA reference standard, 19-21 the conversion factor of 1 molecule/Eq was used to convert hepatic HCV RNA measured from Eq to molecules in this study.
Estimation of Adjusted Integrated Intensity of a Single Particle
The DeltaVision 3-D Object Builder tool was invoked to measure and record the integrated intensity, area, and x and y coordinates of each signal polygon, exercised in a similar way as the 2-D Polygon Finder, but objects were measured for a z stack of seven to nine images. Three-dimensional integrated intensity values and locations for each signal particle were obtained from the 3-D Measurements data output file. For three-dimensional analysis of a Huh7-hcvAS z stack of seven images, the average AII per cell was approximately sevenfold (mean, 6.65; range, 5.62 to 8.46) larger than that from one z section measured by two-dimensional analysis, indicating that the signal particles were basically uniform along their z axis. The average AII for each Huh7-hcvAS cell was calculated to be 23.7 × 10⁴ U (SD = 3.1 × 10⁴), accounting for seven molecules per cell. Three-dimensional analysis of human hepatocytes was conducted on z stacks of eight and nine images for genomic and replicative-intermediate RNAs, respectively. The AII of the largest positive signal particle was 2.5 × 10⁶ U, which was approximately eightfold larger than its value in two-dimensional analysis. This demonstrated that, like the cell-line images, the signal particles in images generated from infected human hepatocytes were uniform along their z axis. The largest AII values for genomic and replicative-intermediate RNAs, which were identified and confirmed by examination of the fluorescent images, were 250.8 × 10⁴ and 116.3 × 10⁴ U, respectively.
Gradient Dispersion
Distribution analysis was performed on liver tissue images with a ×63 objective lens. Six images were scanned from tissue sections of specimens A-2 and E, which had been stained for HCV genomic RNA. Each image measured 108 × 108 square μm and had an average of 29.5 hepatocytes. Concentric circles with their centers at the x, y position of the selected large signal particle were drawn and intensity values for HCV genomic RNA signal particles falling inside each circle were summed and graphed as a function of increasing distance. The particle selected for its large intensity was excluded from statistical analyses.
Bitmap Image for Distribution Analysis
Cells exhibited detectable low levels of autofluorescence using the rhodamine filter, whereas sinusoids of liver tissue or fissures generated by the experimental procedure did not fluoresce. A cutoff fluorescent intensity value of 100 was used to differentiate cellular mass (parenchyma) and noncell space (sinusoids or fissures).
Bitmap images were created using the DeltaVision Image Analysis software to collect intensity values for all 262,144 pixels (512 × 512 pixels) of rhodamine-filter images. A cutoff intensity value of 100 was used for cells; anything greater than this threshold was designated with a 1 and anything below 100 was designated with a 0. Data were combined and reduced to a 128 × 128 pixels-cell bitmap by averaging 4 × 4 pixels-cell blocks using Microsoft Excel. The positions with an average value equal to zero corresponded to noncell space, whereas the positions with an average value greater than zero corresponded to the cells.
Clumping Index
Each image was divided into 100 equally sized cells by use of a virtual 10 × 10 grid. The clumping index is C = (m + V/m − 1)/m where m = average number of virions per cell and V is the variance in the number of virions per cell. Clumping indices greater than 1 indicate clumping, whereas indices less than 1 indicate overdispersion. The expected value for a set of randomly distributed points is 1. We calculated mean and lower and upper 2.5% percentiles of C for 1000 simulated images with randomly distributed viral genomes. Each simulated image has sinusoids in the same places and has the same number of viral genomes as the actual image, but differs in that the x, y coordinates for viral genomes are uniformly distributed random numbers.
Statistical Analysis
Statistical analyses in this study were performed using SPSS package (SPSS for Macintosh v. 6.1.1 or v.10; SPSS Inc., Chicago, IL) or Microsoft Excel. The Mann-Whitney U-test was used to assess whether or not AII of all genomic and replicative-intermediate RNA signal particles measured from each specimen were from the same population. The Kruskal-Wallis H-test, an extension of the Mann-Whitney U-test, and the median test were used to evaluate the distribution of AII values of either genomic or replicative-intermediate RNA signal particles among images collected for each specimen.
Results
Quantitative Image Analysis of Hepatic HCV RNA Signals
Figure 1 ▶ illustrates that specimen E stained for HCV genomic RNA (Figure 1, A and C) ▶ , and replicative-intermediate RNA (Figure 1, B and D) ▶ . The fluorescent microscope with DeltaVision imaging system facilitates visualization of cellular and tissue structures, and allows for quantification of HCV RNA directed signal intensities. The positive signals of HCV RNA stained with the in situ hybridization procedure were first determined by bright-field microscopy. 10 Because of the fluorescent nature of positive signals, Vector Red chromagen deposits, the stained tissues were evaluated with fluorescent microscopy. Cells with replicative-intermediate RNA signal usually have a well-defined particle, or group of particles, in their cytoplasm, sometimes located in the perinuclear area. The genomic RNA signal particles showed diverse sizes and scattered distribution patterns among cells. Some cells had very large signal particles located in perinuclear areas, often with additional multiple small particles scattered throughout their cytoplasm. Other cells lacked the large particle and had only smaller particles appearing in the cytoplasm. There were additional cells free of any HCV RNA signal. The various staining patterns of HCV RNA seen in the section may reflect the different stages of HCV replication in hepatocytes. The general distribution patterns of HCV RNAs were similar to our observation with bright-field microscopy in our previous study. 10
Figure 1.
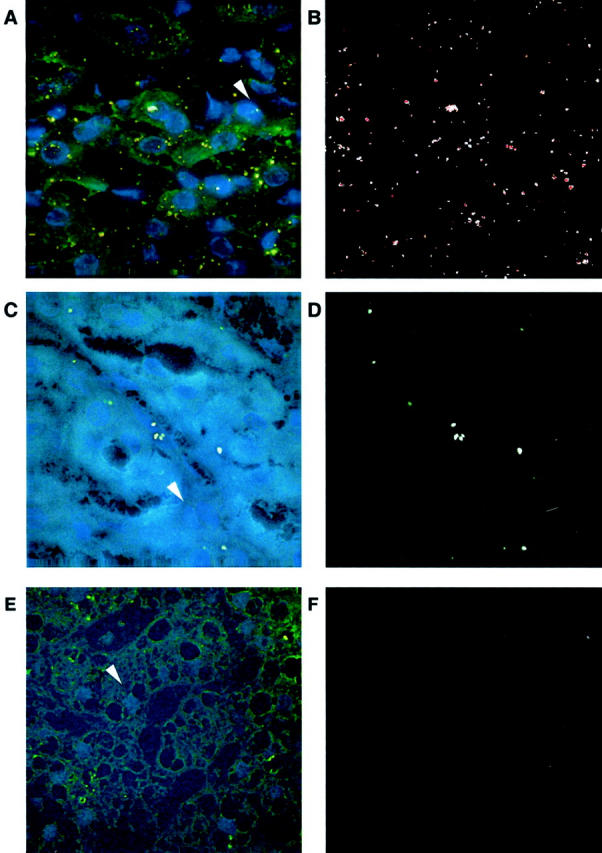
Fluorescent images of infected human liver tissue with HCV RNA signals. A and C: One HCV-infected liver tissue stained for genomic RNA and replicative-intermediate RNA, respectively. E: One non-HCV liver tissue probed with HCV anti-sense riboprobes. The HCV RNA-directed positive signals are shown in B and D. White arrows in A, C, and E point to nuclei of hepatocytes. A, C, and E are the superimposed pictures of DAPI, FITC, and rhodamine images. B, D, and F show rhodamine images of A, C, and E, respectively. Images were collected using the ×63 objective lens.
The autofluorescent nature of liver tissue facilitated cell recognition with fluorescent microscopy. In addition to hepatocytes, HCV genomic RNA was found in fibroblasts or nonhepatocyte cells, although at a low frequency and quantity. Shown in the center of Figure 1C ▶ , positive signals of replicative-intermediate RNA were rarely localized in the sinusoidal cells, suggesting HCV replication may occur in this cell type. The sinusoidal cells contain three functionally different cells including endothelial, stellate, and Kupffer cells. A similar observation has been reported previously, 22 however, the effect of HCV replication in sinusoidal cells on liver damage is unknown.
The rhodamine images were selected for quantification of RNA signal particles because they provided the maximal ratio of chromogen signal to cytoplasmic autofluorescence, shown in Figure 1, C and D ▶ . Quantitative image analysis was performed on liver tissues imaged with a ×40 objective lens, yielding digital images (512 × 512 pixels), measuring 171 × 171 square μm of tissue in size, and containing an average of 61 hepatocytes. Three random images of liver biopsies, specimens A-1, A-2, B-1, B-2, and C, and five random images of five cirrhotic nodules from explanted livers, specimens D and E, were collected. A total of 25 images was scanned from seven specimens stained for HCV genomic RNA, and an equal number of images was collected from the same specimens stained for HCV replicative-intermediate RNA. The adjusted integrated intensities (AII) of positive signal particles for either genomic or replicative-intermediate RNA were calculated by SoftWoRx 2.5 and Microsoft Excel. AII for each signal particle represented approximately the amounts of RNA molecules clustered in one spot. Figure 2 ▶ shows the number of signal particles and their AII values that exhibit a range of 4 logs (1.5 to 5.5).
Figure 2.

Distribution of HCV genomic and negative strand RNA signal intensity values. Adjusted integrated signal intensities (AII) of all genomic or replicative-intermediate RNA signal particles in scanned images of each specimen are listed as log values. The signal particles were collected from three images of specimens As, Bs, and C; and five images of five cirrhotic nodules from specimens D and E, shown on the right.
The number of genomic RNA signal particle ranges from 8 to 367 per image scanned, whereas the number of replicative-intermediate RNA signal particle ranges from 6 to 60. Table 1 ▶ lists the number and average AII of signal particles measured for each specimen after staining for HCV genomic and replicative-intermediate RNAs. For six of the seven specimens, the population of HCV genomes was significantly different from the population of replicative-intermediate RNAs (P value listed in the last column of Table 1 ▶ ), suggesting that the distribution and the abundance of replicative-intermediate RNA is different from those of genomic RNA in infected liver tissues.
Table 1.
Characteristics of Signal Particles Directed from HCV Genomic and Replicative-Intermediate RNAs
| Specimen | Number of images scanned for either HCV RNA | Genomic RNA signal particles | Replicative-intermediate RNA signal particles | P value of Mann-Whitney test | ||||
|---|---|---|---|---|---|---|---|---|
| Number | Mean of AII (U) | Standard deviation | Number | Mean of AII (U) | Standard deviation | |||
| A-1 | 3 | 450 | 2965.95 | 4436.87 | 44 | 1484.14 | 1994.37 | <0.001 |
| A-2 | 3 | 566 | 5467.87 | 7155.36 | 73 | 2966.70 | 3724.79 | <0.001 |
| B-1 | 3 | 120 | 3493.38 | 6783.74 | 56 | 1938.73 | 2397.46 | 0.207 |
| B-2 | 3 | 180 | 9685.28 | 13044.43 | 25 | 6564.73 | 8685.61 | 0.026 |
| C | 3 | 290 | 7352.22 | 8395.40 | 47 | 3585.35 | 4260.91 | <0.001 |
| D | 5 | 794 | 1474.57 | 2455.55 | 135 | 2020.65 | 2546.67 | 0.008 |
| E | 5 | 1041 | 6504.04 | 15492.41 | 136 | 17372.84 | 22042.36 | <0.001 |
Next, we applied nonparametric Kruskal-Wallis H-test and median test to the image data set to determine whether the patterns of HCV genomes or replicative-intermediate RNAs differed among different images scanned from the same case. The results indicated that HCV genome patterns tended to differ when comparing images from one specimen, while patterns of replicative-intermediate RNA tended to be similar among images. For genomic RNA, the P values of Kruskal-Wallis H-test and median test, in parentheses, for the seven specimens, listed in the same order as in Table 1 ▶ , are 0.000 (0.000), 0.005 (0.150), 0.989 (0.688), 0.212 (0.303), 0.000 (0.001), 0.000 (0.000), and 0.019 (0.063). The P values for replicative-intermediate RNA specimens are 0.013 (0.061), 0.229 (0.294), 0.630 (0.838), 0.500 (0.307), 0.298 (0.373), 0.046 (0.141), and 0.000 (0.011). The results demonstrated that AII and the number of signal particles for replicative-intermediate RNA are relatively consistent among different images of each specimen. However, the AII and number of signal particles for genomic RNA appeared to differ among the different images possibly because of varied scatter patterns of HCV genomes throughout the liver.
Estimation of Hepatic Load of HCV RNA Molecules
In previous studies, commercially available kits and in-house quantitative reverse transcriptase-polymerase chain reaction methods have been used to measure levels of HCV genomic RNA in infected liver tissues. Using competitive reverse transcriptase-polymerase chain reaction methods, HCV RNA in liver specimens was estimated to be from 108 to 1011 copies per g of tissue, 6,23 whereas with a newer real-time reverse transcriptase-polymerase chain reaction assay, hepatic loads have a range from 105 to 109 copies per g of liver. 24,25 Using the bDNA technology, hepatic loads ranged from 106 to 109 Eq per g of liver specimen. 5,7,26,27 None of these methods measured HCV RNA within individual hepatocytes, nor did they allow calculation of replicative-intermediate RNA levels.
For quantitative analysis in the present study, we converted HCV RNA-stained signal intensities in liver tissue to RNA molecules by comparing AII values measured from infected liver tissues with that of the control cell line Huh7-hcvAS, which expresses an average of seven molecules per cell (see Materials and Methods). We randomly selected and scanned five images of stained Huh7-hcvAS cells, which showed positive signals of HCV-negative strand RNA. The Cy5 image of Figure 3A ▶ highlighting nuclei of Huh7-hcvAs cells was converted to Figure 3C ▶ by NIH Image software. Using this method, the software further calculated the number of nuclei in each image, in lieu of cell number. The AII of all signal particles in each image were summed with Microsoft Excel. A total of 194 Huh-hcvAS cells and 1259 signal particles were counted. The average AII per cell was determined to be 36.4 × 10³ U (SD = 11.1 × 10³), corresponding to seven molecules per cell of HCV RNA.
Figure 3.

Fluorescent images of cell line Huh7-hcvAS with HCV RNA signals. A: A superimposed picture of Cy5, FITC, and rhodamine images. B: The rhodamine image containing signal particles of HCV subgenomic negative strand RNA. C: Cy5 image converted by the NIH Image program for calculating the number of nuclei.
Table 2 ▶ lists the average total AII of all signal particles for genomic or replicative-intermediate RNA per image and average RNA molecules per g of infected liver tissue. Using Excel, an average total AII was calculated by dividing the number of images scanned for each specimen from the sums of AII of all positive signal particles in three or five images scanned. Using Huh7-hcvAS as a reference, the AII value was converted to the number of RNA molecules. In the seven cases studied, our estimation of the total HCV genomic RNA in the liver ranged from 1.3 × 10⁸ to 1.3 × 10⁹ RNA molecules per g, which falls between the ranges reported in previous studies. By extrapolation, HCV replicative-intermediate RNA levels were estimated to be 2.1 × 10⁷ to 4.4 × 10⁸ RNA molecules per g of liver tissue. The ratio of genomic RNA to replicative-intermediate RNA ranged from 3 to 20 in the seven cases studied, consistent with quantitative reports for flavivirus and HCV using other methods. 28,29
Table 2.
Abundance of HCV Genomic and Replicative-Intermediate RNA Molecules in Infected Liver Tissues
| Specimen | Average AII of total HCV RNA signals particles per image | Average HCV RNA molecules per g of liver tissue* | Ratio | ||
|---|---|---|---|---|---|
| Genomic | Replicative-intermediate | Genomic | Replicative-intermediate | ||
| A-1 | 44.5 × 10⁴ | 2.2 × 10⁴ | 4.2 × 10⁸ | 2.1 × 10⁷ | 20 |
| A-2 | 103.2 × 10⁴ | 7.2 × 10⁴ | 9.7 × 10⁸ | 6.8 × 10⁷ | 14 |
| B-1 | 14.0 × 10⁴ | 3.6 × 10⁴ | 1.3 × 10⁸ | 3.4 × 10⁷ | 4 |
| B-2 | 58.1 × 10⁴ | 5.5 × 10⁴ | 5.4 × 10⁸ | 5.1 × 10⁷ | 11 |
| C | 71.1 × 10⁴ | 5.6 × 10⁴ | 6.7 × 10⁸ | 5.3 × 10⁷ | 13 |
| D | 23.4 × 10⁴ | 5.5 × 10⁴ | 2.2 × 10⁸ | 5.1 × 10⁷ | 4 |
| E | 135.4 × 10⁴ | 47.3 × 10⁴ | 1.3 × 10⁹ | 4.4 × 10⁸ | 3 |
*HCV RNA molecules per g of liver tissue for each patient is derived from our measurement of HCV RNA molecules per ml of liver tissue, assuming the density of adult liver is 1 g/ml.
The total hepatic load for the HCV genome ranged from 1.8 × 10¹¹ to 1.8 × 10¹² RNA molecules among the cases studied. The estimated percentage of cells containing active HCV infection (ie, replicative-intermediate RNA) was 6, 11, 4, 12, 21, 21, and 25 for specimens A-1, A-2, B-1, B-2, C, D, and E, respectively. 10 The number of hepatocytes actively producing HCV genomes was obtained by multiplying 2 × 10¹¹ hepatocytes per liver by the percentage of cells positive for replicative-intermediate RNA, listed in column 3 of Table 3 ▶ . 30 The calculation of average viral genomes per cell was based on the assumption that the majority of genomic RNA in the liver is generated from cells harboring viral replication, and that the number of viral genomes spreading to adjacent cells or reinfecting liver from blood is too small to be counted. The average number of HCV genomes per cell, obtained by dividing the hepatic load of HCV genomes by the number of virus-producing cells, ranged from 7 to 64 RNA molecules in the samples studied (Table 3) ▶ .
Table 3.
Average Number of HCV Genome Molecules Produced per Actively Infected Cell
| Specimen | Number of HCV genome molecules estimated for the entire liver (VL) | Number of hepatocytes actively producing HCV genomes (I)* | Average molecules of HCV genomes produced per hepatocyte with active viral replication (P)† |
|---|---|---|---|
| A-1 | 5.9 × 10¹¹ | 1.2 × 10¹⁰ | 49 |
| A-2 | 1.4 × 10¹² | 2.2 × 10¹⁰ | 64 |
| B-1 | 1.8 × 10¹¹ | 8.0 × 10⁹ | 23 |
| B-2 | 7.6 × 10¹¹ | 2.4 × 10¹⁰ | 32 |
| C | 9.4 × 10¹¹ | 4.2 × 10¹⁰ | 22 |
| D | 3.1 × 10¹¹ | 4.2 × 10¹⁰ | 7 |
| E | 1.8 × 10¹² | 5.0 × 10¹⁰ | 36 |
*The number of hepatocytes actively producing HCV genomes is obtained by multiplying 2 × 10¹¹ hepatocytes per liver by the percentage of cells positive for replicative-intermediate RNA.
†The calculation of P is based on the assumption that the majority of HCV genomes found in the liver are generated from virus-producing cell, and that the number of viral genomes spreading to adjacent cells or reinfecting liver from blood is too small to be counted.
Maximal HCV Genomic and Replicative-Intermediate RNA Molecules Detected at the Single-Cell Level
Because the gross amounts of HCV genomic RNA estimated by our image analysis method were validated by other quantification methods, we further calculated the largest amounts of genomic and replicative-intermediate RNA seen in a single hepatocyte. The total intensity of the entire signal particle was measured, using a quantitative three-dimensional image analysis tool. The signal intensities were converted to RNA molecules using Huh7-hcvAS as a reference. The largest RNA signals detected were 74 genomic RNA molecules and 34 replicative-intermediate RNA molecules within one cell. Viral RNA copy numbers estimated here are presumably close to the maximal amount of each strand of HCV RNA produced in a single human hepatocyte in vivo.
Spread of HCV among Hepatocytes
Mechanisms of transmissions of HCV virions among hepatocytes in liver tissue remain elusive. We hypothesized that one mechanism of transmission may be direct spread to neighboring hepatocytes, from a region of high concentration to a region of low concentration. To test this hypothesis, we selected six digital images of HCV genome signals for spatial analyses in which one hepatocyte had massive HCV genome concentrations near the center of the image. Four images, images 1 to 4 in Table 4 ▶ , were scanned from specimen E and two images (images 5 and 6) were collected from specimen A-2. Intensity values of signal particles of HCV genomes were found to decrease as a function of distance from a centrally located particle in 2 (images 1 and 5) of six images analyzed (P values <0.05). Figure 4 ▶ shows a concentration gradient of HCV genome signal in one such image. This observation suggests that HCV infection may spread outward from a dense focus under certain situations (discussed below).
Table 4.
Aggregation Statistics for HCV Genomes in Images
| Image | Number of signal particles for genomic RNA | Clumping Index | Aggregation indices for 1000 random data sets | ||||
|---|---|---|---|---|---|---|---|
| Including the area covered by sinusoids in images | Excluding the area covered by sinusoids in images | Percentage of image covered by sinusoids | |||||
| Mean | 95% range | Mean | 95% range | ||||
| 1 | 158 | 1.61 | 1.00 | [0.84, 1.19]* | 1.15 | [0.96, 1.38] | 32 |
| 2 | 216 | 1.14 | 1.00 | [0.89, 1.13] | 1.15 | [1.01, 1.32] | 35 |
| 3 | 137 | 1.58 | 1.00 | [0.80, 1.21] | 1.20 | [0.99, 1.44] | 38 |
| 4 | 187 | 1.11 | 1.00 | [0.86, 1.16] | 1.15 | [1.00, 1.33] | 30 |
| 5 | 55 | 2.01 | 0.99 | [0.54, 1.54] | 1.46 | [0.88, 2.21] | 66 |
| 6 | 80 | 1.42 | 1.00 | [0.70, 1.36] | 1.50 | [1.01, 2.09] | 69 |
*Those observed values typed in bold fall outside of the 95% range of randomly distributed points.
Figure 4.

Gradient analysis. HCV genome density decreases as a function of distance from a single, very bright signal particle. The density of AII values (sum of AII values divided by area) was determined for a series of concentric circles drawn around the central particle. The inner and outer radii of these circles (0 to 25, 25 to 35, 35 to 43, 43 to 50, 50 to 56, and 56 to 78 μm, respectively) were set so that each ring would cover an area of ∼1963 square μm. The x axis gives the mean distance to the center for each ring. The y axis gives the sum of AII intensities within a ring divided by the area of the ring.
The six images were also analyzed as to whether the signal particles were randomly distributed or clumped. Bitmaps for each image were created to delineate cells from noncell space. Random numbers for clumping index analyses were generated with x, y positions either in the entire image or restricted to a nonsinusoid location. To quantify the degree of spatial aggregation for genomic RNA directed signal particles, a 10 × 10-square grid was superimposed over the six liver images. Then Lloyd’s index of patchiness was calculated from the mean and variance in the number of RNA signal particles per square.
Comparison of Lloyd’s index to 95% confidence intervals for randomly distributed points indicated that viral RNA signals were significantly aggregated in five of six images (Table 4) ▶ . It was suggested earlier that HCV genomic RNA was preferentially localized in cells over noncell space (Figure 1) ▶ . To determine whether exclusion from sinusoids accounts for this aggregation pattern, 1000 Monte Carlo simulations were performed to calculate what the mean and 95% range for Lloyd’s index would be if genomic RNA was distributed randomly over cells, but excluded from noncell space. Two images retained their uneven distribution when noncell space was excluded, listed in Table 4 ▶ . This result indicated that even though HCV RNA is preferentially localized in cells, there is an uneven amount of HCV genomes among cells, presumably because of the presence or absence of viral replication.
Viral Clearance-Release Ratio in Immunocompetent versus Immunosuppressed Patients
We assume that the amount of viruses released from the liver into blood is equal to the amount of viruses cleared from blood in patients with steady viral loads; ie, rVL = cVB, where VL is the total number of free virions in the liver, r is the rate at which virions in the liver are released into blood, VB is the total number of viral genomes in blood, and c is the rate at which virus is cleared from plasma. We exploited this relationship to derive an estimate for the clearance-release ratio, C = c/r = VL/VB from our data on total viral load in circulating blood and intrahepatic viral load. Estimates for the clearance-release ratio, C, ranged from 0.1 to 14.0 (Table 5) ▶ , with the mean for transplant patients being 0.17 and the mean for nontransplant patients being 7.57. These data suggest transplant patients differ from nontransplant patients by having lower clearance rates of virus from blood or higher release rates of virus from liver into blood. There was no significant difference in total hepatic load of HCV genomes or replicative intermediate RNA between the post- and nontransplant patients, listed in Tables 2 and 5 ▶ . This work suggests that lower clearance rates, or higher release rates into blood, rather than higher production rates, are a possible explanation for high serum titers observed in posttransplant populations.
Table 5.
Clearance-Release Ratio of HCV Genomes in Blood of Immunocompetent and Immunosuppressed Patients
| Specimen | Specimen type | HCV genomes in the entire liver (molecules) (VL) | HCV genomes per ml of serum (molecules)* | Total HCV genomes in blood (molecules) (VB)† | Clearance-release ratio (C) C = VL/VB |
|---|---|---|---|---|---|
| A-2 | Posttransplant biopsy (24 months) | 1.4 × 10¹² | 5.0 × 10⁸ | 6.7 × 10¹² | 0.2 |
| B-1 | Posttransplant biopsy (5 weeks) | 1.8 × 10¹¹ | 1.0 × 10⁸ | 1.3 × 10¹² | 0.1 |
| B-2 | Posttransplant biopsy (24 weeks) | 7.6 × 10¹¹ | 2.9 × 10⁸ | 3.9 × 10¹² | 0.2 |
| C | Nontransplant biopsy | 9.4 × 10¹¹ | 3.7 × 10⁷ | 4.9 × 10¹¹ | 1.9 |
| D | Nontransplant cirrhotic liver | 3.1 × 10¹¹ | 3.4 × 10⁶ | 4.5 × 10¹⁰ | 6.8 |
| E | Nontransplant, cirrhotic liver | 1.8 × 10¹² | 9.6 × 10⁶ | 1.3 × 10¹¹ | 14.0 |
*The serum titer was first reported as genome equivalent per ml. The published conversion factor of 1 molecule/Eq was used to convert HCV RNA genome equivalent to molecule. 19-21
†Multiplication of HCV serum titer by 13,360 ml gives the total molecules of HCV genomes in the blood for the entire body.
Discussion
HCV virion infection of hepatocytes is anticipated to be a multiphase process that includes virus entry, transcription of genomic RNA, translation of polyprotein synthesis of negative strand RNA, followed by production of progeny genomic RNA, and finally, assembly and secretion of virions. 31 The detailed mechanism of HCV-positive and -negative strand RNA synthesis in hepatocytes remains elusive because no in vitro culturing system is available to study the HCV life cycle. The viral replication of other members in the Flaviviridae family, pestiviruses and flaviviruses, is generally assumed to proceed in the following manner: positive strand RNA molecules are synthesized from genome-length negative strand templates by a semiconservative mechanism involving replicative-intermediates and replicative forms. Replicative forms are defined as double-stranded RNA molecules; replicative-intermediate forms contain the double-stranded region as well as nascent single-stranded RNA molecules. Both replicative form and replicative-intermediate RNAs are detected in cells infected with bovine viral diarrhea virus, a pestivirus, 32 and Kunjin virus, a flavivirus. 33 The ratio of replicative-intermediate and replicative form fluctuates from 4:1 to 1:2 for the Kunjin virus. 33 Replicative form RNA is suggested not to be present, or to be present at a minor quantity, in HCV-infected chronic liver tissues. 34 Because our in situ hybridization procedure does not include a denaturing step with high temperature, it is presumed that labeled riboprobes hybridize with single-strand negative strand RNA molecules or single-strand regions of the replicative-intermediate complex. The replicative-intermediate RNA may be found at the time of synthesis of viral-negative and -positive strand RNA, whereas the genome RNA can be detected during the entire time of viral infection, which may explain why fewer cells are found containing replicative-intermediate RNA than genomic RNA in our studies. The AII values of replicative-intermediate RNA were generally lower than those of genomic RNA, suggesting the sensitivity of detecting replicative-intermediate RNA (Figure 2) ▶ is approximately the same or better than that of detecting genomic RNA.
After in situ hybridization and digital imaging, statistical analyses indicated the population of genomic RNAs was significantly different from that of replicative-intermediate RNAs in six of seven specimens examined. Staining patterns for genomic RNA varied more than for replicative-intermediate RNA. Hepatocytes that detected positive for replicative-intermediate RNA harbor viral replication (synthesis of positive strand RNA from the negative strand RNA), and usually have one dense signal particle suggesting the synthesis of RNA is clustered within the cytoplasm. In contrast, the genomic RNA signal particles showed diverse sizes and scattered distribution patterns among cells. Some cells had very large signal particles located in perinuclear areas, whereas other cells without the large particle had many smaller particles appearing in the cytoplasm. We postulate that cells containing a single bright genomic signal particle may be at the peak of transcription of genomic RNA, whereas those with scattered multiple signal particles may be at some intermediate stage of viral replication.
Our direct quantification of viral genomes produced per cell in chronically infected liver indicates that HCV replication occurs in hepatocytes at a low level. It is likely that on average no more than 100 HCV genomic RNA molecules are synthesized in the individual hepatocyte of chronically infected livers at any time of disease progression. Neumann and colleagues 30 estimate an average of 1.3 × 10¹² HCV virions produced per day in each infected patient. They deduced an average of 10 to 100 viral copies per cell with the assumption that 10% of hepatocytes were actively producing HCV virions. Our previous study lists the percentage of hepatocytes positive for replicative-intermediate RNA ranging from 4 to 25, with an average of 14, whereas the mean percentage of hepatocytes containing HCV genomic RNA was 56 (range, 31 to 85). 10 The biggest HCV genome signal particle and HCV replicative-intermediate RNA signal particle in a single cell found in our tested specimens were 74 and 34 RNA molecules, respectively. By an alternative method, the total hepatic load of HCV genomes estimated in this work divided by the number of actively infected cells gives a range from 7 to 64 RNA molecules per cell, an average of 33 RNA molecules per cell. The concurring estimations from two entirely different methods lead us to conclude that HCV replication occurs in a subset of hepatocytes and proceeds at a low level during chronic infection.
It has been reported that generally serum RNA titers are at least 10-fold higher in posttransplant patients than nontransplant patients presumably because of posttransplant patients undergoing immunosuppressive therapy. 35,36 The immunosuppressive medicines generally act on T cells to reduce graft rejection. Higher serum titers may be a result of higher viral production in livers, higher liver release rate, r, (releasing from liver to blood) or longer half-life of virions in the blood (smaller clearance rate, c); ie, VB = rVL/c. If the suppressed T cell function promotes viral production and increases intrahepatic viral load (VL), a larger number of HCV is released to circulating blood resulting in a higher serum titer (VB). Our study and others 37 demonstrate that intrahepatic HCV loads, VL, are not different between immunosuppressed and immunocompetent patients. Alanine aminotransferase levels are positively correlated with the half-life of infected cell death. 30 Alanine aminotransferase levels vary in both immunosuppressed and immunocompetent patients, suggesting the rates of infected cell death and virion release (r) from infected hepatocytes are not different for these two groups of patients. Therefore, lower clearance rate of virions from blood (c) is the proposed mechanism to explain higher viral titers in this population. Studies of a larger number of specimens, however, are necessary to test this hypothesis.
The mechanism of HCV virion clearance in blood and the reason for varied clearance rates among infected patients remain elusive. Primate erythrocyte complement receptor type 1 (CR1) plays an essential role in complement (C3b)-associated immune complex clearance by transporting complexes to macrophages in the liver and/or spleen. 38 HCV immune complexes, which contain hepatitis C antibodies (IgG or IgM), hepatitis C antigen, and complement (C3), have been located within glomeruli of infected patients’ kidneys with membranoproliferative glomerulonephritis. 39 HCV-infected patients have lower erythrocyte CR1 and higher immune complex levels than noninfected persons do. The erythrocyte CR1 levels in HCV infection are lower in patients with severe liver inflammation, cirrhosis, or hepatocellular carcinoma than in those with mild inflammation. 40 It has been proposed that failure of hepatic clearance accounts for the occurrence of cryoglobulinemia, the presence of circulating immune complexes that precipitate from serum at temperatures below 37°C. 41 These reports indicate that variation of innate clearance abilities among individuals may explain why some patients develop extrahepatic manifestations. 42,43
We postulated that the massive genome signal in some cells results from active HCV replication occurring in those cells. Then we tested a hypothesis of gradient dispersion of genome signals starting from an HCV active-replication hepatocyte. Two of six images exhibited gradient decreases in genome signal along with the distance of center signal particles, suggesting that in these cases infection is likely spreading outward from the dense focus. The other four images did not show any pattern of gradient dispersion. We hypothesize that other factors, such as cytokine or saturation of viral receptors, might interfere with the transmission of HCV from one cell to another cell in many cases. The lack of a typical concentration gradient in the four other images listed above may be because of those interfering factors. Although we cannot point to which factor or the mechanism of interference, clumping analysis does provide new insights into HCV genome distribution patterns in infected liver.
If active viral replication occurs only in a subset of hepatocytes at a particular time point, the corresponding distribution of viral RNA signal would appear clustered in infected liver sections. The aforementioned six images were analyzed in terms of clumping degree to test whether the signal particles are randomly distributed or clustered. The genome signal particles in all images, except image 4, was located preferentially in cells over noncell space, as was expected and shown in Figure 1 ▶ . Two of these images (images 1 and 3) remained significantly clumped after exclusion of noncell space, indicating some aggregation of viral genomes is independent of noncell space; ie, possibly relates to parenchymal spread of virus. The absence of aggregation after exclusion of sinusoid space in the remaining four images may reflect tissue saturation with HCV; ie, saturation of hepatocytes’ susceptibility to infection, unavailability of HCV receptors such as low-density lipoprotein, 44 and/or CD81, 45 resistance to superinfection, or more likely, a combination of these and other mechanisms.
In situ hybridization in combination with digital image analysis provides both in situ localization and quantitative evaluation. 46 Various staining techniques have been used for quantification of cellular RNA and viral RNA in tissue specimens. 47,48 Haase and colleagues 49 reported the measurement of HIV genomes in lymphoid tissues by counting silver grains after hybridizing HIV genomes with 35S-labeled anti-sense riboprobes and autoradiographic exposure. Chemiluminescent in situ hybridization method was demonstrated measuring cytomegalovirus and human papillomavirus genomes in tissue specimens. 50,51 The choices for staining and quantification methods were dependent on the availability of instrument and expertise. Vector Red chromogen, a substrate of alkaline phosphatase, can be visualized by both bright-field microscopy and fluorescence microscopy. The absorbance of Vector Red exhibiting a linear relation to the concentration of antibody-conjugated alkaline phosphatase demonstrates that this immunostaining procedure is excellent for microscopic quantification. 52 This study also shows that Vector Red substrate deposits in liver tissues have excellent signal-to-noise ratio using rhodamine filter described above. Quantitative fluorescent intensity of Vector Red chromogen is demonstrated to be a suitable, stable method for measuring RNA molecules of interest in liver tissue specimens.
In conclusion, the present study describes an optimized system for quantifying HCV replication in tissue, and expands our understanding of HCV replication in human liver tissue. HCV replication varies among infected hepatocytes, occurs in a subset of cells containing HCV genomes, and proceeds at a low level, which is cumulatively able to generate more than a million copies of genomes per ml of blood. The low-level replication we observed may be an adaptive strategy of the virus to evade immune surveillance and maintain the characteristically chronic HCV infection. 53 The phenomenon of gradient dispersion around virus-producing cells and higher local clumping indices support the notion that some newly made HCV virions infect neighboring cells instead of entering the blood stream. The serum titer results from an equilibrium between viral production in liver and host capability to clear virions. The varied clearance rates among infected individuals may contribute to extrahepatic manifestations in infected patients, the efficacy of interferon treatment, and the reinfection of HCV in grafted livers after liver transplantation.
Acknowledgments
We thank Paul Goodwin for the initial quantification of fluorescent images; our clinical laboratory staff for performing quantitative assays; Drs. Keane Lai and Margaret Shuhart for their critical review; and Dr. Anne Larson, Aimee Forquera, Paula Cox, Marcia Bentz, Dr. Christian S. Kuhr, and Hao Do for their assistance with the work and the completion of this manuscript.
Footnotes
Address reprint requests to David R. Gretch, M.D., Ph.D., Harborview Medical Center, Box 359690, 325 Ninth Ave., Rm 706, Seattle, WA 98104-2499. E-mail: gretch@u.washington.edu.
Supported by the National Institutes of Health (R29AI-39049 and National Institute of Diabetes and Digestive and Kidney Disease R01 DK-56388).
References
- 1.Alter MJ, Kruszon-Moran D, Nainan OV, McQuillan GM, Gao F, Moyer LA, Kaslow RA, Margolis HS: The prevalence of hepatitis C virus infection in the United States, 1988 through 1994. N Engl J Med 1999, 341:556-562 [DOI] [PubMed] [Google Scholar]
- 2.De Moliner L, Pontisso P, De Salvo GL, Cavalletto L, Chemello L, Alberti A: Serum and liver HCV RNA levels in patients with chronic hepatitis C: correlation with clinical and histological features. Gut 1998, 42:856-860 [DOI] [PMC free article] [PubMed] [Google Scholar]
- 3.Negro F, Krawczynski K, Quadri R, Rubbia Brandt L, Mondelli M, Zarski JP, Hadengue A: Detection of genomic- and minus-strand of hepatitis C virus RNA in the liver of chronic hepatitis C patients by strand-specific semiquantitative reverse-transcriptase polymerase chain reaction. Hepatology 1999, 29:536-542 [DOI] [PubMed] [Google Scholar]
- 4.Puoti C, Magrini A, Stati T, Rigato P, Montagnese F, Rossi P, Aldegheri L, Resta S: Clinical, histological, and virological features of hepatitis C virus carriers with persistently normal or abnormal alanine transaminase levels. Hepatology 1997, 26:1393-1398 [DOI] [PubMed] [Google Scholar]
- 5.Idrovo V, Dailey PJ, Jeffers LJ, Coelho-Little E, Bernstein D, Bartholomew M, Alvarez L, Urdea MS, Collins ML, Schiff ER: Hepatitis C virus RNA quantification in right and left lobes of the liver in patients with chronic hepatitis C. J Viral Hepatol 1996, 3:239-246 [DOI] [PubMed] [Google Scholar]
- 6.Nakagawa H, Shimomura H, Hasui T, Tsuji H, Tsuji T: Quantitative detection of hepatitis C virus genome in liver tissue and circulation by competitive reverse transcription-polymerase chain reaction. Dig Dis Sci 1994, 39:225-233 [DOI] [PubMed] [Google Scholar]
- 7.Terrault NA, Dailey PJ, Ferrell L, Collins ML, Wilber JC, Urdea MS, Bhandari BN, Wright TL: Hepatitis C virus: quantitation and distribution in liver. J Med Virol 1997, 51:217-224 [PubMed] [Google Scholar]
- 8.Fan X, Solomon H, Poulos JE, Neuschwander-Tetri BA, Di Bisceglie AM: Comparison of genetic heterogeneity of hepatitis C viral RNA in liver tissue and serum. Am J Gastroenterol 1999, 94:1347-1354 [DOI] [PubMed] [Google Scholar]
- 9.Houghton M: Hepatitis C viruses. Fields BN Knipe DM Howley PM eds. Fields Virology, ed 3 1996:pp 1035-1068 Lippincott-Raven, Philadelphia
- 10.Chang M, Marquardt AP, Wood BL, Williams O, Cotler SJ, Taylor SL, Carithers RL, Jr, Gretch DR: In situ distribution of hepatitis C virus replicative-intermediate RNA in hepatic tissue and its correlation with liver disease. J Virol 2000, 74:944-955 [DOI] [PMC free article] [PubMed] [Google Scholar]
- 11.Agnello V, Abel G, Knight GB, Muchmore E: Detection of widespread hepatocyte infection in chronic hepatitis C. Hepatology 1998, 28:573-584 [DOI] [PubMed] [Google Scholar]
- 12.Gosalvez J, Rodriguez Inigo E, Ramiro Diaz JL, Bartolome J, Tomas JF, Oliva H, Carreno V: Relative quantification and mapping of hepatitis C virus by in situ hybridization and digital image analysis. Hepatology 1998, 27:1428-1434 [DOI] [PubMed] [Google Scholar]
- 13.Gowans EJ: Distribution of markers of hepatitis C virus infection throughout the body. Semin Liver Dis 2000, 20:85-102 [DOI] [PubMed] [Google Scholar]
- 14.Castleman KR: Image segmentation. Digital Image Processing. 1979:pp 299-320 Prentice-Hall, Englewood Cliffs
- 15.Katsumi M: Gitnick G eds. Principles and Practice of Gastroenterology and Hepatology. 1994:p 680 Appleton & Lange, Norwalk
- 16.Leung NW, Farrant P, Peters TJ: Liver volume measurement by ultrasonography in normal subjects and alcoholic patients. J Hepatol 1986, 2:157-164 [DOI] [PubMed] [Google Scholar]
- 17.Petersen KF, Price T, Cline GW, Rothman DL, Shulman GI: Contribution of net hepatic glycogenolysis to glucose production during the early postprandial period. Am J Physiol 1996, 270:E186-E191 [DOI] [PubMed] [Google Scholar]
- 18.Hausken T, Leotta DF, Helton S, Kowdley KV, Goldman B, Vaezy S, Bolson EL, Sheehan FH, Martin RW: Estimation of the human liver volume and configuration using three-dimensional ultrasonography: effect of a high-caloric liquid meal. Ultrasound Med Biol 1998, 24:1357-1367 [DOI] [PubMed] [Google Scholar]
- 19.Collins ML, Zayati C, Detmer JJ, Daly B, Kolberg JA, Cha TA, Irvine BD, Tucker J, Urdea MS: Preparation and characterization of RNA standards for use in quantitative branched DNA hybridization assays. Anal Biochem 1995, 226:120-129 [DOI] [PubMed] [Google Scholar]
- 20.Detmer J, Lagier R, Flynn J, Zayati C, Kolberg J, Collins M, Urdea M, Sanchez-Pescador R: Accurate quantification of hepatitis C virus (HCV) RNA from all HCV genotypes by using branched-DNA technology. J Clin Microbiol 1996, 34:901-907 [DOI] [PMC free article] [PubMed] [Google Scholar]
- 21.Urdea MS, Wuestehube LJ, Laurenson PM, Wilber JC: Hepatitis C—diagnosis and monitoring. Clin Chem 1997, 43:1507-1511 [PubMed] [Google Scholar]
- 22.Nouri Aria KT, Sallie R, Sangar D, Alexander GJ, Smith H, Byrne J, Portmann B, Eddleston AL, Williams R: Detection of genomic and intermediate replicative strands of hepatitis C virus in liver tissue by in situ hybridization. J Clin Invest 1993, 91:2226-2234 [DOI] [PMC free article] [PubMed] [Google Scholar]
- 23.Sugano M, Hayashi Y, Yoon S, Kinoshita M, Ninomiya T, Ohta K, Itoh H, Kasuga M: Quantitation of hepatitis C viral RNA in liver and serum samples using competitive polymerase chain reaction. J Clin Pathol 1995, 48:820-825 [DOI] [PMC free article] [PubMed] [Google Scholar]
- 24.White PA, Pan Y, Freeman AJ, Marinos G, French RA, Lloyd AR, Rawlinson WD: Quantification of hepatitis C virus in human liver and serum samples by using LightCycler reverse transcriptase PCR. J Clin Microbiol 2002, 40:4346-4348 [DOI] [PMC free article] [PubMed] [Google Scholar]
- 25.Freeman AJ, Pan Y, Harvey CE, Post JJ, Law MG, White PA, Rawlinson WD, Lloyd AR, Marinos G, French RA: The presence of an intrahepatic cytotoxic T lymphocyte response is associated with low viral load in patients with chronic hepatitis C virus infection. J Hepatol 2003, 38:349-356 [DOI] [PubMed] [Google Scholar]
- 26.Pessoa MG, Terrault NA, Detmer J, Kolberg J, Collins M, Hassoba HM, Wright TL: Quantitation of hepatitis G and C viruses in the liver: evidence that hepatitis G virus is not hepatotropic. Hepatology 1998, 27:877-880 [DOI] [PubMed] [Google Scholar]
- 27.Coelho-Little E, Jeffers LJ, Bartholomew M, Reddy KR, Schiff ER, Dailey PJ: Correlation of HCV-RNA levels in serum and liver of patients with chronic hepatitis C. J Hepatol 1995, 22:248-249 [DOI] [PubMed] [Google Scholar]
- 28.Rice C: Flaviviridae: the viruses and their replication. Fields BN Knipe DM Howley PM eds. Fields Virology, ed 3 1996:pp 931-959 Lippincott-Raven, Philadelphia
- 29.Negro F, Giostra E, Krawczynski K, Quadri R, Rubbia Brandt L, Mentha G, Colucci G, Perrin L, Hadengue A: Detection of intrahepatic hepatitis C virus replication by strand-specific semiquantitative RT-PCR: preliminary application to the liver transplantation model. J Hepatol 1998, 29:1-11 [DOI] [PubMed] [Google Scholar]
- 30.Neumann AU, Lam NP, Dahari H, Gretch DR, Wiley TE, Layden TJ, Perelson AS: Hepatitis C viral dynamics in vivo and the antiviral efficacy of interferon-alpha therapy. Science 1998, 282:103-107 [DOI] [PubMed] [Google Scholar]
- 31.Guidotti LG, Chisari FV: Noncytolytic control of viral infections by the innate and adaptive immune response. Annu Rev Immunol 2001, 19:65-91 [DOI] [PubMed] [Google Scholar]
- 32.Gong Y, Trowbridge R, Macnaughton TB, Westaway EG, Shannon AD, Gowans EJ: Characterization of RNA synthesis during a one-step growth curve and of the replication mechanism of bovine viral diarrhoea virus. J Gen Virol 1996, 77:2729-2736 [DOI] [PubMed] [Google Scholar]
- 33.Chu PW, Westaway EG: Replication strategy of Kunjin virus: evidence for recycling role of replicative form RNA as template in semiconservative and asymmetric replication. Virology 1985, 140:68-79 [DOI] [PubMed] [Google Scholar]
- 34.Blight K, Trowbridge R, Gowans EJ: Absence of double-stranded replicative forms of HCV RNA in liver tissue from chronically infected patients. J Viral Hepatol 1996, 3:29-36 [DOI] [PubMed] [Google Scholar]
- 35.Gretch DR, Bacchi CE, Corey L, dela Rosa C, Lesniewski RR, Kowdley K, Gown A, Frank I, Perkins JD, Carithers RL, Jr: Persistent hepatitis C virus infection after liver transplantation: clinical and virological features. Hepatology 1995, 22:1-9 [PubMed] [Google Scholar]
- 36.Sreekumar R, Gonzalez-Koch A, Maor-Kendler Y, Batts K, Moreno-Luna L, Poterucha J, Burgart L, Wiesner R, Kremers W, Rosen C, Charlton MR: Early identification of recipients with progressive histologic recurrence of hepatitis C after liver transplantation. Hepatology 2000, 32:1125-1130 [DOI] [PubMed] [Google Scholar]
- 37.Pelletier SJ, Raymond DP, Crabtree TD, Berg CL, Iezzoni JC, Hahn YS, Sawyer RG, Pruett TL: Hepatitis C-induced hepatic allograft injury is associated with a pretransplantation elevated viral replication rate. Hepatology 2000, 32:418-426 [DOI] [PubMed] [Google Scholar]
- 38.Nardin A, Lindorfer MA, Taylor RP: How are immune complexes bound to the primate erythrocyte complement receptor transferred to acceptor phagocytic cells? Mol Immunol 1999, 36:827-835 [DOI] [PubMed] [Google Scholar]
- 39.Johnson RJ, Gretch DR, Yamabe H, Hart J, Bacchi CE, Hartwell P, Couser WG, Corey L, Wener MH, Alpers CE, Willson R: Membranoproliferative glomerulonephritis associated with hepatitis C virus infection. N Engl J Med 1993, 328:465-470 [DOI] [PubMed] [Google Scholar]
- 40.Kanto T, Hayashi N, Takehara T, Katayama K, Kato M, Akiyama M, Kasahara A, Fusamoto H, Kamada T: Low expression of erythrocyte complement receptor type 1 in chronic hepatitis C patients. J Med Virol 1996, 50:126-134 [DOI] [PubMed] [Google Scholar]
- 41.Meltzer M, Franklin EC: Cryoglobulinemia—a study of twenty-nine patients. I IgG and IgM cryoglobulins and factors affecting cryoprecipitability. Am J Med 1966, 40:828-836 [DOI] [PubMed] [Google Scholar]
- 42.Davis CL, Gretch DR, Perkins JD, Harris AW, Wener MH, Alpers CE, Lesniewski R, Lee W, dela Rosa C, Johnson RJ, et al: Hepatitis C—associated glomerular disease in liver transplant recipients. Liver Transpl Surg 1995, 1:166-175 [DOI] [PubMed] [Google Scholar]
- 43.Kendrick EA, McVicar JP, Kowdley KV, Bronner MP, Emond MJ, Alpers CE, Gretch DR, Carithers RL, Jr, Perkins JD, Davis CL: Renal disease in hepatitis C-positive liver transplant recipients. Transplantation 1997, 63:1287-1293 [DOI] [PubMed] [Google Scholar]
- 44.Agnello V, Abel G, Elfahal M, Knight GB, Zhang QX: Hepatitis C virus and other flaviviridae viruses enter cells via low density lipoprotein receptor. Proc Natl Acad Sci USA 1999, 96:12766-12771 [DOI] [PMC free article] [PubMed] [Google Scholar]
- 45.Pileri P, Uematsu Y, Campagnoli S, Galli G, Falugi F, Petracca R, Weiner AJ, Houghton M, Rosa D, Grandi G, Abrignani S: Binding of hepatitis C virus to CD81. Science 1998, 282:938-941 [DOI] [PubMed] [Google Scholar]
- 46.Van Noorden CJ, Jonges GN: Analysis of enzyme reactions in situ. Histochem J 1995, 27:101-118 [DOI] [PubMed] [Google Scholar]
- 47.Goldstein E, Donovan RM, Kim Y: Applications of computerized microscopic image analysis in infectious diseases. Rev Infect Dis 1988, 10:92-102 [DOI] [PubMed] [Google Scholar]
- 48.Jonker A, de Boer PA, van den Hoff MJ, Lamers WH, Moorman AF: Towards quantitative in situ hybridization. J Histochem Cytochem 1997, 45:413-423 [DOI] [PubMed] [Google Scholar]
- 49.Haase AT, Henry K, Zupancic M, Sedgewick G, Faust RA, Melroe H, Cavert W, Gebhard K, Staskus K, Zhang ZQ, Dailey PJ, Balfour HH, Jr, Erice A, Perelson AS: Quantitative image analysis of HIV-1 infection in lymphoid tissue. Science 1996, 274:985-989 [DOI] [PubMed] [Google Scholar]
- 50.Musiani M, Roda A, Zerbini M, Pasini P, Gentilomi G, Gallinella G, Venturoli S: Chemiluminescent in situ hybridization for the detection of cytomegalovirus DNA. Am J Pathol 1996, 148:1105-1112 [PMC free article] [PubMed] [Google Scholar]
- 51.Musiani M, Zerbini M, Venturoli S, Gentilomi G, Gallinella G, Manaresi E, La Placa M, D’Antuono A, Roda A, Pasini P: Sensitive chemiluminescence in situ hybridization for the detection of human papillomavirus genomes in biopsy specimens. J Histochem Cytochem 1997, 45:729-735 [DOI] [PubMed] [Google Scholar]
- 52.Ermert L, Hocke AC, Duncker HR, Seeger W, Ermert M: Comparison of different detection methods in quantitative microdensitometry. Am J Pathol 2001, 158:407-417 [DOI] [PMC free article] [PubMed] [Google Scholar]
- 53.Rehermann B: Interaction between the hepatitis C virus and the immune system. Semin Liver Dis 2000, 20:127-141 [DOI] [PubMed] [Google Scholar]