

Abstract
Glutamate excitotoxicity has been implicated in the pathophysiology of epilepsy. Systemic injection of kainic acid (KA) in the rat produces an animal model of human temporal lobe epilepsy. We examined the temporal expression of the sodium-dependent neuronal glutamate transporter, excitatory amino acid carrier 1 (EAAC1), in KA-induced rat epilepsy. As an early alteration, perinuclear deposits of EAAC1 protein were found mainly in the large pyramidal neurons at the hippocampus, neocortex, piriform cortex, and amygdala with the reduction of neuropil staining 6 hours after KA injection. Immunoelectron microscopic study revealed that the perinuclear EAAC1 immunoreactivity corresponded to the translocation to the Golgi complex. At this time point, EAAC1 mRNA was down-regulated. The intracellular aggregation of EAAC1 primarily disappeared by 24 hours. In vitro studies indicated that internalization of EAAC1 from the plasma membrane to the intracellular compartment by KA treatment was associated with the reduction of electrogenic transporter currents. Our results suggest that the transient EAAC1 internalization participates in the modulation of the transporter function preventing excessive glutamate uptake to pyramidal neurons during the early stage of epilepsy.
Glutamate, the principal excitatory neurotransmitter in the mammalian central nervous system, 1 has been implicated in the pathophysiology of epilepsy. Extracellular glutamate released from presynaptic vesicles must be rapidly removed from the synaptic cleft by glutamate transporting proteins to prevent neuronal excitotoxicity. 2,3 EAAC1, neuronal/epithelial glutamate transporter subtype, is widely distributed in the neurons of the central nervous system. 4 Besides in neurons, EAAC1 is also localized in immature oligodendrocytes, 5 a subset of normal astrocytes 6 and neoplastic astrocytes, 7 as well as in peripheral tissue including the kidney, 8 heart, 9 and small intestine. 10 Among the five subtypes of glutamate transporter, the critical role of the astrocytic glutamate transporter, GLT-1 has been emphasized in the epileptic brain because GLT-1-deficient mice develop lethal seizures. 11 However, the regulation of EAAC1 during epilepsy has not been understood. Although EAAC1-deficient mice display only a reduced spontaneous locomotor activity without neurodegeneration, 12 administration of the anti-sense oligonucleotide of EAAC1 into a rat brain produces epilepsy. 13 The regulation of EAAC1 in epileptic brains is rather inconsistent: up-regulation of EAAC1 in amygdala-kindled rats, 14 no change of EAAC1 protein level in genetically epilepsy-prone rats, 15 and down-regulation in kainic acid (KA) seizures. 16
Systemic or intracerebral injection of KA, a rigid analogue of glutamate, in the rat is frequently used to produce an animal model of human temporal lobe epilepsy. Since the description by Olney and colleagues, 17 the neurotoxicity of KA has been extensively studied neuropathologically and electrophysiologically. 18 In the present study, we found transient translocation of EAAC1 protein to the Golgi complex with the reduction of neuropil staining in the pyramidal neurons 6 hours after KA injection. To test the hypothesis that the EAAC1 internalization by KA treatment is associated with functional impairment, in vitro studies were also performed with C6 glioma cells. We used the C6 glioma cell line because it endogenously expresses only EAAC1 among sodium-dependent glutamate transporter subtypes 7 and it has been used to investigate the membrane trafficking of the EAAC1 through protein kinase C and phosphatidylinositol 3-kinase. 19-21 Moreover, cultured hippocampal neurons express not only EAAC1 but also GLT-1. 22 In our result, the reduction of the reversed transporter current with the change of subcellular localization was observed by KA treatment. The intracellular trafficking and functional role of EAAC1 in epilepsy have been discussed.
Materials and Methods
Animal Procedures and Tissue Preparation
This study was approved by the Animal Committee of Kyushu University. Male Wistar rats weighing 180 to 200 g (8-weeks-old; Kyudo, Japan) were divided into seven groups of five rats each. Rats were injected intraperitoneally with 10 mg/kg KA (Sigma, St. Louis, MO or Ocean Produce Int., Nova Scotia, Canada). After being deeply anesthetized with ether, rats were intra-aortically perfused with 4% paraformaldehyde and brain tissue samples were obtained at 2 hours, 6 hours, 24 hours, 1 week, and 4 weeks after the KA injection. In the two control groups, the rats were injected intraperitoneally with 0.1 mol/L of phosphate-buffered saline (200 μl) and killed at 6 hours and 4 weeks after the injection. After the KA injection, behavioral changes were observed to determine the seizure stages according to the criteria of Racine. 23 Intraperitoneal KA injection (10 mg/kg) produced the following acute-stage behavioral changes in each Wistar rat: within 2 hours, the rats developed masticatory movements, head nodding, and wet dog shakes (class 1 and 2 by Racine 23 ), followed by forelimb clonus and rearing (class 3 and 4); between 2 and 4 hours after KA injection, the rats exhibited severe, repeated status epilepticus with rearing and falling and reached class 5 motor seizures; the seizures declined and rats appeared exhausted between 4 and 6 hours; spontaneous motor seizures were occasionally observed in the late stage 1 week after KA injection.
Western Blotting
Fresh-frozen samples from the hippocampus of the control and KA-treated rats killed at 6 hours and 4 weeks were used. Western blotting was performed as described previously. 24 Samples were homogenized in protein lysis buffer. Each sample (10 μg/lane) was separated by 7.5% sodium dodecyl sulfate (SDS)-polyacrylamide gel electrophoresis and transferred to a polyvinylidene difluoride membrane (Millipore, Bedford, MA). The membranes were incubated overnight with EAAC1 antibody (1:1000) 4 in blocking buffer at 4°C, then washed and incubated with peroxidase-conjugated secondary antibody (1:20,000; Chemicon, Temecula, CA) for 1 hour. The immunoreactive proteins were visualized with enhanced chemiluminescence (Amersham, Buckinghamshire, UK). Then, the membrane was washed and incubated with actin antibody (1:5000, Amersham) and developed with enhanced chemiluminescence as a loading control.
Northern Blotting
Total RNA was isolated by the guanidine isothiocyanate method 25 from each hippocampus from which a contralateral sample was used for Western blotting. RNA (10 μg/lane) was diluted in loading buffer (0.5× 3-(N-morpholino)propanesulfonic acid (MOPS), 50% formamide, 6.7% formaldehyde, 10 μg/ml ethidium bromide), electrophoresed in 1% denaturing agarose gel containing 1× MOPS and 6.7% formaldehyde, and transferred onto nylon membrane (Roche, Mannheim, Germany). The membrane was hybridized with 32P-labeled EAAC1 cDNA probes overnight at 65°C. After washing twice in 6× standard saline citrate (SSC) at room temperature for 10 minutes, once in 2× SSC/0.1% SDS and 0.2× SSC/0.1% SDS at 65°C for 20 minutes, the membrane was exposed to X-ray film (Eastman-Kodak, Rochester, NY) overnight at −80°C. After stripping the EAAC1 probe in 2× SSC/50% formamide at 65°C overnight, the membrane was reprobed with glyceraldehyde phosphate dehydrogenase (GAPDH) cDNA as a loading control as described above.
Immunohistochemistry and Immunoelectron Microscopy
Immunohistochemistry and immunoelectron microscopy were performed as described previously. 24 For histopathological examination, the coronal sections at the level of the dorsal hippocampi and the sagittal sections of the cerebellum were stained with hematoxylin and eosin (H&E). For immunohistochemistry, paraffin-embedded 5-μm-thick sections were deparaffinized and incubated with 0.3% hydrogen peroxide in absolute methanol for 30 minutes. Sections were autoclaved in 0.01 mol/L of citrate buffer, pH 6.0, to enhance the immunoreactivity. After washing with Tris-HCl buffer (50 mmol/L Tris-HCl, pH 7.6), the sections were incubated at 4°C overnight with primary antibodies diluted 1:100 for EAAC1 4 (rabbit, polyclonal), N-methyl-d-aspartate receptor (NR) 1 (rabbit, polyclonal; Chemicon) and glutamate receptor (GluR) 2/3 (rabbit, polyclonal; Chemicon). The sections were then washed and incubated with biotinylated rabbit antibodies diluted 1:200 and peroxidase-conjugated streptavidin-biotin complex or fluorescein isothiocyanate-conjugated streptavidin (Amersham) diluted 1:100 sequentially. The colored reaction product was developed with 3,3′-diaminobenzidine tetrahydrochloride solution. The sections for immunofluorescence were counterstained with propidium iodide and were observed under a confocal laser microscope (LSM-GB200; Olympus, Tokyo, Japan). For immunoelectron microscopy, rats were perfused with 2% paraformaldehyde/2% glutaraldehyde in 0.1 mol/L of phosphate buffer. Vibratome sections (40 μm) were pretreated by 1% sodium borohydride for 10 minutes, then immunohistochemistry was performed using the labeled biotin-streptavidin method with 3,3′-diaminobenzidine tetrahydrochloride reaction the same as with paraffin sections. Ultrathin sections without lead staining were observed under an electron microscope (JEM-100CX; JEOL, Japan).
In Situ Hybridization
Nonradioisotopic in situ hybridization was performed as described previously. 26 To detect the EAAC1 transcripts, a 149-bp cDNA fragment of rat EAAC1 (GenBank accession number U21107; position 504 to 652) was amplified by polymerase chain reaction from rat cerebral cDNA and was cloned in TA-cloning vector (Invitrogen Corp., Carlsbad, CA). Digoxigenin-labeled anti-sense and sense cRNA probes were generated using a DIG RNA Labeling Kit (SP6/T7) (Roche). Paraffin-embedded sections were deparaffinized, digested with 20 μg/ml of proteinase K for 15 minutes at room temperature, acetylated with 0.25% acetic anhydride/0.1 mol/L triethanolamine (TEA), pH 8.0, for 10 minutes, and treated with 0.2 N HCl for 10 minutes. Then, sections were hybridized with the probes overnight at 50°C. After being rinsed in 2× SSC/50% formamide at 65°C for 30 minutes, sections were treated with 50 μg/ml of RNase A in 10 mmol/L of Tris-HCl, pH 7.6/500 mmol/L NaCl/1 mmol/L ethylenediaminetetraacetic acid at 37°C for 30 minutes, and washed once in 2× SSC/0.1% SDS at 65°C for 20 minutes and twice in 0.2× SSC/0.1% SDS at 65°C for 20 minutes. Sections were then incubated with alkaline phosphatase-conjugated anti-digoxigenin monoclonal antibody (1:500) overnight at 4°C (DIG Nucleic Acid Detection kit, Roche). Sections were developed in 350 μg/ml nitro blue tetrazolium, 175 μg/ml 5-bromo-4-chloro-3-indolyl phosphate/100 mmol/L Tris-HCl, pH 9.5, 100 mmol/L NaCl, and 50 mmol/L MgCl for 16 to 24 hours in the dark. To determine the specificity of the digoxigenin-labeled EAAC1 anti-sense probe, hybridization with an EAAC1 sense probe as well as competitive hybridization with digoxigenin-labeled and nonlabeled probes was performed at the same time.
Densitometric Analysis
Image analysis of immunohistochemistry and in situ hybridization for EAAC1 was performed on a Macintosh computer using the public domain NIH Image program 1.62 (National Technical Information Service, Springfield, VA) as described previously. 27 The optical densities at large neurons were obtained from five fields (0.025 inches) of each section of CA3 at the hippocampus, layer 5 at the neocortex, and mediodorsal nuclei at the thalamus, and then averaged for three rats. Statistical analysis for the differences of regional changes between control and KA-treated rats was performed with a Kruskal-Wallis test as well as a Mann-Whitney U-test using a StatView J4.5 program (Abacus Concepts, Berkeley, CA).
Cell Culture
C6 rat glioma cells (CL 107, American Type Culture Collection, Rockville, MD) that endogenously express EAAC1 7 were cultured in Dulbecco’s modified Eagle’s medium supplemented with 10% heat-inactivated calf serum. For electrophysiology, cells were plated in 35-mm dishes and incubated with 500 nmol/L of phorbol 12-myristate 13-acetate (PMA) for 3 hours. Then, KA (10 μmol/L) was applied for 1.5 hours before use. For immunocytochemistry, culture cells were plated in Lab-Tek chamber slides (Nunc Inc., Naperville, IL), and fixed with 4% paraformaldehyde, pretreated with 1% Nonidet P-40 for 10 minutes, and incubated overnight with EAAC1 antibody diluted 1:10. Then cells were incubated with fluorescein isothiocyanate-conjugated anti-rabbit IgG (Amersham) and propidium iodide (Sigma). The slides were observed under a laser scan confocal microscopy (LSM-GB200; Olympus, Japan).
Electrophysiological Measurements
Patch-clamp recordings were made as reported previously. 28,29 C6 glioma cells were whole cell-clamped using a patch pipette containing 90 mmol/L NaCl, 10 mmol/L l-glutamate, 3 mmol/L MgATP, 5 mmol/L HEPES, 1 mmol/L CaCl2, 4 mmol/L MgCl2, and 5 mmol/L EGTA. The pH of the solution was adjusted to 7.3 with N-methyl-d-glucamine. The pipette resistance was 6 to 9 MΩ. The external solution contained 0 or 10 mmol/L KCl, 110 or 100 mmol/L choline chloride, 0.5 mmol/L MgCl2, 3 mmol/L CaCl2, 5 mmol/L HEPES, 15 mmol/L glucose, 6 mmol/L BaCl2, and 0.1 mmol/L ouabain. The pH of the solution was adjusted to 7.4 with N-methyl-d-glucamine. The external potassium solution was applied rapidly using the Y-tube technique, 30 which allows the complete exchange of the external solution surrounding a cell within 20 ms. The temperature monitored in the recording dishes was 33 to 34°C.
Results
Western and Northern Blot Analysis of EAAC1
Western blotting of the hippocampal homogenates from control and KA-treated rats at 6 hours and 4 weeks demonstrated a single band that corresponded to EAAC1 protein using C-terminal EAAC1 antibody. Total expression level of EAAC1 protein was not altered 6 hours after KA treatment. Degradation products were not observed in the homogenates from KA-treated rats (Figure 1A) ▶ . Northern blotting of the hippocampal homogenates revealed a single band at 3.8 kb that corresponds to EAAC1 transcripts using 32P-labeled EAAC1 cDNA probes (Figure 1B) ▶ . Neither the truncated nor aberrant form of EAAC1 mRNA was detected in KA-treated rats.
Figure 1.

Western (A) and Northern (B) blot analysis for each EAAC1 protein and EAAC1 mRNA in the hippocampal tissue from control and KA-treated rats at 6 hours (6h) and 4 weeks (4w). A: Western blotting demonstrates the specificity of antibodies raised against the synthetic peptide corresponding to the C-terminus of EAAC1. Actin was used as a loading control. Each lane was loaded with 10 μg of protein. B: Northern blotting with 32P-labeled EAAC1 cDNA probes detects a single band at 3.8 kb that corresponds to EAAC1 transcripts. GAPDH was used as a loading control. Each lane was loaded with 10 μg of total RNA.
Early Transient Changes of EAAC1 Expression in the Large Pyramidal Neurons
In the control rat brains, EAAC1 was enriched in the large pyramidal neurons and neuropil of the hippocampus, caudate putamen, amygdala, piriform cortex, olfactory bulb, and cerebellar cortex (Figure 2 ▶ ; A, C, and E). Early histopathological changes 2 hours after KA injection were characterized by edema in the neuropil throughout the forebrain. Despite the marked neuropil changes in H&E sections, EAAC1 protein expressions were generally retained even in the shrunken neurons until 2 hours after KA injection during status epilepticus. Expression of EAAC1 increased slightly at the piriform cortex at 2 hours. The most dramatic change was disclosed at 6 hours; ie, perinuclear deposition of EAAC1 immunoreactivity was found together with the reduction of neuropil staining mainly in the large pyramidal neurons of the neocortex (Figure 2B) ▶ , hippocampus (Figure 2D) ▶ , amygdala, and piriform cortex. These changes were partly seen in the putaminal neurons and small pyramidal neurons of the neocortex, but not observed in the cerebellar Purkinje cells (Figure 2F) ▶ , spinal motor neurons, or astrocytes. In the immunoelectron microscopy, EAAC1-immunoreactivity at 6 hours was associated mainly with the outer membrane of the Golgi complex, which was consistent with the perinuclear staining of the large pyramidal neurons at 6 hours (Figure 2G) ▶ . Less immunoreactivity for EAAC1 was found in the dendrites, axons, plasma membranes, and nucleus. This intracellular relocation of EAAC1 is specific, because other membrane proteins such as one of the N-methyl D-aspartate (NMDA) receptors, NR1, and one of the α-amino-3-hydroxy-5-methyl-4-isoxazole propionic acid (AMPA) receptors, GluR 2/3, did not undergo the same spatial reorganization in the immediate postseizure period (Figure 3) ▶ . The intracellular aggregation of EAAC1 at 6 hours (Figure 4, B and F) ▶ was not observed at 24 hours (Figure 4, C and G) ▶ , 1 week, and 4 weeks (Figure 4, D and H) ▶ after KA injection. EAAC1 expression partly decreased at the piriform cortex, the lateral part of amygdala, and the medial part of the thalamic nuclei at 1 week and 4 weeks.
Figure 2.

Immunohistochemistry (A–F) and immunoelectron microscopy (G) in layer 5 of neocortex (A, B, and G), CA3 pyramidal neurons at hippocampus (C, D), and cerebellar Purkinje cells (E, F). A–D: In the control rats, pyramidal neurons and neuropil are immunoreactive for EAAC1 (A, C). EAAC1 immunoreactivity is found as perinuclear deposits at pyramidal neurons with reduced neuropil staining 6 hours after the KA injection (B, D), whereas immunoreactivities for EAAC1 are not altered with KA treatment in the Purkinje cells (E, F). G: Ultrastructural localization of EAAC1 in cortical pyramidal neurons 6 hours after the KA injection. Electron micrographs show enrichment of EAAC1 immunoreactivity around the Golgi apparatus (arrows) compared to that at the plasma membranes (arrowheads). Scale bars: 20 μm (A–F); 1 μm (G).
Figure 3.
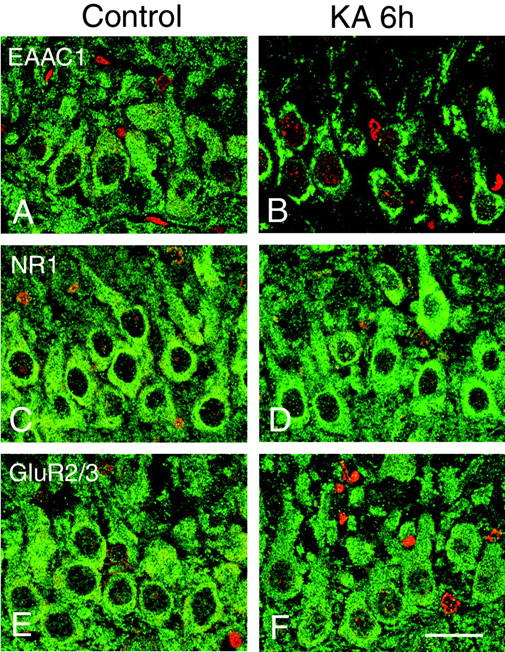
Immunohistochemistry for EAAC1 (A and B, green), NR1 (C and D, green), and GluR2/3 (E and F, green) in the hippocampal CA3 in the control (A, C, E) and 6 hours after KA injection (B, D, F). Although perinuclear immunoreactivity for EAAC1 was found in the 6 hours after KA injection (B), immunoreactivities for the glutamate receptors NR1 and GluR2/3 were not altered in the large pyramidal neurons. Nuclear staining with propidium iodide (A–F, red). Scale bar, 20 μm.
Figure 4.

Immunohistochemistry (A–H, EAAC1) and in situ hybridization with digoxigenin-labeled anti-sense probes (I–P, EAAC1-ISH) in the hippocampus (A–D, I–L) and the magnification of CA3 (E–H, M–P) at control (A, E, I, M), KA 6 hours (6h; B, F, J, N), KA 24 hours (24h; C, G, K, O), and KA 4 weeks (4w; D, H, L, P). A and E: Hippocampal pyramidal neurons and neuropil are immunoreactive for EAAC1 in the control. B and F: EAAC1 immunoreactivity is found as perinuclear deposits at pyramidal neurons (inset in F) 6 hours after the KA injection. C, D, G, and H: Distribution and immunoreactivity for EAAC1 at the hippocampus have almost recovered to the control level 24 hours as well as 4 weeks after the KA injection. I and M: EAAC1 transcripts are enriched in the pyramidal neurons of the control hippocampus. J and N: Expression of EAAC1 mRNA decreases 6 hours after the KA injection. K, L, O, and P: Expression of EAAC1 mRNA has recovered 24 hours as well as 4 weeks after the KA injection. Scale bars: 500 μm (A–D and I–L); 50 μm (E–H); 40 μm (M–P).
In the in situ hybridization, the EAAC1 mRNA expression was ubiquitously found in the pyramidal neurons of the forebrain in the control cases. In the control hippocampus, pyramidal neurons were preferentially labeled compared to the granule cells of dentate gyrus (Figure 4I) ▶ . Expression of EAAC1 mRNA decreased in the forebrain 6 hours after KA injection (Figure 4, J and N) ▶ . The expression of EAAC1 mRNA at 24 hours had recovered to the normal level (Figure 4, K and O) ▶ . The positive signal was not detected in the hybridization with the EAAC1 sense probe as well as competitive hybridization with 50-fold nonlabeled probes.
Densitometric Analysis of EAAC1 Expressions
Densitometric analysis of EAAC1 immunohistochemistry and in situ hybridization was performed at early phase (Figure 5A ▶ , KA 6 hours and KA 24 hours) and late phase (Figure 5B ▶ , KA 4 weeks). Optical densities for EAAC1 immunohistochemistry demonstrated that perikaryal staining (P in Figure 5A ▶ ) was increased in hippocampus and neocortex, whereas increased perikaryal staining was not seen in the mediodorsal nuclei of thalamus. Optical densities for neuropil staining in the immunohistochemistry (N in Figure 5A ▶ ) and the in situ hybridization became reduced in the hippocampus, neocortex, and thalamus at 6 hours. Such changes recovered to the control level at 24 hours. Significant difference is shown among the control, 6 hours and 24 hours in the perikaryal staining for hippocampus, as well as the neuropil staining and in situ hybridization in all three regions (Kruskal-Wallis test). Densities for both EAAC1-immunohistochemistry and in situ hybridization at 4 weeks (12-week-old rats) were reduced compared to those at 6 hours (8-week-old rats) in the control cases. In the KA-treated cases at 4 weeks, only neuropil staining for EAAC1 immunohistochemistry at the thalamus showed significant statistical decrease (Figure 5B ▶ , Mann-Whitney U-test).
Figure 5.

Densitometric analysis of EAAC1 immunohistochemistry and in situ hybridization at CA3 of the hippocampus, layer 5 of the neocortex, and mediodorsal nuclei of the thalamus in the early phase (A): control (C), 6 hours (6h) and 24 hours (24h) after KA treatment in 8-week-old rats; and the late phase (B): control (C) and 4 weeks (4w) after KA treatment in 12-week-old rats. Optical densities for perikaryal staining (P) and neuropil staining (N) of immunohistochemistry and neuronal staining for in situ hybridization using digoxigenin-labeled anti-sense probes (ISH) are compared using the Kruskal-Wallis test (for A) and the Mann-Whitney U-test (for B). At 6 hours, perikaryal staining has increased, whereas neuropil staining has decreased in the hippocampus and the neocortex. The EAAC1 mRNA expression is reduced in the all three regions. These changes recover to the control level at 24 hours. Significant difference of optical densities is shown among the control, 6 hours, and 24 hours in the perikaryal staining of hippocampus as well as the neuropil staining and in situ hybridization in the all three regions. At 4 weeks, neuropil staining has significantly decreased in the thalamus. *, P < 0.05; **, P < 0.01. y axis indicates an arbitrary index.
Effect of KA on Reverse Glutamate Transport Current in Vitro
To see the effect of KA on subcellular localization and the accompanying functional changes, we conducted in vitro studies on C6 glioma cells. In the EAAC1 immunocytochemistry, diffuse cytoplasmic staining was seen in the untreated C6 glioma cells (Figure 6A) ▶ . After the incubation with 500 nmol/L of PMA, membranous staining was observed in the subsets of C6 glioma cells (Figure 6B) ▶ as reported previously. 19 Then, the 10 μmol/L KA treatment showed EAAC1 immunoreactivity in the perinuclear vesicular structures (Figure 6C) ▶ .
Figure 6.

Translocation and functional changes of EAAC1 in vitro. A–C: EAAC1 immunocytochemistry in the C6 glioma cells that endogenously express EAAC1. Green, EAAC1 immunoreactivity; red, propidium iodide for nuclear staining. A: Untreated C6 glioma cells show diffuse EAAC1 immunoreactivity in the cytoplasm. B: After PMA treatment (500 nmol/L), membranous EAAC1 staining is found in C6 glioma cells. C: Then, perinuclear EAAC1 immunoreactivity is seen in the KA (10 μmol/L)-treated C6 glioma cells. D–F: Electrogenic glutamate transporter in C6 glioma cells and the effect of KA. D: The reversed mode of the glutamate transporter was measured using the whole-cell patch clamp method. The outward current reflecting glutamate release from the C6 glioma cells was smaller in 10 μmol/L KA-treated cells than in the nontreated cells. The holding potential was −40 mV and [K+]o was raised from 0 to 10 mmol/L (timing shown by black bar). The series of voltage pulses from −100 to +50 mV for 50 ms as shown below was applied at the time indicated (a to d). E: The voltage-dependence of K+-evoked current. The current-voltage relationship obtained at the time point of a and c in D was subtracted from the one at b and d, respectively. F: The amplitude of K+-evoked currents at −40 mV in control and KA-treated cells. The normalized amplitude was 0.62 ± 0.09 pA/pF (n = 6) in control and 0.33 ± 0.06 pA/pF (n = 8) in KA-treated cells. Mean ± SEM. *, P < 0.05). Scale bar, 20 μm (C).
To investigate the functional changes of EAAC1, electrogenic glutamate transport was studied in C6 glioma cells by the use of the whole cell patch-recording mode under voltage-clamp conditions. To avoid using the glutamate receptor inhibitor cocktail, the current induced by a reverse mode of the glutamate transporter was measured. In cells studied with patch pipettes containing 100 mmol/L Na+ and 10 mmol/L l-glutamate, increasing the extracellular K+ concentration ([K+]o) from 0 to 10 mmol/L evoked an outward membrane current (Figure 6D) ▶ , reflecting glutamate release as observed in salamander Müller cells and rat microglia. 28,31 To minimize the contamination from other possible K+-dependent membrane currents, 100 μmol/L of ouabain, a Na+-K+ pump ATPase inhibitor, and 6 mmol/L of Ba2+ ions, a blocker of K+ conductance, were added to the external solution. Moreover, K+ was omitted from the patch pipette solution. The voltage dependence of the outward current was investigated by applying the square pulses of 50 ms duration between −100 and + 50 mV from a holding potential of −40 mV before and during the K+-evoked current and the one before the K+-application was subtracted (Figure 5E) ▶ . The current-voltage relationships in both control and KA-treated cells were slightly voltage-dependent as observed previously. 28 Figure 6F ▶ summarizes the amplitude of normalized outward currents at −40 mV in control and KA-treated C6 glioma cells. The K+-evoked outward current was reduced by the treatment of 10 μmol/L KA-treated cells for 3 hours.
Discussion
This study first demonstrated internalization of the neuronal glutamate transporter EAAC1 in vivo. We found that the EAAC1 protein in large pyramidal neurons was transiently translocated to the Golgi complex 6 hours after KA injection during a postictal state. Transporter current via EAAC1 was reduced in KA-treated cells in vitro.
EAAC1 in Large Pyramidal Neurons Is Transiently Translocated to the Golgi Complex 6 Hours after KA Injection in the KA-Treated Rat Epilepsy
Perinuclear deposits with reduction of neuropil staining for EAAC1 in KA-treated rats were preferentially observed in the large neurons at the hippocampus, neocortex, piriform cortex, and amygdala, but not seen in the Purkinje cells or spinal motor neurons. Thus, the EAAC1 internalization occurred mainly in the large neurons on the propagation pathway. This phenomenon is specific for the EAAC1 protein because other membrane proteins such as glutamate receptors did not alter the subcellular localization 6 hours after KA injection. We hypothesized that EAAC1 immunoreactivity located at the Golgi complex 6 hours after KA injection exhibited translocation from the plasma membrane rather than from the newly synthesized EAAC1 protein because of the following results: EAAC1 immunoreactivity in the perikarya increased significantly whereas that in the neuropil decreased in the hippocampus and neocortex of the densitometric analysis; however, as was shown by Western blotting, the total expression level of EAAC1 was not decreased and the aberrant or truncated form of EAAC1 mRNA was not found in the Northern blotting, which rules out the possibility that a newly synthesized truncated form of EAAC1 without signal peptides accumulated around the Golgi complex. Also, in vitro study showed a rapid change of localization from the plasma membrane to the perinuclear vesicles within 1 hour. Further studies such as pulse-chase or protein synthesis inhibitor experiments may support our hypothesis. Previous articles regarding KA-induced rat epilepsy have not addressed this phenomenon, presumably because it occurs at the restricted time point of 6 hours after KA injection. Immunoelectron microscopic study disclosed that perinuclear deposits of EAAC1 immunoreactivity were located at the Golgi complex. Although clathrin-mediated internalization of acetylcholine 32 or a dopamine transporter 33 is suggested, EAAC1 trafficking from the cell surface to the Golgi complex has not been reported. It has been suggested that Golgi serves not only as a secretory traffic but also a signaling platform for membrane sorting. 34 Interaction between EAAC1 and a variety of Golgi-associated proteins should be explored.
In the KA-treated brain, the EAAC1 translocation to the Golgi complex was observed in a subset of neurons, especially large pyramidal neurons, and was not seen in the astrocytes. In the astrocytes and GABAergic interneurons, glutamate can be changed to glutamine or GABA by glutamine synthetase and glutamic acid decarboxylase, respectively. Alternatively, intracellular glutamate concentration may be regulated by the internalization of EAAC1 in the glutamatergic neurons, which are devoid of glutamine synthetase and glutamic acid decarboxylase (Figure 7) ▶ .
Figure 7.

Glutamate metabolism in the environment of high extracellular glutamate. A: In the astrocytes, glutamate (Glu) through GLAST and GLT-1 is changed into glutamine (Gln) by glutamine synthetase (GS). B: In the GABAergic neurons, glutamate through EAAC1 is changed to GABA by glutamic acid decarboxylase. C: Glutamatergic neurons, which do not contain glutamine synthetase or glutamic acid decarboxylase, were observed mainly in the translocation of EAAC1 proteins. As a result, excessive glutamate uptake or reverse glutamate transport is attenuated in the neurons.
Role of the Internalization of EAAC1 Protein in Vitro
It has been suggested that membrane trafficking regulates the activity of the neurotransmitter-transporting proteins including dopamine 33,35,36 and acetylcholine. 32 In vitro studies demonstrated that preincubation with PMA causes increase in EAAC1-mediated [3H] l-glutamate transport activity and cell surface expression of EAAC1 in C6 glioma cells. 19,20 Although C6 glioma cells are not a model for neurons, we used these cells as a model of EAAC1 trafficking in general because cultured hippocampal neurons express both EAAC1 and GLT-1, 22 and only C6 glioma cells showed high glutamate uptake as well as selective expression of EAAC1 among the nonneuronal cell lines including HeLa, CHO, and others in the preliminary studies (Dr. Isao Nagano, personal communication). In our result, the transporter currents were recorded after treatment of the cells with PMA by the whole cell patch-clamp method, which were reduced by KA treatment in accordance with the internalization of EAAC1. These results indicated that the translocation of EAAC1 induced by KA treatment modulated the glutamate uptake via EAAC1 regardless of cell type.
Regulation of EAAC1 Protein during Epilepsy
There may be several pathways to negatively modulate EAAC1 protein function other than the down-regulation of EAAC1 mRNA. Recently, the EAAC1-associated protein, GTRAP3–18, which leads to decreased EAAC1 activity has been identified. 37 Because GTRAP3–18 modulates EAAC1 transporter activity by lowering substrate affinity without altered protein trafficking, translocation of EAAC1 is thought to be a different mechanism to regulate EAAC1 proteins. It is conceivable that EAAC1 internalization is important for the rapid regulation of high-affinity glutamate uptake after the propagation of seizures. Because EAAC1 runs in reverse in vitro when ionic gradients are disrupted by such as pathological conditions, 38 EAAC1 internalization may have a role at preventing the excessive uptake or reverse transport of glutamate. During the EAAC1 translocation, which helps to minimize epileptic injury in pyramidal neurons, the astrocytic glutamate transporters, GLT-1 and GLAST, may undergo enough total glutamate uptake from the synaptic cleft. This EAAC1 protein translocation may provide a novel mechanism for neuronal protection against excitotoxicity.
Acknowledgments
We thank Dr. Isao Nagano for helpful comments, Ms. Kazue Hatanaka and Ms. Mikiko Sato at the Department of Neuropathology and Mr. Takaaki Kanemaru at the Morphology Core of Kyushu University for their excellent technical assistance, and Mr. Robert Debold for editing our manuscript.
Footnotes
Address reprint requests to Akiko Furuta, M.D., Ph.D. (Current address of A.F.), Department of Degenerative Neurological Diseases, National Institute of Neuroscience, National Center of Neurology and Psychiatry, 4-1-1, Ogawahigashi, Kodaira, Tokyo 187-8502, Japan. E-mail: afuruta@ncnp.go.jp.
Supported by the Ministry of Education, Culture, Sports, Science, and Technology [grant-in-aid for scientific research (C) no. 13680824] and the Clinical Research Foundation (1999) of Japan.
References
- 1.Fonnum F: Glutamate: a neurotransmitter in mammalian brain. J Neurochem 1984, 42:1-11 [DOI] [PubMed] [Google Scholar]
- 2.Choi DW, Maulucci-Gedde M, Kriegstein AR: Glutamate neurotoxicity in cortical cell culture. J Neurosci 1987, 7:357-368 [DOI] [PMC free article] [PubMed] [Google Scholar]
- 3.Rosenberg PA, Amin S, Leitner M: Glutamate uptake disguises neurotoxic potency of glutamate agonists in cerebral cortex in dissociated cell culture. J Neurosci 1992, 12:56-61 [DOI] [PMC free article] [PubMed] [Google Scholar]
- 4.Rothstein JD, Martin L, Levey AI, Dykes HM, Jin L, Wu D, Nash N, Kuncl RW: Localization of neuronal and glial glutamate transporters. Neuron 1994, 13:713-725 [DOI] [PubMed] [Google Scholar]
- 5.Gottlieb M, Domercq M, Matute C: Altered expression of the glutamate transporter EAAC1 in neurons and immature oligodendrocytes after transient forebrain ischemia. J Cerebr Blood Flow Metab 2000, 20:678-687 [DOI] [PubMed] [Google Scholar]
- 6.Conti F, DeBiasi S, Minelli A, Rothstein JD, Melone M: EAAC1, a high-affinity glutamate transporter, is localized to astrocytes and GABAergic neurons besides pyramidal cells in the rat cerebral cortex. Cereb Cortex 1998, 8:108-116 [DOI] [PubMed] [Google Scholar]
- 7.Palos TP, Ramachandran B, Boado R, Howard BD: Rat C6 and human astrocytic tumor cells express a neuronal type of glutamate transporter. Mol Brain Res 1996, 37:297-303 [DOI] [PubMed] [Google Scholar]
- 8.Shayakul C, Kanai Y, Lee WS, Brown D, Rothstein JD, Hediger MA: Localization of the high-affinity glutamate transporter EAAC1 in rat kidney. Am J Physiol 1997, 273:F1023-F1029 [DOI] [PubMed] [Google Scholar]
- 9.King N, Williams H, McGivan JD, Suleiman MS: Characteristics of L-aspartate transport and expression of EAAC-1 in sarcolemmal vesicles and isolated cells from rat heart. Cardiovasc Res 2001, 52:84-94 [DOI] [PubMed] [Google Scholar]
- 10.Erickson RH, Gum JR, Jr, Lindstrom MM, McKean D, Kim YS: Regional expression and dietary regulation of rat small intestinal peptide and amino acid transporter mRNAs. Biochem Biophys Res Commun 1995, 216:249-257 [DOI] [PubMed] [Google Scholar]
- 11.Tanaka K, Watase K, Manabe T, Yamada K, Watanabe M, Takahashi K, Iwama H, Nishikawa T, Ichihara N, Kikuchi T, Okuyama S, Kawashima N, Hori S, Takimoto M, Wada K: Epilepsy and exacerbation of brain injury in mice lacking the glutamate transporter GLT-1. Science 1997, 276:1699-1702 [DOI] [PubMed] [Google Scholar]
- 12.Peghini P, Janzen J, Stoffel W: Glutamate transporter EAAC-1-deficient mice develop dicarboxylic aminoaciduria and behavioral abnormalities but no neurodegeneration. EMBO J 1997, 16:3822-3832 [DOI] [PMC free article] [PubMed] [Google Scholar]
- 13.Rothstein JD, Dykes HM, Pardo CA, Bristol LA, Jin L, Kuncl RW, Kanai Y, Hediger MA, Wang Y, Schielke JP, Welty DF: Knockout of glutamate transporters reveals a major role for astroglial transport in excitotoxicity and clearance of glutamate. Neuron 1996, 16:675-686 [DOI] [PubMed] [Google Scholar]
- 14.Miller HP, Levey AI, Rothstein JD, Tzingounis AV, Conn PJ: Alterations in glutamate transporter protein levels in kindling-induced epilepsy. J Neurochem 1997, 68:1564-1570 [DOI] [PubMed] [Google Scholar]
- 15.Akbar MT, Rattray M, Williams RJ, Chong NW, Meldrum BS: Reduction of GABA and glutamate transporter messenger RNAs in the severe-seizure genetically epilepsy-prone rat. Neuroscience 1998, 85:1235-1251 [DOI] [PubMed] [Google Scholar]
- 16.Simantov R, Crispino M, Hoe W, Broutman G, Tocco G, Rothstein JD, Baudry M: Changes in expression of neuronal and glial glutamate transporters in rat hippocampus following kainate-induced seizure activity. Mol Brain Res 1999, 65:112-123 [DOI] [PubMed] [Google Scholar]
- 17.Olney JW, Rhee V, Ho OL: Kainic acid: a powerful neurotoxic analogue of glutamate. Brain Res 1974, 77:507-512 [DOI] [PubMed] [Google Scholar]
- 18.Sperk G: Kainic acid seizures in the rat. Prog Neurobiol 1994, 42:1-32 [DOI] [PubMed] [Google Scholar]
- 19.Davis KE, Straff DJ, Weinstein EA, Bannerman PG, Correale DM, Rothstein JD, Robinson MB: Multiple signaling pathways regulate cell surface expression and activity of the excitatory amino acid carrier 1 subtype of Glu transporter in C6 glioma. J Neurosci 1998, 18:2475-2485 [DOI] [PMC free article] [PubMed] [Google Scholar]
- 20.Dowd LA, Coyle AJ, Rothstein JD, Pritchett DB, Robinson MB: Comparison of Na+-dependent glutamate transport activity in synaptosomes, C6 glioma, and Xenopus oocytes expressing excitatory amino acid carrier 1 (EAAC1). Mol Pharmacol 1996, 49:465-473 [PubMed] [Google Scholar]
- 21.Sims KD, Straff DJ, Robinson MB: Platelet-derived growth factor rapidly increases activity and cell surface expression of the EAAC1 subtype of glutamate transporter through activation of phosphatidylinositol 3-kinase. J Biol Chem 2000, 275:5228-5237 [DOI] [PubMed] [Google Scholar]
- 22.Brooks-Kayal AR, Munir M, Jin H, Robinson MB: The glutamate transporter, GLT-1, is expressed in cultured hippocampal neurons. Neurochem Int 1998, 33:95-100 [DOI] [PubMed] [Google Scholar]
- 23.Racine RJ: Modification of seizure activity by electrical stimulation. II. Motor seizure. Electroencephalogr Clin Neurophysiol 1972, 32:281-294 [DOI] [PubMed] [Google Scholar]
- 24.Fukamachi S, Furuta A, Ikeda T, Ikenoue T, Kaneoka T, Rothstein JD, Iwaki T: Altered expressions of glutamate transporter subtypes in rat model of neonatal cerebral hypoxia-ischemia. Dev Brain Res 2001, 132:131-139 [DOI] [PubMed] [Google Scholar]
- 25.Chomczynski P, Sacchi N: Single-step method of RNA isolation by acid guanidinium thiocyanate-phenol-chloroform extraction. Anal Biochem 1987, 162:156-159 [DOI] [PubMed] [Google Scholar]
- 26.Suzuki SO, Iwaki T: Non-isotopic in situ hybridization of CD44 transcript in formalin-fixed paraffin-embedded sections. Brain Res Protoc 1999, 4:29-35 [DOI] [PubMed] [Google Scholar]
- 27.Furuta A, Iida T, Nakabeppu Y, Iwaki T: Expression of hMTHI in the hippocampi of control and Alzheimer’s disease. NeuroReport 2001, 12:2895-2899 [DOI] [PubMed] [Google Scholar]
- 28.Noda M, Nakanishi H, Akaike N: Glutamate release from microglia via glutamate transporter is enhanced by amyloid-beta peptide. Neuroscience 1999, 92:1465-1474 [DOI] [PubMed] [Google Scholar]
- 29.Noda M, Nakanishi H, Nabekura J, Akaike N: AMPA-kainate subtypes of glutamate receptor in rat cerebral microglia. J Neurosci 2000, 20:251-258 [DOI] [PMC free article] [PubMed] [Google Scholar]
- 30.Min BI, Kim CJ, Rhee JS, Akaike N: Modulation of glycine-induced chloride current in acutely dissociated rat periaqueductal gray neurons by mu-opioid agonist, DAGO. Brain Res 1996, 734:72-78 [PubMed] [Google Scholar]
- 31.Szatkowski M, Barbour B, Attwell D: Non-vesicular release of glutamate from glial cells by reversed electrogenic glutamate uptake. Nature 1990, 348:443-446 [DOI] [PubMed] [Google Scholar]
- 32.Santos MS, Barbosa J, Jr, Veloso GS, Ribeiro F, Kushmerick C, Gomez MV, Ferguson SS, Prado VF, Prado MA: Trafficking of green fluorescent protein tagged-vesicular acetylcholine transporter to varicosities in a cholinergic cell line. J Neurochem 2001, 78:1104-1113 [DOI] [PubMed] [Google Scholar]
- 33.Daniels GM, Amara SG: Regulated trafficking of the human dopamine transporter. Clathrin-mediated internalization and lysosomal degradation in response to phorbol esters. J Biol Chem 1999, 274:35794-35801 [DOI] [PubMed] [Google Scholar]
- 34.Donaldson JG, Lippincott-Schwartz J: Sorting and signaling at the Golgi complex. Cell 2000, 101:693-696 [DOI] [PubMed] [Google Scholar]
- 35.Pristupa ZB, McConkey F, Liu F, Man HY, Lee FJ, Wang YT, Niznik HB: Protein kinase-mediated bidirectional trafficking and functional regulation of the human dopamine transporter. Synapse 1998, 30:79-87 [DOI] [PubMed] [Google Scholar]
- 36.Melikian HE, Buckley KM: Membrane trafficking regulates the activity of the human dopamine transporter. J Neurosci 1999, 19:7699-7710 [DOI] [PMC free article] [PubMed] [Google Scholar]
- 37.Lin CI, Orlov I, Ruggiero AM, Dykes-Hoberg M, Lee A, Jackson M, Rothstein JD: Modulation of the neuronal glutamate transporter EAAC1 by the interacting protein GTRAP3–18. Nature 2001, 410:84-88 [DOI] [PubMed] [Google Scholar]
- 38.Kanai Y, Nussberger S, Romero MF, Boron WF, Hebert SC, Hediger MA: Electrogenic properties of the epithelial and neuronal high affinity glutamate transporter. J Biol Chem 1995, 270:16561-16568 [DOI] [PubMed] [Google Scholar]