

Abstract
Diffuse astrocytoma of World Health Organization (WHO) grade II has an inherent tendency to spontaneously progress to anaplastic astrocytoma (WHO grade III) and/or glioblastoma (WHO grade IV). The molecular basis of astrocytoma progression is still poorly understood, in particular with respect to the progression-associated changes at the mRNA level. Therefore, we compared the transcriptional profile of approximately 6800 genes in primary WHO grade II gliomas and corresponding recurrent high-grade (WHO grade III or IV) gliomas from eight patients using oligonucleotide-based microarray analysis. We identified 66 genes whose mRNA levels differed significantly (P < 0.01, ≥2-fold change) between the primary and recurrent tumors. The microarray data were corroborated by real-time reverse transcription-polymerase chain reaction analysis of 12 selected genes, including 7 genes with increased expression and 5 genes with reduced expression on progression. In addition, the expression of these 12 genes was determined in an independent series of 43 astrocytic gliomas (9 diffuse astrocytomas, 10 anaplastic astrocytomas, 17 primary, and 7 secondary glioblastomas). These analyses confirmed that the transcript levels of nine of the selected genes (COL4A2, FOXM1, MGP, TOP2A, CENPF, IGFBP4, VEGFA, ADD3, and CAMK2G) differed significantly in WHO grade II astrocytomas as compared to anaplastic astrocytomas and/or glioblastomas. Thus, we identified and validated a set of interesting candidate genes whose differential expression likely plays a role in astrocytoma progression.
Diffusely infiltrating astrocytic gliomas are the most common primary brain tumors in adults. 1 These tumors usually recur after neurosurgical resection due to their infiltrative growth pattern which renders complete tumor removal impossible. On recurrence, a significant percentage of primary World Health Organization (WHO) grade II astrocytomas spontaneously progress to anaplastic astrocytomas (WHO grade III) or glioblastomas (WHO grade IV). This malignant progression is of paramount clinical importance because it represents the main cause of tumor-related death in astrocytoma patients. 2,3 The molecular mechanisms underlying the progression from primary WHO grade II astrocytomas to secondary high-grade astrocytomas of WHO grade III or IV are still poorly understood. Previous studies have mainly focused on alterations at the chromosomal and/or genetic levels. 1,4 Diffuse astrocytomas of WHO grade II are characterized by frequent TP53 mutation, LOH on 17p, and gain of chromosome 7 or 7q. Anaplastic astrocytomas additionally demonstrate frequent allelic loss on 9p, 13q, and 19q, with important target genes being CDKN2A, CDKN2B, and p14ARF at 9p21 as well as the retinoblastoma gene (RB1) at 13q14. Glioblastomas carry complex genetic aberrations resulting in the inactivation of various tumor suppressor genes, such as PTEN, TP53, RB1, CDKN2A, CDKN2B, and p14ARF, as well as the amplification of different proto-oncogenes, most commonly the EGFR, CDK4, MDM2, and PDGFRA genes. 1,4 Interestingly, the incidence of certain genetic alterations differs between so-called secondary glioblastomas, ie, glioblastomas that developed from a pre-existing glioma of WHO grade II or III, and so-called primary glioblastomas, ie, glioblastomas that developed de novo with a short clinical history and without a pre-existing tumor. 5 TP53 mutation and LOH on 17p, 10q, and 19q are more common in secondary glioblastomas, whereas EGFR amplification, MDM2 amplification, monosomy 10, and PTEN mutation are more common in primary glioblastomas. 5 At the functional level, primary and secondary glioblastomas share common features, including the impairment of p53 function by either TP53 mutation, amplification of MDM2 or MDM4, or inactivation of p14ARF. 1,6 In addition, pRb-dependent cell cycle control is altered in both glioblastoma types by either amplification of CDK4, CDK6, CCND1, or CCND3, homozygous deletion or hypermethylation of CDKN2A and CDKN2B, or alteration of RB1. 1,7 Clinically, patients with secondary glioblastoma have a similarly poor prognosis as age-matched patients with primary glioblastoma. 8
In contrast to the increasing knowledge about the genetic aberrations in astrocytic gliomas, relatively little is known about the changes at the transcript level that are associated with spontaneous astrocytoma progression. To better understand the molecular basis of this important phenomenon, we analyzed pairs of primary WHO grade II and recurrent WHO grade III or IV gliomas from eight individual patients for the expression of approximately 6800 genes using oligonucleotide-based microarray technology. The microarray results for 12 selected candidate genes were confirmed by real-time RT-PCR analyses, and the expression profile of these selected genes was additionally determined in an independent series of 43 astrocytic gliomas of WHO grades II to IV. Using this approach we identified a number of interesting and mostly novel candidate genes whose expression was associated with the malignancy grade of astrocytic gliomas.
Materials and Methods
Tumor Samples
Frozen tumor samples from eight patients operated on for primary low-grade (WHO grade II) gliomas that spontaneously recurred as high-grade gliomas of WHO grade III or IV were selected from the archives of the Department of Neuropathology, Heinrich-Heine-University, Düsseldorf, and the Department of Neuropathology, Ruprecht-Karls-University, Heidelberg, Germany (Table 1) ▶ . In addition, we chose frozen tumor samples from 36 primary astrocytic gliomas (9 astrocytomas, 10 anaplastic astrocytomas, 17 primary glioblastomas) and 7 secondary glioblastomas from the files of the Department of Neuropathology, Heinrich-Heine-University. Except for one secondary glioblastoma, none of the investigated tumors, including 10 of 11 secondary glioblastomas, had been irradiated or treated by chemotherapy before the operation. All tumors were histologically classified according to the WHO classification of tumors of the central nervous system. 9 Parts of each tumor were frozen immediately after operation and stored at −80°C. A tumor cell content of at least 80% was histologically confirmed for each specimen.
Table 1.
Summary of Genetic Alterations Identified in Pairs of Primary Low-Grade and Recurrent High-Grade Gliomas from Eight Patients
| Patient | Case no. | Diagnosis | Age (years) | Sex | Interval (months) | TP53 mutation | PTEN mutation | p14ARF homo. del. | CDKN2A homo. del. | CDKN2B homo. del. | CDK4 amp. | EGFR amp. | MDM2 amp. | LOH 1p | LOH 9p | LOH 10q | LOH 17p | LOH 19q |
|---|---|---|---|---|---|---|---|---|---|---|---|---|---|---|---|---|---|---|
| 1 | A72D | All | 43 | m | 66 | g.13999Δg: 5′-splice site | − | − | − | − | − | − | − | − | − | − | + | + |
| GB239D | sGBIV | 49 | g.13999Δg: 5′-splice site | − | + | + | + | − | − | − | − | + | − | + | + | |||
| 2 | A128D | All | 34 | m | 14 | g.14070C>T: R248W | − | − | − | − | − | − | − | − | − | + | + | − |
| GB119D | sGBIV | 36 | g.14070C>T: R248W | − | + | + | + | − | − | − | + | + | + | + | − | |||
| 3 | A201D | All | 38 | f | 70 | g.13418T>A: Y220N | − | − | − | − | − | − | − | − | − | + | + | − |
| GB240D | sGBIV | 44 | g.13418T>A: Y220N | − | − | − | − | − | − | − | − | + | + | + | − | |||
| 4 | A8D | AII | 32 | m | 18 | − | − | − | − | − | − | − | − | − | − | − | + | − |
| AA106D | AAIII | 34 | − | − | − | − | − | − | − | − | − | − | − | + | − | |||
| 5 | A181D | AII | 28 | f | 36 | − | − | − | − | − | − | − | − | − | − | − | − | − |
| AOA54D | AOAIII | 31 | − | − | − | − | − | − | − | − | − | − | − | − | − | |||
| 6 | A145D | AII | 25 | m | 52 | − | − | − | − | − | − | − | − | − | − | − | + | − |
| AA142D | AAIII | 29 | − | − | − | − | − | − | − | − | − | − | − | + | − | |||
| 7 | OA23D | OAII | 61 | m | 6 | − | − | − | − | − | − | − | − | − | − | − | − | − |
| GB175D | sGBIV | 62 | − | − | + | + | − | − | − | − | − | − | − | − | − | |||
| 8 | OA31D | OAII | 43 | m | 26 | − | − | − | − | − | − | − | − | − | − | − | + | + |
| AOA38D | AOAIII | 45 | − | − | − | − | − | + | − | − | − | − | + | + | + |
m, male; f, female; homo. del., homozygous deletion; amp., gene amplification. +, aberration detected; −, no aberration detected. AII, diffuse astrocytoma WHO grade II; AAIII, anaplastic astrocytoma WHO grade III; sGBIV, secondary glioblastoma WHO grade IV; OAII, oligoastrocytoma WHO grade II; AOAIII, anaplastic oligoastrocytoma WHO grade III.
DNA and RNA Extraction
DNA and RNA were extracted from unfixed frozen tumor tissue as reported. 10 In brief, tumor samples were homogenized in 6 ml 4 mol/L guanidine isothiocyanate solution. The homogenate was then layered over 4 ml CsCl and ultracentrifuged at 170,000 × g for 16 hours. The RNA was recovered as a pellet and dissolved in diethylpyrocarbonate-treated water containing the RNase inhibitor RNasin (Promega, Mannheim, Germany). The DNA was purified from the CsCl phase using proteinase K digestion followed by phenol/chloroform extraction. DNA extraction from leukocytes was performed according to a standard protocol. 11
Single-Strand Conformation Polymorphism (SSCP) Analysis
The TP53 gene (exons 4–10) and the PTEN gene (exons 1–9) were screened for mutations by SSCP analysis as reported elsewhere. 12,13 The respective primer sequences are available as supplementary information at http://dot.ped.med.umich.edu:2000/pub/glioma/index.html.
PCR products showing aberrant band patterns were sequenced in both directions using cycle sequencing (BigDye cycle sequencing kit; Applied Biosystems, Foster City, CA), and an ABI PRISM 377 semiautomated DNA sequencer (Applied Biosystems).
Duplex PCR Analysis
MDM2, CDK4, EGFR, FOXM1, MGP, COL4A2, CENPF, and TOP2A were analyzed for gene amplification, while CDKN2A, CDKN2B, and p14ARF were studied for homozygous deletion by duplex PCR assays as reported elsewhere. 14,15 For primer sequences see http://dot.ped.med.umich.edu:2000/pub/glioma/index.html. The PCR products were resolved on 3% agarose gels and the ethidium bromide-stained bands were recorded using the Gel-Doc 1000 system (Bio-Rad, Hercules, CA). Quantitative analysis of the signals obtained for the target and the reference genes was performed with the Molecular-Analyst software (Bio-Rad). Increases in the target/reference gene ratio of more than threefold of the ratio obtained for the constitutional DNA were considered as evidence for gene amplification. Reduction in the target/reference gene ratio below 0.3-fold was considered as a homozygous deletion.
LOH Analysis
The details of the method used to assess microsatellite loci from chromosomes 1, 9p, 10q, 17p, and 19q for loss of heterozygosity (LOH) are reported elsewhere. 16 The following 25 microsatellite loci were studied: D1S468 (1p36), D1S2642 (1p36), D1S496 (1p32), D1S515 (1p22), D1S235 (1q43), D9S178 (9p22), D9S1748 (9p21), D9S157 (9p21), D9S162 (9p21), D9S171 (9p13), D10S215 (10q23), D10S541 (10q24), D10S209 (10q25), D10S587 (10q25), D10S212 (10q26), D17S796 (17p13), D17S938 (17p13), D17S786 (17p13), D17S936 (17p11), D17S947 (17p11), D17S953 (17p11), D19S210 (19q13.4), D19S572 (19q13.3), D19S219 (19q13.1), and D19S217 (19q13.1).
Southern Blot Analysis
Probes corresponding to nucleotides 3718 to 3840 of FOXM1 (GenBank accession number AC005841) and nucleotides 213 to 316 of MGP (GenBank accession number XM_041097) were generated by PCR from non-neoplastic brain cDNA. For the assessment of DNA loading, the Southern blots were hybridized with a plasmid probe (pYNH24, obtained from American Type Culture Collection) against the variable number of tandem repeats locus D2S44 on 2q21.3-q22. For Southern blotting, 2.5 μg DNA of tumor and corresponding leukocyte DNA were digested with the restriction enzyme TaqI, resolved on 0.8% agarose gels, and blotted to Hybond-N+ membranes (Amersham-Buchler, Braunschweig, Germany). The Southern membranes were then hybridized with probes for FOXM1, MGP, and the reference locus D2S44. Hybridized blots were exposed to imaging screens and analyzed with the Fuji BioImager 1800 II (Fuji, Kanagawa, Japan). Densitometric evaluation was performed using the Aida Image Analyzer v.3.11 software (Raytest, Straubenhardt, Germany).
Microarray Analysis
Five micrograms of total RNA was converted into double-stranded cDNA by reverse transcription using a cDNA synthesis kit (Superscript Choice System; Invitrogen, Carlsbad, CA) with an oligo(dT)24 primer containing a T7 RNA polymerase promoter site added 3′ of the poly T (Genset, La Jolla, CA). Following second-strand synthesis, labeled cRNA was generated from the cDNA sample by an in vitro transcription reaction supplemented with biotin-11-CTP and biotin-16-UTP (Enzo, Farmingdale, NY). The labeled cRNA was purified by using RNeasy spin columns (Qiagen, Hilden, Germany). 15 μg of each cRNA was fragmented at 94°C for 35 minutes in fragmentation buffer (40 mmol/L Tris-acetate, pH 8.1, 100 mmol/L potassium acetate, 30 mmol/L magnesium acetate) and then used to prepare 300 μl of hybridization cocktail (100 mmol/L MES, 1 mol/L NaCl, 20 mmol/L ethylenediaminetetraacetate, 0.01% Tween 20) containing 0.1 mg/ml of herring sperm DNA (Promega, Madison, WI), 500 μg/ml acetylated bovine serum albumin (Gibco BRL, Gaithersburg, MD) and a mixture of control cRNAs for comparison of hybridization efficiency between arrays and for relative quantitation of measured transcript levels. Before hybridization, the cocktails were heated to 94°C for 5 minutes, equilibrated at 45°C for 5 minutes, then clarified by centrifugation (16,000 × g) at room temperature for 5 minutes. Aliquots of each sample (10 μg of fragmented cRNA in 200 μl of hybridization cocktail) were hybridized to HuGeneFL microarrays (Affymetrix, Santa Clara, CA) at 45°C for 16 hours in a rotisserie oven set at 60 rpm. The arrays were then washed with non-stringent wash buffer [6X saline-sodium phosphate EDTA (SSPE)] at 25°C, followed by stringent wash buffer (100 mmol/L MES pH 6.7, 0.1 mol/L NaCl, 0.01% Tween 20) at 50°C, stained with streptavidin-phycoerythrin (Molecular Probes, Eugene, OR), washed again with 6X SSPE, stained with biotinylated anti-streptavidin IgG, followed by a second staining with streptavidin-phycoerythrin, and a third washing with 6X SSPE. The microarrays were scanned and probe intensities extracted from the image (GeneArray scanner and Microarray Suite 4.0; Affymetrix). Each probe set on the arrays typically consists of twenty 25-base oligonucleotides complementary to a specific cDNA called perfect match (PM) features, and twenty identical probes whose sequence has been altered at the central base, called mismatch (MM) features. Publicly available software was used to process the probe intensities to obtain normalized probe-set intensities as follows (see http://dot.ped.med.umich.edu:2000/pub/glioma/index.html). The microarray for a primary WHO grade II astrocytoma (A201D) was selected as the standard. Probe-pairs with PM-MM < −200 on the standard were removed from the analysis and the remaining PM-MM differences averaged for each probe set on each microarray by discarding the 25% highest and lowest differences, followed by averaging the remaining differences. Intensity values on the standard were scaled to give an average of 1500 units. The intensities for the remaining arrays were normalized to the standard using a piecewise linear function that made 99 evenly spaced quantiles agree with the corresponding quantiles in the distribution of the standard. Normalized intensities were log-transformed by mapping x to log(max(x + 100,0) +100). Fold changes were computed as the ratio of group means, after first replacing means that were less than 100 by 100. Algorithms for computing the gene identifiers by homology of the probe-set sequences to sequences that were members of Unigene clusters are also available http://dot.ped.med.umich.edu:2000/pub/glioma/index.html.
Real-Time RT-PCR Analysis
The expression levels of 12 selected genes were determined by real-time RT-PCR analysis using the ABI PRISM 5700 (Applied Biosystems) sequence detection system (for primer sequences see http://dot.ped.med.umich.edu:2000/pub/glioma/index.html). Continuous quantitative measurement of the PCR product was achieved by incorporation of SYBR Green fluorescent dye (Applied Biosystems) into the double-stranded DNA. The transcript level of each gene was normalized to the transcript level of ARF1 (ADP-ribosylation factor 1). As reference tissues, we used non-neoplastic cerebral tissue samples (temporal cortex and white matter) from two different patients.
Results
Histological and Molecular Genetic Findings
The glioma pairs studied by microarray analysis comprised the primary low-grade tumors (6 astrocytomas, and 2 oligoastrocytomas that were histologically astrocytoma-predominant) and the corresponding high-grade recurrences (4 secondary glioblastomas, 2 anaplastic astrocytomas, and 2 anaplastic oligoastrocytomas) from eight patients (Table 1 ▶ ; Figure 1, a and b ▶ ). Molecular genetic analysis revealed TP53 mutations in the tumors of patients 1 to 3. In each case, identical mutations were present in the corresponding primary and recurrent tumors (Table 1 ▶ ; Figure 1c ▶ ). Allelic losses on 17p were found in 6 glioma pairs, including the 3 cases with a demonstrated TP53 mutation (Table 1) ▶ . The recurrent gliomas from patients 1, 2, and 7 (GB239D, GB119D, and GB175D) had homozygous deletions on 9p involving CDKN2A, p14ARF, and CDKN2B (GB239D, GB119D) or CDKN2A and p14ARF (GB175D). The corresponding primary tumors did not carry these deletions (Figure 1e) ▶ . Similarly, LOH at microsatellite loci from 9p was found in 3 recurrent glioblastomas (GB239D, GB119D, and GB240D) but not in the respective primary gliomas (Figure 1d ▶ ; Table 1 ▶ ). The CDK4 gene was amplified in the recurrent tumor of patient 8 (AOA38D). LOH on 10q was found in tumors from three patients, affecting both primary and recurrent tumors in patients 2 and 3 (Figure 1d) ▶ , and the recurrent tumor in patient 8. PTEN mutations or amplification of EGFR or MDM2 were not detected (Table 1) ▶ . None of the tumors, including the two oligoastrocytomas, showed combined LOH on 1p and 19q.
Figure 1.
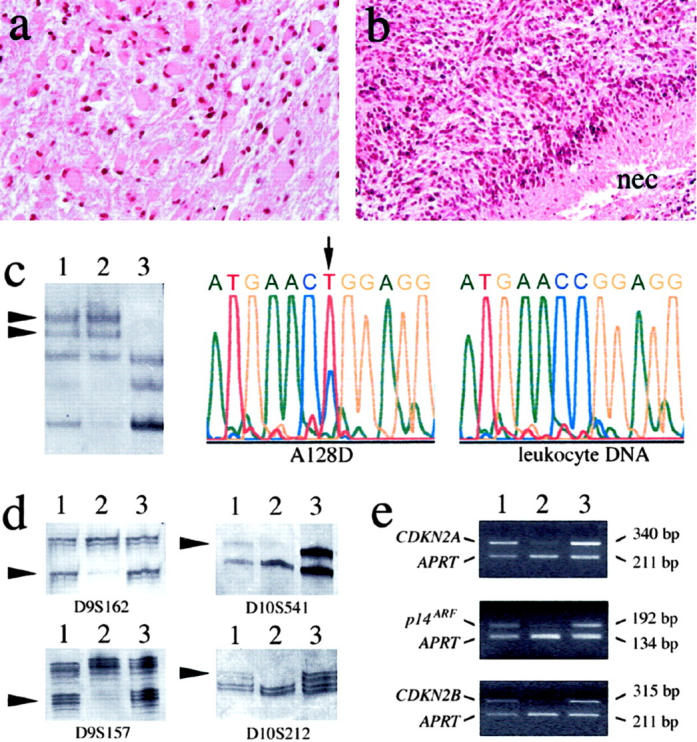
a and b: Histological features of the primary and recurrent glioma of patient 2 on hematoxylin-eosin stained sections. a: The primary tumor (A128D) was a gemistocytic astrocytoma (WHO grade II). b: The recurrent tumor (GB119D) displayed increased cellularity, high mitotic activity, microvascular proliferation, and pseudopalisading necroses (nec). This tumor was classified as glioblastoma (WHO grade IV). c to e: Examples of molecular genetic results obtained for these tumors (lane 1, A128D; lane 2, GB119D; lane 3, leukocyte DNA from patient 2). c: SSCP analysis of TP53 showed identical aberrant band patterns in A128D and GB119D. DNA sequencing revealed the same somatic TP53 mutation (g.14070C>T; R248W) in both tumors. Shown are the mutant sequence in A128D and the wild-type sequence in the corresponding leukocyte DNA. d: Microsatellite analysis of polymorphic loci from 9p (D9S162 and D9S157) revealed LOH only in GB119D but not in A128D. LOH on 10q was detectable in both tumors, as indicated for the loci D10S541 and D10S212. However, the fraction of tumor cells with LOH on 10q appeared to be higher in GB119D than in A128D (arrowheads point to the alleles lost in the tumor DNA). e: Duplex PCR analysis demonstrated homozygous deletion of CDKN2A, p14ARF and CDKN2B in GB119D but not in A128D. The sizes of the respective PCR fragments amplified from each of these genes and the reference gene APRT are indicated on the right side.
The independent series of 43 astrocytic gliomas consisted of 9 astrocytomas (WHO grade II), 10 anaplastic astrocytomas, 17 primary glioblastomas, and 7 secondary glioblastomas. Molecular genetic analysis revealed TP53 mutations in 5 of 8 astrocytomas, 4 of 10 anaplastic astrocytomas, 2 of 17 primary glioblastomas, and 4 of 7 secondary glioblastomas. PTEN mutations were detected in 5 primary glioblastomas (29%) but in none of the secondary glioblastomas. Three of 17 primary glioblastomas (18%) and 5 of 7 secondary glioblastomas carried homozygous CDKN2A deletions. Gene amplification affected EGFR in 8 of 17 primary glioblastomas and 1 of 10 anaplastic astrocytomas, CDK4 in 1 of 10 anaplastic astrocytomas, 1 of 17 primary glioblastomas and 1 of 7 secondary glioblastomas, as well as MDM2 in 1 of 10 anaplastic astrocytomas and 1 of 17 primary glioblastomas.
Results of Microarray Analyses
Microarrays with 7129 probe sets were used to assess transcript levels in pairs of primary WHO grade II and recurrent WHO grade III or IV gliomas from eight patients (Table 1) ▶ . To judge whether the overall patterns of expression indicated differences between primary and recurrent samples, we selected 1400 variable probe sets, by criteria which did not use any sample information, and performed principal components and clustering analyses (Figure 2) ▶ . The recurrent tumors of patients 3, 4, and 5 (GB240D, AA106D, and AOA54D) group with the primary tumors and the recurrent tumor of patient 6 falls the next closest to the location of primary tumors in the first two principal axes (Figure 2) ▶ . Thus, the overall expression patterns did not completely separate the primary low-grade from the recurrent high-grade tumors. To address our main interest in distinguishing between primary and recurrent tumors, we performed paired t-tests on the log-transformed data for the 8 tumor pairs, which yielded 266 probe sets with P < 0.01. Since approximately one-quarter of these could be false positives (expecting 71 = 7129*.01 probe sets with P < 0.01 by chance), we further reduced the set to just those 70 probe sets (corresponding to 66 different genes) that also showed at least a two-fold change between the two sets of 8 tumors, using a conservative fold change index. We performed permutation testing by forming 127 datasets similar to our data except that all possible combinations of the pairs of samples had their labels switched. We found that on average these permuted data sets gave only 5.9 probe sets meeting our selection criteria (of P < 0.01 and ≥2-fold change), so that we expect approximately 6 of our 70 selected probe sets to be false positives. The identity of the 70 selected probe sets and a heat map of the data for each sample are shown in Figure 3 ▶ . From the heat map it can be seen that the selected probe sets often show a pattern of expression recapitulating the overall views shown in Figure 2 ▶ , with the recurrent tumors of patients 3 through 6 showing less difference from the primary tumors than the other 4 recurrent tumors. Most of the 23 genes identified as showing significantly increased expression on glioma progression encode either proliferation-related proteins (eg, FOXM1, TOP2A, CDC20, MCM6, KNSL6, TFRC, and MCM4) or proteins associated with extracellular matrix formation and/or angiogenesis (eg, COL4A2, COL4A1, ACTA2, MGP, COL5A2, JAG1, and BGN). The 43 genes that showed significantly decreased expression on glioma progression were more heterogeneous with respect to the functions of their gene products. Some of these genes have been implicated in extracellular matrix formation, cell adhesion and/or cell motility (eg, SELL, SELPLG, CD37, TJP2, ITGAM, and GSN), while others are important in the development of the nervous system (eg, MAP1A, ID1, SEMA3B, and NTRK2) or signal transduction (eg, GJA1, CAMK2G, MAP3K5, ARL3, S100A13, and ACCN2).
Figure 2.

Results of principal components and cluster analyses of the microarray expression data obtained for the 8 pairs of primary and recurrent gliomas. a: 1400 probe sets with mean >200 and coefficient of variation (SD/mean) >0.5 were standardized by subtracting the mean and dividing by the SD for each probe-set. The first two principal components are plotted. b: Dendrogram from average clustering 56 using the same 1400 probe sets, transformed by taking the logs of ratios to the mean. Each tumor sample is labeled with the corresponding patient number supplemented by P (primary tumor) or R (recurrent tumor). In b, each tumor is additionally labeled by its tumor number and histological diagnosis (in brackets). The abbreviations used are: AII, diffuse astrocytoma WHO grade II; AAIII, anaplastic astrocytoma WHO grade III; sGBIV, secondary glioblastoma WHO grade IV; OAII, oligoastrocytoma WHO grade II; AOAIII, anaplastic oligoastrocytoma WHO grade III.
Figure 3.
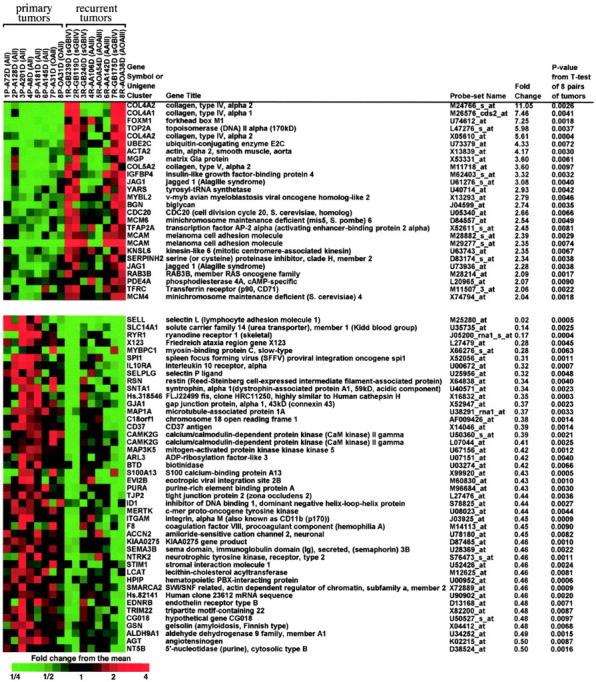
The 70 probe sets (corresponding to 66 genes) that gave a P value of <0.01 for paired t-test comparing the 8 pairs of primary and recurrent tumors and that also had greater than two-fold differences between the means for primary and recurrent tumors. The heat map was made using Treeview. 56 The individual case numbers and diagnoses are given on top of the heat map (the abbreviations correspond to those in Figure 2 ▶ ).
Results of Real-Time RT-PCR Analyses
From the set of differentially expressed genes showing P values <0.01 for the paired t-test and ≥2-fold change in the mean expression level, we selected 8 genes with significantly increased (COL4A2, FOXM1, TOP2A, MGP, and IGFBP4) or decreased (SELL, RYR1, and CAMK2G) expression for corroborative analyses by real-time RT-PCR. The genes ADD3 and ABLIM, which also demonstrated P values <0.01 but had little less than two-fold changes in the mean expression level, were additionally chosen for real-time RT-PCR analysis because they represented interesting candidates from 10q. We further selected the genes CENPF and VEGFA for real-time RT-PCR analysis because these showed very large increases in expression in the secondary glioblastomas as compared to the primary WHO grade II tumors, albeit not reaching a P value <0.01 on statistical analysis of the entire group of tumors. The data from the real-time RT-PCR assays for these 12 selected genes, as well as their correlations to the respective expression data obtained by microarray analysis are summarized in Table 2 ▶ . Correlations between the two methods were large for most genes measured, which generally validated the array technique. The respective P values for comparing primary and recurrent tumors using real-time RT-PCR data were significant at the 0.05 level with the exception of ABLIM and VEGFA (Table 2) ▶ .
Table 2.
Comparison of the Data Obtained for 12 Selected Genes by Microarray Analysis and Real-Time RT-PCR in Eight Pairs of Primary Low-Grade and Recurrent High-Grade Gliomas
| Affymetrix probe-set name | Gene | Microarray data | Real-time RT-PCR data | Microarray vs real-time correlation | ||||||
|---|---|---|---|---|---|---|---|---|---|---|
| Primary tumor means | Recurrent tumor means | Ratio of means | Paired t-test P-value* | Primary tumor means | Recurrent tumor means | Ratio of means | Paired t-test P-Value | |||
| U74612_at | FOXMI | 28 | 725 | 25.8 | 0.0018 | 2.2 | 4.8 | 2.2 | 0.0219 | 0.81 |
| M27281_at | VEGFA | 163 | 2909 | 17.8 | 0.0485 | 1.6 | 6.3 | 4.0 | 0.1523 | 0.91 |
| L47276_s at | TOP2A | 68 | 598 | 8.8 | 0.0037 | 97 | 1422 | 14.6 | 0.0276 | 0.89 |
| J04088_at | TOP2A | 138 | 1067 | 7.7 | 0.0211 | 97 | 1422 | 14.6 | 0.0276 | 0.96 |
| M24766 s at | COL4A2 | 561 | 6199 | 11.0 | 0.0026 | 6.1 | 48 | 7.8 | 0.0045 | 0.77 |
| X05610_at | COL4A2 | 2318 | 13012 | 5.6 | 0.0004 | 6.1 | 48 | 7.8 | 0.0045 | 0.87 |
| M62403 s at | IGFBP4 | 680 | 2258 | 3.3 | 0.0032 | 5.4 | 18 | 3.3 | 0.0084 | 0.86 |
| U30872_at | CENPF | 78 | 440 | 5.7 | 0.0276 | 12 | 153 | 12.8 | 0.0262 | 0.84 |
| X53331 at | MGP | 1611 | 5804 | 3.6 | 0.0061 | 1.9 | 7.8 | 4.1 | 0.0129 | 0.80 |
| M25280_at | SELL | 4229 | 72 | 0.02 | 0.0005 | 88 | 6.6 | 0.07 | 0.0016 | 0.98 |
| J05200 mal s at | RYRI | 868 | 145 | 0.17 | 0.0004 | 41 | 8.0 | 0.19 | 0.0008 | 0.48 |
| U50360_s at | CAMK2G | 1279 | 498 | 0.39 | 0.0021 | 0.75 | 0.34 | 0.45 | 0.0110 | 0.73 |
| L07044 at | CAMK2G | 2614 | 1066 | 0.41 | 0.0025 | 0.75 | 0.34 | 0.45 | 0.0110 | 0.84 |
| U37122_at | ADD3 | 5106 | 2809 | 0.55 | 0.0025 | 1.7 | 0.76 | 0.44 | 0.0013 | 0.88 |
| D31883 at | ABLIM | 9316 | 6414 | 0.69 | 0.0044 | 3.5 | 1.8 | 0.51 | 0.0769 | 0.79 |
*Paired t-tests for eight pairs of tumors on log-transformed data.
Table 3 ▶ summarizes the results of real-time RT-PCR analyses of the 12 selected genes in an independent set of 43 gliomas (for the respective heat map see supplementary information at http://dot.ped.med.umich.edu:2000/pub/glioma/index.html). These were divided into four diagnostic groups: astrocytomas WHO grade II, anaplastic astrocytomas, primary glioblastomas, and secondary glioblastomas. Significantly different mRNA levels in the astrocytoma group versus the anaplastic astrocytoma and/or glioblastoma groups could be confirmed for 9 of 12 genes. According to our results, WHO grade II astrocytomas differ from anaplastic astrocytomas and glioblastomas by having significantly lower transcript levels of FOXM1, TOP2A, COL4A2, CENPF, and MGP as well as higher levels of ADD3 mRNA. The mRNA levels of VEGFA and IGFBP4 were significantly higher in glioblastomas than in astrocytomas and anaplastic astrocytomas, while there was no significant difference between astrocytomas and anaplastic astrocytomas in VEGFA and IGFBP4 expression. CAMK2G transcript levels differed significantly only between astrocytomas and glioblastomas but not between astrocytomas and anaplastic astrocytomas or anaplastic astrocytomas and glioblastomas. Four of the genes showed significantly higher mRNA levels in glioblastomas versus anaplastic astrocytomas, namely VEGFA, IGFBP4, TOP2A, and CENPF. In case of CENPF and TOP2A, this difference was mainly due to a significantly higher expression of these genes in secondary glioblastomas as compared to primary glioblastomas, which showed nearly identical mean expression values as the anaplastic astrocytoma samples. While the data for SELL and RYR1 obtained for the second series of tumors did not validate the findings from microarray and real-time RT-PCR assays on the initial tumor set, the real-time RT-PCR data were still significant for these genes in comparisons of astrocytomas versus anaplastic astrocytomas or secondary glioblastomas when the initial samples were included. We are not able to tell if the high levels of these two mRNAs in the initial low-grade tumors are informative with regard to future recurrence, or merely an accidental feature of these particular tumors, since these genes were selected on the basis of this tumor subset.
Table 3.
Summary of the Data Obtained by Real-Time RT-PCR Analysis of 12 Selected Genes in an Independent Series of 43 Astrocytic Gliomas
| Gene | Means in each diagnostic group* | P values for selected comparisons using one-way analysis of variance models on log-transformed data† | ||||||
|---|---|---|---|---|---|---|---|---|
| AII (n = 9) | AAIII (n = 10) | pGBIV (n = 17) | sGBIV (n = 7) | AII vs. AAIII | AII vs. GBIV | AAIII vs. GBIV | pGBIV vs. sGBIV | |
| FOXMI | 1.65 | 5.38 | 3.99 | 5.79 | 0.0118 | 0.0317 | >.2 | >.2 |
| VEGFA | 1.21 | 2.34 | 9.33 | 5.77 | >.2 | 0.0004 | 0.0023 | 0.0590 |
| TOP2A | 7.82 | 22.47 | 22.36 | 193.53 | 0.0233 | 0.0000 | 0.0140 | 0.0001 |
| COL4A2 | 16.38 | 27.78 | 46.53 | 33.91 | 0.0402 | 0.0030 | >.2 | >.2 |
| IGFBP4 | 4.91 | 8.93 | 16.58 | 10.00 | >.2 | 0.0073 | 0.0154 | >.2 |
| CENPF | 10.05 | 29.34 | 31.04 | 127.84 | 0.0332 | 0.0000 | 0.0095 | 0.0040 |
| MGP | 2.43 | 6.66 | 11.19 | 9.91 | 0.0034 | 0.0004 | >.2 | >.2 |
| SELL | 15.07 | 5.36 | 2.81 | 6.09 | >.2 | >.2 | >.2 | >.2 |
| RYRI | 18.12 | 3.03 | 2.23 | 3.51 | >.1 | >.1 | >.2 | >.1 |
| ADD3 | 1.52 | 0.84 | 0.95 | 0.37 | 0.0272 | 0.0113 | >.2 | >.2 |
| CAMK2G | 1.03 | 0.57 | 0.47 | 0.58 | >.1 | 0.0170 | >.2 | >.2 |
| ABLIM | 3.60 | 3.18 | 2.28 | 3.79 | >.2 | >.1 | >.2 | 0.0445 |
*The mean values calculated for the mRNA expression in each group of tumors (astrocytoma WHO grade II, AII; anaplastic astrocytoma WHO grade III, AAIII; primary glioblastoma WHO grade IV, pGBIV; secondary glioblastoma WHO grade IV, sGBIV) are given.
†P values for testing differences between the group means for four comparisons of interest, i.e, AII vs. AAIII, AII vs. all glioblastomas, AAIII vs. all glioblastomas (GBIV), pGBIV vs. sGBIV.
Correlation of Expression Data with Genetic Aberrations
Microarray analysis revealed that the amplification of CDK4 detected in the recurrent tumor of patient 8 (AOA38D) was accompanied by strong overexpression of CDK4 mRNA. Several other genes from 12q13-q14 that reside close to CDK4 were also found to be overexpressed in this tumor, including SAS (sarcoma amplified sequence), TSFM (Ts translation elongation factor, mitochondrial), MARS (methionine-tRNA synthetase), METTL1 (methyltransferase-like 1), PIKE/KIAA0167 (phosphoinositide-3-kinase enhancer), GALGT (β-1,4-N-acetylgalactosaminyltransferase) and PRIM1 (primase polypeptide 1). Thus, these genes are likely to be included in the CDK4 amplicon of AOA38D. A less pronounced increase in the transcript levels of CDK4 and several of the neighboring genes was already noted in the respective primary tumor (OA31D), which did not demonstrate a CDK4 gene amplification detectable by duplex PCR.
Comparison of the real-time RT-PCR data with genetic alterations detected in the 28 investigated glioblastomas (17 primary and 11 secondary glioblastomas) revealed that tumors with TP53 mutation (n = 11) had significantly higher transcript levels of TOP2A (t-test, P < 0.01) and CENPF (P < 0.05) than tumors without TP53 mutation (n = 17). Similarly, glioblastomas with EGFR amplification (n = 8) showed significantly lower expression levels of TOP2A (P < 0.001) and CENPF (P < 0.05) than glioblastomas without EGFR amplification. The association of EGFR amplification and lower expression levels of TOP2A (P < 0.05) but not CENPF (P = 0.8), was also seen when comparing primary glioblastomas with and without EGFR amplification (n = 17). In addition, EGFR amplification in primary glioblastomas was associated with increased expression of ADD3 (P < 0.01) and ABLIM (P < 0.05). The mean VEGFA mRNA level was higher in the primary glioblastomas with EGFR amplification than in the primary glioblastomas without EGFR amplification, but this finding was statistically not significant (P = 0.6).
Analyses for Amplification of Candidate Genes Overexpressed in High-Grade Gliomas
Duplex PCR as well as Southern blot analyses for amplification of the FOXM1 and MGP genes in the 8 glioma pairs and the 24 independent glioblastomas did not demonstrate any amplification of these genes. One secondary glioblastoma (GB15D) and one anaplastic astrocytoma (AA106D) showed increased signal intensities for both FOXM1 and MGP (GB15D) or just FOXM1 (AA106D), suggesting copy number gains of about threefold in these particular tumors. Neither FOXM1 nor MGP was amplified in 3 malignant gliomas with previously demonstrated amplification of the CCND2 gene at 12p13. 7 Duplex PCR analysis of the 8 glioma pairs and the 24 glioblastomas did not show any amplification of COL4A2, CENPF, or TOP2A. A single secondary glioblastoma (GB239D) demonstrated an approximately two-fold relative increase in COL4A2 signal intensity.
Discussion
To further elucidate the molecular mechanisms underlying the spontaneous malignant progression of gliomas, we investigated pairs of primary low-grade and recurrent high-grade gliomas from eight patients for genetic alterations as well as progression-associated changes in mRNA expression patterns. For molecular genetic characterization, all tumors were studied for aberrations of those genes and chromosomes that are known to be commonly involved in either astrocytic or oligodendroglial tumors. 1,4 The results obtained for our tumor series are in line with data from previous studies. 5,12,17 TP53 mutations and/or LOH on 17p were the most common early alterations that were detected in 75% (6 of 8) of the primary tumors. These alterations were preserved in each of the respective recurrent tumors. The two primary oligoastrocytomas included in the study were histologically astrocytoma-predominant and did not carry combined LOH on 1p and 19q. These tumors thus belonged to the genetic subtype of oligoastrocytoma that is related to diffuse astrocytoma rather than to oligodendroglioma. 18 Progression-associated genetic changes were found in all four WHO grade IV recurrences, as well as in one of the four WHO grade III recurrences. Homozygous deletion of CDKN2A and p14ARF was the most common progression-associated abnormality. One recurrent tumor showed amplification and overexpression of the CDK4 gene. These data support other studies reporting that inactivation of the p16INK4a/Cdk4/pRb-dependent pathway is frequent in high-grade gliomas, particularly in glioblastomas. 10,19 The absence of EGFR amplification in secondary glioblastomas 5,12 was confirmed in our present series.
Using oligonucleotide-based microarray analysis, we identified 66 genes that were expressed at significantly different levels between 8 primary low-grade gliomas and the corresponding recurrent high-grade gliomas. Most of these differentially expressed genes encode proteins that may be related to important features of glioma malignancy, such as high proliferative activity, glioma cell migration and/or invasion, as well as aberrant neoangiogenesis. Only a few of these genes have been previously noted to be involved in gliomas. For example, expression of VEGFα is known to be up-regulated in glioblastomas as compared to astrocytomas of WHO grade II or III. 20 In our series, 7 of 8 recurrent gliomas exhibited increased VEGFA mRNA levels as compared to the respective primary tumors. Further analysis of 43 astrocytic gliomas revealed that glioblastomas demonstrate higher VEGFA mRNA levels than astrocytomas and anaplastic astrocytomas, with primary glioblastomas showing even stronger expression than secondary glioblastomas. The latter finding may be related to genetic differences between primary and secondary glioblastomas. For example, PTEN mutation and EGFR amplification, which are common in primary but rare in secondary glioblastomas, may facilitate transcriptional up-regulation of VEGFA. 21-23
Topoisomerase II α (OMIM 162430) is a key enzyme for the regulation of DNA topology and replication. Its expression is up-regulated in proliferating cells. The CENPF gene product, centromeric protein F or mitosin (OMIM 600236), is also expressed in a cell-cycle-dependent manner. 24 Immunohistochemical studies have documented that topoisomerase II α and mitosin expression in gliomas increases with malignancy grade, suggesting that these proteins may be diagnostically useful as proliferation markers. 25,26 We found that TOP2A and CENPF mRNA levels significantly increased with the WHO grade in astrocytic gliomas. Interestingly, secondary glioblastomas demonstrated higher TOP2A and CENPF transcript levels than primary glioblastomas. Whether this finding reflects a higher proliferative activity in secondary glioblastomas remains to be investigated. TOP2A or CENPF gene amplification has been detected in certain epithelial cancers. 27,28 However, we did not find amplification of these genes in our glioma series.
Our microarray analyses identified many novel genes that were not implicated in glioma progression so far. For example, several collagen genes, including COL4A1 (OMIM 120130, 13q34), COL4A2 (OMIM 120090, 13q34), and COL5A2 (OMIM120190, 2q31), showed significantly higher mRNA levels in anaplastic astrocytomas and glioblastomas than in WHO grade II astrocytomas. We selected one of these genes (COL4A2) and confirmed its malignancy-associated expression by real-time RT-PCR. Interestingly, COL4A1 and COL4A2 map very close to each other on 13q34, a chromosomal region that is known to be amplified in a fraction of secondary glioblastomas. 17 However, we found no COL4A2 amplification in any of the glioblastomas from our series. Immunohistochemical analysis of gliomas has revealed that collagens IV and V were mainly expressed in association with the tumor vessels, 29 suggesting that the observed up-regulation in high-grade gliomas is related to the vascular proliferation in these tumors.
Among the genes whose mRNA levels showed the biggest differences between primary and recurrent gliomas were the forkhead transcription factor gene FOXM1 (OMIM 602341, 12p13) and the gene for matrix Gla protein (MGP, OMIM 154870, 12p13.1–12.3). These genes were of particular interest to us because we previously found amplification on 12p in a subset of malignant gliomas. 17 High levels of FOXM1 mRNA in glioblastomas were also noted in a study comparing expression profiles of glioblastomas with those of pilocytic astrocytomas. 30 FOXM1 is an important regulator of cell cycle progression and may regulate the expression of cyclin B and cyclin D1. 31 In addition, FOXM1 has been reported as a downstream target of the transcription factor Gli1. 32 GLI1 is coamplified with CDK4 and overexpressed in a small fraction of glioblastomas. 33 However, none of our 8 glioma pairs demonstrated an increase in GLI1 expression from the primary to the recurrent tumor, indicating that the up-regulation of FOXM1 in these cases is independent of the GLI1 transcript levels. Investigation of the FOXM1 gene dosage in these tumors as well as in 3 additional gliomas with known amplification of the CCND2 gene at 12p13 did not reveal any FOXM1 gene amplification. Thus, the molecular mechanism resulting in the up-regulation of FOXM1 expression in malignant gliomas remains to be determined.
The matrix Gla protein (MGP) is a vitamin-K-dependent extracellular matrix protein expressed in various tissues. Germline mutations in MGP leading to ectopic abnormal calcifications and midfacial hypoplasia were detected in patients with Keutel syndrome. 34 The role of MGP in neoplasia is unclear. In line with our findings in gliomas, increased MGP expression relative to normal tissue were found in ovarian cancers. 35 In contrast, an inverse relationship between MGP expression and malignancy was reported for carcinomas of the colon, prostate, and kidney. 36,37 While MGP mRNA levels were significantly increased in high-grade as compared to low-grade astrocytic gliomas, we did not detect any MGP gene amplification in our glioma series, suggesting that other mechanisms are responsible.
Microarray and real-time RT-PCR analyses revealed that transcripts from the insulin-like growth factor (IGF)-binding protein 4 gene (IGFBP4, OMIM 146733, 17q12-q21) were expressed at higher levels in glioblastomas as compared to astrocytic gliomas of WHO grade II or III. IGFBP4 belongs to a family of proteins that are involved in the regulation of IGF function, but may also have IGF-independent effects. 38,39 In the rat, IGFBP4 is expressed in astrocytes and oligodendrocyte precursor cells but not in mature oligodendrocytes. 40 The role of IGFBP4 in cancer is poorly defined, with studies suggesting growth inhibitory functions 41 but also anti-apoptotic effects. 42 Interestingly, another IGF-binding protein, IGFBP2, has been reported to be frequently expressed at higher levels in glioblastomas as compared to gliomas of WHO grade II or III. 43 In our series, only four of eight high-grade recurrences had increased IGFBP2 mRNA levels relative to the corresponding primary low-grade gliomas. Therefore, IGFBP2 did not turn up among the 66 genes whose expression differed significantly on statistical analysis of the entire group of eight patients.
The set of genes showing reduced expression on glioma progression included several novel candidate genes from 10q, such as CAMK2G (OMIM 602123, 10q22), ADD3 (OMIM 601568, 10q24.2-q24.3), and ABLIM (OMIM 602330, 10q25). Deletions of 10q are detectable in the majority of primary and secondary glioblastomas. 5 About 25% to 40% of primary glioblastomas carry mutations in the PTEN gene at 10q23. 44 In contrast, PTEN alterations are rare in secondary glioblastomas. 44 Thus, 10q likely harbors one or more as yet unknown glioblastoma-associated tumor suppressor gene(s). The ADD3 protein (adducin γ) belongs to a family of ubiquitously expressed membrane-skeletal proteins that are localized at spectrin-actin junctions. 45 In renal carcinomas, changes in adducin expression, phosphorylation state, and localization were found to be associated with increased malignancy. 46 In addition, down-regulation of adducin-γ expression correlated with increased migratory activity of human glioma cells in vitro. 47 Another study detected decreased expression of ADD3 in astrocytomas (WHO grade II) as compared to non-neoplastic brain tissue. 48 We could not confirm this latter finding for our series of astrocytomas but identified significantly lower ADD3 mRNA levels in recurrent high-grade gliomas as compared to the respective primary low-grade gliomas. In the independent series of 43 gliomas, we also observed a trend toward lower ADD3 mRNA levels in anaplastic astrocytomas and glioblastomas than in WHO grade II astrocytomas. Thus, it may be worthwhile to further investigate ADD3 as a putative glioma suppressor gene.
The actin-binding LIM protein 1 (ABLIM or limatin) mediates the interaction of actin filaments with cytoplasmatic targets and thereby couples the cytoskeleton to intracellular signaling pathways. 49 Although ABLIM transcripts were expressed more strongly in the primary than in the recurrent gliomas, the analysis of further 43 gliomas did not confirm a general decrease in ABLIM mRNA expression with increasing malignancy grade. A third candidate gene from 10q was CAMK2G, which codes for the γ subunit of Ca2+/calmodulin-dependent protein kinase II and is expressed in various cell types, including astrocytes. 50 The CAMK2G gene product is an important effector of Ca2+-dependent signaling and seems to be involved in the regulation of cell cycle progression as well as apoptosis. 51 Its potential role in glioma progression, as suggested by our data, remains to be investigated further.
The ryanodine receptor 1 gene (RYR1, OMIM 180901) was another candidate whose expression was significantly lower in the recurrent high-grade than in the primary low-grade gliomas. RYR1 maps to a chromosomal region (19q13.1) that has been implicated in astrocytoma progression by LOH studies. 52 In addition, reduced activity of RYR1 has been reported to inhibit apoptosis in prostate cancer cells. 53 Therefore, we selected RYR1 for further study by real-time RT-PCR, which confirmed the microarray results on the series of 8 glioma pairs but did not demonstrate significant differences in expression in the independent series of 43 gliomas.
L-selectin, the gene product of SELL (OMIM 153240, 1q23-q25), is a cell-surface-associated adhesion molecule expressed on leukocytes. Recent studies indicate that L-selectin may be involved in the formation of cancer metastases. 54 We found increased SELL mRNA expression in astrocytic gliomas relative to non-neoplastic brain, which may be due to infiltration of the tumor tissue by leukocytes. More difficult to explain is the finding of reduced expression with increasing malignancy. Treatment with glucocorticoids has been shown to strongly reduce the expression of L-selectin in leukocytes. 55 Since high-grade glioma patients frequently receive glucocorticoids before operation to reduce perifocal edema, the lower level of SELL mRNA in high-grade gliomas may be due to pre-operative glucocorticoid treatment rather than being related to increased malignancy.
In summary, we have identified and validated a set of novel candidate genes whose expression at the transcript level is associated with the WHO malignancy grade of diffuse astrocytic gliomas. For most of these genes, knowledge about their possible roles in gliomas is still limited. Therefore, further studies are needed to more precisely characterize the functional significance of these genes in glioma progression as well as their potential relevance for glioma grading and the assessment of prognosis.
Footnotes
Address reprint requests to Guido Reifenberger, Department of Neuropathology, Heinrich-Heine-University, Moorenstrasse 5, D-40225 Düsseldorf, Germany. E-mail: reifenberger@med.uni-duesseldorf.de.
Supported by grants from the National Cancer Institute (CA84953 to S. M. H.), the Deutsche Forschungsgemeinschaft (SFB503, B7), the Deutsche Krebshilfe/Dr. Mildred Scheel Stiftung (10–1361-Re2 and 10–1639-Re3), the Wilhelm Sander Stiftung (2000.039.1), and the Karl Böhmer Preis für Krebsforschung (to G. R.).
J. v. d. B. is supported by the neuroscience graduate research training program at Heinrich-Heine-University Düsseldorf (DFG Graduiertenkolleg 320). M. W. is supported by the Lise Meitner program of the Ministerium für Schule, Wissenschaft und Forschung des Landes Nordrhein-Westfalen.
J. v. d. B., M. W., and R. K. contributed equally to this study.
References
- 1.Cavenee WK, Furnari FB, Nagane M, Huang HJS, Newcomb EW, Bigner DD, Weller M, Berens ME, Plate KH, Israel MA, Noble MD, Kleihues P: Diffusely infiltrating astrocytomas. Kleihues P Cavenee WK eds. Tumours of the Nervous System. Pathology and Genetics 2000:10-21 IARC Press Lyon
- 2.Vertosick FT, Selker RG, Arena VC: Survival of patients with well-differentiated astrocytomas diagnosed in the era of computed tomography. Neurosurgery 1991, 28:496-501 [DOI] [PubMed] [Google Scholar]
- 3.McCormack BM, Miller DC, Budzilovich GN, Voorhees GJ, Ransohoff J: Treatment and survival of low-grade astrocytoma in adults: 1977–1988. Neurosurgery 1992, 31:636-642 [DOI] [PubMed] [Google Scholar]
- 4.Maher EA, Furnari FB, Bachoo RM, Rowitch DH, Louis DN, Cavenee WK, DePinho RA: Malignant glioma: genetics and biology of a grave matter. Genes Dev 2001, 15:1311-1333 [DOI] [PubMed] [Google Scholar]
- 5.Kleihues P, Ohgaki H: Primary and secondary glioblastomas: from concept to clinical diagnosis. Neuro-oncol 1999, 1:44-51 [DOI] [PMC free article] [PubMed] [Google Scholar]
- 6.Ichimura K, Bolin MB, Goike HM, Schmidt EE, Moshref A, Collins VP: Deregulation of the p14ARF/Mdm2/p53 pathway is a prerequisite for human astrocytic gliomas with G1-S transition control gene abnormalities. Cancer Res 2000, 60:417-424 [PubMed] [Google Scholar]
- 7.Büschges R, Weber RG, Actor B, Lichter P, Collins VP, Reifenberger G: Amplification and expression of cyclin D genes (CCND1, CCND2 and CCND3) in human malignant gliomas. Brain Pathol 1999, 9:435-443 [DOI] [PMC free article] [PubMed] [Google Scholar]
- 8.Dropcho EJ, Soong SJ: The prognostic impact of prior low-grade histology in patients with anaplastic gliomas: a case-control study. Neurology 1996, 47:684-690 [DOI] [PubMed] [Google Scholar]
- 9.Kleihues P, Cavenee WK: World Health Organization classification of tumours of the nervous system. Tumours of the Nervous System. Pathology and Genetics 2000:22-70 IARC Press Lyon
- 10.Ichimura K, Schmidt EE, Goike HM, Collins VP: Human glioblastomas with no alterations of the CDKN2A (p16INK4a, MTS1) and CDK4 gene have frequent mutations of the retinoblastoma gene. Oncogene 1996, 13:1065-1072 [PubMed] [Google Scholar]
- 11.Sambrook J, Fritsch EF, Maniatis T: Molecular cloning: a laboratory manual. ed 2 1989:9.17-9.19 Cold Spring Harbor Laboratory Press Cold Spring Harbor, New York
- 12.Reifenberger J, Ring GU, Gies U, Cobbers JMJL, Oberstrass J, An H-X, Niederacher D, Wechsler W, Reifenberger G: Analysis of p53 mutation and epidermal growth factor receptor amplification in recurrent gliomas with malignant progression. J Neuropathol Exp Neurol 1996, 55:822-831 [DOI] [PubMed] [Google Scholar]
- 13.Boström J, Cobbers JMJL, Wolter M, Tabatabai G, Weber RG, Lichter P, Collins VP, Reifenberger G: Mutation of the PTEN (MMAC1) tumor-suppressor gene in a subset of glioblastomas but not in meningiomas with loss of chromosome arm 10q. Cancer Res 1998, 58:29-33 [PubMed] [Google Scholar]
- 14.Cobbers JMJL, Wolter M, Reifenberger J, Ring GU, Jessen F, An H-X, Niederacher D, Schmidt EE, Ichimura K, Floeth F, Kirsch L, Borchard F, Louis DN, Collins VP, Reifenberger G: Frequent inactivation of CDKN2A and rare mutation of TP53 in PCNSL. Brain Pathol 1998, 8:263-276 [DOI] [PMC free article] [PubMed] [Google Scholar]
- 15.Wolter M, Reifenberger J, Blaschke B, Ichimura K, Schmidt EE, Collins VP, Reifenberger G: Oligodendroglial tumors frequently demonstrate hypermethylation of the CDKN2A (MTS1, p16INK4a), p14ARF, and CDKN2B (MTS2, p15INK4b) tumor-suppressor genes J Neuropathol Exp Neurol 2001, 60:1170-1180 [DOI] [PubMed] [Google Scholar]
- 16.Boström J, Mühlbauer A, Reifenberger G: Deletion mapping of the short arm of chromosome 1 identifies a common region of deletion distal to D1S496 in human meningiomas. Acta Neuropathol 1997, 94:479-485 [DOI] [PubMed] [Google Scholar]
- 17.Weber RG, Sabel M, Reifenberger J, Sommer C, Oberstrass J, Reifenberger G, Kiessling M, Cremer T: Characterization of genomic alterations associated with glioma progression by comparative genomic hybridization. Oncogene 1996, 13:983-994 [PubMed] [Google Scholar]
- 18.Mueller W, Hartmann C, Hoffmann A, Lanksch W, Kiwit J, Tonn J, Veelken J, Schramm J, Weller M, Wiestler OD, Louis DN, von Deimling A: Genetic signature of oligoastrocytomas correlates with tumor location and denotes distinct molecular subsets. Am J Pathol 2002, 161:313-319 [DOI] [PMC free article] [PubMed] [Google Scholar]
- 19.Schmidt EE, Ichimura K, Reifenberger G, Collins VP: CDKN2 (p16/MTS1) gene deletion or CDK4 amplification occurs in the majority of glioblastomas. Cancer Res 1994, 54:6321-6324 [PubMed] [Google Scholar]
- 20.Machein MR, Plate KH: VEGF in brain tumors. J Neurooncol 2000, 50:109-120 [DOI] [PubMed] [Google Scholar]
- 21.Jiang BH, Zheng JZ, Aoki M, Vogt PK: Phosphatidylinositol 3-kinase signaling mediates angiogenesis and expression of vascular endothelial growth factor in endothelial cells. Proc Natl Acad Sci USA 2000, 97:1749-1753 [DOI] [PMC free article] [PubMed] [Google Scholar]
- 22.Maity A, Pore N, Lee J, Solomon D, O’Rourke DM: Epidermal growth factor receptor transcriptionally up-regulates vascular endothelial growth factor expression in human glioblastoma cells via a pathway involving phosphatidylinositol 3′-kinase and distinct from that induced by hypoxia. Cancer Res 2000, 60:5879-5886 [PubMed] [Google Scholar]
- 23.Huang J, Kontos CD: Pten modulates vascular endothelial growth factor-mediated signaling and angiogenic effects. J Biol Chem 2002, 277:10760-10766 [DOI] [PubMed] [Google Scholar]
- 24.Liao H, Winkfein RJ, Mack G, Rattner JB, Yen TJ: CENP-F is a protein of the nuclear matrix that assembles onto kinetochores at late G2 and is rapidly degraded after mitosis. J Cell Biol 1995, 130:507-518 [DOI] [PMC free article] [PubMed] [Google Scholar]
- 25.Holden JA, Townsend JJ: DNA topoisomerase II-α as a proliferation marker in astrocytic neoplasms of the central nervous system: correlation with MIB1 expression and patient survival. Mod Pathol 1999, 12:1094-1100 [PubMed] [Google Scholar]
- 26.Korkolopoulou P, Patsouris E, Konstantinidou AE, Christodoulou P, Thomas-Tsagli E, Kouzelis K, Angelidakis D, Rologis D, Davaris P: Mitosin and DNA topoisomerase II-α: two novel proliferation markers in the prognostication of diffuse astrocytoma patient survival. Appl Immunohistochem Mol Morphol 2001, 9:207-214 [DOI] [PubMed] [Google Scholar]
- 27.Varis A, Wolf M, Monni O, Vakkari ML, Kokkola A, Moskaluk C, Frierson H, Jr, Powell SM, Knuutila S, Kallioniemi A, El-Rifai W: Targets of gene amplification and overexpression at 17q in gastric cancer. Cancer Res 2002, 62:2625-2629 [PubMed] [Google Scholar]
- 28.De la Guardia C, Casiano CA, Trinidad-Pinedo J, Baez A: CENPF gene amplification and overexpression in head and neck squamous cell carcinomas. Head Neck 2001, 23:104-112 [DOI] [PubMed] [Google Scholar]
- 29.Bellon G, Caulet T, Cam Y, Pluot M, Poulin G, Pytlinska M, Bernard M: Immunohistochemical localisation of macromolecules of the basement membrane and extracellular matrix of human gliomas and meningiomas. Acta Neuropathol 1985, 66:245-252 [DOI] [PubMed] [Google Scholar]
- 30.Rickman DS, Bobek MP, Misek DE, Kuick R, Blaivas M, Kurnit DM, Taylor J, Hanash SM: Distinctive molecular profiles of high-grade and low-grade gliomas based on oligonucleotide microarray analysis. Cancer Res 2001, 61:6885-6891 [PubMed] [Google Scholar]
- 31.Wang X, Quail E, Hung NJ, Tan Y, Ye H, Costa RH: Increased levels of forkhead box M1B transcription factor in transgenic mouse hepatocytes prevent age-related proliferation defects in regenerating liver. Proc Natl Acad Sci USA 2001, 98:11468-11473 [DOI] [PMC free article] [PubMed] [Google Scholar]
- 32.Teh MT, Wong ST, Neill GW, Ghali LR, Philpott MP, Quinn AG: FOXM1 is a downstream target of Gli1 in basal cell carcinomas. Cancer Res 2002, 62:4773-4780 [PubMed] [Google Scholar]
- 33.Reifenberger G, Ichimura K, Reifenberger J, Elkahloun AG, Meltzer PS, Collins VP: Refined mapping of 12q13–q15 amplicons in human malignant gliomas suggests CDK4/SAS and MDM2 as independent amplification targets. Cancer Res 1996, 56:5141-5145 [PubMed] [Google Scholar]
- 34.Munroe PB, Olgunturk RO, Fryns JP, Van Maldergem L, Ziereisen F, Yuksel B, Gardiner RM, Chung E: Mutations in the gene encoding the human matrix Gla protein cause Keutel syndrome. Nat Genet 1999, 21:142-144 [DOI] [PubMed] [Google Scholar]
- 35.Hough CD, Cho KR, Zonderman AB, Schwartz DR, Morin PJ: Coordinately up-regulated genes in ovarian cancer. Cancer Res 2001, 61:3869-3876 [PubMed] [Google Scholar]
- 36.Levedakou EN, Strohmeyer TG, Effert PJ, Liu ET: Expression of the matrix Gla protein in urogenital malignancies. Int J Cancer 1992, 52:534-537 [DOI] [PubMed] [Google Scholar]
- 37.Fan C, Sheu D, Fan H, Hsu KA, Chang C, Chan E: Down-regulation of matrix Gla protein messenger RNA in human colorectal adenocarcinomas. Cancer Lett 2001, 165:63-69 [DOI] [PubMed] [Google Scholar]
- 38.Hwa V, Oh Y, Rosenfeld RG: The insulin-like growth factor-binding protein (IGFBP) superfamily. Endocr Rev 1999, 20:761-787 [DOI] [PubMed] [Google Scholar]
- 39.Fürstenberger G, Senn HJ: Insulin-like growth factors and cancer. Lancet Oncol 2000, 3:298-302 [DOI] [PubMed] [Google Scholar]
- 40.Mewar R, McMorris FA: Expression of insulin-like growth factor-binding protein messenger RNAs in developing rat oligodendrocytes and astrocytes. J Neurosci Res 1997, 50:721-728 [DOI] [PubMed] [Google Scholar]
- 41.Drivdahl RH, Sprenger C, Trimm K, Plymate SR: Inhibition of growth and increased expression of insulin-like growth factor-binding protein-3 (IGFBP-3) and -6 in prostate cancer cells stably transfected with antisense IGFBP-4 complementary deoxyribonucleic acid. Endocrinology 2001, 142:1990-1998 [DOI] [PubMed] [Google Scholar]
- 42.Perks CM, Bowen S, Gill ZP, Newcomb PV, Holly JM: Differential IGF-independent effects of insulin-like growth factor binding proteins (1–6) on apoptosis of breast epithelial cells. J Cell Biochem 1999, 75:652-664 [DOI] [PubMed] [Google Scholar]
- 43.Zhang W, Wang H, Song SW, Fuller GN: Insulin-like growth factor binding protein 2: gene expression microarrays and the hypothesis-generation paradigm. Brain Pathol 2002, 12:87-94 [DOI] [PMC free article] [PubMed] [Google Scholar]
- 44.Knobbe CB, Merlo A, Reifenberger G: Pten signaling in gliomas. Neuro-oncol 2002, 4:196-211 [PMC free article] [PubMed] [Google Scholar]
- 45.Matsuoka Y, Li X, Bennett V: Adducin: structure, function and regulation. Cell Mol Life Sci 2000, 57:884-895 [DOI] [PMC free article] [PubMed] [Google Scholar]
- 46.Fowler L, Everitt J, Stevens JL, Jaken S: Redistribution and enhanced protein kinase C-mediated phosphorylation of α- and γ-adducin during renal tumor progression. Cell Growth Differ 1998, 9:405-413 [PubMed] [Google Scholar]
- 47.Mariani L, Beaudry C, McDonough WS, Hoelzinger DB, Demuth T, Ross KR, Berens T, Coons SW, Watts G, Trent JM, Wei JS, Giese A, Berens ME: Glioma cell motility is associated with reduced transcription of proapoptotic and proliferation genes: a cDNA microarray analysis. J Neurooncol 2001, 53:161-176 [DOI] [PubMed] [Google Scholar]
- 48.Huang H, Colella S, Kurrer M, Yonekawa Y, Kleihues P, Ohgaki H: Gene expression profiling of low-grade diffuse astrocytomas by cDNA arrays. Cancer Res 2000, 60:6868-6874 [PubMed] [Google Scholar]
- 49.Roof DJ, Hayes A, Adamian M, Chishti AH, Li T: Molecular characterization of abLIM, a novel actin-binding and double zinc finger protein. J Cell Biol 1997, 138:575-588 [DOI] [PMC free article] [PubMed] [Google Scholar]
- 50.Vallano ML, Beaman-Hall CM, Mathur A, Chen Q: Astrocytes express specific variants of CaMKII δ and γ, but not α and β, that determine their cellular localizations. Glia 2000, 30:154-164 [DOI] [PubMed] [Google Scholar]
- 51.Heist EK, Schulman H: The role of Ca2+/calmodulin-dependent protein kinases within the nucleus. Cell Calcium 1998, 23:103-114 [DOI] [PubMed] [Google Scholar]
- 52.von Deimling A, Bender B, Jahnke R, Waha A, Kraus J, Albrecht S, Wellenreuther R, Fassbender F, Nagel J, Menon AG: Loci associated with malignant progression in astrocytomas: a candidate on chromosome 19q. Cancer Res 1994, 54:1397-1401 [PubMed] [Google Scholar]
- 53.Mariot P, Prevarskaya N, Roudbaraki MM, Le Bourhis X, Van Coppenolle F, Vanoverberghe K, Skryma R: Evidence of functional ryanodine receptor involved in apoptosis of prostate cancer (LNCaP) cells. Prostate 2000, 43:205-214 [DOI] [PubMed] [Google Scholar]
- 54.Qian F, Hanahan D, Weissman IL: L-selectin can facilitate metastasis to lymph nodes in a transgenic mouse model of carcinogenesis. Proc Natl Acad Sci USA 2001, 98:3976-3981 [DOI] [PMC free article] [PubMed] [Google Scholar]
- 55.Filep JG, Delalandre A, Payette Y, Foldes-Filep E: Glucocorticoid receptor regulates expression of L-selectin and CD11/CD18 on human neutrophils. Circulation 1997, 96:295-301 [DOI] [PubMed] [Google Scholar]
- 56.Eisen MB, Spellman PT, Brown PO, Botstein D: Cluster analysis and display of genome-wide expression patterns. Proc Natl Acad Sci USA 1998, 95:14863-14868 [DOI] [PMC free article] [PubMed] [Google Scholar]