

Abstract
Intracellular accumulation of PHFtau in Alzheimer’s disease (AD) disrupts the neuronal cytoskeleton and other neuronal machinery and contributes to axonal and dendritic degeneration, and neuronal death. Furthermore, amyloid-β (Aβ) has been reported to be toxic to neurons and neurites. While loss of presynaptic elements is an established feature of AD, the nature and extent of dendritic degeneration has been infrequently studied. We investigated MAP2-immunoreactive dendrites using a novel method of high-throughput quantification and also measured cortical thickness and the densities of NeuN-immunoreactive neurons, PHFtau neurofibrillary tangles (NFTs), and Aβ plaque burden in the subiculum in AD and elderly controls. Corrected for atrophy, the “dendritic arborization index” was significantly reduced by up to 66% in all three layers of the subiculum. Laminar thickness was reduced by an average 33% and there was a marked reduction in neuron density of approximately 50%. As expected, NFTs and Aβ plaques were significantly increased in AD. Dendritic arborization indices negatively correlated with NFT densities while no significant correlations were found with Aβ plaque densities. The pattern of dendritic loss in the subiculum and the correlations with NFT densities respectively suggest that deafferentation and intrinsic neurofibrillary degeneration both may contribute to dendritic loss in AD.
In Alzheimer’s disease (AD), the microtubule-associated protein tau becomes hyperphosphorylated and aggregates into paired helical filaments (PHFtau) in the neuron’s cell body as neurofibrillary tangles (NFTs) and in dendrites and axons as neuropil threads. This disrupts the dynamic stability of the neuronal cytoskeleton and other elements of neuronal machinery and contributes to the dendritic, axonal, and ultimately neuronal death observed in the disease. 1 In addition, fibrillar amyloid β (Aβ) deposition has been associated with dendritic dystrophy in human tissue and mouse and neuron culture models. 2-4
Dendrites, in particular, are dynamic structures critical for the fidelity of neural transmission. They undergo substantial modifications in morphology and molecular composition in response to afferent neural transmission, trophic stimulation, or pathological processes. 5 The extent to which degeneration and loss of dendritic processes occur in AD is not well understood, nor is the relationship of dendritic changes to PHFtau, Aβ, neuron loss, or the selective vulnerability of particular regions for degeneration in AD. This is at least partially due to the methodological challenges of studying dendritic architecture. Golgi studies of small numbers of patients have reported loss of dendritic extent in the subiculum, CA-1, and dentate gyrus in AD. 1 However, the classical Golgi method stains relatively few neurons and while the morphological detail can be excellent, the approach does not lend itself to larger scale analyses or correlation of dendritic indices with other markers labeled in the same or adjacent sections.
The region-specific vulnerability to degeneration in AD is another aspect of the disease that is still poorly understood and for which a study of dendritic arborization may shed light. Neurofibrillary changes and accompanying neuron loss in AD exhibit a selectivity for particular brain regions that follows a predictable sequence which mirrors the connectional anatomy of affected brain regions and the severity of clinical symptoms. 6,7 The earliest and most severe changes occur within the perirhinal and entorhinal cortices, followed by the hippocampus (especially CA1) and amygdala, then other limbic and neocortical association areas, and finally primary motor and sensory cortices. Intrinsic selectivity is also evident in terms of specific lamina and subregions being more affected than others. However, the relationships between degenerative changes in various neural elements (eg, dendrites, axons, neuronal somata) within a given region have not been well characterized.
The subiculum may be a particularly instructive region of interest because of its relatively simple and well-studied cytoarchitectural and connectional neuroanatomy and also its selective vulnerability for AD-related neurodegeneration. Although mildly affected in early stages, the subiculum is severely affected by the pathological changes that correspond to the advanced stages of AD (Braak stages IV to VI), with marked deterioration during the progression to stages V to VI. 6,8 As a major source of hippocampal efferents to widespread cortical and subcortical structures, the subiculum acts as a final station in the sequence of projections that link the subdivisions of the hippocampus and also receives direct projection from the entorhinal cortex (EC). 9 This important role in the ventromedial temporal lobe memory system implies that damage to the subiculum could have profound functional consequences and explains the correlation of subicular damage with severity of AD symptoms. 10
In this study, an antibody against MAP2, a robustly expressed cytoskeletal protein that is localized to dendrites, was used to immunolabel dendrites with the goal of examining the extent of MAP2-labeled dendritic arborization in relation to neurodegenerative pathology in connectionally relevant anatomical subregions of the subiculum. Dendritic changes in the subiculum in AD were quantified with a new “dendritic arborization index” in which we used random, systematic sampling for image capture and customized image analysis to determine the percent area occupied by dendrites. We also quantified the density of neurons, NFTs, and Aβ deposits to assess their relationships to diagnosis and dendritic arborization.
Materials and Methods
Case Materials
Brain specimens from 15 subjects with AD and 15 comparison subjects with no neuropsychiatric disease were obtained at autopsy from the Alzheimer Disease Center Core of the University of Pennsylvania. All AD subjects were in a moderately severe to end-stage of dementia at the time of death. Clinical information is provided in Table 1 ▶ . 11,12 All hippocampal sections were taken from comparable levels of the uncal region of the hippocampus and were confirmed by comparing Nissl stained sections with a standard atlas. 13 Brain sections were taken from levels 1 to 7 in Duvernoy’s parcellation. There were no significant differences between the groups for age, sex, postmortem interval, or brain weight. Gross and microscopic neuropathological examinations were conducted for all cases and the diagnosis of AD was made using established diagnostic criteria. 14 The brains of four normal subjects had minor neuropathological findings that were not relevant to this study (two with resolved lacunar infarcts that did not involve the hippocampus, one with cerebellar neuron loss, and one with a subdural hematoma). The brains of the AD patients were without neuropathological abnormalities aside from abundant senile plaques and NFTs.
Table 1.
Demographic Data
| Group | Age | Sex | CDR | PMI | BW | Braak stage* |
|---|---|---|---|---|---|---|
| Control | 72.9 (13.1) | 8F/7M | 0.03 (0.1) | 13.3 (7.0) | 1239 (207) | 1.5 (1.3) |
| AD | 76.9 (8.7) | 8F/7M | 2.6 (0.8) | 9.0 (5.2) | 1157 (158) | 5.6 (0.5) |
| t, P | 1.0, 0.33 | 11.9, <0.0001 | 1.9, 0.07 | 1.2, 0.23 | 11.3, <0.0001 |
Tissue Processing and Immunohistochemistry
Coronal blocks of the temporal cortex were dissected at autopsy and fixed in ethanol (70% EtOH, sodium chloride 150 mmol/L) for 24 hours. The blocks were then paraffin-embedded and cut into 10-μm-thick sections for serial staining and analyses. For neuronal density measurements, tissue was immunolabeled with NeuN (Chemicon, Temecula, CA), a monoclonal antibody specific for neurons. MAP2-immunoreactive neurons and dendrites were labeled with M13, a specific mouse monoclonal antibody that identifies all isoforms of MAP2 (generously provided by V. M.-Y. Lee). Neurofibrillary tangles were labeled with a phosphorylated tau-specific monoclonal antibody, AT8, which recognizes PHFtau specifically containing a phosphorylated Ser202 residue (InnoGenex, San Ramon, CA) and Aβ plaque deposits were labeled with anti-Aβ, a monoclonal antibody raised against a synthetic peptide of residues 8 to 17 in the amyloid β-protein/amyloid A4 present senile plaques of all types. (DAKO, Carpinteria, CA). Immunohistochemistry for MAP2 was performed according to a previously described procedure 15 using the purple VIP reporter (Vector Laboratories, Burlingame, CA) which gives excellent resolution for quantitation of dendrites. Sections from all cases were run simultaneously for each antibody on an automated immunohistochemical stainer (BioGenex, San Ramon, CA) in precisely timed runs. Antigen retrieval pretreatment included 90% formic acid for 3 minutes before anti-Aβ and for 5 minutes before AT8 incubation. No pretreaments were used for NeuN or M13.
Apportionment of the Subiculum
To assess possible differences in dendritic arborization based on connectional patterns within the subiculum, individual measurements were taken in relevant subportions of the subiculum. Cytoarchitecturally, the subiculum is a simple, three-layered allocortical structure consisting of a molecular layer, pyramidal cell layer, and fusiform cell layer (Figures 1 and 2) ▶ . Each layer is easily distinguished with MAP2 staining and has its own connectional anatomy. For example, in non-human primates, afferents from the EC synapse primarily in the superficial part of the molecular layer and the fusiform layer of the subiculum, while CA1 afferents synapse throughout the molecular and pyramidal layers. 9,16 Furthermore, projections from CA1 and the EC to subiculum in the monkey are organized along the transverse axis of the subiculum. Rostral and lateral EC projects to the proximal subiculum (close to CA1), while more caudal and medial portions of the EC project to the distal subiculum (close to presubiculum). 17,18 For both the proximal and distal halves of the subiculum, measurements were made for the superficial and deep portions of the molecular layer, the pyramidal cell layer, and the fusiform cell layer.
Figure 1.
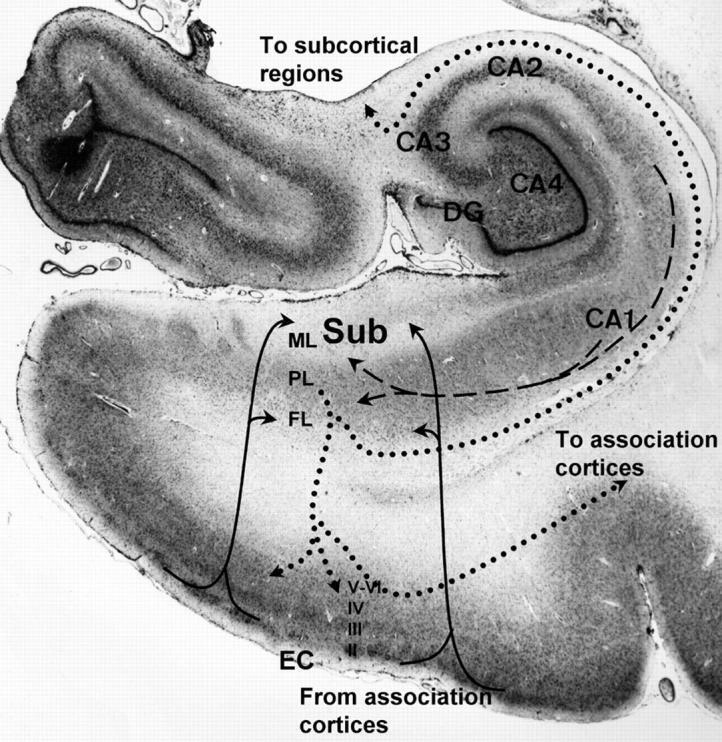
Photograph of Nissl-stained hippocampal region showing location and connections of subiculum (Sub). The subiculum receives direct innervation from layers II and III of the EC via the perforant pathway to the superficial portion of the molecular layer (ML) and the deep fusiform cellular layer (FL). Input from the EC (solid lines) is topographically organized with rostral and lateral portions primarily innervating the proximal subiculum (adjacent to hippocampal subfield CA1) and medial and caudal EC innervating the distal subiculum. The subiculum also receives strong innervation from CA1 (dashed lines) to the deeper molecular layer and pyramidal cell layer (PL). The subiculum originates the major output of the hippocampus sending projections (dotted lines) via the alveus-fimbria-fornix to subcortical limbic structures in the basal forebrain and diencephalon and to sensory-specific and mutimodal association cortices via direct connections and layer IV of the EC. (CA2, CA3, and CA4, ammonic subfields of the hippocampus; DG, dentate gyrus)
For each antibody, two series of sections were immunostained for preliminary qualitative analyses and one underwent quantitative analysis. About 50% of the entire subiculum on each section was quantified using a random systematic sampling paradigm. The blocks contained the entire hippocampus and parahippocampal gyri. Atrophy of this region affected the total area of tissue measured and accordingly, this was corrected for in our analyses, as described below.
Estimation of Neuron and NFT Densities
Quantitation of neurons and NFTs within the pyramidal and fusiform layers was performed with a stereological mapping station which included a Leica DMRBE microscope and computer equipped with StereoInvestigator software version 3.23 (MicroBrightField, Inc., Williston, VT). After cytoarchitecturally delimiting the region of interest at ×200 magnification, a grid of predetermined size was placed over the entire region. Magnification was increased to ×400 and the program stopped at each intersection point on the grid for counting. The operator focused through the section depth as the fields were visualized on the video monitor within the superimposed counting frame. All objects within the 150 × 150 μm counting frame that did not touch the exclusion lines of the box (bottom and left sides) were counted. Approximately 50% of the area of a section was quantified.
For neuron density estimates, neurons were identified based on NeuN labeling. Neurons were counted only if the nucleus was visible in the section to reduce split-cell artifact due to variable neuronal profile size. NFTs were labeled with AT8 and had a characteristic “flared” appearance due to their location in the cell bodies of pyramidal neurons or pyramidal ghost tangles.
Quantitation of Dendritic Arborization and Aβ Plaque Burden
Using the random systematic sampling scheme, images were captured from approximately 40% of a defined region of interest for estimation of MAP2 dendritic arborization within the fusiform and pyramidal cellular layers, as well as the deep and superficial portions of the molecular layer. As for the neuron and NFT counts, separate measures were made in the proximal and distal halves of the subiculum. For Aβ deposits, subparcellation was not performed. A custom analysis algorithm provided a value for the area occupied by the Aβ-immunopositive zone or the area fraction, as previously described. 19,20 This is defined as the mean percent fraction of labeled pixels per field. The sensitivity of this measure to illumination intensity was addressed by adhering to a fixed protocol of light calibration. Briefly, 24-bit images were captured at each sampling point and converted to 8-bit images by using Adobe Photoshop 5.02 (Adobe Systems Inc., San Jose, CA). Area analysis was performed using macros designed for the public domain Object-Image 2.06 (Norbert Vischer, http://simon.bio.uva.nl/object-image.html). Overall data reduction yielded a value for the area fraction defined as the percent fraction of Aβ-immunolabeled deposits to total tissue area of the defined region of interest. The MAP2 dendritic arborization area was then expressed as a ratio of area per NeuN neuron density. This represents an index of dendrites per neuron.
Laminar Thickness and Correction for Atrophy
The thicknesses of the molecular (apical dendritic), pyramidal, and fusiform cell layers were measured using StereoInvestigator software. The thickness of each layer was measured at the proximal (close to CA1) and distal (close to presubiculum) ends of the subiculum.
Atrophy of the hippocampus occurs with AD and this would artificially increase the densities of dendrites, neurons, NFT counts, and Aβ plaque burden. To minimize this confound, raw density indices were corrected based on laminar thickness measurements for each case. Ideally, we would correct for the three-dimensional volume of the hippocampus if this were known. However, the manner in which our tissue was processed did not allow accurate measurement in the transverse or longitudinal planes because of varying methods of block dissection at the autopsy table. Therefore, a correction factor for each case was generated based on our coronal plane thickness measurements. The raw density index for each marker was multiplied by the correction factor, L × T, where L = the thickness of the layer being measured and T = the average total thickness of the subiculum (from pial surface to gray/white matter border). This two-dimensional correction is a conservative estimate for the three-dimensional atrophy that would contribute to the raw density measurements.
Data Analysis
Between group differences for demographic variables were assessed with Student’s t-tests while differences for MAP2 dendritic arborization indices, laminar thicknesses, and densities of NeuN-stained neurons, NFTs, and Aβ plaque deposits were analyzed with Wilcoxon sign-rank tests. Non-parametric statistics were used because of small sample size and to protect against outliers. Relationships between neuroanatomic markers were assessed with Spearman rho (ρ) correlations. For the initial between-group analyses, data were reduced into mean dendritic arborization indices for the molecular (deep and superficial), pyramidal, and fusiform layers using an average of the proximal and distal measures. Secondary analyses then examined differences within the individual subregions as well as differences between deep and superficial portions of the molecular layer in each subregion.
Results
Subicular Atrophy
The subiculum of AD cases showed a significant reduction in the average total thickness by approximately 33% (Table 2) ▶ . However, there were differences between layers where the molecular layer was reduced 43% while the pyramidal cell and fusiform layers were reduced only 25% and 23%, respectively. Given the largely synaptic composition of the molecular layer compared to the cellular layers, this disproportionate reduction would be consistent with the hypothesized dendritic loss in AD. The proximal portion of the subiculum exhibited slightly greater reduction in laminar thickness for its molecular layer compared to the distal molecular layer (51% that of control in the proximal subiculum versus 65% in the distal subiculum) while the opposite was true for the pyramidal cell layer (82% proximal versus 65% distal). Fusiform atrophy of 22% was similar in proximal and distal subiculum.
Table 2.
Laminar Thickness
| Control | AD | Z | P | |
|---|---|---|---|---|
| Proximal subiculum | ||||
| Molecular layer | 860.3 (346.0) | 445.8 (124.4) | 4.19 | <0.0001 |
| Pyramidal cell layer | 835.2 (279.5) | 688.6 (223.4) | 1.33 | 0.184 |
| Fusiform cell layer | 255.0 (82.4) | 196.8 (85.0) | 1.66 | 0.097 |
| Total Proximal Subiculum Thickness | 1950.5 (473.4) | 1331.2 (322.6) | 3.52 | 0.0004 |
| Distal subiculum | ||||
| Molecular layer | 731.9 (196.5) | 463.7 (126.3) | 3.82 | 0.0001 |
| Pyramidal cell layer | 840.5 (336.4) | 550.9 (192.3) | 2.24 | 0.025 |
| Fusiform cell layer | 354.9 (98.7) | 278.6 (83.9) | 2.11 | 0.034 |
| Total Distal Thickness | 1927.3 (473.1) | 1293.2 (317.1) | 3.28 | 0.001 |
| Average | ||||
| Molecular layer | 796.1 (245.5) | 454.7 (110.1) | 4.4 | <0.0001 |
| Pyramidal cell layer | 837.8 (289.7) | 619.8 (186.0) | 1.87 | 0.06 |
| Fusiform cell layer | 304.9 (77.6) | 237.7 (67.7) | 2.24 | 0.02 |
| Total thickness | 1938.9 (430.7) | 1312.2 (283.2) | 3.65 | 0.0003 |
Data shown in micrometers.
Dendritic Arborization
Raw dendritic arborization indices were similar between groups in all three layers: molecular layer average 7.8% (SD = 4.2%) in AD and 7.7% (7.6%) in controls; pyramidal layer 11.4% (5.1%) in AD and 12.0% (6.0%) in controls; fusiform layer 8.3% (5.3%) in AD and 7.4% (5.4%) in controls. Corrected for atrophy, significant reductions in the dendritic arborization index were observed in all layers of the subiculum as a whole, and in both proximal and distal portions (Figure 2 ▶ ; Table 3 ▶ ). Differences were especially robust in the molecular layer where dendrites were reduced by an average of 60% in AD compared to control cases. Furthermore, in qualitative analyses, molecular layer dendrites often appeared dystrophic. The distal portion of the subiculum exhibited slightly greater decreases in the dendritic arborization index than the proximal portion. Because the EC projections concentrate in the superficial portion of the molecular layer of the subiculum, we compared groups for the relative dendritic arborization index in the deep versus superficial portions of the molecular layer with the hypothesis that the superficial portion of the molecular layer would be more depleted of dendrites than the deep, given the well-recognized severity of entorhinal degeneration. The deep/superficial ratio for the subiculum as a whole showed no differences between groups, with a ratio of 1.4 for the AD group compared to 1.6 for the controls (Z = 1.33, P = 0.18). Similar results were observed in proximal and distal subdivisions.
Figure 2.

MAP2 (M13)-labeled subiculum. Low magnification photomicrographs (top) demonstrate marked difference in laminar thickness between control (a) and AD (b) (bar, 0.5 mm). High magnification views of molecular layer from same cases (bottom) shows typical dystrophic morphology of dendrites in AD (d) compared to control (c) case (bar, 25 μm).
Table 3.
Dendritic Arborization
| Control | AD | Z | P | |
|---|---|---|---|---|
| Proximal subiculum | ||||
| Molecular layer | 6.6 (7.4) | 3.1 (3.8) | 2.24 | 0.025 |
| Superficial molecular layer | 5.9 (9.8) | 2.0 (1.6) | 2.42 | 0.015 |
| Deep molecular layer | 7.3 (6.0) | 3.4 (3.7) | 2.36 | 0.018 |
| Pyramidal cell layer | 12.8 (12.4) | 6.2 (4.5) | 1.83 | 0.068 |
| Fusiform cell layer | 6.5 (4.1) | 3.7 (2.5) | 1.95 | 0.051 |
| Distal subiculum | ||||
| Molecular layer | 8.9 (12.1) | 3.1 (2.7) | 2.45 | 0.014 |
| Superficial molecular layer | 7.9 (11.9) | 2.8 (2.7) | 2.11 | 0.034 |
| Deep molecular layer | 9.9 (12.4) | 3.5 (2.8) | 2.65 | 0.008 |
| Pyramidal cell layer | 13.8 (13.9) | 4.4 (3.3) | 2.70 | 0.007 |
| Fusiform cell layer | 7.4 (5.1) | 3.5 (2.0) | 2.60 | 0.009 |
| Average | ||||
| Average molecular layer | 7.7 (9.0) | 3.1 (2.9) | 2.53 | 0.011 |
| Superficial molecular layer | 6.9 (9.9) | 2.6 (2.3) | 2.07 | 0.038 |
| Deep molecular layer | 8.6 (8.8) | 3.4 (2.9) | 2.57 | 0.010 |
| Pyramidal cell layer | 13.3 (12.2) | 5.3 (3.6) | 2.45 | 0.014 |
| Fusiform cell layer | 7.0 (4.5) | 3.6 (1.6) | 2.65 | 0.008 |
Data shown are for % area occupied by MAP2-immunoreactive dendrites, corrected for neuron density and atrophy.
Neuron, NFT Density and Aβ Plaque Burden
The density of neurons in the subiculum (pyramidal and fusiform layers combined, Table 4 ▶ ) in AD was decreased approximately 50% without noteworthy difference between proximal or distal sectors. As expected, the densities of NFTs were significantly increased in AD throughout the subiculum, approximately four-fold compared to control brains. The density of NFTs in the proximal sector of the subiculum in AD was almost twice that of the distal sector, whereas similar low levels in both sectors were seen in the control group. The Aβ plaque burden was similarly increased in AD.
Table 4.
Densities of NeuN-Labeled Neurons, PHFtau-Immunoreactive NFTs (per mm3, Corrected for Atrophy) and Aβ Plaque Burden
| Control | AD | Z | P | |
|---|---|---|---|---|
| NeuN neurons | ||||
| Proximal subiculum | 127.0 (71.7) | 70.0 (41.7) | 2.36 | 0.018 |
| Distal | 125.2 (95.4) | 61.2 (37.0) | 2.24 | 0.025 |
| Average | 125.2 (74.0) | 66.3 (34.3) | 2.32 | 0.020 |
| Neurofibrillary tangles | ||||
| Proximal subiculum | 9.7 (15.7) | 57.1 (39.7) | 3.71 | 0.0002 |
| Distal | 7.8 (11.1) | 30.3 (20.0) | 3.2 | 0.001 |
| Average | 9.8 (16.2) | 42.2 (25.6) | 3.52 | 0.0004 |
| Amyloid β plaque (% Area) | ||||
| Average | 0.21 (0.33) | 0.78 (0.58) | 2.51 | 0.012 |
Correlation of NFT and Aβ Pathology with Dendrites and Neuron Loss
We assessed the relationship of dendritic arborization to NFT counts and Aβ plaque burden in the subiculum for the whole sample. The average dendritic arborization index (mean of proximal and distal values) negatively correlated with NFT density in the pyramidal layer (Spearman’s ρ = −0.59, P = 0.0009) and fusiform layer (ρ = −0.46, P = 0.015) and approached significance in the molecular layer (ρ = −0.36, P = 0.06). Subregional analyses found the correlations to be most prominent in the distal half of the subiculum. There were no significant correlations between dendritic arborization index values and Aβ plaque density values.
NeuN-immunoreactive neuron density also negatively correlated with NFT density in the subiculum as a whole (ρ = −0.70, P < 0.0001) and for proximal (ρ = −0.71, P < 0.0001) and distal halves (ρ = −0.68, P < 0.0001). There was a marginally significant decrease in neuron density in relation to Aβ plaque density (ρ = −0.47, P = 0.05).
Discussion
Using MAP2 immunohistochemistry combined with systematic sampling and image analysis, we developed a dendritic arborization index to quantify the amount of MAP2-labeled dendrites in a brain section. This method allows more rapid measurement of dendritic changes than is possible with the Golgi technique, thus facilitating neuroanatomic assessment of all labeled dendrites and not just selected neurons that happen to stain with Golgi in a given section. Morphological detail with MAP2 immunostaining is excellent and has been likened to the appearance of Golgi staining, 21 although the high density and overlap of MAP2-labeled dendrites within a section, as well as the thin sections needed for antibody penetration, preclude the tracing of the dendritic tree of an individual cell. The index captures the total load of dendritic immunoreactivity in a rapid manner suitable for high-throughput analyses and correlation with pathological and clinical variables. However, it does not capture other information about dendrites that could be of interest such as length and girth of individual branches, number of branch points, or dendritic spines.
In this study of AD and elderly control subjects, raw dendrite densities obtained by the algorithm did not differ between the Alzheimer and control group. However, marked atrophy in AD was visually apparent and quantitatively resolved in the large reductions in laminar thicknesses. The volume of a given region or layer is a function of the space-occupying elements of which it is composed, including neuronal and non-neuronal cells and their associated processes, as well as extracellular matrix. Space occupied by dendrites exceeds that of other neuronal or non-neuronal elements within the cortex. This is especially true in the molecular layer which is predominantly dendritic. Our data indicates that the reduction in laminar thickness, which was most dramatic in the molecular layer, is predominantly due to the loss of dendrites. If it were due to loss of other elements or artifactual shrinkage (eg, by differences in dehydration between groups during processing), then the raw dendritic arborization indices would be increased. These considerations indicate the necessity of correcting the raw measures of dendrite material for estimates of normalized volume, or some index related to volume, rather than raw densities obtained by image analysis of individual sections alone. Our data show significant reductions in the amount of dendrites in the subiculum in AD.
Stereologic studies of the subiculum have shown reductions in neuronal number in AD, particularly in later stages. 8,22 Our available material did not allow us to determine the total volume of the subiculum and so we could not estimate the total numbers of neurons or NFTs (or total loads of Aβ or MAP2 dendrites) in the subiculum. However, our data do provide support for marked neuron loss in the subiculum in AD in that the density of neurons corrected for atrophy was significantly reduced.
As expected, we found that the density of NFTs was significantly higher in AD than control subiculum. Of particular note is that dendritic arborization indices negatively correlated with the densities of NFTs in the subiculum as a whole, and in the distal sector in particular. In contrast, while the Aβ plaque burden was also increased in AD, we observed no significant correlations with dendritic arborization. This suggests that neurofibrillary degeneration is more directly related to dendritic pathology than is Aβ. Negative correlations of neuron density with NFTs and Aβ plaque burden were also observed.
Dendritic loss in AD may be due to a number of causes. First, as supported by our correlation data, it is probable that accumulation of PHFtau in the form of NFTs and neuropil threads in dendrites leads to retraction and loss of dendritic arbors. Another possibility is a physical or toxic effect of Aβ on dendrites, either in its insoluble or soluble forms. Tau and MAP2-immunoreactive neuropil threads, present in dendrites (and axons) are a prominent component of neuritic plaques. Adlard and Vickers 2 found an increased MAP2 immunodensity in diffuse plaques and normal or decreased MAP2 in fibrillar or cored plaques. Neuron culture experiments with Aβ indicate a complex effect on neurites, with both trophic and dystrophic effects. 3,23 In our study, Aβ plaques of all types were sparse in the AD subiculum, occupying less than 1% of the area, and there was no correlation with MAP2 dendrite values. Thus, it is unlikely that insoluble Aβ plaques are directly related to dendritic loss, although an effect of soluble Aβ cannot be excluded. A third possibility is that loss of dendrites may occur due to deafferentation. 24 Experimental disruption of the EC projection to the dentate gyrus has been shown to cause a reduction in the extent of deafferented granule cell dendrites. 25 The extent of these dendrites is also reduced in AD, 24 suggesting that dendrite degeneration secondary to deafferentation may occur in AD. Furthermore, phosphorylated tau accumulations appear in the outer portion of the molecular layer of the dentate gyrus at Braak stage III, while NFTs and staining of the inner dendrites and mossy fibers of the granule cells does not occur until stage V. This corresponds with the termination zone of the perforant path which projects to the outer portions of the molecular layer of the dentate gyrus. These data suggest that changes in distal dendrites might precede cell body changes in dentate gyrus neurons.
The major afferent innervations of the subiculum are from CA1 and the EC (Figure 1) ▶ . These are two of the most severely affected regions of all in AD,26 even more so than the subiculum. 8 Thus, secondary dendritic retraction due to deafferentation may also contribute to the diminished dendritic arborization in the subiculum.
Topographical studies of neurofibrillary changes in AD suggest a relationship between AD progression and known patterns of anatomical connectivity. 7,26 Informed by this connectivity, larger studies examining dendrite loss in the subiculum and highly linked regions across a spectrum of normal aging, mild cognitive impairment and dementia (representing sequential stages of degeneration) could test this hypothesis. These studies would help clarify the pathoanatomic sequence of synaptic, dendritic, and neuronal degeneration, PHFtau and Aβ lesions. If supported, subsequent identification of the molecular mechanisms by which such transynaptic degeneration might occur offers a focus for the development of novel treatments to arrest the process in its early stages. 27
Footnotes
Address reprint requests to Steven E. Arnold, M.D., 547 Clinical Research Building, 415 Curie Boulevard, Philadelphia, PA 19104. E-mail: sarnold@mail.med.upenn.edu.
Supported by grants AG10124, MH57401, AG09215, AG15819, and AG17917 from the National Institutes of Health.
References
- 1.Uylings HBM, West MJ, Coleman PD, DeBrabander JM, Flood DG: Neuronal and cellular changes in the aging brain. Clark CM Trojanowski JQ eds. Neurodegenerative Dementias. 2000:pp 61-78 McGraw-Hill New York
- 2.Adlard PA, Vickers JC: Morphologically distinct plaque types differentially affect dendritic structure and organisation in the early and late stages of Alzheimer’s disease. Acta Neuropathol (Berl) 2002, 103:377-383 [DOI] [PubMed] [Google Scholar]
- 3.Grace EA, Rabiner CA, Busciglio J: Characterization of neuronal dystrophy induced by fibrillar amyloid β: implications for Alzheimer’s disease. Neuroscience 2002, 114:265-273 [DOI] [PubMed] [Google Scholar]
- 4.Le R, Cruz L, Urbanc B, Knowles RB, Hsiau-Ashe K, Duff K, Irizarry MC, Stanley HE, Hyman BT: Plaque-induced abnormalities in neurite geometry in transgenic models of Alzheimer disease: implications for neural system disruption. J Neuropathol Exp Neurol 2001, 60:753-758 [DOI] [PubMed] [Google Scholar]
- 5.Wong RO, Ghosh A: Activity-dependent regulation of dendritic growth and patterning. Nat Rev Neurosci 2002, 3:803-812 [DOI] [PubMed] [Google Scholar]
- 6.Braak H, Braak E: Staging of Alzheimer’s disease-related neurofibrillary changes. Neurobiol Aging 1995, 16:271-284 [DOI] [PubMed] [Google Scholar]
- 7.Braak H, Braak E, Bohl J, Bratzke H: Evolution of Alzheimer’s disease-related cortical lesions. J Neural Transm Suppl 1998, 54:97-106 [DOI] [PubMed] [Google Scholar]
- 8.West MJ, Coleman PD, Flood DG, Troncoso JC: Differences in the pattern of hippocampal neuronal loss in normal ageing and Alzheimer’s disease. Lancet 1994, 344:769-772 [DOI] [PubMed] [Google Scholar]
- 9.Witter MP, Amaral DG: Entorhinal cortex of the monkey: v. projections to the dentate gyrus, hippocampus, and subicular complex. J Comp Neurol 1991, 307:437-459 [DOI] [PubMed] [Google Scholar]
- 10.Garcia-Sierra F, Hauw JJ, Duyckaerts C, Wischik CM, Luna-Munoz J, Mena R: The extent of neurofibrillary pathology in perforant pathway neurons is the key determinant of dementia in the very old. Acta Neuropathol (Berl) 2000, 100:29-35 [DOI] [PubMed] [Google Scholar]
- 11.Morris JC: The Clinical Dementia Rating (CDR): current version and scoring rules. Neurology 1993, 43:2412-2414 [DOI] [PubMed] [Google Scholar]
- 12.Braak H, Braak E: Neuropathological staging of Alzheimer-related changes. Acta Neuropathol (Berl) 1991, 82:239-259 [DOI] [PubMed] [Google Scholar]
- 13.Duvernoy HM: The Human Hippocampus: An Atlas of Applied Anatomy. 1988. J. F. Bergmann Munich
- 14.: NIA-Reagan Working Group: Consensus recommendations for the postmortem diagnosis of Alzheimer’s disease. Neurobiol Aging 1997, 18:S1-S2 [PubMed] [Google Scholar]
- 15.Arai H, Lee VM-Y, Messinger ML, Greenberg BD, Lowery DE, Trojanowski JQ: Expression patterns of β-amyloid precursor protein (β-APP) in neural and nonneural human tissues from Alzheimer’s disease and control subjects. Ann Neurol 1991, 30:686-693 [DOI] [PubMed] [Google Scholar]
- 16.Rosene DL, Hoesen GWV: The hippocampal formation of the primate brain.Cerebral Cortex Jones EG Peters A eds. Further Aspects of Cortical Function, Including Hippocampus 1987, vol 6:pp 345-456 Plenum New York [Google Scholar]
- 17.Kloosterman F, Witter MP, Van Haeften T: Topographical and laminar organization of subicular projections to the parahippocampal region of the rat. J Comp Neurol 2003, 455:156-171 [DOI] [PubMed] [Google Scholar]
- 18.Witter MP, Groenewegen HJ: The subiculum: cytoarchitectonically a simple structure, but hodologically complex. Prog Brain Res 1990, 83:47-58 [DOI] [PubMed] [Google Scholar]
- 19.Mitchell TW, Mufson EJ, Schneider JA, Cochran EJ, Nissanov J, Han LY, Blenias JL, Lee VM, Trojanowski JQ, Arnold SE: Parahippocampal tau pathology in healthy aging, mild cognitive impairment, and early Alzheimer’s disease. Ann Neurol 2002, 51:182-189 [DOI] [PubMed] [Google Scholar]
- 20.Mitchell TW, Nissanov J, Han LY, Mufson EJ, Schneider JA, Cochran EJ, Bennett DA, Lee VM, Trojanowski JQ, Arnold SE: Novel method to quantify neuropil threads in brains from elders with or without cognitive impairment. J Histochem Cytochem 2000, 48:1627-138 [DOI] [PubMed] [Google Scholar]
- 21.Goodlett CR, Hamre KM, West JR: Regional differences in the timing of dendritic outgrowth of Purkinje cells in the vermal cerebellum demonstrated by MAP2 immunocytochemistry. Brain Res Dev Brain Res 1990, 53:131-134 [DOI] [PubMed] [Google Scholar]
- 22.Rossler M, Zarski R, Bohl J, Ohm TG: Stage-dependent and sector-specific neuronal loss in hippocampus during Alzheimer’s disease. Acta Neuropathol (Berl) 2002, 103:363-369 [DOI] [PubMed] [Google Scholar]
- 23.Koo EH, Park L, Selkoe DJ: Amyloid β-protein as a substrate interacts with extracellular matrix to promote neurite outgrowth. Proc Natl Acad Sci USA 1993, 90:4748-4752 [DOI] [PMC free article] [PubMed] [Google Scholar]
- 24.Anderton BH, Callahan L, Coleman P, Davies P, Flood D, Jicha GA, Ohm T, Weaver C: Dendritic changes in Alzheimer’s disease and factors that may underlie these changes. Prog Neurobiol 1998, 55:595-609 [DOI] [PubMed] [Google Scholar]
- 25.Diekmann S, Ohm TG, Nitsch R: Long-lasting transneuronal changes in rat dentate granule cell dendrites after entorhinal cortex lesion: a combined intracellular injection and electron microscopy study. Brain Pathol 1996, 6:205-215 [DOI] [PubMed] [Google Scholar]
- 26.Arnold SE, Hyman BT, Flory J, Damasio AR, Hoesen GWV: The topographical and neuroanatomical distribution of neurofibrillary tangles and neuritic plaques in the cerebral cortex of patients with Alzheimer’s disease. Cereb Cortex 1991, 1:103-116 [DOI] [PubMed] [Google Scholar]
- 27.Geula C: Abnormalities of neural circuitry in Alzheimer’s disease: hippocampus and cortical cholinergic innervation. Neurology 1998, 51:S18-S29S65–S67 [DOI] [PubMed] [Google Scholar]