

Abstract
The genetically dystonic (dt) rat, an autosomal recessive model of generalized dystonia, harbors an insertional mutation in Atcay. As a result, dt rats are deficient in Atcay transcript and the neuronally-restricted protein caytaxin. Previous electrophysiological and biochemical studies have defined olivocerebellar pathways, particularly the climbing fiber projection to Purkinje cells, as a site of significant functional abnormality in dt rats. In normal rats, Atcay transcript is abundantly expressed in the granular and Purkinje cell layers of cerebellar cortex. To better understand the consequences of caytaxin deficiency in cerebellar cortex, differential gene expression was examined in dt rats and their normal littermates. Data from oligonucleotide microarrays and quantitative real-time RT-PCR (QRT-PCR) identified phosphatidylinositol signaling pathways, calcium homeostasis, and extracellular matrix interactions as domains of cellular dysfunction in dt rats. In dt rats, genes encoding the corticotropin-releasing hormone receptor 1 (CRH-R1, Crhr1) and calcium-transporting plasma membrane ATPase 4 (PMCA4, Atp2b4) showed the greatest up-regulation with QRT-PCR. Immunocytochemical experiments demonstrated that CRH-R1, CRH, and PMCA4 were up-regulated in cerebellar cortex of mutant rats. Along with previous electrophysiological and pharmacological studies, our data indicate that caytaxin plays a critical role in the molecular response of Purkinje cells to climbing fiber input. Caytaxin may also contribute to maturational events in cerebellar cortex.
Animal models provide unique platforms to explore motor systems and, consequently, often engender novel insights into the molecular and systems neurobiology of human movement disorders (LeDoux, 2004a). A major example of this concept can be found in studies of the genetically dystonic rat (SD-dt:JFL), an animal model of generalized dystonia. Dystonia is a motor syndrome of sustained muscle contractions, frequently causing twisting and repetitive movements, or abnormal postures (Fahn et al., 1987). Primary dystonia includes syndromes in which dystonia is the sole phenotypic manifestation with the exception that tremor can be present as well. Primary dystonia may manifest in generalized, segmental, or focal distributions. Focal dystonias usually present during adult life, whereas generalized dystonias usually begin in childhood.
The dt rat is a spontaneous mutant discovered in the Sprague-Dawley strain (Lorden et al., 1984; LeDoux, 2004b). The dt rat can be reliably distinguished from normal littermates by Postnatal Day 12 (P12). Dystonic rats exhibit axial and appendicular dystonia that progresses in severity with increasing postnatal age. Without intervention, dt rats do not live beyond P40. With normal-sized litters of ten to twelve pups, dt rats maintain body weight until at least P16 (Lorden et al., 1984). Gross brain morphology is normal in the dt rat. Cresyl violet, hematoxylin and eosin, periodic acid-Schiff, Luxol fast blue, and silver-stained central and peripheral nervous tissues from dt rats are normal (Lorden et al., 1984). In addition, Golgi-stained striatal neurons are structurally normal in the mutants (McKeon et al., 1984). Quantitative morphological studies have shown the dt rats have normal Purkinje cell numbers, molecular and granular layer thickness, and soma size of cerebellar nuclear neurons (Lorden et al., 1984; 1992). However, in vermian and paravermian tissues, Purkinje cell somas are 5–11% smaller in dt rats than in normal littermates (Lorden et al., 1985). This effect is not generalized and may be specific to Purkinje cells since there are no differences in the size of hippocampal pyramidal neurons from dt and normal rats.
Olivocerebellar pathways, particularly the post-synaptic response of Purkinje cells to climbing fiber input, are functionally abnormal in the dt rat. The dt rat does not tremor after administration of harmaline (Lorden et al., 1985). Correspondingly, basal and harmaline-stimulated cyclic guanosine monophosphate (cGMP) levels and complex spike firing rates are depressed in the mutants (Lorden et al., 1985; LeDoux and Lorden, 2002). In comparison with normal littermates, complex spikes produce less suppression of simple spikes in dt rats. In addition, simple spikes tend to exhibit rhythmic bursting patterns in the mutants (LeDoux and Lorden, 2002). As a consequence of these bursting firing patterns and a slight trend towards higher simple spike firing rates in dt rats, glucose utilization and glutamic acid decarboxylase (GAD) activity are increased while muscimol binding is decreased in the cerebellar nuclei of the mutants (Oltmans et al., 1986; LeDoux, 2004b)
Single-unit electrophysiological recordings from the cerebellar nuclei identified rhythmic bursting firing patterns in the mutants (LeDoux et al., 1998) and the severe dystonia exhibited by dt rats was eliminated by cerebellectomy (LeDoux et al., 1993). Classically and commonly attributed to dysfunction of the basal ganglia (Hallett, 1993; Berardelli et al., 1998; Sanger et al., 2003), experiments in the dt rat suggested, instead, that dystonia may arise from abnormal cerebellar output (LeDoux et al., 1993; LeDoux et al., 1998; Raike et al., 2005).
All of the electrophysiological and biochemical abnormalities described to date in the dt rat can be ascribed to autosomal recessive-inheritance of hypomorphic Atcay alleles (Xiao and LeDoux, 2005). Atcay encodes a protein named caytaxin (Bomar et al., 2003; Xiao and LeDoux, 2005). With radioactive in situ hybridization, Atcay transcripts are widely distributed throughout the central nervous system of normal rats (Xiao and LeDoux, 2005). Autosomal recessive mutations of Atcay are associated with dystonia and varying degrees of ataxia in jittery, hesitant, and sidewinder lines of mice (Kapfhamer et al., 1996; Bomar et al., 2003; Gilbert et al., 2004). Ataxia, a common manifestation of hereditary (e.g., spinocerebellar ataxia type 1) and acquired (e.g., ischemic stroke) diseases that affect the cerebellum and its afferent and efferent pathways, is characterized by movements that are asynergic, inaccurate, and dysmetric. Interestingly, autosomal recessive mutations of the human ortholog, ATCAY, have been identified in patients with a rare form of ataxia found on Grand Cayman Island (Bomar et al., 2003). Thus, the phenotypic consequences of caytaxin deficiency depend on genetic background. Along these lines, it is intriguing to speculate that caytaxin may be part of a biochemical network at the molecular boundary between ataxia and dystonia.
In cerebellum, Atcay transcripts are present in all three layers of cortex (Xiao and LeDoux, 2005). Expression of Atcay transcript increases linearly in cerebellar cortex from P1 through P36, a period critical to the maturation of cerebellar Purkinje cells and their climbing fiber afferents. Furthermore, in the molecular layer, transcript density peaks at P14. In aggregate, normative studies of Atcay transcripts along with a large body of work detailing olivocerebellar dysfunction in the dt rat, indicates that caytaxin deficiency in cerebellar cortex is causally associated with the mutant’s motor syndrome.
To explore the downstream effects of cerebellar cortical caytaxin deficiency in greater detail, differential gene expression studies were performed in dt rats and their phenotypically-normal littermates. The experiments described herein serve the twofold purpose of enhancing our understanding of (1) caytaxin and (2) molecular mechanisms involved in generalized dystonia. Oligonucleotide microarrays, relative quantitative real-time reverse transcriptase-PCR (QRT-PCR), and immunocytochemistry were sequentially applied to the examination of gene expression in dt rat cerebellar cortex for comparison with normal littermates.
EXPERIMENTAL PROCEDURES
Animals and tissue acquisition
All experiments were performed in accordance with the National Institutes of Health’s Guide for the Care and Use of Laboratory Animals and the guidelines of the Institutional Animal Care and Use Committee. Dystonic rats and their littermates were obtained from a breeding colony established at the University of Tennessee Health Science Center (UTHSC) in 1997. It should be noted that neither visual inspection nor behavioral testing can be used to phenotypically distinguish wild-type (+/+) from heterozygote (dt/+) littermates (LeDoux, 2004b). In this regard, the microarray experiments described below were performed prior to discovery of the causal mutation in the dt rat and, as such, the groups of phenotypically-normal littermates included both dt/+ and +/+ pups. In contrast, dt/dt rat pups were exclusively compared to +/+ pups in the QRT-PCR and immunocytochemical experiments described below.
To genotype rat pups, gDNA was extracted from tail snips and PCR amplified using a primer pair flanking the insertional mutation (435 bp) in Intron 1 of Atcay (forward: gacacaatggatttgactcagc, reverse: aggtctttactggctcagctct) yielding 697 bp and 1132 bp amplicons for wild-type Atcay and Atcaydt alleles, respectively. An additional reverse primer targeting the insert (gcatgaactcccatttagcata) was used to generate a 488 bp amplicon in the presence of Atcaydt. PCR amplification was performed with Taq2000 (Stratagene, La Jolla, CA, USA, www.stratagene.com) in the following manner: 94 °C for 3 min, 35 cycles at 94 °C for 30 s, 58 °C for 30 s and 72 °C for 45 s, with final extension occurring at 72 °C for 10 min.
Microarray analysis
Six Affymetrix (Santa Clara, CA, USA, www.affymetrix.com) Rat 230A GeneChip® probe arrays were used to compare olivocerebellar gene expression between dt rats and gender-matched phenotypically-normal littermates at P18. The P18 developmental time point was chosen for microarray analysis to maximize detection of differential gene expression in cerebellar cortex due to caytaxin deficiency while, at the same time, limiting the potential effects of nutritional deficiency and severe motoric disability. Prior to P15, the dt rat motor syndrome is relatively mild and cerebellar cortex is quite immature. After P20, dt rat pups typically manifest marked ambulatory deficits, have difficulty feeding, and lose weight.
The Rat 230A chip contains probe sets for 4,699 full-length genes and 10,467 expressed sequence tags (ESTs). Pooled cerebellar cortex harvested from 3 rats was used for each Rat 230A GeneChip®. Total RNA was extracted with RNAwiz™ (Ambion, Austin, TX, USA, www.ambion.com) and quality was assessed with an Agilent Bioanalyzer 2100 (Agilent Technologies, Palo Alto, CA, USA, www.homeagilent.com) prior to synthesis of 1st and 2nd strand cDNA. Synthesis and labeling of cRNA probes, hybridization to GeneChip® expression arrays, and acquisition of fluorescence intensities was performed by Genome Explorations (Memphis, TN, USA, www.genome-explorations.com). Double-stranded cDNA was used to synthesize biotin labeled cRNA. The cRNA was hybridized to an Affymetrix Test 3 chip to check transcript integrity. Multiple housekeeping and spike controls were also utilized to assess data reliability. In addition, 100 pM CreX, 25 pM BioD, 5 pM BioC, and 1.5 pM BioB were detected in the hybridization cocktail for all six chips. Raw data were generated by Microarray Suite (Affymetrix). The expression values from Microarray Suite were pre-processed and analyzed using GeneSpring GX 7.3 (Agilent Technologies). To correct for variations in sample loading and staining, expression values were normalized to the median expression value for all probe sets on each chip as well as the median expression value for each gene across the set of 6 arrays. Then, these normalized expression values were employed for t-tests and calculation of fold-changes. Gene annotation and ontological information (www.geneontology.com) is integrated into the GeneSpring GX 7.3 software package.
Relative quantitative real-time reverse transcriptase (RT)-PCR
QRT-PCR with SYBR Green was used to reexamine selected genes showing at least a 1.4x microarray fold change. Total RNA was extracted with RNAwiz™ and genomic DNA was removed with DMA-free™ (Ambion) prior to reverse transcription of RNA (RETROscript™, Ambion). Primers were designed using Primer Express® (Applied Biosystems [ABI], Foster City, CA, USA, www.appliedbiosystems.com) to generate unique amplicons for each gene under study. QRT-PCR was performed using the ABI 7900 Real Time PCR System with the SYBR Green Master Mix Kit (ABI) based on ABI protocol. Samples were normalized to 18S rRNA expression levels. Fold change was determined using the comparative CT method. For each gene, transcript levels were compared between 4 phenotypically-normal wild-type (+/+) and 4 dt P18 rat cerebellae (different from those used for microarray) to generate a median value for fold change.
Immunocytochemistry
The two genes showing the most prominent up-regulation in dt rat cerebellar cortex (Crhrl, Atp2b4) were examined at the encoded protein level using immunocytochemistry. The corticotropin-releasing hormone receptor 1 (CRH-R1, Crhr1) and calcium-transporting plasma membrane ATPase 4 (PMCA4, Atp2b4) were detected with goat polyclonal (sc-1757, Santa Cruz Biotechnology, Santa Cruz, CA, USA, www.scbt.com) and mouse monoclonal (MA1-914, Affinity BioReagents, Golden, CO, USA, www.bioreagents.com) antibodies, respectively. A rabbit anti-calbindin D-28K polyclonal antibody (AB1778, Chemicon International, Temecula, CA, www.chemicon.com) was used to mark cerebellar Purkinje cells.
Perfusion-fixed (normal saline-4% paraformaldehyde in 0.1 M phosphate-buffered saline [PBS]) brains from P18 dt rats and wild-type (+/+) littermates were sectioned in the mid-sagittal plane. Then, the left and right halves of dt rat brains were bound to the opposite halves of normal littermate brains with Tissue-Tek® (Electron Microscopy Sciences, Hatfield, PA, USA, www.emsdiasum.com). In this fashion, all subsequent processing steps were identical for tissues from dt rats and normal littermates. Coronal sections (20 μm) of cerebellae were collected in six series onto Superfrost Plus microscope slides (Fisher Scientific, www.fisherscientific.com). One series of slides was air dried overnight and stained with cresyl violet (Sigma, St. Louis, MO, UA, www.sigma.com). Two series were used for immunocytochemical detection of PMCA4 or CRH-R1 with a nickel-intensified 3,3′-diaminobenzidine solution (Ni-DAB, Vector Laboratories, Burlingame, CA, USA, www.vectorlabs.com). The three remaining series were processed for immunofluorescent detection of PMCA4, CRH-R1, and calbindin D-28K. The collection of sections on each slide was circled with a PAP pen (Electron Microscopy Sciences), dried on a slide warmer for 10 min, placed in a slide rack, and immersed within PBS.
The protocol for detection of PMCA4 proceeded as follows: (1) rinsed slides in PBS x 2 over 30 min on a rotary shaker; (2) quenched endogenous peroxidases with 10% methanol and 3% H2O2 in PBS for 5 min on a rotary shaker; (3) rinsed in PBS x 3 over 30 min on a rotary shaker; (4) blocked with 2% nonfat dry milk and permeabilized with 0.3% Triton X-100 (Sigma) for 1 hr; (5) rinsed in PBS x 3 over 30 min on a rotary shaker; (6) incubated with primary antibody (MA1-914, 1:200), 3% horse serum and 0.1% Triton X-100 (Sigma) in PBS overnight; (7) rinsed in PBS x 3 over 30 min on a rotary shaker; (8) incubated with secondary antibody (biotinylated horse anti-mouse, 1:500; Vector Laboratories), 2% horse serum and 0.1% Triton X-100 in PBS for 4 hr; (9) rinsed in PBS x 3 over 30 min on a rotary shaker; (10) incubated with streptavidin (Vector Laboratories) for 1 hr; (11) rinsed in PBS x 3 over 30 min on a rotary shaker; and (12) incubated with Ni-DAB solution (Vector Laboratories). An analogous protocol was followed for detection of CRH-R1 with sc-1757 (1:800) except that the secondary antibody and blocking serum were derived from rabbit. To provide a correlate to differential CRH-R1 expression, the distribution and intensity of CRH-immunoreactivity (IR) was examined in separate groups of perfusion-fixed brains from P18 dt rats and wild-type littermates. With steps identical to the PMCA4 and CRH-R1 protocols, CRH was detected with a polyclonal guinea pig primary antibody (1:15,000; T-5007, Peninsula Laboratories, San Carlos, CA, USA, www.bachem.com) and a biotinylated goat anti-guinea pig secondary body. Slides were thoroughly rinsed, air dried overnight, dehydrated, cleared, and coverslipped. Null controls (i.e., no primary antibody) were included with initial runs.
Double-label fluorescence immunocytochemistry for PMCA4, calbindin D-28K, and CRH-R1 was used to examine the relationships between either PMCA4-IR or CRH-R1-IR and cerebellar Purkinje cells. PMCA4 was detected with MA1-914 (1:300) and a Cy2-tagged donkey anti-mouse secondary antibody (1:250, Jackson ImmunoResearch, West Grove, PA, USA, www.jacksonimmuno.com). CRH-R1 was detected with sc-1757 (1:500) and a rhodamine red-X (RRX)-tagged donkey anti-goat secondary antibody (1:250, Jackson ImmunoResearch). Calbindin D-28K was detected with AB1778 (1:1000) and either the Cy2- or RRX-tagged secondary antibodies. Sections were incubated with secondary antibodies for 4 hr and then rinsed, dehydrated, cleared and coverslipped with 1,3 diethyl-8-phenylxanthine mounting media (DPX; Sigma). Sections were visualized with both epifluorescence (Axioplan; Zeiss, Oberkochen, Germany, www.zeiss.com) and confocal laser-scanning (Bio-Rad, Hercules, CA, USA, www.bio-rad.com) microscopes.
RESULTS
Cerebellar cortical transcriptomes
Affymetrix Rat 230A GeneChip® probe arrays were used to compare cerebellar cortical transcriptomes between dt rats and gender-matched phenotypically-normal littermates at P18 (Table 1). Particular attention was paid to the expression of genes on Chr 7q11 to explore the possibility that the Atcaydt insertional mutation influences nearby gene transcription. Using Affymetrix terminology, 22 transcripts were absent (A) on all three dt rat chips (AAA) and present (P) on all three normal rat chips (PPP). Of these transcripts, only the cAMP responsive element modulator (CREM) showed greater than a two-fold difference between normal and dt rats (P, not significant). The CREM gene is not located near Atcay on 7q11. Five transcripts derived from Chr 7q11 had a P < 0.10 for the difference between dt and normal rats, although the fold change was less than 2 for all: small glutamine-rich tetratricopeptide repeat containing protein (Stg), glutamate receptor NMDA3B (Grin3b), megakaryocyte-associated tyrosine kinase (Matk), solute carrier family 1 (high affinity aspartate/glutamate transporter) member 6 (Slc1a6), and nuclear factor I/C (Nfic). Only Stg and Matk are located within 4 Mb of Atcay. Importantly, Atcay is not included on the Affymetrix Rat 230A GeneChip® probe array.
Table 1.
Differentially expressed genes in dt rat cerebellum
| Probe ID | Gene title | Gene symbol |
Fold change |
t-test P-value |
Gene Ontology Biological Process |
Gene Ontology Cellular Component | Gene Ontology Molecular Function |
|---|---|---|---|---|---|---|---|
| 1370787_at | BCL2-like 11 (apoptosis facilitator) | Bcl2l11 | 2.039 | 0.030 | apoptosis | membrane fraction/tubulin | GTPase activity/GTP binding/protein heterodimerization activity |
| 1370912_at | Heat shock 70kD protein 1B | Hspa1a | 1.921 | 0.004 | telomere maintenance | nucleus/cytoplasm | protein binding/ATP binding/unfolded protein binding |
| 1377167_at | Pleckstrin homology domain-containing, family A (phosphoinositide binding specific) member 3 | Plekha3 | 1.707 | 0.029 | --- | membrane | phospholipid binding/phosphatidylinositol binding |
| 1373990_at | solute carrier family 7 (cationic amino acid transporter, y+ system), member 12 | Slc7a12 | 1.682 | 0.036 | transport | extracellular space/cytoplasm/plasma membrane/integral to membrane | amino acid-polyamine transporter activity/amino acid transporter activity |
| 1370602_at | ATPase, Ca++ transporting, plasma membrane 4 | Atp2b4 | 1.615 | 0.021 | cation transport | integral to plasma membrane/membrane //integral to membrane/ | magnesium ion binding/calcium- transporting ATPase activity/calcium ion binding/calmodulin binding/ATP binding/ATPase activity, coupled to transmembrane movement of ions,phosphorylative mechanism/hydrolase activity, acting on acid anhydrides, catalyzing transmembrane movement of substances/PDZ domain binding |
| 1372750_at | Follistatin | Fst | 1.549 | 0.015 | development | extracellular space | activin inhibitor activity |
| 1398289_a_at | corticotropin releasing hormone receptor 1 | Crhr1 | 1.547 | 0.007 | response to stress | extracellular space/integral to plasma membrane | G-protein coupled receptor activity/corticotrophin-releasing factor receptor activity |
| 1370953_at | --- | --- | 1.526 | 0.007 | --- | --- | --- |
| 1387744_at | natriuretic peptide precursor type C | Nppc | 1.514 | 0.008 | --- | extracellular region | hormone activity |
| 1372979_at | Transcribed locus | --- | 1.507 | 0.036 | --- | --- | --- |
| 1375324_at | Clathrin, light polypeptide (Lcb) | Cltb | 1.441 | 0.031 | neurotransmitter transport | clathrin vesicle coat/clathrin coat of coated pit | neurotransmitter transporter activity/calcium ion binding |
| 1387832_at | butyrylcholinesterase | Bche | 1.430 | 0.046 | cocaine metabolism | extracellular region | beta-amyloid binding/catalytic activity/cholinesterase activity/ serine esterase activity/hydrolase activity/enzyme binding |
| 1369271_at | protein kinase, AMP-activated, beta 2 non- catalytic subunit | Prkab2 | 1.430 | 0.021 | fatty acid biosynthesis | cAMP-dependent protein kinase complex | cAMP-dependent protein kinase activity |
| 1375866_at | Transcribed locus, moderately similar to XP_546599.1 PREDICTED: similar to KIAA0346 [Canis familiaris] | --- | 1.428 | 0.033 | --- | --- | --- |
| 1372809_at | hypothetical gene supported by AF152002 | LOC29059 5 | 1.426 | 0.027 | --- | --- | --- |
| 1370651_a_at | inositol polyphosphate phosphatase-like 1 | Inppl1 | 1.415 | 0.035 | phosphate metabolism | --- | inositol-polyphosphate 5-phosphatase activity |
| 1368580_at | syndecan 3 | Sdc3 | 1.409 | 0.005 | cell adhesion | integral to membrane | cytoskeletal protein binding |
| 1387555_at | amiloride-sensitive cation channel 2, neuronal | Accn2 | 1.409 | 0.006 | response to acid/monovalent inorganic cation transport | integral to plasma membrane/synaptosome/dendritic spine and shaft/synapse | ion channel activity/cation channel activity/sodium channel activity/monovalent inorganic cation transporter activity/amiloride-sensitive sodium channel activity |
| 1374870_at | Collagen, type XXVII, alpha 1 | Col27a1 | 1.400 | 0.040 | --- | collagen type XVII | extracellular matrix structural constituent conferring tensile strength |
| 1389655_at | similar to A230072I16Rik protein | RGD1306 819 | 1.396 | 0.039 | apoptosis | mitochondrion | hydrolase activity |
| 1369799_at | 4-aminobutyrate aminotransferase | Abat | 1.394 | 0.033 | synaptic transmission/gamma- aminobutyric acid metabolism | mitochondrion/mitochondrial matrix | 4-aminobutyrate transaminase activity/transferase activity/pyridoxal phosphate binding/(S)-3-amino-2-methylpropionate transaminase activity |
| 1374910_at | cadherin EGF LAG seven- pass G-type receptor 2 | Celsr2 | 1.389 | 0.043 | homophilic cell adhesion /G- protein coupled receptor protein signaling pathway | extracellular space/integral to membrane | G-protein coupled receptor activity/structural molecule activity/calcium ion binding |
| 1377300_at | similar to Dual specificity protein phosphatase 3 (T- DSP11) | LOC498003 | 1.389 | 0.013 | --- | --- | --- |
| 1371069_at | ion transporter protein | Nritp | 1.382 | 0.021 | --- | --- | --- |
| 1371810_at | Transcribed locus | --- | 1.382 | 0.032 | --- | --- | --- |
| 1368551_at | phosphoribosyl pyrophosphate synthetase 2 | Prps2 | 1.379 | 0.021 | ribonucleoside monophosphate biosynthesis | --- | magnesium ion binding/ribose-phosphate diphosphokinase activity /kinase activity/transferase activity/lipoate-protein ligase B activity |
| 1373552_at | similar to novel protein | LOC29686 5 | 1.362 | 0.010 | --- | --- | --- |
| 1388806_at | tetratricopeptide repeat domain 5 | Ttc5 | 1.358 | 0.049 | --- | --- | binding |
| 1371679_at | similar to Synaptopodin-2(Myopodin) | LOC49970 2 | 1.350 | 0.046 | --- | --- | --- |
| 1376562_at | similar to Traf2 and NCK interacting kinase, splice variant 4 | LOC29491 7 | 1.346 | 0.040 | --- | --- | --- |
| 1369694_at | solute carrier family 1 (glial high affinity glutamate transporter), member 2 | Slc1a2 | 1.346 | 0.038 | dicarboxylic acid transport | membrane fraction/integral to plasma membrane/presynaptic membrane/dendritic shaft | L-glutamate transporter activity/high- affinity glutamate transporter activity/carrier activity/sodium:dicarboxylate symporter activity |
| 1369385_at | actin filament associated protein | Afap | 1.331 | 0.041 | regulation of signal transduction | --- | --- |
| 1368236_at | meprin 1 alpha | Mep1a | 1.324 | 0.022 | proteolysis and peptidolysis | extracellular space/soluble fraction/integral to plasma membrane/microvillus/ integral to membrane/meprin A complex | endopeptidase activity/meprin A activity/metallopeptidase activity/zinc ion binding /astacin activity/hydrolase activity |
| 1375354_at | Similar to HT014 | --- | 1.319 | 0.045 | --- | --- | --- |
| 1377821_at | V-erb-b2 erythroblastic leukemia viral oncogene homolog 3 (avian) | Erbb3 | 1.311 | 0.041 | regulation of cell cycle/ transmembrane receptor signaling pathway/peripheral nervous system development | intracellular/integral to plasma membrane | protein-tyrosine kinase activity/transmembrane receptor protein tyrosine kinase activity/epidermal growth factor receptor activity/ATP factor receptor activity/ATP binding/transferase activity |
| 1372129_at | similar to TBC1 domain family, member 8; BUB2- like protein 1; vascular Rab-GAP/TBC-containing | RGD1310 147 | 1.307 | 0.037 | --- | --- | GTPase activator activity/calcium ion binding |
| 1390314_at | --- | 1.298 | 0.011 | --- | --- | --- | |
| 1389068_at | similar to RIKEN cDNA 1110018O08 | MGC9422 6 | 1.290 | 0.038 | --- | --- | --- |
| 1376470_at | formin binding protein 4 | Fnbp4 | 1.286 | 0.041 | cell adhesion/G-protein coupled receptor protein signaling pathway | actin cytoskeleton/integral to membrane | histamine receptor activity/structural molecule activity/protein binding |
| 1372831_at | Transcribed locus | --- | 1.281 | 0.050 | --- | --- | --- |
| 1369256_at | beta-site APP cleaving enzyme | Bace | 1.277 | 0.006 | membrane protein ectodomain proteolysis/ beta-amyloid metabolism | extracellular space/endosome/Golgi apparatus/integral to plasma membrane | aspartic-type endopeptidase activity/pepsin A activity/beta-aspartyl- peptidase activity/aspartic-type signal peptidase activity/hydrolase activity |
| 1389302_at | similar to RIKEN cDNA D030070L09 | RGD1310 199 | 1.271 | 0.023 | --- | --- | --- |
| 1373417_at | phospholipid scramblase 3 | Plscr3 | 1.267 | 0.034 | phospholipid scrambling | plasma membrane/integral to membrane | calcium ion binding/phospholipid scramblase activity |
| 1369134_x_at | potassium voltage gated channel, Shaw-related subfamily, member 3 | Kcnc3 | 1.267 | 0.033 | cation transport/ potassium ion transport | integral to plasma membrane/voltage-gated potassium channel complex | voltage-gated ion channel activity/voltage-gated potassium channel activity/cation channel activity/potassium channel activity/protein binding |
| 1375629_at | --- | --- | 1.265 | 0.043 | --- | --- | --- |
| 1367778_at | hypothetical gene supported by NM_019331 | LOC49773 3 | 1.263 | 0.007 | --- | --- | --- |
| 1371607_at | microtubule-associated protein 4 | LOC36717 1 | 1.261 | 0.045 | --- | --- | --- |
| 1368378_at | formyltetrahydrofolate dehydrogenase | Fthfd | 1.260 | 0.013 | one-carbon compound metabolism/10- formyltetrahydrofolate catabolism | cytoplasm | aldehyde dehydrogenase [NAD(P)+] activity/formyltetrahydrofolate dehydrogenase activity/oxidoreductase activity/hydroxymethyl-, formyl- and related transferase activity/cofactor binding |
| 1393962_at | --- | --- | 1.257 | 0.040 | --- | --- | --- |
| 1367910_at | MAD homolog 4 (Drosophila) | Madh4 | 1.257 | 0.014 | regulation of transcription, DNA-dependent /regulation of transcription from RNA polymerase II promoter//common-partner SMAD protein phosphorylation/SMAD protein heteromerization/SMAD protein nuclear translocation /organogenesis/anterior- posterior pattern formation | intracellular/nucleus/transcrip tion factor complex/cytoplasm | DNA binding/transcription factor activity/ transcription cofactor activity/protein binding |
| 1370161_at | steroid sensitive gene 1 | Ssg1 | 1.256 | 0.033 | --- | --- | --- |
| 1372542_at | Transcribed locus | --- | −1.253 | 0.038 | --- | --- | --- |
| 1383232_at | Transcribed locus | --- | −1.253 | 0.010 | --- | --- | --- |
| 1374462_at | kinesin-associated protein 3 | Kifap3 | −1.255 | 0.020 | protein complex assembly/microtubule-based process/Rho protein signal transduction | endoplasmic reticulum/kinesin II complex | microtubule motor activity/small GTPase regulator activity/Rho guanyl-nucleotide exchange factor activity/kinesin binding |
| 1372625_at | similar to protein phosphatase 1, regulatory subunit 12C | LOC49907 6 | −1.257 | 0.042 | --- | --- | --- |
| 1387806_at | RAS related protein 1b | Rap1b | −1.258 | 0.023 | intracellular protein transport /small GTPase mediated signal transduction/ | membrane | GTPase activity/GTP binding |
| 1373434_at | Transcribed locus | --- | −1.260 | 0.024 | --- | --- | --- |
| 1387051_at | staufen RNA binding protein homolog 1 (Drosophila) | Stau1 | −1.262 | 0.039 | intracellular mRNA localization | intracellular/rough endoplasmic reticulum/microtubule associated complex/ribonucleoprotein complex | double-stranded RNA binding/intracellular transporter activity/protein binding |
| 1388462_at | Transcribed locus | --- | −1.268 | 0.041 | --- | --- | --- |
| 1390021_at | histone 1, H2bh | Hist1h2bh | −1.271 | 0.022 | --- | --- | --- |
| 1371650_at | SUMO/sentrin specific protease 3 | Senp3 | −1.271 | 0.045 | proteolysis and peptidolysis/ubiquitin cycle | nucleolus | ubiquitin-specific protease activity/protein binding/peptidase activity/cysteine-type peptidase activity/hydrolase activity |
| 1377325_a_at | Transcribed locus | --- | −1.271 | 0.021 | --- | --- | --- |
| 1370835_at | epidermal Langerhans cell protein LCP1 | RGD:7084 49 | −1.274 | 0.032 | regulation of transcription, DNA-dependent | chromatin/nucleus | DNA binding |
| 1370859_at | thioredoxin domain containing 7 | Txndc7 | −1.275 | 0.046 | electron transport/protein folding | extracellular space/endoplasmic reticulum | protein disulfide isomerase activity/electron transporter activity/calcium ion binding/isomerase activity/arsenate reductase (thioredoxin) activity |
| 1390407_at | similar to Protein C3orf4 homolog | MGC9447 9 | −1.275 | 0.030 | --- | --- | --- |
| 1377296_at | Transcribed locus | --- | −1.278 | 0.036 | --- | --- | --- |
| 1373843_at | Transcribed locus | --- | −1.279 | 0.009 | --- | --- | --- |
| 1376158_at | --- | --- | −1.280 | 0.038 | --- | --- | --- |
| 1372888_at | ubiquitin conjugation factor E4 A | RGD:1303 173 | −1.281 | 0.037 | --- | --- | --- |
| 1367945_at | ATX1 (antioxidant protein 1) homolog 1 (yeast) | Atox1 | −1.286 | 0.046 | protein folding/copper ion transport/ response to oxidative stress | --- | copper ion transporter activity/copper ion binding/metal ion binding/unfolded protein binding |
| 1373481_at | R3H domain (binds single- stranded nucleic acids) containing | R3hdm | −1.286 | 0.011 | --- | --- | nucleic acid binding/endopeptidase inhibitor activity |
| 1371978_at | Oxysterol binding protein- like 9 | --- | −1.289 | 0.027 | lipid transport/steroid metabolism | --- | --- |
| 1374103_at | Frequenin homolog (Drosophila) | Freq | −1.291 | 0.012 | cell communication/positive regulation of exocytosis/phosphoinositide- mediated signaling | Golgi apparatus/cytosol/axon/dend rite | calcium ion binding |
| 1368038_at | synaptojanin 2 binding protein | Synj2bp | −1.292 | 0.005 | protein targeting/cytoplasm organization and biogenesis/intracellular signaling cascade/Rho protein signal transduction/regulation of endocytosis | mitochondrion/mitochondrial outer membrane/integral to membrane/outer membrane | receptor activity/protein binding |
| 1387237_at | exocyst complex component 7 | Exoc7 | −1.294 | 0.049 | intracellular protein transport/exocytosis | exocyst | protein transporter activity |
| 1389220_at | --- | --- | −1.295 | 0.003 | --- | --- | --- |
| 1373419_at | --- | --- | −1.295 | 0.039 | --- | --- | --- |
| 1399114_at | general transcription factor II E, polypeptide 2 (beta subunit) | Gtf2e2 | −1.298 | 0.009 | regulation of transcription, DNA-dependent/transcription initiation from RNA polymerase II promoter | nucleus/transcription factor TFIIE complex | RNA polymerase II transcription factor activity/translation initiation factor activity/protein binding |
| 1389781_at | similar to hypothetical protein | LOC31567 0 | −1.300 | 0.033 | --- | --- | --- |
| 1387101_at | acyl-CoA synthetase long- chain family member 4 | Acsl4 | −1.300 | 0.045 | fatty acid metabolism | integral to membrane | magnesium ion binding/catalytic activity/long-chain-fatty-acid-CoA ligase activity/ligase activity |
| 1377807_a_at | Similar to IQ motif and WD repeats 1 | −1.315 | 0.019 | --- | --- | --- | |
| 1390207_at | Transcribed locus | --- | −1.316 | 0.022 | --- | --- | --- |
| 1373788_at | Similar to KDEL (Lys-Asp- Glu-Leu) containing 2 protein | --- | −1.320 | 0.048 | --- | --- | --- |
| 1388697_at | inositol polyphosphate-5- phosphatase A | Inpp5a | −1.325 | 0.025 | cell communication/inositol phosphate dephosphorylation | membrane fraction | inositol or phosphatidylinositol phosphatase activity/inositol- polyphosphate 5-phosphatase activity/hydrolase activity |
| 1370954_at | procollagen-proline, 2- oxoglutarate 4- dioxygenase (proline 4- hydroxylase), alpha 1 polypeptide | P4ha1 | −1.326 | 0.022 | peptidyl-proline hydroxylation to 4-hydroxy-L-proline | extracellular space/endoplasmic reticulum | procollagen-proline 4-dioxygenase activity/binding/oxidoreductase activity, acting on single donors with incorporation of molecular oxygen, incorporation of two atoms of oxygen/oxidoreductase activity, acting on paired donors, with incorporation or reduction of molecular oxygen, 2-oxoglutarate as one donor, and incorporation of one atom each of oxygen into both donors |
| 1387502_at | serine/threonine kinase 17b (apoptosis-inducing) | Stk17b | −1.326 | 0.039 | protein amino acid phosphorylation/induction of apoptosis/protein kinase cascade | nucleus | protein serine/threonine kinase activity/protein-tyrosine kinase activity/protein binding/ATP binding/transferase activity |
| 1374864_at | sprouty homolog 2 (Drosophila) | Spry2 | −1.327 | 0.026 | cell-cell signaling/development /organogenesis/regulation of signal transduction | membrane | --- |
| 1373186_at | similar to RIKEN cDNA 5033405K12 | RGD1311 593 | −1.328 | 0.009 | --- | --- | --- |
| 1370812_at | Bcl2-like 1 /// similar to bcl- x short | Bcl2l1/ LOC29319 0 | −1.328 | 0.023 | anti-apoptosis/response to oxidative stress | integral to membrane of membrane fraction/mitochondrial outer membrane | protein binding/caspase inhibitor activity |
| 1372462_at | similar to acetyl CoA transferase-like | MGC9513 8 | −1.329 | 0.036 | --- | --- | --- |
| 1371389_at | hypothetical LOC306766 | LOC30676 6 | −1.336 | 0.028 | --- | --- | --- |
| 1374953_at | similar to CG12279-PA | LOC50042 0 | −1.338 | 0.029 | --- | --- | --- |
| 1373818_at | Potassium channel tetramerisation domain containing 12 | --- | −1.342 | 0.034 | potassium ion transport | voltage-gated potassium channel complex/membrane | voltage-gated potassium channel activity |
| 1376575_at | Transcribed locus | --- | −1.348 | 0.006 | --- | --- | --- |
| 1388942_at | Transcribed locus | --- | −1.349 | 0.005 | --- | --- | --- |
| 1388650_at | topoisomerase (DNA) 2 alpha | Top2a | −1.353 | 0.024 | DNA topological change/chromosome segregation-condensation | condensed chromosome/ nucleus/nucleolus//DNA topoisomerase complex (ATP-hydrolyzing) | DNA binding/DNA topoisomerase (ATP- hydrolyzing) activity/ATP binding |
| 1387161_at | solute carrier family 1 (high affinity aspartate/glutamate transporter), member 6 | Slc1a6 | −1.354 | 0.029 | dicarboxylic acid transport /L- aspartate transport /L- glutamate transport | membrane fraction/integral to plasma membrane | L-glutamate transporter activity/carrier activity/anion transporter activity/L- aspartate transporter activity/symporter activity/sodium:dicarboxylate symporter activity |
| 1389101_at | --- | --- | −1.354 | 0.028 | --- | --- | --- |
| 1373466_at | calpastatin | Cast | −1.357 | 0.003 | protein catabolism | --- | cysteine protease inhibitor activity/calpain inhibitor activity |
| 1367948_a_at | kinase insert domain protein receptor | Kdr | −1.357 | 0.002 | angiogenesis/transmembran e receptor protein tyrosine kinase signaling pathway/endothelial cell differentiation/vascular endothelial growth factor receptor signaling pathway | extracellular space/integral to plasma membrane | protein serine/threonine kinase activity/protein-tyrosine kinase activity/transmembrane receptor protein tyrosine kinase activity/vascular endothelial growth factor receptor activity/ATP binding/kinase activity/transferase activity/growth factor binding |
| 1386914_at | guanosine monophosphate reductase | Gmpr | −1.362 | 0.042 | nucleotide metabolism/response to cold | --- | catalytic activity/GMP reductase activity/oxidoreductase activity |
| 1390050_at | golgi phosphoprotein 2 | Golph2 | −1.363 | 0.040 | --- | Golgi apparatus/integral to membrane | --- |
| 1369652_at | --- | --- | −1.366 | 0.001 | --- | --- | --- |
| 1390270_at | --- | --- | −1.372 | 0.043 | --- | --- | --- |
| 1383017_at | --- | --- | −1.377 | 0.014 | --- | --- | --- |
| 1387031_at | endoplasmic retuclum protein 29 | Erp29 | −1.379 | 0.004 | protein folding/intracellular protein transport | extracellular space/endoplasmic reticulum lumen/transport vesicle | protein disulfide isomerase activity |
| 1398385_at | similar to RIKEN cDNA 1500006O09 | RGD1305 475 | −1.382 | 0.034 | --- | --- | --- |
| 1367648_at | insulin-like growth factor binding protein 2 | Igfbp2 | −1.383 | 0.016 | regulation of cell growth | extracellular space | insulin-like growth factor binding/growth factor binding |
| 1387908_at | RAS, dexamethasone- induced 1 | Rasd1 | −1.385 | 0.003 | signal transduction/G-protein coupled receptor protein signaling pathway/nitric oxide mediated signal transduction/small GTPase mediated signal transduction | --- | GTPase activity/guanyl-nucleotide exchange factor activity/GTP binding |
| 1371940_at | similar to microfilament and actin filament cross- linker protein isoform a | LOC36258 7 | −1.386 | 0.021 | --- | --- | --- |
| 1390425_at | --- | --- | −1.393 | 0.034 | --- | --- | --- |
| 1371002_at | programmed cell death 2 | Pdcd2 | −1.395 | 0.034 | apoptosis | nucleus/cytoplasm | DNA binding |
| 1375215_x_at | Pyroglutamyl-peptidase I | Pgpep1 | −1.398 | 0.035 | proteolysis and peptidolysis | cytosol | pyroglutamyl-peptidase I activity |
| 1388194_at | dihydrolipoamide S- acetyltransferase (E2 component of pyruvate dehydrogenase complex) | Dlat | −1.408 | 0.000 | acetyl-CoA biosynthesis from pyruvate/glycolysis/ metabolism | mitochondrion/pyruvate dehydrogenase complex | nucleotide binding /dihydrolipoyllysine- residue acetyltransferase activity/protein binding/dihydrolipoamide S- acyltransferase activity |
| 1394340_at | inositol polyphosphate-1- phosphatase (predicted) | Inpp1 | −1.409 | 0.012 | phosphate metabolism/signal transduction/ | --- | magnesium ion binding/inositol-1,4- bisphosphate 1-phosphatase activity/hydrolase activity |
| 1389606_at | Transcribed locus, moderately similar to XP_484812.1 hypothetical protein XP_484812 [Mus musculus] | --- | −1.413 | 0.031 | --- | --- | --- |
| 1398770_at | large subunit ribosomal protein L36a | RGD:6211 56 | −1.421 | 0.027 | protein biosynthesis | intracellular/ribosome | structural constituent of ribosome |
| 1375550_at | Bcl2-associated athanogene 1 | Bag1 | −1.421 | 0.040 | protein folding/anti-apoptosis /cell surface receptor linked signal transduction/neuron differentiation/regulation of apoptosis | nucleus/cytosol | receptor signaling protein activity/unfolded protein binding |
| 1376235_at | Transcribed locus | --- | −1.422 | 0.024 | --- | --- | --- |
| 1388928_at | cofilin 2, muscle | Cfl2 | −1.425 | 0.022 | --- | intracellular | actin binding |
| 1398363_at | similar to D3Mm3e | LOC50022 6 | −1.439 | 0.040 | --- | --- | --- |
| 1387926_at | sterol-C5-desaturase (fungal ERG3, delta-5- desaturase) homolog (S. cerevisae) | Sc5d | −1.440 | 0.024 | --- | --- | --- |
| 1376842_at | Transcribed locus | --- | −1.450 | 0.016 | --- | --- | --- |
| 1374233_at | similar to RIKEN cDNA 1810055E12 | RGD1308 326 | −1.457 | 0.044 | --- | --- | --- |
| 1370283_at | heat shock 70kD protein 5 | Hspa5 | −1.457 | 0.002 | ER-overload response/response to unfolded protein | endoplasmic reticulum lumen | ATP binding/protein binding, bridging/ribosome binding |
| 1377064_at | dual specificity phosphatase 6 | Dusp6 | −1.462 | 0.033 | regulation of cell cycle/inactivation of MAPK activity/protein amino acid dephosphorylation/cell differentiation | cytoplasm | protein phosphatase type 2A activity/protein phosphatase type 1 activity/phosphoprotein phosphatase activity /calcium-dependent protein serine/threonine phosphatase activity /magnesium-dependent protein serine/threonine phosphatase activity/protein tyrosine/serine/threonine phosphatase activity/protein tyrosine/serine/threonine phosphatase activity/CTD phosphatase activity/protein phosphatase type 2C activity/hydrolase activity/MAP kinase phosphatase activity/myosin phosphatase activity/protein phosphatase type 2B activity |
| 1389261_at | --- | --- | −1.483 | 0.050 | --- | --- | --- |
| 1390394_at | Transcribed locus | --- | −1.487 | 0.015 | --- | --- | --- |
| 1375920_at | similar to TNF intracellular domain-interacting protein | RGD1311 487 | −1.489 | 0.038 | --- | --- | --- |
| 1389085_at | Transcribed locus | --- | −1.493 | 0.036 | --- | --- | --- |
| 1377529_at | Transcribed locus | --- | −1.495 | 0.034 | --- | --- | --- |
| 1388453_at | myeloid-associated differentiation marker | Myadm | −1.499 | 0.009 | myeloid cell differentiation | --- | --- |
| 1373909_at | --- | --- | −1.509 | 0.037 | --- | --- | --- |
| 1373836_at | Similar to putative 40-2-3 protein | --- | −1.530 | 0.011 | --- | --- | --- |
| 1371341_at | small nuclear ribonucleoprotein D2 | Snrpd2 | −1.541 | 0.020 | spliceosome assembly/nuclear mRNA splicing, via spliceosome | nucleus/spliceosome complex/small nucleolar ribonucleoprotein complex/ribonucleoprotein complex | --- |
| 1399125_at | inositol polyphosphate-1- phosphatase | Inpp1 | −1.566 | 0.005 | phosphate metabolism/signal transduction | --- | magnesium ion binding/inositol-1,4- bisphosphate 1-phosphatase activity/hydrolase activity |
| 1377085_at | carbonic anhydrase 7 | Car7 | −1.568 | 0.016 | one-carbon compound metabolism | --- | carbonate dehydratase activity/zinc ion binding/lyase activity |
| 1376261_at | BCL2-associated athanogene 5 | Bag5 | −1.587 | 0.002 | protein folding/apoptosis | --- | unfolded protein binding |
| 1371988_at | mannosidase 1, alpha | Man1a | −1.610 | 0.038 | carbohydrate metabolism/N- linked glycosylation | Golgi membrane/membrane fraction/endoplasmic reticulum/Golgi apparatus/integral to membrane | mannosyl-oligosaccharide 1,2-alpha- mannosidase activity /calcium ion binding |
| 1370545_at | potassium voltage-gated channel, shaker-related subfamily, member 1 | Kcna1 | −1.679 | 0.030 | --- | apical plasma membrane | delayed rectifier potassium channel activity |
| 1369007_at | nuclear receptor subfamily 4, group A, member 2 | Nr4a2 | −1.730 | 0.042 | regulation of transcription from RNA polymerase II promoter/signal transduction/neurogenesis/n euron differentiation/regulation of dopamine metabolism | nucleus/cytoplasm | transcription factor activity/steroid hormone receptor activity/ligand- dependent nuclear receptor activity/protein binding |
| 1373164_at | Serine/threonine kinase 17b (apoptosis-inducing) | Stk17b | −1.897 | 0.019 | protein amino acid phosphorylation/induction of apoptosis/protein kinase cascade | nucleus | protein serine/threonine kinase activity/protein-tyrosine kinase activity/protein binding/ATP binding/transferase activity |
| 1371647_at | similar to transmembrane protein TM9SF3 | Tm9sf3 | −2.367 | 0.019 | --- | --- | --- |
Only two transcripts were absent (A) on all normal rat chips (AAA) and present (P) on all dt rat chips (PPP). However, the fold changes for the probe sets 1385088_at and 1391074_at were only −1.01 and −1.03, respectively. Using looser criteria of present (P) or marginal (M) on all dt rat chips and absent (A) on at least two normal rat chips, transcripts for the gamma 5 subunit of voltage-gated calcium channels (Cacng5) was found to be up-regulated in dt rats (Table 2).
Table 2.
QRT-PCR analysis of differentially expressed genes in dt rat cerebellar cortex
| Gene symbol | Accession number | Gene title | Forward/reverse primers | Microarray fold change (P-value) | QRT-PCR fold change |
|---|---|---|---|---|---|
| Up-regulated | |||||
| Bcl2l11 | NM_022612 | BCL-2-like protein 11 | TTACACGAGGAGGGCGTTTG/TCCATACCAGACGGAAGATGAA | +2.04 (0.030) | +1.66 |
| Hspa1a | NM_031971 | heat shock 70kD protein 1A | AGCAGACCGCAGCGACAT/TTGGCGATGATCTCCACCTT | +1.92 (0.004) | +1.62 |
| Plekha3 | XM_215752 | pleckstrin homology domain-containing, family A (phosphoinositide binding specific) member 3 | CTGTTCAGATGATGAAGCGTTCAG/AAGTCGGTGAAGGGCAGATG | +1.71 (0.029) | +1.36 |
| Atp2b4 | XM_341122 | calcium-transporting plasma membrane 4 ATPase (PMCA4) | CATCATCGGAGTCACTGTACTGGTA/GGACCAAGTTGTTGTCCTTCATC | +1.62 (0.021) | +2.50 |
| Cacng5 | NM_080693 | voltage-gated calcium channel, gamma subunit 5 | CGGACCATACTGGCTTTTGTCT/ATCTCGTCATTGATGCTGGAGAT | +1.60 (0.025) | +1.50 |
| Crhr1 | NM_030999 | corticotropin-releasing hormone receptor 1 (CRH-R1) | GGTGTACCTTTCCCCATCATTG/TAGTCAGTGTATACCCCAGGACGTT | +1.56 (0.007) | +2.85 |
| Fst | NM_012561 | follistatin | CGGCGTACTGCTTGAAGTGA/TAGGGAAGCTGTAGTCCTGGTCTT | +1.55 (0.015) | +1.51 |
| Col1a1 | XM_340760 | α-1 collagen | AGAAGCAGGGACGGATAATTCA/AGAAGGCGGCTCCCAGAT | +1.40 (0.040) | +1.31 |
|
| |||||
| Down-regulated | |||||
| Tm9sf3 | XM_220013 | transmembrane 9 superfamily protein member 3 | TCAGCCCAACTTCCCTTGTC/TAAAATTCCTCCCAGGCAAACA | −2.37 (0.019) | −1.50 |
| Stk17b | NM_133392 | serine/threonine kinase 17b | GGTCTTGTCCCCACGTGATTAA/CCATTTCAGCCAACTCAGGTAAA | −1.90 (0.019) | −2.08 |
| Nr4a2 | NM_019328 | nuclear receptor subfamily 4, group A, member 2 | CGCCGAAATCGTTGTCAGTA/CGACCTCTCCGGCCTTTTA | −1.73 (0.042) | +1.64 |
| Kcna1 | NM_173095 | potassium voltage-gated channel, shaker-related subfamily, member 1 | GAGGAGTTTCCAAATTGGGTAAAA/GGTGTAAAGGAGCGAGGGAGTA | −1.68 (0.030) | +1.19 |
| Man1a1 | XM_228364 | mannosidase, alpha, class 1A, member 1 | AGTGCTGAACAAGCTGGACAAA/AAGCTGTCTCCAAGTCCTCCAA | −1.61 (0.038) | +1.02 |
| Bag5 | XM_345726 | BCL-2-associated athanogene 5 | CACCCTGCTGGTTCCAAAGA/CGTTGGATCTCCTGAAGCCTACT | −1.59 (0.002) | −1.29 |
| Inpp1 | XM_237116 | inositol polyphosphate-1-phosphatase | TGGAGTCACTGGAGATCAGCAT/GATTTAACATTGGCAGAACCTTTGA | −1.57 (0.005) | −1.37 |
| LOC360726 (Fyttd1) | XM_340998 | similar to 40-2-3 protein | AAAGGAGTCCCTCTACAGTTTGACA/TCAGTATTCCAAATCGTTCATTCAAC | −1.53 (0.014) | −1.12 |
Of those transcripts present (P) or marginal (M) on all chips, 342 were differentially expressed (t-test P < 0.05). Using more stringent criteria of present (P) on all chips, 325 genes showed significant differential expression. In dt rats, 51 genes were up-regulated and 92 genes were down-regulated by ≥ 25% (Table 1). Subsets of 10 and 11 transcripts showed more robust (≥ 50%) up- and down-regulation, respectively.
The attributes of differentially expressed genes were explored with Gene Ontology biological process, cellular component, and molecular function (www.geneontology.org). A gene product can have several molecular functions, can be used in one or more biological processes and may be associated with one or more cellular components. As detailed in Table 1, many of the genes up-regulated in dt rat cerebellar cortex encode integral plasma membrane and extracellular proteins: Slc7a12, Atp2b4, Fst, Crhr1, Nppc, Cltb, Bche, Sdc3, Accn2, Col27a1, Celsr2, Mep1a, Fnbp4, and Bace. The two genes showing the greatest up-regulation on microarray, Be/2111 and Hspa1a, encode proteins that may be involved in apoptosis and unfolded protein binding, respectively. Both of these proteins bind nucleotides. Interestingly, two genes (Plekha3 and Inppl1) associated with inositol phosphate metabolism/signaling were up-regulated in the dt rat. Plekha3 encodes a phosphatidylinositol binding protein that contains a pleckstrin-homology (PH) domain whereas Inpp1 encodes a protein with inositol-polyphosphate 5-phosphatase activity. Besides PMCA4, transcripts for several other proteins with molecular functions that include calcium binding were up-regulated in the dt rat: clathrin light polypeptide (Cltb), cadherin EGF LAG seven-pass G-type receptor 2 (Celsr2), and phospholipid scramblase 3 (Plscr3).
In contrast to the up-regulated genes, down-regulated genes were found to encode proteins localized to a variety of cellular components and involved in a more diverse range of molecular functions (Table 1). Three genes involved in the apoptotic process (Stk17b, Bag5, and Bag1) were down-regulated in the dt rat. Bag5 and Bag 1 encode proteins that are apparently anti-apoptotic and function in unfolded protein binding. In distinction to Plekha3 and Inpp1, three other genes that participate in inositol phosphate metabolism/signaling, Freq (frequenin homolog), Inpp5a (inositol polyphosphate-5-phosphatase A), and Inpp1 (inositol polyphosphate-1-phosphatase) were down-regulated in the dt rat. Down-regulation of Inpp1 was similar with two probe sets: 1394340_at (−1.409) and 1399125_at (−1.566).
QRT-PCR of differentially expressed genes
QRT-PCR was used to substantiate microarray results for selected genes showing significant fold changes. In general, QRT-PCR and microarray were highly concordant for up-regulated genes (Table 2). Of all genes, those encoding CRH-R1 (Crhr1) and PMCA4 (Atp2b4) exhibited the greatest positive fold-change in dt rats. For three genes showing significant down-regulation on the microarrays, QRT-PCR findings were in the opposite direction (Table 2). In aggregate, the microarray and QRT-PCR results point out the relative importance of genes related to extracellular matrix interactions during the maturation of cerebellar cortex, phosphatidylinositol metabolism/signaling pathways, and calcium homeostasis in both the molecular pathophysiology of the dt rat movement disorder and caytaxin deficiency.
Immunocytochemical examination of cerebellar cortex
To provide spatial resolution and translational correlates to the microarray and QRT-PCR data, the cellular distribution of two proteins, CRH-R1 and PMCA4, was examined immunocytochemically. In normal and dt rat pups (P18), CRH-R1-IR was present in the granular, Purkinje cell, and molecular layers of cerebellar cortex (Fig. 1). CRH-R1-IR was prominent in the cytoplasm of Purkinje cells (Fig. 3A-F). In the molecular layer, focal concentrations of CRH-R1-IR, presumably within interneurons, was superimposed on milder more-diffuse staining of presumptive dendritic elements. The overall intensity of CRH-R1-IR was greater in dt rats than in normal littermates. In particular, CRH-R1-IR was robust in the soma and proximal dendritic trees of Purkinje cells in the mutants. In comparison with normal littermates, CRH-R1-IR was more intense in the granular layer of dt rat cerebellar cortex.
Fig. 1.
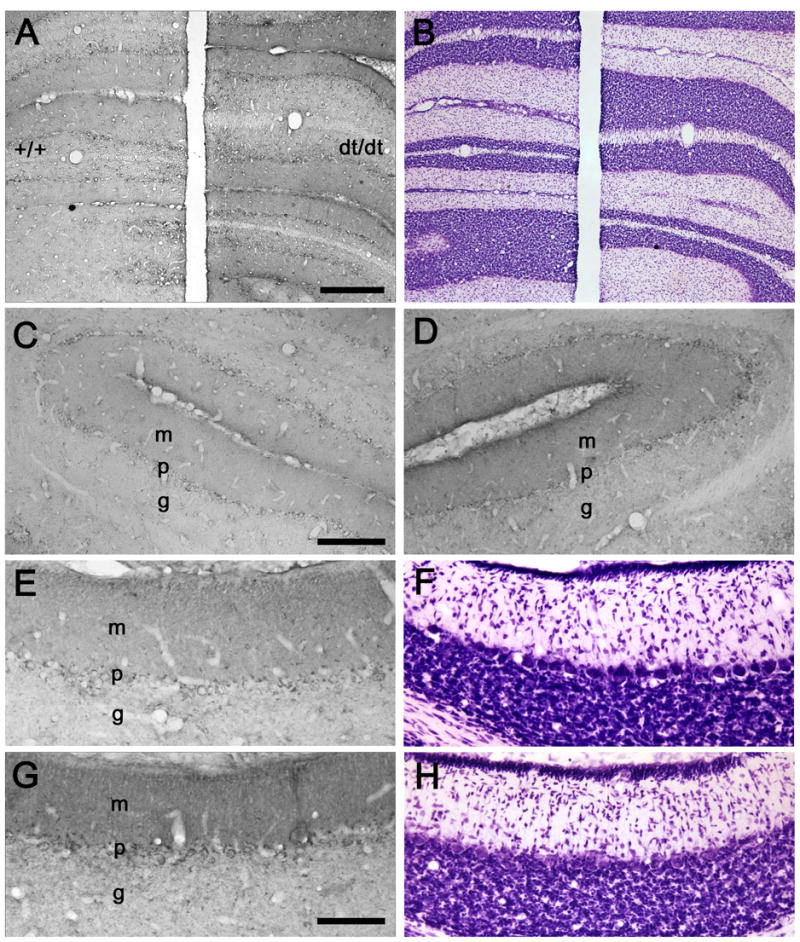
(A) A coronal section through the P18 hemi-cerebellae of wild-type (+/+) and dt rats (dt/dt) demonstrates CRH-R1-IR. (B) A section adjacent to A was stained with cresyl violet. Coronal sections through the simple lobules (C, D) and paraflocculi (E, G) of wild-type (C, E) and dt (D, G) rats exhibit CRH-R1-IR. Sections (F, H) adjacent to E and G were stained with cresyl violet. Abbreviations: m, molecular layer; p, Purkinje cell layer; g, granular cell layer. Scale bars: 400 μm (A, B), 200 μm (C, D), and 100 μm (E–H).
Fig. 3.
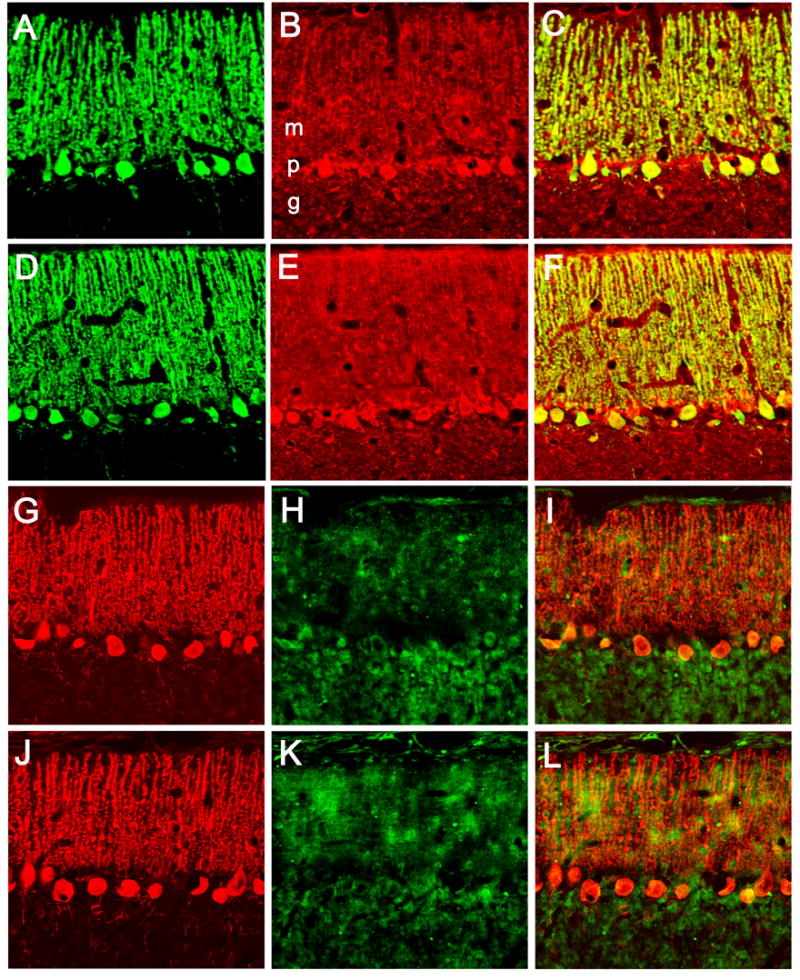
Confocal images of the cerebellar molecular layer from normal (A–C, G–l) and dt (D–F, J–L) rats show double-label fluorescence immunocytochemistry for calbindin D-28K (A, D, G, J), CRH-R1 (B, E), and PMCA4 (H, K). Merged images are shown in panels C, F, I, and L. Abbreviations: m, molecular layer; p, Purkinje cell layer; g, granular cell layer. Scale bar: 50 μm.
In normal rat pups, PMCA4-IR was concentrated in the inner two-thirds of the molecular layer with weaker staining of the granular cell layer (Fig. 2). In comparison to normal rat pups, much more prominent PMCA4-IR was seen in the molecular layer of cerebellar cortex from dt rat pups. In addition, PMCA4-IR extended to the outer third of the molecular layer in dt rat pups. Staining for PMCA4 in the granular layer was also more robust in the mutants.
Fig. 2.
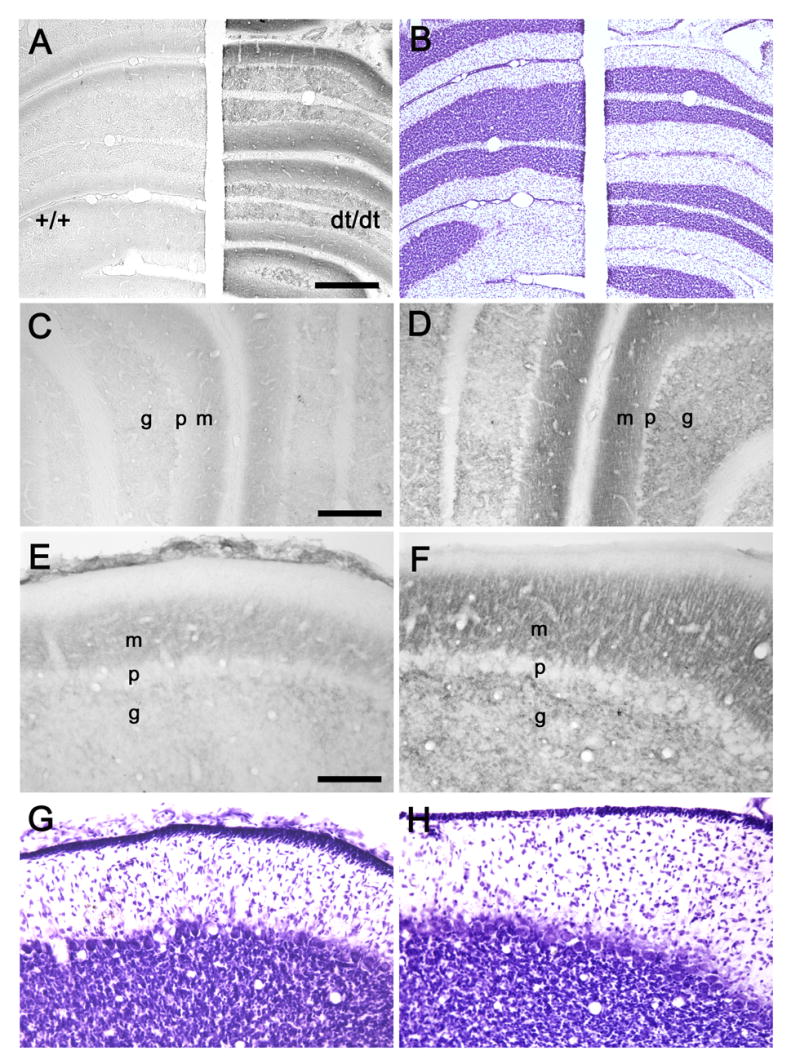
(A) A coronal section through the P18 hemi-cerebellae of wild-type (+/+) and dt rats (dt/dt) demonstrates PMCA4-IR. (B) A section adjacent to A was stained with cresyl violet. Coronal sections through the simple lobules (C, D) and paraflocculi (E, F) of wild-type (C, E) and dt (D, F) rats exhibit PMCA4-IR. Sections (G, H) adjacent to E and F were stained with cresyl violet. Abbreviations: m, molecular layer; p, Purkinje cell layer; g, granular cell layer. Scale bars: 400 μm (A, B), 200 μm (C, D), and 100 μm (E–H).
Double-label immunocytochemistry with confocal microscopy was used to examine the cellular and subcellular distribution of CRH-R1 and PMCA4 (Figs. 3, 4). Although most prominent in the soma and proximal dendrites, CRH-R1-IR was clearly present in the more apical portions of Purkinje cells. CRH-R1-IR was also apparent in granule cells. The subcellular distribution of CRH-R1-IR did not differ between dt and normal rats (Fig. 4). In the molecular layer, PMCA4-IR tended to exhibit a patch-like distribution which was clearly more intense in the mutants (Fig. 3G-L). High-power confocal images of the molecular layer showed that calbindin D-28K-IR co-localized with CRH-R1-IR but not PMCA4-IR (Fig. 4). In both normal and dt rats, PMCA4-IR within the molecular layer had a fine granular appearance suggestive of a synaptic localization (Fig. 4E).
Fig. 4.
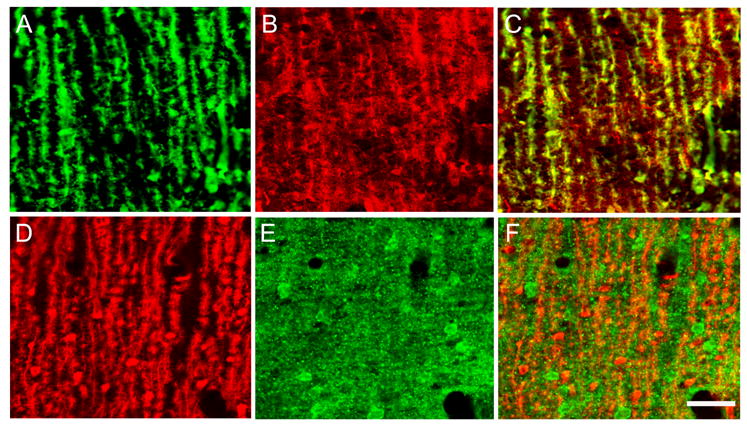
High-magnification confocal images of the dt rat cerebellar molecular layer show double-label fluorescence immunocytochemistry for calbindin D-28K (A, D), CRH-R1 (B), and PMCA4 (E). Merged images of calbindin D-28K with CRH-R1 and PMCA4 are shown in C and F, respectively. Co-localization of calbindin D-28K and CRH-R1 appears yellow in the merged image (C). Scale bar: 20 μm.
At P18, CRH-IR was readily apparent in the IO and cerebellar cortex in both normal and dt rats, although the intensity of staining was mildly more prominent in the mutants, especially in the IO (Fig. 5). In normal and dt rats, the majority of IO neurons exhibited cytoplasmic CRH-IR above background levels of staining (Fig. 5A, C). CRH-IR was significantly more intense in the medial accessory IO (MAO) and dorsal accessory IO (DAO) than the principal IO. The topology of IO CRH-IR did not differ between normal and dt rats. In cerebellar cortex, CRH-IR climbing fibers were, overall, more numerous and intensely stained in the mutants (Fig. 5E-H). CRH-IR climbing fibers were detected in the vermis, cerebellar hemispheres, flocculus, and paraflocculus. The overall cerebellar distribution of CRH-IR climbing fibers was similar between dt rats and their normal littermates.
Fig. 5.
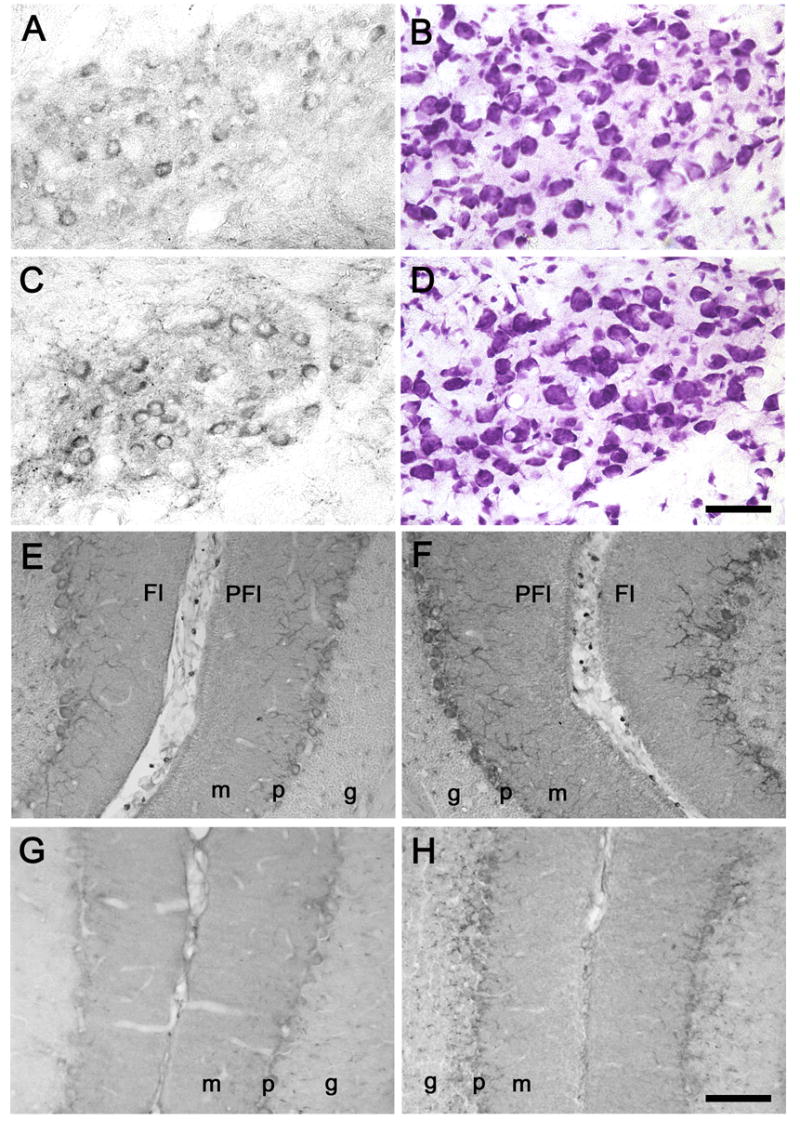
CRH-IR in the MAO (A, C), flocculi [Fl]/paraflocculi [PFI] (E, F), and simple lobules (G, H) of normal (A, E, G) and dt (C, F, H) rats. Sections (B, D) adjacent to A and C were stained with cresyl violet. Abbreviations: m, molecular layer; p, Purkinje cell layer; g, granular cell layer. Scale bars: 50 μm(A–D) and 100 μm (E–H).
DISCUSSION
The experiments presented herein show that caytaxin deficiency has important effects on cellular and molecular networks involved in the development and physiology of cerebellar cortex. Previous studies have shown that olivocerebellar neurophysiology, including simple and complex spike firing patterns, is functionally abnormal in the dt rat (LeDoux et al., 1998; LeDoux and Lorden, 2002). The present study provides cellular and molecular correlates to prior neurophysiological work. Specifically, we found dysregulation of networks involved in cell-surface and phosphatidylinositol signaling, calcium homeostasis, and extracellular matrix interactions. In particular, significant up-regulation of CRH-R1 and PMCA4 was detected in Purkinje cells and parallel fibers, respectively. Our findings highlight the roles of development, climbing fiber signaling pathways, and calcium homeostasis in the molecular pathophysiology of dystonia.
The dt rat cerebellar gene expression profile that we have characterized with microarray and QRT-PCR should, for the most part, be viewed as the downstream molecular consequence of caytaxin deficiency. It is unlikely that malnutrition, developmental delay, or involuntary motor activity exerted major effects on the dt rat transcriptome at P18. Although the motor syndrome of the dt rat is overtly apparent at P18, the dystonia exhibited by the mutants is reduced at rest and disappears during sleep. At P18, dt rats have normal body weights, are able to nurse, and exhibit no overt signs of malnourishment (Lorden et al., 1984; LeDoux, 2004b). Furthermore, P18 dt rat pups exhibit normal homing behavior and can climb, right, and hang (LeDoux et al., 1993; LeDoux, 2004b).
CRH-R1 and PMCA4 are up-regulated in dt rat cerebellar cortex
CRH is but one of at least four transmitters (glutamate, aspartate, CRH, and calcitonin gene related peptide) released at climbing fiber synapses (Palkovits et al., 1987; Bishop, 1990; Yuzaki et al., 1996; Beitz and Saxon, 2004). Long-term depression (LTD) at the climbing fiber-Purkinje cell synapse is most likely expressed post-synaptically (Shen et al., 2002) and LTD at the parallel fiber-Purkinje cell synapse may require CRH released by climbing fibers (Miyata et al., 1999). Furthermore, climbing fiber LTD requires post-synaptic calcium elevation, activation of group 1 metabotropic glutamate receptors, and protein kinase C (Hansel and Linden, 2000). Clearly, up-regulation of Crhr1 transcript and protein in dt rat cerebellum points to a defect in the climbing fiber-Purkinje cell synapse or post-synaptic signaling pathways in Purkinje cells (Dautzenberg et al., 2004).
Of all transcripts examined with RT-PCR, those for CRH-R1 and PMCA4 showed the greatest up-regulation (QRT-PCR) in dt rat cerebellar cortex. CRH-R1 belongs to the secretin family of G-protein coupled receptors that utilize adenylate cyclase and production of cAMP for signal transduction (Hillhouse and Grammatopoulos, 2006). The distribution of CRH-R1-IR in mouse cerebellar cortex is similar to our findings in P18 rats (Bishop et al., 2000; Chen et al., 2000; King and Bishop, 2002). The concentration of CRH-R1-IR in the somas and proximal dendrites of Purkinje cells in normal rats and mice is consistent with the known anatomical relationships between climbing fibers and Purkinje cells. In previous work using the anterograde/retrograde tracer horseradish peroxidase, Stratton (1991) showed that the climbing fiber projection to cerebellar cortex is neuroanatomically intact in dt rats. Correspondingly, the spatial distribution of CRH-R1-IR and CRH-IR was also normal in dt rats.
The increased IO and climbing fiber CRH-IR that was found in the dt rat has also been described in two other rodent lines with motoric disability ascribed to cerebellar dysfunction (Sawada et al., 2001; Jeong et al., 2005). The mutations in rolling mouse Nagoya (RMN) and the ataxic mouse pogo are allelic with those in tottering and leaner mice, which harbor defects in the α-1 subunit of P/Q-type calcium channels (Cacna1a) (Sawada et al., 2001; Jeong et al., 2005). Similar to the dt rat, the gait disorders of RMN and pogo become apparent by P10 to P14 (Jeong and Hyun, 2000; Sawada et al., 2001). Since the α-1 subunit is expressed at high levels in the presynaptic active zone of parallel fibers and on the dendritic spines of Purkinje cells but only sparsely by climbing fibers (Kulik et al., 2004), increased expression of CRH and CRH-R1 in climbing fibers and Purkinje cells, respectively, may represent a compensatory response to a post-synaptic defect of Purkinje cells. In this regard, CRH can positively regulate Crhr1 transcription (Hillhouse and Grammatopoulos, 2006). Interestingly, Swinny and colleagues (2004) showed that constant exposure of Purkinje cells to CRH inhibits dendritic outgrowth whereas intermittent exposure induces dendritic outgrowth and elongation.
The plasma membrance calcium-dependent ATPases (PMCAs) are an essential component of the complex calcium regulatory system in neurons and their processes. PMCAs hydrolyze ATP in the process of translocating calcium from the cytosol to the extracellular space. Using immunohistochemistry, Burette et al. (2003) localized four PMCA isoforms (PMCA1-4) in rat brain. PMCA4 showed a more restricted distribution than the other PMCAs. Prominent PMCA4 staining was noted in cerebral cortex, particularly the pyramidal neurons in layers II and VI, and the molecular layer of cerebellar cortex. PMCA4 staining was also seen the granular layer, mainly its outer part. In the present study, PMCA4-IR in cerebellar cortex was very similar to that described by Burette et al. (2003). Using confocal microscopy, we extended previous work by showing that PMCA4 does not co-localize with Purkinje cell dendrites in the molecular layer. Instead, its presence in the granular cell layer and intense, diffuse expression in the molecular layer strongly suggests that PMCA4 is produced by granule cells and present in parallel fibers. In comparison with normal littermates, PMCA4-IR was more intense in the granular cell and molecular layers of cerebellar cortex in dt rats.
Consistent with our immunocytochemical findings, Sepulveda et al. (2006) have localized PMCA4 to lipid raft domains of synaptic nerve terminals in the molecular layer of cerebellar cortex. Accordingly, up-regulation of PMCA4 in the dt rat may be a marker of increased synaptic activity at parallel fiber synapses on Purkinje cells. This hypothesis is supported by previous single-unit recordings from awake dt rats and their normal littermates in which Purkinje cell simple-spike firing rates tended to be higher in the mutants (LeDoux and Lorden, 2002).
Caytaxin participates in phosphatidylinositol signaling pathways
Caytaxin contains a Sec14p domain. Sec14p functions as a phosphatidylinositol transfer protein in yeast. Moreover, the binding cavity of caytaxin is suited for an amphipathic ligand like a phosphatidylinositol (Bomar et al., 2003; Panagabko et al., 2003; Xiao and LeDoux, 2005). Compatible with this hypothesis, genes encoding the phosphatidylinositol 4-phosphate adaptor protein 1 (Plekha3), phospholipid scramblase 3 (PLSCR3; Plscr3), and inositol polyphosphate phosphatase-like 1 or SH2-containing inositol phosphatase 2 (Inppl1) were up-regulated in dt rat cerebellar cortex. Dowler and colleagues (2000) established that phosphatidylinositol 4-phosphate adaptor protein 1 interacts strongly with phosphatidylinositol 4-phosphate but not with other phosphatidylinositols. Inositol polyphosphate phosphatase-like 1 appears to function as a 5′-phosphatase capable of hydrolyzing phosphatidylinositol 3,4,5-triphosphate to phosphatidylinositol 3,4-biphosphate (Habib et al., 1998). Although the precise cellular role of PLSCR3 is poorly understood (Wiedmer et al., 2004), PLSCR1 is a multiply palmitoylated, endofacial membrane protein with the dual functions of (1) promoting accelerated transbilayer phospholipid movement in response to calcium and (2) directly binding to the 5′-promoter region of the inositol 1,4,5-triphosphate receptor type 1 gene (IP3R1) to enhance expression of the receptor (Zhou et al., 2005).
Genes encoding inositol polyphosphate 1-phosphatase (INPP1; Inpp1), inositol polyphosphate-5-phosphastase A (INPP5A; Inpp5a), and frequenin (Freq) were down-regulated in the dt rat. INPP1 removes the 1 position phosphate from inositol 1,3,4-triphosphate and inositol 1,4-diphosphate, thereby producing inositol 3,4 diphosphate and inositol 4-phosphate, respectively (Inhorn and Majerus, 1988). INPP5A is a membrane-associated 5-phosphatase that hydrolyzes inositol 1,4,5-triphosphate in a signal terminating reaction (Laxminarayan et al., 1994). Finally, frequenin is an N-myristoylated calcium-binding protein that appears to bind and stimulate certain mammalian isoforms of phosphatidylinositol 4-kinase (Strahl et al., 2003). In aggregate, although these gene expression changes do not point to a specific ligand, they do suggest that caytaxin may function as a phosphatidylinositol transfer protein. Alternatively, the caytaxin ligand belongs to an entirely different class of molecules and the changes in phosphatidylinositol-related transcripts outlined above are simply compensatory or secondary effects of abnormalities in another signaling pathway.
Caytaxin contributes to the maturation of cerebellar cortex
In contrast to the more common neurodegenerative ataxias due to trinucleotide repeats, defects in the maturation of cerebellar cortex may contribute to rare movement disorders such as Cayman ataxia (Bomar et al., 2003) and spinocerebellar ataxia type 13 (SCA13; Waters et al., 2006). The intimate temporal association between the onset and progression of the dt rat movement disorder and the maturation of climbing fibers and Purkinje cells indicates that, in addition to or by virtue of its putative role in phosphatidylinositol signaling, caytaxin most likely contributes to the development of cerebellar cortex.
Many of the gene expression abnormalities identified in dt rat cerebellar cortex are known to play roles in programmed cell death, extracellular matrix interactions, cell adhesion, and other processes essential for normal neurodevelopment (Tables 1 and 2). Moreover, a number of cell surface-signaling cascades implicated in the microarray studies also participate in synaptogenesis and dendritogenesis. For instance, activation of cAMP-dependent pathways, through elevation of intracellular cAMP levels, is known to promote survival of a large variety of central and peripheral neuronal populations (Jassen et al., 2006). Our differential gene expression experiments must be interpreted within the context of cerebellar cortical maturation. Importantly, numerous climbing fiber terminals are found on developing Purkinje cell dendrites by P12. Over the next several days, there is pruning of perisomatic climbing fiber terminals, maturation of Purkinje cell dendritic arbors, and vine-like extension of climbing fibers along more distal dendrites. By P21, climbing fiber terminals in the molecular layer of cerebellar cortex are structurally mature. Thus, the temporal window from P12 to P21 is a period of marked developmental activity in rat cerebellar cortex.
Focused analysis of a few genes highlights the complex effects of caytaxin deficiency on neurodevelopmental processes. For instance, BCL-2-associated athanogene 5 (BAGS) has been shown to directly interact with heat shock protein 70kD (Hsp70) and inhibit Hsp70-mediated refolding of misfolded proteins (Kalia et al., 2004). Interestingly, Hsp70 also interacts with the carboxyl terminus of Hsp70-interacting protein (CHIP) which, in turn, has been shown to polyubiquitinate caytaxin in vitro (Grelle et al., 2006). Other examples relate more explicitly to the development of cerebellar cortex. Syndecan-3, via an interaction with neurocan, promotes neurite outgrowth by cerebellar granule cells (Akita et al., 2004). Using an RNAi knock-down approach, Shima et al. (2004) have shown that the 7-pass transmembrane cadherin receptor, Celsr2, plays an important role in Purkinje cell dendritic growth and maintenance. Therefore, in large part, a variety of neurodevelopmental networks appear to compensate for caytaxin deficiency and help to preserve the gross and microscopic structure of dt rat cerebellar cortex.
Calcium homeostasis, signaling, and rodent models of dystonia
A number of spontaneous mutations in mice that disturb genes encoding proteins expressed at high levels in Purkinje cells, particularly those involved in calcium signaling and homeostasis, are associated with a phenotype that includes dystonia (Hess and Jinnah, 2004; LeDoux, 2004a; Jinnah et al., 2005). The tottering mouse, for example, exhibits paroxysmal dystonia that is precipitated by stress (Fureman et al., 2002). It is well-known that the P/Q-type calcium channel plays a critical role in the response of Purkinje cells to afferent inputs (Cavelier et al., 2002). Presumably, mutations of cerebellar P/Q-type calcium channels impair the ability of Purkinje cells to properly integrate parallel and climbing fiber inputs (Jun et al., 1999). Of note, Cacna1a-null mutants exhibit much more severe dystonia than tottering mice (Jun et al., 1999).
Other important mouse models of dystonia include the wriggle mouse sagami (wri) and the opisthotonus mouse. The wri central nervous system is normal except for impaired development of Purkinje cell dendritic arbors (Inoue et al., 1993). The plasma membrane calcium-ATPase type 2 (PMCA2) is mutated in the wri mouse (Takahashi and Kitamura, 1999). Unlike PMCA4, PMCA2 is expressed at high levels in the dendrites and spines of Purkinje cells (Burette et al., 2003). Like PMCA4, PMCA2 may play an active role in the modulation of calcium spikes, local calcium signaling, and maintenance of basal intracellular calcium levels (Burette et al., 2003; Pottorf and Thayer, 2002). In the wri mouse, dystonia first appears at P10 to P24 and progresses in severity until 12 weeks of age. Opisthotonus mice have a mutation in the gene (Itpr 1) that encodes inositol 1,4,5-triphosphate receptor 1 (IP3R1) (Street et al., 1997). IP3R1 is abundantly expressed in cerebellar Purkinje cells and, upon binding of inositol 1,4,5-triphosphate (IP3), releases stored calcium into the cytosol. Beginning at P14, opisthotonus mice exhibit ataxia and paroxysmal opisthotonos (i.e., truncal dystonia).
Congruent with other rodent models of dystonia, several genes associated with calcium homeostasis and inositol phosphate metabolic and signaling pathways were differentially expressed in dt rat cerebellar cortex (Tables 1 and 2). Besides Atp2b4 (PMCA4), genes encoding other well-annotated proteins like the gamma-5 subunit of voltage-gated calcium channels (Cacng5) were up-regulated in the dt rat. In general, gamma subunits increase inactivation of voltage-gated calcium channels (Letts et al., 1998; Kang and Campbell, 2003). Interestingly, stargazer mice harbor mutations in the gamma-2 subunit (Cacng2) and exhibit ataxia, unusual head movements and paroxysmal dystonia (i.e., retrocollis).
CONCLUSIONS
Our results, when interpreted in the context of previous neurophysiological, pharmacological, and biochemical studies in the dt rat, indicate that caytaxin plays a major role in the development and physiology of cerebellar cortex. The complex clinical presentation of Cayman ataxia and widespread distribution of Atcay transcripts in rat brain suggests that caytaxin also has important function(s) in other regions of the central and peripheral nervous systems (Bomar et al., 2003; Xiao and LeDoux, 2005). The microarray results presented herein direct attention to phosphatidylinositol signaling pathways and are compatible with a predicted transfer protein function for caytaxin based on structural modeling (Bomar et al., 2003). Future efforts will focus on identification of caytaxin ligands.
From a broader perspective, our results provide considerable insight into the molecular biology of motor control, extracellular matrix interactions during maturation of cerebellar cortex, and cell-type specificity of gene expression in olivocerebellar pathways. The microarray experiments identified genes and signaling pathways that may be central to many of the dystonias. In particular, defects in Purkinje cell calcium homeostasis appear to be a theme common to most rodent models of dystonia and may also be important in sporadic human dystonia (LeDoux, 2004a; Jinnah et al., 2005). The increased expression of CRH in dt rat climbing fibers and PMCA4 in dt rat parallel fibers underscores the highly specific compensatory changes that can occur in olivocerebellar pathways in response to a single defective gene. Furthermore, transcripts and proteins found to be differentially expressed in dt rat cerebellar cortex may provide viable therapeutic targets for the treatment of dystonia and/or ataxia.
Supplementary Material
Unfiltered Affymetrix GeneChip® Data. A tab-delimited text file for each GeneChip® expression array is included in this folder. These files can be imported into Excel and a variety of additional software packages specifically designed for analysis of microarray data.
Acknowledgments
This research effort was supported by the National Institutes of Health (R01 NS048458) and the Center for Genomics and Bioinformatics at the UTHSC.
Footnotes
Publisher's Disclaimer: This is a PDF file of an unedited manuscript that has been accepted for publication. As a service to our customers we are providing this early version of the manuscript. The manuscript will undergo copyediting, typesetting, and review of the resulting proof before it is published in its final citable form. Please note that during the production process errors may be discovered which could affect the content, and all legal disclaimers that apply to the journal pertain.
References
- Akita K, Toda M, Hosoki Y, Inoue M, Fushiki S, Oohira A, Okayama M, Yamashina I, Nakada H. Heparan sulphate proteoglycans interact with neurocan and promote neurite outgrowth from cerebellar granule cells. Biochem J. 2004;383:129–138. doi: 10.1042/BJ20040585. [DOI] [PMC free article] [PubMed] [Google Scholar]
- Beitz AJ, Saxon D. Harmaline-induced climbing fiber activation causes amino acid and peptide release in the rodent cerebellar cortex and a unique temporal pattern of Fos expression in the olivo-cerebellar pathway. J Neurocytol. 2004;33:49–74. doi: 10.1023/B:NEUR.0000029648.81071.20. [DOI] [PubMed] [Google Scholar]
- Berardelli A, Rothwell JC, Hallett M, Thompson PD, Manfredi M, Marsden CD. The pathophysiology of primary dystonia. Brain. 1998;121:1195–1212. doi: 10.1093/brain/121.7.1195. [DOI] [PubMed] [Google Scholar]
- Bishop GA. Neuromodulatory effects of corticotropin releasing factor on cerebellar Purkinje cells: an in vivo study in the cat. Neuroscience. 1990;39:251–257. doi: 10.1016/0306-4522(90)90238-y. [DOI] [PubMed] [Google Scholar]
- Bishop GA, Seelandt CM, King JS. Cellular localization of corticotropin releasing factor receptors in the adult mouse cerebellum. Neuroscience. 2000;101:1083–1092. doi: 10.1016/s0306-4522(00)00413-9. [DOI] [PubMed] [Google Scholar]
- Bomar JM, Benke PJ, Slattery EL, Puttagunta R, Taylor LP, Seong E, Nystuen A, Chen W, Albin RL, Patel PD, Kittles RA, Sheffield VC, Burmeister M. Mutations in a novel gene encoding a CRAL-TRIO domain cause human Cayman ataxia and ataxia/dystonia in the jittery mouse. Nat Genet. 2003;35:264–269. doi: 10.1038/ng1255. [DOI] [PubMed] [Google Scholar]
- Burette A, Rockwood JM, Strehler EE, Weinberg RJ. Isoform-specific distribution of the plasma membrane Ca2+ ATPase in the rat brain. J Comp Neurol. 2003;467:464–476. doi: 10.1002/cne.10933. [DOI] [PubMed] [Google Scholar]
- Cavelier P, Beekenkamp H, Shin HS, Jun K, Bossu JL. Cerebellar slice cultures from mice lacking the P/Q calcium channel: electroresponsiveness of Purkinje cells. Neurosci Lett. 2002;333:64–68. doi: 10.1016/s0304-3940(02)00962-x. [DOI] [PubMed] [Google Scholar]
- Chen Y, Brunson KL, Muller MB, Cariaga W, Baram TZ. Immunocytochemical distribution of corticotropin-releasing hormone receptor type-1 (CRF(1))-like immunoreactivity in the mouse brain: light microscopy analysis using an antibody directed against the C-terminus. J Comp Neurol. 2000;420:305–323. doi: 10.1002/(sici)1096-9861(20000508)420:3<305::aid-cne3>3.0.co;2-8. [DOI] [PMC free article] [PubMed] [Google Scholar]
- Dautzenberg FM, Gutknecht E, Van der Linden I, Olivares-Reyes JA, Durrenberger F, Hauger RL. Cell-type specific calcium signaling by corticotropin-releasing factor type 1 (CRF1) and 2a (CRF2(a)) receptors: phospholipase C-mediated responses in human embryonic kidney 293 but not SK-N-MC neuroblastoma cells. Biochem Pharmacol. 2004;68:1833–1844. doi: 10.1016/j.bcp.2004.07.013. [DOI] [PubMed] [Google Scholar]
- Dowler S, Currie RA, Campbell DG, Deak M, Kular G, Downes CP, Alessi DR. Identification of pleckstrin-homology-domain-containing proteins with novel phosphoinositide-binding specificities. Biochem J. 2000;351:19–31. doi: 10.1042/0264-6021:3510019. [DOI] [PMC free article] [PubMed] [Google Scholar]
- Fahn S, Marsden CD, Calne DB. Classification and investigation of dystonia. In: Marsden CD, Fahn S, editors. Movement Disorders 2. London: Butterworths; 1987. pp. 332–358. [Google Scholar]
- Fureman BE, Jinnah HA, Hess EJ. Triggers of paroxysmal dyskinesia in the calcium channel mouse mutant tottering. Pharmacol Biochem Behav. 2002;73:631–637. doi: 10.1016/s0091-3057(02)00854-7. [DOI] [PubMed] [Google Scholar]
- Gilbert N, Bomar JM, Burneister M, Moran JV. characterization of a mutagenic B1 retrotransposon insertion in the jittery mouse. Hum Mutat. 2004;24:9–13. doi: 10.1002/humu.20060. [DOI] [PubMed] [Google Scholar]
- Grelle G, Kostka S, Otto A, Kersten B, Genser KF, Muller EC, Walter S, Boddrich A, Stelzl U, Hanig C, Volkmer-Engert R, Landgraf C, Albert! S, Hohfeld J, Strodicke M, Wanker EE. Identification of VCP/p97, carboxyl terminus of Hsp70-interacting protein (CHIP), and amphiphysin II interaction partners using membrane-based human proteome arrays. Mol Cell Proteomics. 2006;5:234–244. doi: 10.1074/mcp.M500198-MCP200. [DOI] [PubMed] [Google Scholar]
- Habib T, Hejna JA, Moses RE, Decker SJ. Growth factors and insulin stimulate tyrosine phosphorylation of the 51C/SHIP2 protein. J Biol Chem. 1998;273:18605–18609. doi: 10.1074/jbc.273.29.18605. [DOI] [PubMed] [Google Scholar]
- Hallett M. Physiology of basal ganglia disorders: an overview. Can J Neurol Sci. 1993;20:177–183. doi: 10.1017/s0317167100047909. [DOI] [PubMed] [Google Scholar]
- Hansel C, Linden DJ. Long-term depression of the cerebellar climbing fiber-Purkinje neuron synapse. Neuron. 2000;26:473–482. doi: 10.1016/s0896-6273(00)81179-4. [DOI] [PubMed] [Google Scholar]
- Hess EJ, Jinnah HA. Mouse models of dystonia. In: LeDoux MS, editor. Animal models of movement disorders. San Diego: Elsevier; 2004. pp. 265–277. [Google Scholar]
- Hillhouse EW, Grammatopoulos DK. The molecular mechanisms underlying the regulation of the biological activity of corticotropin-releasing hormone receptors: implications for physiology and pathophysiology. Endocr Rev. 2006;27:260–286. doi: 10.1210/er.2005-0034. [DOI] [PubMed] [Google Scholar]
- Inhorn RC, Majerus PW. Properties of inositol polyphosphate 1-phosphatase. J Biol Chem. 1988;263:14559–14565. [PubMed] [Google Scholar]
- Inoue Y, Matsumura Y, Inoue K, Ichikawa R, Takayama C. Abnormal synaptic architecture in the cerebellar cortex of a new dystonic mutant mouse, Wriggle Mouse Sagami. Neurosci Res. 1993;16:39–48. doi: 10.1016/0168-0102(93)90007-d. [DOI] [PubMed] [Google Scholar]
- Jassen AK, Yang H, Miller GM, Calder E, Madras BK. Receptor regulation of axon guidance molecule gene expression. Mol Pharmacol. 2006;70:71–77. doi: 10.1124/mol.105.021998. [DOI] [PubMed] [Google Scholar]
- Jeong YG, Chung SH, Kim CT, Kim KH, Han SY, Hyun BH, Lee NS, Sawada K, Won MH, Fukui Y. Corticotropin-releasing factor immunoreactivity increases in the cerebellar climbing fibers in the novel ataxic mutant mouse, pogo. Anat Histol Embryol. 2006;35:111–115. doi: 10.1111/j.1439-0264.2005.00646.x. [DOI] [PubMed] [Google Scholar]
- Jeong YG, Hyun BH. Abnormal synaptic organization between granule cells and Purkinje cells in the new ataxic mutant mouse, pogo. Neurosci Lett. 2000;294:77–80. doi: 10.1016/s0304-3940(00)01547-0. [DOI] [PubMed] [Google Scholar]
- Jinnah HA, Hess EJ, LeDoux MS, Sharma N, Baxter MG, Delong MR. Rodent models for dystonia research: characteristics, evaluation, and utility. Mov Disord. 2005;20:283–292. doi: 10.1002/mds.20364. [DOI] [PubMed] [Google Scholar]
- Jun K, Piedras-Renteria ES, Smith SM, Wheeler DB, Lee SB, Lee TG, Chin H, Adams ME, Scheller RH, Tsren RW, Shin HS. Ablation of P/Q-type Ca(2+) channel currents, altered synaptic transmission, and progressive ataxia in mice lacking the alpha(1 A)-subunit. Proc Natl Acad Sci USA. 1999;96:15245–15250. doi: 10.1073/pnas.96.26.15245. [DOI] [PMC free article] [PubMed] [Google Scholar]
- Kalia SK, Lee S, Smith PD, Liu L, Crocker SJ, Thorarinsdottir TE, Glover JR, Fon EA, Park DS, Lozano AM. BAGS inhibits parkin and enhances dopaminergic neuron degeneration. Neuron. 2004;44:931–945. doi: 10.1016/j.neuron.2004.11.026. [DOI] [PubMed] [Google Scholar]
- Kang MG, Campbell KP. Gamma subunit of voltage-activated calcium channels. J Biol Chem. 2003;278:21315–21318. doi: 10.1074/jbc.R300004200. [DOI] [PubMed] [Google Scholar]
- Kapfhamer D, Sweet HO, Sufalko D, Warren S, Johnson KR, Burmeister M. The neurological mouse mutations jittery and hesitant are allelic and map to the region of mouse chromosome 10 homologous to 19p13.3. Genomics. 1996;35:533–538. doi: 10.1006/geno.1996.0394. [DOI] [PubMed] [Google Scholar]
- King JS, Bishop GA. The distribution and cellular localization of CRF-R1 in the vermis of the postnatal mouse cerebellum. Exp Neurol. 2002;178:175–185. doi: 10.1006/exnr.2002.8052. [DOI] [PubMed] [Google Scholar]
- Kulik A, Nakadate K, Hagiwara A, Fukazawa Y, Lujan R, Saito H, Suzuki N, Futatsugi A, Mikoshiba K, Frotscher M, Shigemoto R. Immunocytochemical localization of the alpha 1A subunit of the P/Q-type calcium channel in the rat cerebellum. Eur J Neurosci. 2004;19:2169–2178. doi: 10.1111/j.0953-816X.2004.03319.x. [DOI] [PubMed] [Google Scholar]
- Laxminarayan KM, Chan BK, Tetaz T, Bird PI, Mitchell CA. Characterization of a cDNA encoding the 43-kDa membrane-associated inositol-polyphosphate 5-phosphatase. J Biol Chem. 1994;269:17305–17310. [PubMed] [Google Scholar]
- LeDoux MS, Lorden JF, Ervin JM. Cerebellectomy eliminates the motor syndrome of the genetically dystonic rat. Exp Neurol. 1993;120:302–310. doi: 10.1006/exnr.1993.1064. [DOI] [PubMed] [Google Scholar]
- LeDoux MS, Hurst DC, Lorden JF. Single-unit activity of cerebellar nuclear cells in the awake genetically dystonic rat. Neurosci. 1998;86:533–545. doi: 10.1016/s0306-4522(98)00007-4. [DOI] [PubMed] [Google Scholar]
- LeDoux MS, Lorden JF. Abnormal spontaneous and harmaline-stimulated Purkinje cell activity in the awake genetically dystonic rat. Exp Brain Res. 2002;145:457–467. doi: 10.1007/s00221-002-1127-4. [DOI] [PubMed] [Google Scholar]
- LeDoux MS. Animal models and the science of movement disorders. In: LeDoux MS, editor. Animal models of movement disorders. San Diego: Elsevier; 2004a. pp. 13–31. [Google Scholar]
- LeDoux MS. The genetically dystonic rat. In: LeDoux MS, editor. Animal models of movement disorders. San Diego: Elsevier; 2004b. pp. 241–252. [Google Scholar]
- Letts VA, Felix R, Biddlecome GH, Arikkath J, Mahaffey CL, Valenzuela A, Bartlett FS, 2nd, Mori Y, Campbell KP, Frankel WN. The mouse stargazer gene encodes a neuronal Ca2+ channel gamma subunit. Nat Genet. 1988;9:340–347. doi: 10.1038/1228. [DOI] [PubMed] [Google Scholar]
- Lorden JF, Lutes J, Michela VL, Ervin J. Abnormal cerebellar output in rats with an inherited movement disorder. Exp Neurol. 1992;118:95–104. doi: 10.1016/0014-4886(92)90026-m. [DOI] [PubMed] [Google Scholar]
- Lorden JF, McKeon TW, Baker HJ, Cox N, Walkley SU. Characterization of the rat mutant dystonic (dt): a new animal model of dystonia musculorum deformans. J Neurosci. 1984;4:1925–1932. doi: 10.1523/JNEUROSCI.04-08-01925.1984. [DOI] [PMC free article] [PubMed] [Google Scholar]
- Lorden JF, Oltmans GA, McKeon TW, Lutes J, Beales M. Decreased cerebellar 3′,5′-cyclic guanosine monophosphate levels and insensitivity to harmaline in the genetically dystonic rat (dt) J Neurosci. 1985;5:2618–2625. doi: 10.1523/JNEUROSCI.05-10-02618.1985. [DOI] [PMC free article] [PubMed] [Google Scholar]
- McKeon TW, Lorden JF, Oltmans GA, Beales M, Walkley SU. Decreased catalepsy response to haloperidol in the genetically dystonic (dt) rat. Brain Res. 1984;308:89–96. doi: 10.1016/0006-8993(84)90920-x. [DOI] [PubMed] [Google Scholar]
- Miyata M, Okada D, Hashimoto K, Kano M, Ito M. Corticotropin-releasing factor plays a permissive role in cerebellar long-term depression. Neuron. 1999;22:763–775. doi: 10.1016/s0896-6273(00)80735-7. [DOI] [PubMed] [Google Scholar]
- Oltmans GA, Beales M, Lorden JF. Glutamic acid decarboxylase activity in micropunches of the deep cerebellar nuclei of the genetically dystonic (dt) rat. Brain Res. 1986;385:148–151. doi: 10.1016/0006-8993(86)91556-8. [DOI] [PubMed] [Google Scholar]
- Palkovits M, Leranth C, Gores T, Young WS., 3rd Corticotropin-releasing factor in the olivocerebellar tract of rats: demonstration by light- and electron-microscopic immunohistochemistry and in situ hybridization histochemistry. Proc Natl Acad Sci U S A. 1987;84:3911–3915. doi: 10.1073/pnas.84.11.3911. [DOI] [PMC free article] [PubMed] [Google Scholar]
- Panagabko C, Morley S, Hernandez M, Cassolato P, Gordon H, Parsons R, Manor D, Atkinson J. Ligand specificity in the CRAL-TRIO protein family. Biochemistry. 2003;42:6467–6474. doi: 10.1021/bi034086v. [DOI] [PubMed] [Google Scholar]
- Pottorf WJ, Thayer SA. Transient rise in intracellular calcium produces a long-lasting increase in plasma membrane calcium pump activity in rat sensory neurons. J Neurochem. 2002;83:1002–1008. doi: 10.1046/j.1471-4159.2002.01221.x. [DOI] [PubMed] [Google Scholar]
- Raike RS, Jinnah HA, Hess EJ. Animal models of generalized dystonia. NeuroRx. 2005;2:504–512. doi: 10.1602/neurorx.2.3.504. [DOI] [PMC free article] [PubMed] [Google Scholar]
- Sanger TD. Childhood onset generalised dystonia can be modelled by increased gain in the indirect basal ganglia pathway. J Neurol Neurosurg Psychiatry. 2003;74:1509–1515. doi: 10.1136/jnnp.74.11.1509. [DOI] [PMC free article] [PubMed] [Google Scholar]
- Sawada K, Sakata-Haga H, Hisano S, Fukui Y. Topological relationship between corticotropin-releasing factor-immunoreactive cerebellar afferents and tyrosine hydroxylase-immunoreactive Purkinje cells in a hereditary ataxic mutant, rolling mouse Nagoya. Neuroscience. 2001;102:925–935. doi: 10.1016/s0306-4522(00)00533-9. [DOI] [PubMed] [Google Scholar]
- Sepulveda MR, Berrocal-Carrillo M, Gasset M, Mata AM. The plasma membrane Ca2+-ATPase isoform 4 is localized in lipid rafts of cerebellum synaptic plasma membranes. J Biol Chem. 2006;281:447–453. doi: 10.1074/jbc.M506950200. [DOI] [PubMed] [Google Scholar]
- Shen Y, Hansel C, Linden DJ. Glutamate release during LTD at cerebellar climbing fiber-Purkinje cell synapses. Nat Neurosci. 2002;5:725–726. doi: 10.1038/nn895. [DOI] [PubMed] [Google Scholar]
- Shima Y, Kengaku M, Hirano T, Takeichi M, Uemura T. Regulation of dendritic maintenance and growth by a mammalian 7-pass transmembrane cadherin. Dev Cell. 2004;7:205–216. doi: 10.1016/j.devcel.2004.07.007. [DOI] [PubMed] [Google Scholar]
- Strahl T, Grafelmann B, Dannenberg J, Thorner J, Pongs O. Conservation of regulatory function in calcium-binding proteins: human frequenin (neuronal calcium sensor-1) associates productively with yeast phosphatidylinositol 4-kinase isoform, Pik1. J Biol Chem. 2003;278:49589–49599. doi: 10.1074/jbc.M309017200. [DOI] [PubMed] [Google Scholar]
- Stratton SE. Neurophysiological and neuroanatomical investigations of the olivo-cerebellar system in the mutant rat dystonic (dt) Unpublished doctoral dissertation, University of Alabama; Birmingham: 1991. [Google Scholar]
- Street VA, Bosma MM, Demas VP, Regan MR, Lin DD, Robinson LC, Agnew WS, Tempel BL. The type 1 inositol 1,4,5-trisphosphate receptor gene is altered in the opisthotonos mouse. J Neurosci. 1997;17:635–645. doi: 10.1523/JNEUROSCI.17-02-00635.1997. [DOI] [PMC free article] [PubMed] [Google Scholar]
- Swinny JD, Metzger F, IJkema-Paassen J, Gounko NV, Gramsbergen A, van der Want JJ. Corticotropin-releasing factor and urocortin differentially modulate rat Purkinje cell dendritic outgrowth and differentiation in vitro. Eur J Neurosci 2004. 2004;19:1749–1758. doi: 10.1111/j.1460-9568.2004.03279.x. [DOI] [PubMed] [Google Scholar]
- Takahashi K, Kitamura K. A point mutation in a plasma membrane Ca(2+)-ATPase gene causes deafness in Wriggle Mouse Sagami. Biochem Biophys Res Commun. 1999;261:773–778. doi: 10.1006/bbrc.1999.1102. [DOI] [PubMed] [Google Scholar]
- Waters MF, Minassian NA, Stevanin G, Figueroa KP, Bannister JP, Nolte D, Mock AF, Evidente VG, Fee DB, Muller U, Durr A, Brice A, Papazian DM, Pulst SM. Mutations in voltage-gated potassium channel KCNC3 cause degenerative and developmental central nervous system phenotypes. Nat Genet. 2006;38:447–451. doi: 10.1038/ng1758. [DOI] [PubMed] [Google Scholar]
- Wiedmer T, Zhao J, Li L, Zhou Q, Hevener A, Olefsky JM, Curtiss LK, Sims PJ. Adiposity, dyslipidemia, and insulin resistance in mice with targeted deletion of phospholipid scramblase 3 (PLSCR3) Proc Natl Acad Sci USA. 2004;101:13296–13301. doi: 10.1073/pnas.0405354101. [DOI] [PMC free article] [PubMed] [Google Scholar]
- Xiao J, LeDoux MS. Caytaxin deficiency causes generalized dystonia in rats. Brain Res Mol Brain Res. 2005;141:181–192. doi: 10.1016/j.molbrainres.2005.09.009. [DOI] [PubMed] [Google Scholar]
- Yuzaki M, Forrest D, Curran T, Connor JA. Selective activation of calcium permeability by aspartate in Purkinje cells. Science. 1996;273:1112–1114. doi: 10.1126/science.273.5278.1112. [DOI] [PubMed] [Google Scholar]
- Zhou Q, Ben-Efraim I, Bigcas JL, Junqueira D, Wiedmer T, Sims PJ. Phospholipid scramblase 1 binds to the promoter region of the inositol 1,4,5-triphosphate receptor type 1 gene to enhance its expression. J Biol Chem. 2005;280:35062–35068. doi: 10.1074/jbc.M504821200. [DOI] [PubMed] [Google Scholar]
Associated Data
This section collects any data citations, data availability statements, or supplementary materials included in this article.
Supplementary Materials
Unfiltered Affymetrix GeneChip® Data. A tab-delimited text file for each GeneChip® expression array is included in this folder. These files can be imported into Excel and a variety of additional software packages specifically designed for analysis of microarray data.