

Abstract
Objective
To investigate upper extremity muscle activation and recovery during the first few months after stroke.
Methods
Subjects with hemiparesis following stroke were studied performing a reaching task at an acute time point (mean = 9 days post-stroke) and then again at a subacute time point (mean = 109 days post-stroke). We recorded kinematics and electromyographic activity of 6 upper extremity muscles.
Results
At the acute time point, the hemiparetic group had delayed muscle onsets, lower modulation ratios, and higher relative levels of muscle activation (%MVIC) during reaching than controls. From the acute to the subacute time points, improvements were noted in all three variables. By the subacute phase, muscle onsets were similar to controls, while modulation ratios remained lower than controls and %MVIC showed a trend toward being greater in the hemiparetic group. Changes in muscle activation were differentially related to changes in reaching performance.
Conclusions
Our data show that improvements in muscle timing and decreases in the relative level of volitional activation may underlie improved reaching performance in the early months after stroke.
Significance
Given that stroke is one of the leading causes of persistent physical disability, it is important to understand how the ability to activate muscles changes during the early phases of recovery after injury.
Keywords: electromyography, rehabilitation, kinematics
INTRODUCTION
Hemiparesis is a common residual motor impairment resulting from stroke (Wade et al. 1983; Heller et al. 1987; Parker et al. 1986) and has been linked to compromised functional performance (Chae et al. 2002b; Canning et al. 2004; Boissy et al. 1999; Mercier and Bourbonnais 2004). A substantial body of work in people with chronic hemiparesis, a time at which the majority (if any) motor recovery has already occurred (Duncan et al. 2000; Jorgensen et al. 1995), has shown that the underlying neuromuscular mechanisms of hemiparesis include: 1) loss of functioning motor units (McComas et al. 1973), 2) changes in recruitment order of motor units (Grimbly et al. 1972), and 3) changes in the firing rates of motor units (Rosenfalck and Andreassen 1980; Dietz et al. 1986; Gemperline et al. 1995; Frontera et al. 1997) (for review see Bourbonnais and Vanden Noven, 1989; Gracies, 2005). These changes in motor unit physiology result in alterations of muscle activation patterns such as a decreased ability to recruit the agonist muscles for a given task (Hammond et al. 1988; Gowland et al. 1992; Fellows et al. 1994; Kamper and Rymer 2001), delayed initiation and termination of muscle activity (Chae et al. 2002a; Sahrmann and Norton 1977; Twitchell 1951), antagonist co-activation (Hammond et al. 1988; Kamper and Rymer 2001), and loss of selective activation of sets of muscles needed to perform skilled motor tasks (Lang and Schieber 2003). How muscle activation changes from initial injury to the chronic phase after stroke is not well understood.
Twitchell (1951) provided early descriptions of voluntary and reflexive muscle activation in people with hemiparesis early after stroke. Expanding on this work, we quantitatively examined voluntary muscle activation changes from the acute to subacute phases after stroke during a reaching task in a select group of subjects with hemiparesis. Reaching is a fundamental component of daily movement that requires the coordination of multiple upper extremity (UE) segments (Flash and Hogan 1985; Uno et al. 1989; Sejnowski 1998). We chose to study muscle activations during a reaching task because reaching has been extensively studied in healthy adults and in people with chronic hemiparesis to better understand UE movement control (Flash and Hogan 1985; Trombly 1993; Sejnowski 1998; Levin 1996; Archambault et al. 1999; Reinkensmeyer et al. 2002; Kamper et al. 2002; Cirstea and Levin 2000; Roby-Brami et al. 2003; Trombly 1992). This report focuses on the changes in muscle activation from the acute to subacute phase after stroke. Descriptions of the kinematics of reaching from the acute to the subacute phase after stroke are provided elsewhere (Lang et al. 2005; Wagner et al. 2006).
The primary purposes of this study were to examine: 1) muscle activation during reaching in subjects with acute hemiparesis, and 2) how muscle activation might change during recovery. A secondary purpose was to describe relationships between changes in muscle activation and changes in UE movement performance. We hypothesized that the acute central nervous system damage (e.g., loss of descending motor system input) after stroke would result in a reduced ability to activate and modulate the muscles, reflected by later muscle onset times and smaller modulation ratios. Furthermore, we expected that hemiparetic subjects would utilize a greater percentage of their muscle capacity than is normally recruited during reaching. From the acute to the subacute phase after stroke, recovery of reaching performance might be driven by improvements in muscle activation and modulation, decreases in the relative recruitment capacity of the muscle used for reaching, or some combination of all these.
MATERIALS AND METHODS
Subjects
Twenty-nine subjects with hemiparesis resulting from stroke were tested twice, acutely (mean = 8.7 days post stroke) and during the sub-acute phase after stroke (mean = 108.7 days post stroke). Hemiparetic subjects were recruited from the acute stroke service of Barnes-Jewish Hospital and the stroke rehabilitation service of the Rehabilitation Institute of St. Louis, St. Louis, MO. The recruited subjects were those with significant UE motor impairment who nonetheless had some residual voluntary motor ability. Subjects were included if they had: 1) an ischemic or hemorrhagic stroke within 28 days of admission to inpatient rehabilitation, 2) persistent hemiparesis as indicated by a 1 or 2 on the motor arm item of the National Institutes of Health Stroke Scale (NIHSS), 3) the presence of some UE voluntary activity as indicated by the ability to move proximal and/or distal joints against gravity, 4) evidence of preserved cognitive function as indicated by a score of 0 or 1 on items 1-2 of the NIHSS, 5) the ability to follow 2 step commands, and 6) no UE injury or condition that limited use prior to the stroke. Subjects were excluded if they: 1) could not give informed consent, 2) had clinically significant fluctuations in mental status in the 72 hours prior to enrollment, 3) had hemispatial neglect, and/or 4) were not expected to survive 1 year due to other illnesses (e.g. malignancy). Characteristics of the hemiparetic group are provided in Table 1. As can be seen from the scores on clinical rating scales, the hemiparetic group was reasonably representative of patients typically seen in inpatient rehabilitation programs.
Table 1.
Hemiparetic subject characteristics. Values represent group means + SD (range) where appropriate.
| Acute | Subacute | |
|---|---|---|
| Age (years) | 63.9 ± 11.5 (39-87) |
|
| Time since lesion (days) | 8.7 ± 3.2 (4 – 17) |
108.7 ± 17.9 (86 – 171) |
| Gender | 14 female, 15 male | |
| Lesion type | 21 ischemic, 8 hemorrhagic | |
| ARAT a | 22.8 ± 16.2 (0 – 57) |
45.9 ± 14.0 (8 – 57) |
| FIM Motor b | 58.0 ± 11.5 (39 – 78) |
83.2 ± 9.9 (46 – 91) |
| Percentage of subjects with acute clinical imaging data c |
79% (23/29) | |
| Percentage of subjects with image data with identifiable acute lesions d |
70% (16/23) | |
| Type of stroke in subjects with clinical imaging data d |
16 Ischemic, 7 Hemorrhagic | |
| Lesion size in subjects with identifiable lesionse,f |
< 1.5 cm, = 4 1.6-3.0 cm = 8 > 3.0 cm = 4 1 uncategorized |
|
| Lesion location in subjects with identifiable lesions e |
29% (5/17) Brainstem 18% (3/17) Hemispheric – superficial 53% (9/17) Hemispheric – deep cortical (white or gray matter structures) |
|
ARAT: Action Research Arm Test, normal performance = maximum score of 57
FIM-Motor: Functional Independence Measure – Motor, normal performance = maximum score of 91 (13 scored items)
Lesion data from clinical MR or CT scans obtained during inpatient hospitalization.
CT scans done early after stroke have limited ability to detect an acute ischemic lesion.
17 lesions identified in 16 subjects
Maximum axial diameter
Hemiparetic subjects were participants in VECTORS (Very Early Constraint-induced Therapy for Recovery of Stroke), a single-center randomized control trial investigating early motor recovery of the UE following stroke conducted at Washington University School of Medicine. As part of the clinical trial, all VECTORS subjects participated in a 2 week (10 sessions) UE training program during inpatient rehabilitation. Subjects were randomly assigned to one of three treatment groups: 1) control group (2 hours daily of traditional occupational therapy (OT); 2) dose-matched constraint induced therapy (CIT) group (2 hours shaping, 6 hours/day constraint) or 3) high-intensity CIT group (3 hours shaping, 90% waking hours constraint). Data in this report are from their pre-randomization baseline visit (acute time point) and at their 90 day follow-up visit (subacute time point).
Age- and gender-matched control subjects (mean age 58.4 ± 13.1 years, range 40-78 years; 4 females, 5 males) were also studied. These subjects were free of neurologic or orthopedic conditions that might affect their upper extremities. Hemiparetic subjects were tested on their affected side (contralateral to the lesion), and control subjects were tested on their dominant side. Informed consent was obtained from all subjects prior to participation.
Paradigm
Subjects were studied performing a forward reaching task while seated in a straight back chair, with the trunk strapped to the back of the chair. With the trunk stabilized against the chair, subjects were unable to compensate by rotating and flexing the trunk to touch the target (Cirstea and Levin 2000). The start position was with the tested UE resting on a pillow on the ipsilateral thigh, such that the shoulder was in approximately 0° flexion/extension and 0° of internal rotation, the elbow was in 75-90° flexion, and the wrist rested palm down, with the finger joints in slight flexion on the pillow. Minor modifications (e.g. increased shoulder internal rotation) to the start position were allowed for some subjects to minimize any positional discomfort.
Three-dimensional movements were recorded at 60 Hz using a 6 camera HiRes Motion Analysis Corporation System (Motion Analysis Corp., Santa Rosa, CA). A total of 13 reflective markers were placed on the trunk (3), upper arm (3), forearm (3), dorsum of hand (1), index finger (1), thumb (1), and target (1). Surface electromyography (EMG) was recorded at 1200 Hz and bandpass filtered during data collection at 10-500 Hz using a Myosystem 1400A unit (Noraxon, Inc., Scottsdale, AZ). Bipolar disposable, self-adhesive Ag/AgCl electrodes (Noraxon, Inc, Scottsdale, AZ), 1 cm in diameter with an inter-electrode distance of 2 cm, were placed over the muscle bellies of the anterior deltoid, posterior deltoid, biceps brachii, long head of triceps, extensor carpi radialis, and flexor carpi radialis muscles of the involved or dominant UE. Electrodes on the extensor carpi radialis and flexor carpi radialis also recorded activity from adjacent extensor and flexor synergists respectively and recordings from these electrodes are subsequently referred to as recordings from wrist extensors and wrist flexors. Kinematic and EMG data were recorded simultaneously for 10 seconds, with the 1st 1-2 seconds of data collected prior to the start of movement to ensure the collection of resting EMG data. Data were subsequently stored on computer disk for further analyses.
From the start position, subjects were instructed to reach forward as fast as possible and touch a 40 mm diameter target positioned at 90% of their arm's length directly in front of the affected or dominant shoulder at shoulder height. Subjects were given 1-2 practice trials prior to recording to familiarize themselves with the task and the instructions. Three trials of reaching movement were recorded. After the reaching trials were collected, additional EMG data were recorded during maximal voluntary isometric contractions (MVIC) of each muscle group using standard manual muscle testing techniques (Kendall and McCreary 1983), except that subjects were seated. MVIC trials were collected after the reaching trials and a subsequent rest period in an attempt to avoid the influence of fatigue on reaching performance, especially during the acute testing session.
Analyses
Kinematic data analyses have been described previously (Lang et al. 2005; Wagner et al. 2006). Briefly, EvaRT and Kintrak software (Motion Analysis Corporation, Santa Rosa, CA) was used to extract position, velocity, and angular data during the reaching task. Data were low-pass filtered at 6 Hz. For the reach, start of movement was defined as the time at which the tangential wrist velocity exceeded 5% of maximum velocity that was recorded during the task. End of the 1st phase of reach was defined as the time at which the wrist velocity dropped to a minimum prior to subsequent corrective movements. For each trial we quantified the speed, accuracy, and efficiency of reaching, three characteristics of performance important for normal function. We considered an efficient movement to be one that moves directly to the target without extraneous or abnormally circuitous movements.
Peak wrist velocity, endpoint error, and reach path ratio were used to quantify speed, accuracy, and efficiency of reach, respectively. Peak wrist velocity was the maximum tangential linear velocity of the wrist attained between start of movement and end of the 1st phase of reach. Endpoint error was the 3-dimensional distance from the index finger to the center of the target at the end of the 1st phase of reach. Reach path ratio was calculated as the ratio of the length of the actual wrist path traveled to an ideal straight line between the start position and target touch. For subjects that were unable to touch the target, the reach path ratio was calculated from start of movement to the time and position where the index finger was closest to the target. A reach path ratio of 1 represents a straight path (ideal), whereas a reach path ratio > 1 represents either an abnormally curved path or multiple attempts to touch the target. Reach path ratio was chosen as a measure of reach efficiency in this study because in our hemiparetic sample, higher reach path ratios were due to multiple attempts to touch the target and not due to decoupling in the shoulder and elbow joint, as they are in subjects with cerebellar damage (Bastian et al. 1996). In addition, the time from start of movement to target touch was calculated and reported as movement time.
The raw EMG data were: 1) high-pass filtered forward and backward (zero phase distortion) at 10 Hz to remove motion artifact, 2) full wave rectified, and 3) then low-pass filtered forward and backward (zero phase distortion) at 20 Hz to create an envelope of the rectified EMGs. The envelope was subsequently used to quantify muscle activity (Figure 1). Analysis of EMG during reaching was restricted to the EMG signal that was collected from 100 ms prior to the start of movement to target touch. Custom software was written in MATLAB (MATHWORKS, Natick, MA) to determine 1) muscle onset time, 2) modulation of muscle activation (modulation ratio), and 3) relative amount of muscle activation (%MVIC) for each muscle during the reach task. Muscle onset time was used to quantify the timeliness of muscle activation (Thoroughman and Shadmehr 1999; Vono and Hobart 1981; Schneider et al. 1989), a critical feature of skilled movement. The modulation ratio was used to quantify the initial ability to rapidly increase muscle activity during the reach. Being able to quickly increase muscle activity is important for the smooth execution of timely movements (Burleigh and Horak 1996; Lang and Bastian 1999). The %MVIC recorded during reaching was used to quantify the relative level of muscle activation used during the reaching task. Thus, the %MVIC represents the effort required to perform the reaching task and indicates how much of the overall capacity of the muscle is required to perform the task (McCrea et al. 2005).
Figure 1.

EMG traces for 6 UE muscles during reaching for a control subject (A, B), and a hemiparetic subject during the acute (C, D) and subacute phase (E, F) after stroke. All EMG traces start 200 ms prior to start of reach and continue to target touch. X axis = milliseconds, with negative numbers representing time prior to start of reach. Y axis = volts. Vertical line indicates the time of start of reach (0 ms). Panels A, C, E show rectified EMG. Panels B, D, F show the EMG envelope (rectified, 20 Hz low pass filter) used in subsequent analyses. * indicates muscle onset. AD = anterior deltoid, PD = posterior deltoid, BIC = biceps, TRI = triceps, WF = wrist flexors, WE = wrist extensors.
Muscle onset time was defined as the time at which the EMG envelope exceeded a baseline threshold for >30 ms, where the baseline threshold was set at 2.0 standard deviations above the resting mean. This resting mean was the average of the 1st 200-300 ms of the trial, prior to the go signal, during which the subject's UE was supported and visual inspection of the signal confirmed minimal muscle activity. Muscle onset time is expressed in relation to movement onset time, such that negative values represent muscle activity prior to movement (see Figure 1 for examples). We chose not to normalize the muscle onset times by movement time because movement times were expected to change with recovery from stroke, and because changes in the muscle activation should underlie changes in movement time, and not vice versa. The modulation ratio was calculated as the ratio of the integrated EMG activity during the 1st 100 ms after muscle onset to the resting mean EMG value x 100 ms (Lang and Bastian 1999). This ratio was used to capture the degree to which subjects modulated (increased) muscle activity during the initial portion of the reach. A modulation ratio > 1 indicates that there was modulation of muscle activation during the 1st 100 ms after muscle onset, with higher ratios representing greater muscle activation. A modulation ratio of 1 indicates that there was no modulation of the muscle above resting values. The relative amount of muscle activation (%MVIC) was defined as the peak envelope value during the reaching trial divided by the peak envelope value during the MVIC trial. The peak envelope value during MVIC was calculated by taking the mean EMG value for the 10 ms window surrounding the actual peak signal. We used this 10 ms window instead of a single ms of data, as others have done (Lang and Schieber 2004), to avoid inflating MVIC values. Calculations of muscle onset time, modulation ratio, and %MVIC were done separately for each muscle and each of the three trials, and the mean of the values from the three reach trials entered in subsequent statistical analyses. Additional analyses were developed to: 1) quantify the presence of co-activation of agonist-antagonist muscle pairs during reaching and 2) describe the sequence of muscle activation during reaching. All computer algorithm-based determinations of EMGs values were verified with visual inspection.
Statistica software (StatSoft, Tulsa, OK) was used for all statistical analysis and the criterion for significance was set at p = 0.05. T tests were used to test for differences in reaching performance and co-activation patterns between hemiparetic subjects and controls, and between the subacute and acute time points for the hemiparetic group. Repeated measures ANOVAs (2 (time) × 6 (muscle)) were used to test for changes over time in muscle onset times, modulation ratios, and %MVIC in the hemiparetic group. Repeated measures ANOVAs (2 (group) × 6 (muscle)) were used to test for differences in muscle onset times, modulation ratios, and %MVIC between the control group and the hemiparetic group at the two time points. Tukey's HSD tests were used for post-hoc comparisons when significant main and interaction effects were present. A Bonferroni correction was applied to adjust for multiple comparisons (t-tests and ANOVAs). Additional repeated measures ANOVAs were used to look for differences between subgroups of subjects with lesions restricted to the corticospinal system and for differences between subgroups stratified by initial hemiparetic severity. Lastly, Pearson product moment correlations were used to examine relationships between changes in reaching performance and changes in EMG variables within the hemiparetic group.
RESULTS
Summary of changes in reaching performance
Acutely (mean of 8.7 ± 3.2 days post stroke), reaching performance of the hemiparetic group was generally poor, such that the hemiparetic group had longer movement times (p = 0.006), lower peak wrist velocities (p < 0.001), larger endpoint errors (p = 0. 001), and a trend for higher reach path ratios (p = 0. 033) compared to the control group (Table 2). Improvements were noted in the hemiparetic group for all reach performance variables by the subacute time point. Movement time, endpoint errors, and reach path ratios were similar to controls by the subacute time point (p = 0.15, 0.04 & 0.29, respectively), but peak wrist velocities remained impaired in the hemiparetic group as compared to the control group (p = 0.004). While both groups had similar variability in peak wrist velocities, the variability in movement times, endpoint errors, and reach path ratios was much larger in the hemiparetic group than the control group at both time points.
Table 2.
Reach performance variables. Values represent group means ± SDs.
| Acute | Subacute | Control | |
|---|---|---|---|
| Movement time (ms) |
2095 ± 1790* | 876 ± 1072 † | 347 ± 58 |
| Peak wrist velocity (mm/s) |
630 ± 331* | 813 ± 392 * † | 1261 ± 385 |
| Endpoint error (mm) |
126 ± 86* | 56 ± 46† | 24 ± 8 |
| Reach path ratio | 1.43 ± 0.56 | 1.09 ± 0.23 † | 1.01 ± 0.01 |
significantly different from control group, p < 0.05
significantly different from acute measurement, p < 0.05
Hemiparetic Muscle Activation During Reaching
Control subjects activated all 6 UE muscles recorded during the reaching task. An example of muscle activation during reaching for a control subject is shown in Figure 1A and 1B. Since subjects were enrolled in our study based on the presence of hemiparesis shortly after stroke (mean = 8.7 days), we anticipated that some, or perhaps many of the paretic muscles would not be activated during the reach. We found few instances where this was the case. Of the 1044 hemiparetic EMG signals independently evaluated (29 subjects × 3 trials × 6 muscles × 2 time points), we were unable to pick onsets during the reach in only 57 (5.5%). The reasons for the inability to pick onsets was either because there was no activity in the EMG signals during the reach, or because the activity in the EMG signal did not rise significantly above the baseline (see Materials and Methods). An example of the failure of the EMG signal to rise above baseline is shown in the traces from the acute hemiparetic subject shown in Figure 1C and 1D. The wrist flexors had variable activity during the baseline rest period (not shown), and thus during the 100 ms prior until target touch, the signal never stayed significantly above the baseline for the required time period. If we were unable to pick muscle onsets in 2 of 3 reach trials for a specific muscle, that muscle was categorized as “not activated” during the reach. Using this criteria, only 20 (5.7%) out of 348 muscles (29 subjects × 6 muscles × 2 time points) were considered not activated during the reach. Out of these 20 muscles not activated, 10 instances occurred during the acute time point and 10 occurred during the subacute time point. The most common muscle labeled as not activated was the wrist flexors (12/20 instances), an antagonist muscle in this task. The specific muscles that were not activated during the reach were not consistent across the acute to subacute time points, such that some muscles in some subjects were activated during the reach at the acute time point but were not activated during the reach in the subacute time point and vice versa. Subsequent analyses were performed on muscles that were activated according to our criteria.
Muscle onset time
Muscle onset time, expressed in relation to the start of movement, was used to reflect the temporal activation of the muscle during reaching. Negative muscle onset values represent muscle activity prior to start of movement. The control group had muscle onset times that occurred prior to the start of movement for all 6 muscles studied (individual examples in Figure 1; group data in Figure 2). Muscle onset times for the hemiparetic group were later and more variable than the control group at the acute time point after stroke (main effect of group, F1, 36 = 6.81, p = 0.013), with onset times occurring after the start of movement for 3 of the 6 muscles. Hemiparetic muscle onset times decreased (moved earlier with respect to the start of movement) from the acute to the subacute time point (main effect of time, F1, 28 = 8.74, p = 0.007), such that at the subacute time point, muscle onset times were similar to the control group (main effect of group, F1, 36 = 1.23, p = 0.275) and muscle onsets occurred prior to the start of movement for all muscles except the wrist flexors. Within the hemiparetic group, muscle onset times differed between individual muscles at both time points after stroke (main effect of muscle, F5,140 = 12. 43, p < 0.000). Muscle onset times of the triceps, wrist flexors, and wrist extensors were later than those of the anterior deltoid, posterior deltoid, and biceps (Tukey's HSD, p < 0.03 for all). At both time points, the hemiparetic group had considerably more variability in muscle onset times compared to controls.
Figure 2.
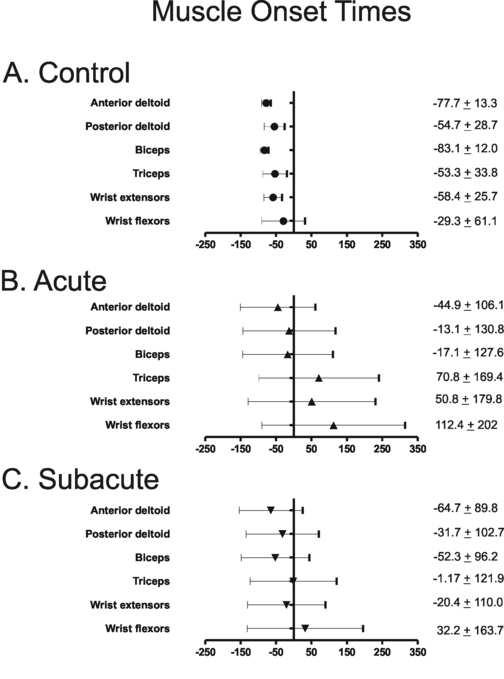
Group mean muscle onset times during reaching for 6 UE muscles for the control group (A.) and the hemiparetic group during the acute (B.) and subacute (C.) phase after stroke. Numeric values are mean (± standard deviation) muscle onset times (ms) for each muscle. Error bars represent standard deviations. X axis = milliseconds, with negative numbers representing time prior to start of reach. Y axis line represents start of reach.
Modulation ratio
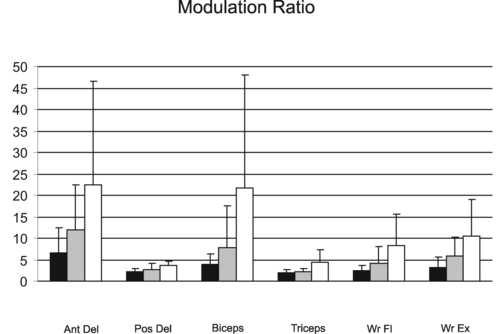
The modulation ratio reflects the degree to which subjects modulated muscle activity during the initial portion of the reach. Control subjects clearly modulated their muscle activity (Figure 3) such that there was an 11 to 22 fold increase in agonist activation and a 4 to 8 fold increase in antagonist activation during reaching. At the acute time point, the modulation ratio for the hemiparetic group was smaller than the control group (main effect of group, F1, 36 = 31.36, p < 0.000). The hemiparetic modulation ratio improved (increased) from the acute to subacute time point (main effect of time, F1, 28 = 14.52, p < 0.001) but still remained smaller than the control group by the subacute time point (main effect of group, F1, 36 = 10.96, p = 0.002). Hemiparetic modulation ratios differed between muscles at both time points (time × muscle interaction, F5,140 = 3.38, p = 0.007). At the acute time point, the modulation ratio for the anterior deltoid was greater than the ratio values of the 3 antagonist muscles (Tukey's HSD, p < 0.007 for all), but similar to the ratio values of the biceps brachii and wrist extensors (Tukey's HSD, p > 0.07 for both). At the subacute time point, the modulation ratio for the anterior deltoid was greater than the ratio values for all other muscles (Tukey's HSD, p < 0.01 for all). The modulation ratio values for anterior deltoid and biceps brachii muscles, both prime movers for the reaching task, were more variable than the other UE muscles in both the hemiparetic and control groups (Figure 3).
Figure 3.
Modulation ratio during reaching for 6 UE muscles for the hemiparetic group during the acute (black) and subacute (gray) phase after stroke and the control group (white). Error bars represent standard deviations. Ant Del = anterior deltoid, Pos Del = posterior deltoid, Wr Fl = wrist flexors, Wr Ex = wrist extensors.
Percent MVIC
We used the %MVIC during reaching as a measure of the relative level of volitional activation of each muscle, reflecting the effort required to perform the reaching task. Control subjects used only 1 – 2 % of their MVIC during reaching (Figure 4). At the acute time point, %MVIC used by the hemiparetic group during reaching was larger than the %MVIC of the control group (main effect of group, F1, 36 = 10.06, p = 0.031), with the hemiparetic subjects using 5 to 20 times greater %MVIC for the agonists than controls. Hemiparetic %MVIC decreased from the acute to subacute time point (main effect of time, F1, 28 = 4.91, p < 0.035). At the subacute time point, %MVICs in the hemiparetic group showed a trend towards remaining higher in the hemiparetic group compared to the control group (main effect of group, F1, 36 = 3.56, p = 0.067). Hemiparetic %MVIC differed between individual muscles at both time points (main effect of muscle, F5,140 = 7.22, p < 0.000), such that the %MVIC of the anterior deltoid used during reaching was larger than the %MVIC used by all other UE muscles recorded (Tukey's HSD, p < 0.001 for all). At both time points, the hemiparetic group had considerably more variability %MVIC as compared to controls (Figure 4).
Figure 4.

Mean %MVIC during reaching for 6 UE muscles for the hemiparetic group during the acute (black) and subacute (gray) phase after stroke and the control group (white). Error bars represent standard deviations. Abbreviations as in Figure 3.
To determine whether the reduction in the %MVIC over time was due to an increase in the available muscle capacity versus due to using a smaller proportion of the available capacity, we used an additional repeated measures ANOVA (time × muscle) to determine if the maximum EMG signal recorded during the MVIC trial changed from the acute to subacute time point. Although more variable than controls, no statistically significant changes in the maximal hemiparetic EMG signal (Table 3) were observed from the acute to the subacute time point (main effect of time, F1,28 = 0.47, p = 0.496), suggesting that the reduction in %MVIC from the acute to the subacute time points was due to using a smaller proportion of the available capacity of the UE muscles.
Table 3.
Maximal EMG values (volts) during maximal voluntary isometric contraction for the hemiparetic group at the acute and subacute time points. Values represent group means ± SDs.
| Acute | Subacute | |
|---|---|---|
| Anterior Deltoid | 1.189 (1.70)* | 0.772 (1.05) |
| Posterior Deltoid | 0.247 (0.194) | 0.328 (0.179) |
| Biceps Brachii | 0.206 (0.173) | 0.432 (0.424) |
| Triceps | 0.136 (0.130) | 0.248 (0.213) |
| Wrist Flexors | 0.146 (0.149) | 0.269 (0.314) |
| Wrist Extensors | 0.210 (0.242) | 0.327 (0.282) |
significantly different from all other muscles at acute time point, p < 0.001
Muscle activation in those subjects with lesions in the corticospinal tract
The severity of hemiparesis post stroke can be reasonably predicted by the extent of damage to the corticospinal system, i.e. the motor cortical areas and the corticospinal tract (Pineiro et al. 2000; Ward et al. 2006). Our hemiparetic subjects had lesions is a variety of locations throughout the descending motor systems (Table 1). We ran the statistical analyses a second time in a subgroup of individuals with identified lesions restricted to the corticospinal tract (various locations along the tract, n = 14) to see if that altered the results (table 4). As with the larger group, the subgroup had later muscle onset times (F1,21 = 14.37, p = 0.001), lower modulation ratios (F1,21 = 15.67, p = 0.0007) and greater %MVIC (F1,21 = 8.12, p = 0.01) at the acute time point compared to controls. The %MVIC also showed a significant interaction between muscle and group (F5,105 = 3.8, p = 0.003), where the subgroup had greater %MVIC (p = 0.02) in the anterior deltoid compared to controls. From the acute to the subacute time points, the subgroup showed significant improvements in muscle onset times (F1,13 = 9.19, p = 0.01) and modulation ratios (F1,13 = 6.85, p = 0.02). For %MVIC, a significant interaction was found (F5,65 = 4.31, p = 0.002), where there was a significant improvement over time in the anterior deltoid muscle (p = 0.007). As with the larger group by the subacute time point, muscle onset times in the subgroup were not significantly different from controls (F1,21 = 1.73, p = 0.20) and modulation ratios remained lower (F1,21 = 6.43, p = 0.02). The %MVIC remained greater than controls (F1,21 = 10.35, p = 0.004). In sum, results in the subgroup of individuals with identified lesions to the corticospinal tract were generally similar to results of the larger group (table 4).
Table 4.
Summary of EMG variables* for corticospinal tract (CST) lesion (n=14) and non-identified lesion (n = 15) subgroups. Values represent group means ± SDs.
| Acute Time Point | Subacute Time Point | |||
|---|---|---|---|---|
| CST Lesion Subgroup | Non-identified Lesion Subgroup | CST Lesion Subgroup | Non-identified Lesion Subgroup | |
| Muscle onset (ms) | ||||
| Anterior deltoid | −64.12 (27.87) | −26.86 (145.23) | −78.18 (28.50) | −52.08 (122.58) |
| Posterior deltoid | −18.09 (122.79) | −8.46 (137.65) | −46.40 (29.13) | −18.05 (140.99) |
| Biceps Brachii | −14.78 (105.11) | −50.99 (47.85) | −75.50 (23.23) | −30.63 (127.76) |
| Triceps | 53.84 (130.40) | 86.67 (197.47) | −7.37 (90.75) | 4.610 (144.65) |
| Wrist Flexors | 98.23 (132.69) | 156.03 (231.47) | −14.80 (87.60) | 76.06 (169.65) |
| Wrist Extensors | 73.72 (185.72) | 1.83 (140.84) | −33.29 (58.67) | −8.45 (140.23) |
| Modulation ratio | ||||
| Anterior deltoid | 5.72 (3.62) | 7.51 (7.21) | 9.89 (7.02) | 13.94 (12.86) |
| Posterior deltoid | 2.38 (0.92) | 1.98 (0.71) | 2.56 (0.93) | 2.87 (1.63) |
| Biceps Brachii | 4.63 (3.27) | 3.03 (1.41) | 9.38 (12.85) | 6.56 (5.55) |
| Triceps | 1.93 (0.78) | 1.96 (0.92) | 2.28 (0.98) | 1.96 (0.65) |
| Wrist Flexors | 2.66 (1.53) | 2.14 (0.86) | 4.57 (5.51) | 3.70 (1.98) |
| Wrist Extensors | 2.74 (1.82) | 3.58 (2.84) | 5.37 (3.33) | 6.27 (5.48) |
| % MVIC | ||||
| Anterior deltoid | 0.24 (0.30) | 0.167 (0.19) | 0.05 (0.06) | 0.15 (0.26) |
| Posterior deltoid | 0.03 (0.03) | 0.10 (0.21) | 0.02 (0.01) | 0.03 (0.02) |
| Biceps Brachii | 0.05 (0.04) | 0.09 (0.09) | 0.05 (0.01) | 0.07 (0.16) |
| Triceps | 0.02(0.02) | 0.07(0.12) | 0.04 (0.09) | 0.03 (0.03) |
| Wrist Flexors | 0.02(0.02) | 0.06 (0.05) | 0.03 (0.02) | 0.07 (0.05) |
| Wrist Extensors | 0.09 (0.12) | 0.11 (0.13) | 0.04 (0.04) | 0.06 (0.05) |
No significant differences were found between between the CST lesion subgroup and the non-identified lesion subgroup for any of the EMG variables at the acute and subacute time points (p values for main effects of group and group × muscle interactions ranged from 0.27 – 0.95).
Muscle activation after stratification into groups based on initial severity
Although we studied a select subgroup of subjects with post-stroke hemiparesis, motor severity varied among hemiparetic subjects (Table 1). We also re-ran the statistical analyses with the hemiparetic group stratified into 3 subgroups based on initial ARA test scores to see if muscle activation differed between subjects with varying levels of arm impairment. Group 1 (n = 11) included subjects that did not attempt all items on the ARA test (i.e. less than 19 points). Group 2 (n = 11) included subjects that attempted but did not complete all items on the ARA test (19 – 37 points). Group 3 (n = 7) included subjects that completed all items on the ARA test (38 or greater points). At the acute time point, there were no significant differences in muscle onset times (main effect of group, F2,26 = 0.31, p = 0.74) and modulation ratio values (main effect of group, F2,26 = 0.09, p = 0.91) between the 3 groups. The %MVIC was significantly greater for Group 1 than for the other two groups (main effect of group, F2,26 = 6.52, p = 0.005; Tukey's HSD p = 0.04 & 0.006, respectively). At the subacute time point, there were no significant differences in any EMG variable between the 3 groups.
Co-activation of agonist/antagonist pairs
We evaluated the presence of co-activation, defined as the concurrent onset of agonist/antagonist muscle pairs, during reaching. In the control group, differences in onset times between the agonist/antagonist muscle pairs were minimal but present (Table 5), suggesting that there was a sequential activation of agonist/antagonist muscle pairs. Similar evidence of sequential activation of agonist/antagonist pairs was observed in the hemiparetic group at both time points (p > 0.06 for all). Although more variable than the controls, no significant changes in co-activation were observed in the hemiparetic group from the acute to subacute time point. Combined with abnormalities in timing and relative recruitment described above, these results suggest that hemiparetic deficits in reaching performance are the result of agonist activation impairment and not excessive antagonist activation (McCrea et al. 2005; Lum et al. 2004; Patten et al. 2004; Sahrmann and Norton 1977; Colebatch et al. 1986; Hammond et al.1988; Gowland et al. 1992).
Table 5.
Differences between onset times (ms) during reaching for agonist - antagonist muscle pairs. Values represent group means ± SDs.
| Acute | Subacute | Control | |
|---|---|---|---|
| Ant del/Pos del | 80.2 ± 131.2 | 55.9 ± 117.4 | 25.9 ± 21.0 |
| Biceps/Triceps | 74.7 ± 76.4 | 126.6 ± 147.6 | 29.7 ± 33.4 |
| Wr ext/Wr flex | 144.5 ± 158.8 | 89.1 ± 101.7 | 39.8 ± 56.0 |
Ant del = anterior deltoid, Pos del = posterior deltoid
Wr ext = wrist extensors, Wr flex = wrist flexors
Relationships between changes in reaching performance and changes in EMG
We examined how changes in reaching performance (movement time, peak wrist velocity, endpoint error, and reach path ratio) related to changes in muscle activity (muscle onset time, modulation ratio, and %MVIC) using Pearson's correlation coefficients (Table 6). Based on our sample size, correlation coefficients greater than 0.37 were statistically significant at the p < 0.05 level. Here, we report the relationships between the agonist muscles (anterior deltoid, biceps, and wrist extensors) and reaching performance since these are the muscles responsible for moving the limb against gravity. Shorter movement times and faster peak wrist velocities were primarily related to improvements in muscle onset time. Improvements in reach path ratios were mainly related to reductions in the relative level of activation (%MVIC) of all 3 agonist muscles. Smaller endpoint errors (increased accuracy) were associated with improvements in the timing of anterior deltoid and wrist extensor onset and reductions in the relative level of activation of the wrist extensors. In general, changes in muscle onset and the relative level of activation of the biceps muscle during reach were not as strongly related to improvements in reaching performance as were changes in these muscle activation characteristics for the anterior deltoid and wrist extensors.
Table 6.
Relationships between changes in reaching performance versus changes in muscle activation for the hemiparetic group.
| CHANGES IN: | Movement time | Peak wrist velocity | Endpoint error | Reach path ratio |
|---|---|---|---|---|
| | ||||
| Muscle onset time | ||||
| | ||||
| Anterior deltoid | 0.65* | −0.39* | 0.52* | 0.23 |
| | ||||
| Biceps brachii | 0.15 | −0.04 | −0.01 | 0.23 |
| | ||||
| Wrist extensors | 0.53* | −0.36 | −0.45* | 0.65* |
| | ||||
| | ||||
| Modulation ratio | ||||
| | ||||
| Anterior deltoid | −0.13 | 0.23 | −0.33 | 0.08 |
| | ||||
| Biceps brachii | 0.08 | 0.33 | −0.03 | 0.10 |
| | ||||
| Wrist extensors | −0.11 | 0.40* | −0.21 | −0.05 |
| | ||||
| | ||||
| %MVIC | ||||
| | ||||
| Anterior deltoid | 0.31 | −0.16 | 0.29 | 0.59* |
| | ||||
| Biceps brachii | 0.13 | 0.17 | −0.13 | 0.45* |
| | ||||
| Wrist extensors | 0.40* | −0.15 | 0.37* | 0.45* |
p < 0.05
Relationships between time since stroke and reaching and EMG variables
Subjects were initially tested between 4 and 17 days post stroke. Using Pearson product moment correlations, we looked for relationships between time since stroke and the 4 kinematic and 3 EMG variables within each time point. Of the 14 variables examined, only 2 were significantly correlated with time since stroke. Reaching endpoint error at the acute time point had a correlation coefficient of r = 0.43 (p < 0.05) with time since stroke, indicating that those subjects who were tested later were more likely to have greater endpoint errors (i.e. less accurate reaches). The wrist extensor modulation ratio at the subacute time point had a correlation coefficient of r = −0.41 (p < 0.05) with time since stroke, indicating that those subjects who were tested later were less able to modulate the wrist extensor activity. These 2 significant correlations may be due to how subjects were enrolled in the clinical trial. Subjects with greater movement deficits were sometimes enrolled later (14-17 days post stroke) because they did not meet the inclusion criteria in the first week after stroke.
DISCUSSION
In the first few weeks after stroke (acute phase), the hemiparetic group demonstrated delayed muscle onsets, impaired modulation of muscle activation, and higher relative levels of volitional muscle activation (%MVIC) during reaching compared to the control group. Between the first few weeks after stroke and the first few months after stroke (subacute phase), improvements were noted in muscle onset times, modulation ratios, and %MVIC. By the subacute phase, modulation ratios remained lower than controls and %MVIC showed a trend toward being greater in the hemiparetic group compared to the control group. Changes in muscle activation were differentially related to changes in reaching performance. Given that stroke is one of the leading causes of persistent physical disability, it is important to understand how the ability to activate muscles changes during the early phases of recovery after injury.
Because our subjects were recruited acutely and because they showed considerable recovery by the subacute time point (see Table 1), our sample may represent a subgroup of people with hemiparesis that are under-represented in typical studies of chronic hemiparetic movement control due to their mild residual motor deficits by this time. The acute time point (average of 8.7 days post stroke) is presumably the time before which patients have learned, or been taught, to compensate for their movement deficits and presumably when the lesion and its surrounds are undergoing plastic and/or degenerative changes due to the injury (for review (Nudo et al. 2001; Cramer and Bastings 2000). The alterations in muscle activation observed in our hemiparetic subjects at the acute phase likely reflect the changes in the descending excitatory drive associated with the recent insult to the descending motor system (see Introduction). In general, these alterations in muscle activation were present in our hemiparetic subjects regardless of lesion location, initial level of motor severity, or time since stroke at initial assessment. By the subacute phase after stroke, we saw improvements in the timing, modulation, and relative activation of the muscle during reaching such that only the modulation ratio differed between the hemiparetic and control groups. These findings suggest that there was some but not complete improvement in volitional activation of muscle, potentially by spared corticospinal fibers as well as by other descending pathways.
While muscle onset times were delayed in the hemiparetic group, the prime movers of the reaching task (anterior deltoid and biceps brachii) were activated prior to the start of movement, presumably to initiate the reach. In contrast, muscle onset times of the wrist extensors and flexors occurred after the start of movement at the acute time point (e.g., positive muscle onset times in Figure 2). The delay in muscle onset times for wrist extensors and flexors may reflect greater deficits in the neural control of the distal upper extremity musculature, where the influence of the corticospinal system is the greatest (Turton and Lemon 1999; Palmer and Ashby 1992; Colebatch and Gandevia 1989).
The modulation ratio was used to quantify the initial ability to quickly activate muscles used for reaching. Control subjects increased muscle activity of the prime movers (anterior deltoid and biceps brachii) during reaching such that there was a 20 fold increase above resting levels. Hemiparetic subjects also increased muscle activity during reaching, but the magnitude of the increase was considerably less at both time points. The lower modulation ratios observed in our hemiparetic group reflect the diminished ability to activate the muscles rapidly, previously seen in patients with chronic hemiparesis (Lum et al. 2004).
The relative level of muscle activation (%MVIC) was used to quantify the effort required to perform the reach (McCrea et al. 2005). Executing the reach in our control subjects required minimal effort (1-2% of %MVIC) from upper extremity muscles. If individuals need to execute hundreds of reach movements throughout a typical day, then it is critical that each repetition of the movement requires only a minimal proportion of overall muscle capacity. Execution of the reach was more effortful in our hemiparetic subjects, such that %MVIC ranged from 4-20% during the acute phase, and from 4-10% by the subacute phase after stroke. While there are limitations in MVIC testing in subjects with hemiparesis (e.g., the potential influence of pathological synergistic muscle activation on MVIC values) we believe the maximal EMG values recorded during MVIC testing were representative of the maximal volitional muscle effort on that day, since none of our subjects demonstrated greater EMG peaks during the reaching task than during MVIC. The increased effort during reaching seen at the acute and subacute time points are consistent with reports of increased effort in subjects with chronic hemiparesis performing isometric (Tang and Rymer 1981) and reaching tasks (McCrea et al. 2005).
One proposed mechanism for this increased effort during movement is the recruitment of additional motor units to compensate for decreased motor unit firing rates that may be present in paretic muscle (Bourbonnais and Vanden Noven 1989). If this is the mechanism that is operating in our subjects, then the reduction in the relative level of muscle activation from the acute to the subacute phase after stroke may reflect a return to a more efficient activation of agonist muscles (e.g., a smaller number of motor units rate modulated to meet the demands of the motor task). The fact that we observed improvements in muscle activation and modulation in conjunction with the reduction in the relative level of muscle activation, and that the relative activations of all 3 agonist muscles were correlated to improvements in the reach path ratio (a measure of reach efficiency), suggests that enhanced muscle activation may lead to improved efficiency of reach. Despite the considerable reduction in %MVIC in the hemiparetic group at the subacute phase after stroke, some hemiparetic subjects continued to use up to 10 times greater %MVIC than controls. This persistent motor deficit could eventually lead to limited upper extremity use in hemiparetic subjects since the greater amount of effort required to perform UE movement against gravity during activities of daily living might lead to undo fatigue or compensatory muscle recruitment and movement patterns (McCrea et al. 2005).
Relationships between changes in muscle activation and changes in reaching performance (Table 6) allow us to explore how different characteristics of muscle activation may influence different characteristics of movement performance. The data do not allow for judgments on which muscle activation characteristic is most important for successful motor performance but they do suggest that the relationships between changes in specific muscle activation characteristics and improvements in reaching performance differ depending on the specific aspect of motor performance being investigated (e.g. speed vs. accuracy). Improvements in muscle onset time were generally associated with improvements in movement time and peak wrist velocity during reaching. For example, hemiparetic subjects that had large improvements in muscle onset times of the anterior deltoid had large decreases in movement time. These findings indicate that improvements in temporal activation of paretic muscle underlie improvements in the temporal characteristics of purposeful movement. Improvements in modulation of muscle activation, which were incomplete since the hemiparetic group continued to demonstrate impaired modulation compared to the control group at the subacute phase, were not strongly related to improvements in reaching performance. Improvements (decreases) in the %MVIC used during reaching were generally associated with improvements in reach path ratio. It remains to be determined if the reductions in the relative effort (e.g., decreased %MVIC) underlie improvements in efficiency of reaching or if improvements in efficiency underlie the reductions in relative effort. Changes in wrist extensor EMG variables and anterior deltoid EMG variables were more often related to changes in reaching performance characteristics compared to changes in biceps EMG variables. This is noteworthy, especially in light of the fact that motor control after hemiparesis has often been studied in the past by looking at biceps EMG activity during single joint movements at the elbow (Tang and Rymer 1981; Sahrmann and Norton 1977; Canning et al. 2000; Fellows et al. 1994; Fellows et al. 1994). Additional research is needed to further investigate if these relationships change from the subacute to chronic phase after stroke as well as if these relationships are present in subjects with more severe hemiparesis.
There was greater between-subject variability for muscle onset times and %MVIC during reaching in the hemiparetic group as compared to controls. This variability was preserved in subgroup analyses. For example, the variability of muscle onset times was up to 10 times greater in the hemiparetic group as compared to the control group (Figure 2). This variability is consistent with previous reports of increased variability in volitional muscle activation during UE motor tasks in subjects with chronic hemiparesis (Canning et al. 2000; Chae et al. 2002a) and reflects the diverse presence and magnitude of muscle activation impairment in subjects with post-stroke hemiparesis. In light of the large between-subject variability in the hemiparetic group, caution should be taken when interpreting the present results with respect to individual persons with post-stroke hemiparesis, as the overall group results may not adequately represent the presence and magnitude of muscle activation impairment of each subject with post-stroke hemiparesis.
In sum, our data show that improvements in muscle timing and decreases in the relative level of volitional activation may underlie improved reaching performance in the early months after stroke. We hypothesize that these improvements in muscle activation may be driven by both recovery of spared components of the corticospinal system (i.e. resolution of diaschisis (Seitz et al. 1999) and by compensatory control provided by descending motor pathways other than the crossed corticospinal system (Turton et al. 1996). Our data can now serve as a reference point for future studies investigating how novel rehabilitation strategies may or may not alter the recovery of volitional muscle activation.
Parts of this work have been reported previously in abstract form at the Society for Neuroscience Annual Meeting, Washington, DC, 2005.
Acknowledgements
This work was supported by NIH NS41261, HD047669, James S. McDonnell Foundation 21002032, and the Foundation for Physical Therapy Promotion of Doctoral Studies Scholarship. We thank participants and the therapists who assisted with recruitment and scheduling during this project.
Footnotes
Publisher's Disclaimer: This is a PDF file of an unedited manuscript that has been accepted for publication. As a service to our customers we are providing this early version of the manuscript. The manuscript will undergo copyediting, typesetting, and review of the resulting proof before it is published in its final citable form. Please note that during the production process errors may be discovered which could affect the content, and all legal disclaimers that apply to the journal pertain.
Reference List
- Archambault P, Pigeon P, Feldman AG, Levin MF. Recruitment and sequencing of different degrees of freedom during pointing movements involving the trunk in healthy and hemiparetic subjects. Exp.Brain Res. 1999;126:55–67. doi: 10.1007/s002210050716. [DOI] [PubMed] [Google Scholar]
- Bastian AJ, Martin TA, Keating JG, Thach WT. Cerebellar ataxia: abnormal control of interaction torques across multiple joints. J.Neurophysiol. 1996;76:492–509. doi: 10.1152/jn.1996.76.1.492. [DOI] [PubMed] [Google Scholar]
- Boissy P, Bourbonnais D, Carlotti MM, Gravel D, Arsenault BA. Maximal grip force in chronic stroke subjects and its relationship to global upper extremity function. Clin.Rehabil. 1999;13:354–362. doi: 10.1191/026921599676433080. [DOI] [PubMed] [Google Scholar]
- Bourbonnais D, Vanden Noven S. Weakness in patients with hemiparesis. Am.J.Occup.Ther. 1989;43:313–319. doi: 10.5014/ajot.43.5.313. [DOI] [PubMed] [Google Scholar]
- Burleigh A, Horak F. Influence of instruction, prediction, and afferent sensory information on the postural organization of step initiation. J.Neurophysiol. 1996;75:1619–1628. doi: 10.1152/jn.1996.75.4.1619. [DOI] [PubMed] [Google Scholar]
- Canning CG, Ada L, Adams R, O'Dwyer NJ. Loss of strength contributes more to physical disability after stroke than loss of dexterity. Clin.Rehabil. 2004;18:300–308. doi: 10.1191/0269215504cr715oa. [DOI] [PubMed] [Google Scholar]
- Canning CG, Ada L, O'Dwyer NJ. Abnormal muscle activation characteristics associated with loss of dexterity after stroke. J.Neurol.Sci. 2000;176:45–56. doi: 10.1016/s0022-510x(00)00305-1. [DOI] [PubMed] [Google Scholar]
- Chae J, Yang G, Park BK, Labatia I. Delay in initiation and termination of muscle contraction, motor impairment, and physical disability in upper limb hemiparesis. Muscle Nerve. 2002a;25:568–575. doi: 10.1002/mus.10061. [DOI] [PubMed] [Google Scholar]
- Chae J, Yang G, Park BK, Labatia I. Muscle weakness and cocontraction in upper limb hemiparesis: relationship to motor impairment and physical disability. Neurorehabil.Neural Repair. 2002b;16:241–248. doi: 10.1177/154596830201600303. [DOI] [PubMed] [Google Scholar]
- Cirstea MC, Levin MF. Compensatory strategies for reaching in stroke. Brain. 2000;123(Pt 5):940–953. doi: 10.1093/brain/123.5.940. [DOI] [PubMed] [Google Scholar]
- Colebatch JG, Gandevia SC. The distribution of muscular weakness in upper motor neuron lesions affecting the arm. Brain. 1989;112(Pt 3):749–763. doi: 10.1093/brain/112.3.749. [DOI] [PubMed] [Google Scholar]
- Colebatch JG, Gandevia SC, Spira PJ. Voluntary muscle strength in hemiparesis: distribution of weakness at the elbow. J.Neurol.Neurosurg.Psychiatry. 1986;49:1019–1024. doi: 10.1136/jnnp.49.9.1019. [DOI] [PMC free article] [PubMed] [Google Scholar]
- Cramer SC, Bastings EP. Mapping clinically relevant plasticity after stroke. Neuropharmacology. 2000;39:842–851. doi: 10.1016/s0028-3908(99)00258-0. [DOI] [PubMed] [Google Scholar]
- Dietz V, Ketelsen UP, Berger W, Quintern J. Motor unit involvement in spastic paresis. Relationship between leg muscle activation and histochemistry. J.Neurol.Sci. 1986;75:89–103. doi: 10.1016/0022-510x(86)90052-3. [DOI] [PubMed] [Google Scholar]
- Duncan PW, Lai SM, Keighley J. Defining post-stroke recovery: implications for design and interpretation of drug trials. Neuropharmacology. 2000;39:835–841. doi: 10.1016/s0028-3908(00)00003-4. [DOI] [PubMed] [Google Scholar]
- Fellows SJ, Kaus C, Ross HF, Thilmann AF. Agonist and antagonist EMG activation during isometric torque development at the elbow in spastic hemiparesis. Electroencephalogr.Clin.Neurophysiol. 1994;93:106–112. doi: 10.1016/0168-5597(94)90073-6. [DOI] [PubMed] [Google Scholar]
- Flash T, Hogan N. The coordination of arm movements: an experimentally confirmed mathematical model. J.Neurosci. 1985;5:1688–1703. doi: 10.1523/JNEUROSCI.05-07-01688.1985. [DOI] [PMC free article] [PubMed] [Google Scholar]
- Frontera WR, Grimby L, Larsson L. Firing rate of the lower motoneuron and contractile properties of its muscle fibers after upper motoneuron lesion in man. Muscle Nerve. 1997;20:938–947. doi: 10.1002/(sici)1097-4598(199708)20:8<938::aid-mus2>3.0.co;2-7. [DOI] [PubMed] [Google Scholar]
- Gemperline JJ, Allen S, Walk D, Rymer WZ. Characteristics of motor unit discharge in subjects with hemiparesis. Muscle Nerve. 1995;18:1101–1114. doi: 10.1002/mus.880181006. [DOI] [PubMed] [Google Scholar]
- Gowland C, deBruin H, Basmajian JV, Plews N, Burcea I. Agonist and antagonist activity during voluntary upper-limb movement in patients with stroke. Phys.Ther. 1992;72:624–633. doi: 10.1093/ptj/72.9.624. [DOI] [PubMed] [Google Scholar]
- Grimbly L, Hannerz J, Ranlund T. Disturbances in the voluntary recruitment order of anterior tibial motor units in spastic paraparesis upon fatigue. J.Neurol.Neurosurg.Psychiatry. 1972;37:40–46. doi: 10.1136/jnnp.37.1.40. [DOI] [PMC free article] [PubMed] [Google Scholar]
- Hammond MC, Fitts SS, Kraft GH, Nutter PB, Trotter MJ, Robinson LM. Co-contraction in the hemiparetic forearm: quantitative EMG evaluation. Arch.Phys.Med Rehabil. 1988;69:348–351. [PubMed] [Google Scholar]
- Heller A, Wade DT, Wood VA, Sunderland A, Hewer RL, Ward E. Arm function after stroke: measurement and recovery over the first three months. J.Neurol.Neurosurg.Psychiatry. 1987;50:714–719. doi: 10.1136/jnnp.50.6.714. [DOI] [PMC free article] [PubMed] [Google Scholar]
- Jorgensen HS, Nakayama H, Raaschou HO, Vive-Larsen J, Stoier M, Olsen TS. Outcome and time course of recovery in stroke. Part II: Time course of recovery. The Copenhagen Stroke Study. Arch.Phys.Med Rehabil. 1995;76:406–412. doi: 10.1016/s0003-9993(95)80568-0. [DOI] [PubMed] [Google Scholar]
- Kamper DG, McKenna-Cole AN, Kahn LE, Reinkensmeyer DJ. Alterations in reaching after stroke and their relation to movement direction and impairment severity. Arch.Phys.Med.Rehabil. 2002;83:702–707. doi: 10.1053/apmr.2002.32446. [DOI] [PubMed] [Google Scholar]
- Kamper DG, Rymer WZ. Impairment of voluntary control of finger motion following stroke: role of inappropriate muscle coactivation. Muscle Nerve. 2001;24:673–681. doi: 10.1002/mus.1054. [DOI] [PubMed] [Google Scholar]
- Kendall F, McCreary EK. Muscles testing and function. Williams and Wilkins; Baltimore: 1983. [Google Scholar]
- Lang CE, Bastian AJ. Cerebellar subjects show impaired adaptation of anticipatory EMG during catching. J.Neurophysiol. 1999;82:2108–2119. doi: 10.1152/jn.1999.82.5.2108. [DOI] [PubMed] [Google Scholar]
- Lang CE, Schieber MH. Differential impairment of individuated finger movements in humans after damage to the motor cortex or the corticospinal tract. J.Neurophysiol. 2003;90:1160–1170. doi: 10.1152/jn.00130.2003. [DOI] [PubMed] [Google Scholar]
- Lang CE, Schieber MH. Reduced muscle selectivity during individuated finger movements in humans after damage to the motor cortex or corticospinal tract. J.Neurophysiol. 2004;91:1722–1733. doi: 10.1152/jn.00805.2003. [DOI] [PubMed] [Google Scholar]
- Lang CE, Wagner JM, Bastian AJ, et al. Deficits in grasp versus reach during acute hemiparesis. Exp.Brain Res. 2005;166:126–136. doi: 10.1007/s00221-005-2350-6. [DOI] [PubMed] [Google Scholar]
- Levin MF. Interjoint coordination during pointing movements is disrupted in spastic hemiparesis. Brain. 1996;119(Pt 1):281–293. doi: 10.1093/brain/119.1.281. [DOI] [PubMed] [Google Scholar]
- Lum PS, Patten C, Kothari D, Yap R. Effects of velocity on maximal torque production in poststroke hemiparesis. Muscle Nerve. 2004;30:732–742. doi: 10.1002/mus.20157. [DOI] [PubMed] [Google Scholar]
- McComas AJ, Sica RE, Upton AR, Aguilera N. Functional changes in motoneurones of hemiparetic patients. J.Neurol.Neurosurg.Psychiatry. 1973;36:183–193. doi: 10.1136/jnnp.36.2.183. [DOI] [PMC free article] [PubMed] [Google Scholar]
- McCrea PH, Eng JJ, Hodgson AJ. Saturated muscle activation contributes to compensatory reaching strategies following stroke. J.Neurophysiol. 2005 doi: 10.1152/jn.00732.2004. [DOI] [PMC free article] [PubMed] [Google Scholar]
- Mercier C, Bourbonnais D. Relative shoulder flexor and handgrip strength is related to upper limb function after stroke. Clin.Rehabil. 2004;18:215–221. doi: 10.1191/0269215504cr724oa. [DOI] [PubMed] [Google Scholar]
- Nudo RJ, Plautz EJ, Frost SB. Role of adaptive plasticity in recovery of function after damage to motor cortex. Muscle Nerve. 2001;24:1000–1019. doi: 10.1002/mus.1104. [DOI] [PubMed] [Google Scholar]
- Palmer E, Ashby P. Corticospinal projections to upper limb motoneurones in humans. J.Physiol. 1992;448:397–412. doi: 10.1113/jphysiol.1992.sp019048. [DOI] [PMC free article] [PubMed] [Google Scholar]
- Parker VM, Wade DT, Langton HR. Loss of arm function after stroke: measurement, frequency, and recovery. Int.Rehabil.Med. 1986;8:69–73. doi: 10.3109/03790798609166178. [DOI] [PubMed] [Google Scholar]
- Patten C, Lexell J, Brown H. Weakness and strength training in persons with poststroke hemiplegia: Rationale, method, and efficacy. Journal of Rehabilitation Research and Development. 2004;41:293–312. doi: 10.1682/jrrd.2004.03.0293. [DOI] [PubMed] [Google Scholar]
- Pineiro R, Pendlebury ST, Smith S, et al. Relating MRI changes to motor deficit after ischemic stroke by segmentation of functional motor pathways. Stroke. 2000;31:672–679. doi: 10.1161/01.str.31.3.672. [DOI] [PubMed] [Google Scholar]
- Reinkensmeyer DJ, McKenna CA, Kahn LE, Kamper DG. Directional control of reaching is preserved following mild/moderate stroke and stochastically constrained following severe stroke. Exp.Brain Res. 2002;143:525–530. doi: 10.1007/s00221-002-1055-3. [DOI] [PubMed] [Google Scholar]
- Roby-Brami A, Feydy A, Combeaud M, Biryukova EV, Bussel B, Levin MF. Motor compensation and recovery for reaching in stroke patients. Acta Neurol.Scand. 2003;107:369–381. doi: 10.1034/j.1600-0404.2003.00021.x. [DOI] [PubMed] [Google Scholar]
- Rosenfalck A, Andreassen S. Impaired regulation of force and firing pattern of single motor units in patients with spasticity. J.Neurol.Neurosurg.Psychiatry. 1980;43:907–916. doi: 10.1136/jnnp.43.10.907. [DOI] [PMC free article] [PubMed] [Google Scholar]
- Sahrmann SA, Norton BJ. The relationship of voluntary movement to spasticity in the upper motor neuron syndrome. Ann.Neurol. 1977;2:460–465. doi: 10.1002/ana.410020604. [DOI] [PubMed] [Google Scholar]
- Schneider K, Zernicke RF, Schmidt RA, Hart TJ. Changes in limb dynamics during the practice of rapid arm movements. J.Biomech. 1989;22:805–817. doi: 10.1016/0021-9290(89)90064-x. [DOI] [PubMed] [Google Scholar]
- Seitz RJ, Azari NP, Knorr U, Binkofski F, Herzog H, Freund HJ. The role of diaschisis in stroke recovery. Stroke. 1999;30:1844–1850. doi: 10.1161/01.str.30.9.1844. [DOI] [PubMed] [Google Scholar]
- Sejnowski TJ. Neurobiology. Making smooth moves. Nature. 1998;394:725–726. doi: 10.1038/29406. [DOI] [PubMed] [Google Scholar]
- Tang A, Rymer WZ. Abnormal force--EMG relations in paretic limbs of hemiparetic human subjects. J.Neurol.Neurosurg.Psychiatry. 1981;44:690–698. doi: 10.1136/jnnp.44.8.690. [DOI] [PMC free article] [PubMed] [Google Scholar]
- Thoroughman KA, Shadmehr R. Electromyographic correlates of learning an internal model of reaching movements. J.Neurosci. 1999;19:8573–8588. doi: 10.1523/JNEUROSCI.19-19-08573.1999. [DOI] [PMC free article] [PubMed] [Google Scholar]
- Trombly CA. Deficits of reaching in subjects with left hemiparesis: a pilot study. Am.J.Occup.Ther. 1992;46:887–897. doi: 10.5014/ajot.46.10.887. [DOI] [PubMed] [Google Scholar]
- Trombly CA. Observations of improvement of reaching in five subjects with left hemiparesis. J.Neurol.Neurosurg.Psychiatry. 1993;56:40–45. doi: 10.1136/jnnp.56.1.40. [DOI] [PMC free article] [PubMed] [Google Scholar]
- Turton A, Lemon RN. The contribution of fast corticospinal input to the voluntary activation of proximal muscles in normal subjects and in stroke patients. Exp.Brain Res. 1999;129:559–572. doi: 10.1007/s002210050926. [DOI] [PubMed] [Google Scholar]
- Turton A, Wroe S, Trepte N, Fraser C, Lemon RN. Contralateral and ipsilateral EMG responses to transcranial magnetic stimulation during recovery of arm and hand function after stroke. Electroencephalogr.Clin.Neurophysiol. 1996;101:316–328. doi: 10.1016/0924-980x(96)95560-5. [DOI] [PubMed] [Google Scholar]
- Twitchell TE. The restoration of motor function following hemiplegia in man. Brain. 1951;74:443–480. doi: 10.1093/brain/74.4.443. [DOI] [PubMed] [Google Scholar]
- Uno Y, Kawato M, Suzuki R. Formation and control of optimal trajectory in human multijoint arm movement. Minimum torque-change model. Biol.Cybern. 1989;61:89–101. doi: 10.1007/BF00204593. [DOI] [PubMed] [Google Scholar]
- Vono J, Hobart D. Kinematic and myoelectric analysis of skill acquisition: I. 90 cm subject group. Arch.Phys.Med Rehabil. 1981;62:575–582. [PubMed] [Google Scholar]
- Wade DT, Langton-Hewer R, Wood VA, Skilbeck CE, Ismail HM. The hemiplegic arm after stroke: measurement and recovery. J.Neurol.Neurosurg.Psychiatry. 1983;46:521–524. doi: 10.1136/jnnp.46.6.521. [DOI] [PMC free article] [PubMed] [Google Scholar]
- Wagner JM, Lang CE, Sahrmann SA, et al. Relationships between Sensorimotor Impairments and Reaching Deficits in Acute Hemiparesis. Neurorehabil.Neural Repair. 2006;20:406–416. doi: 10.1177/1545968306286957. [DOI] [PubMed] [Google Scholar]
- Ward NS, Newton JM, Swayne OB, et al. Motor system activation after subcortical stroke depends on corticospinal system integrity. Brain. 2006;129:809–819. doi: 10.1093/brain/awl002. [DOI] [PMC free article] [PubMed] [Google Scholar]