

Abstract
A novel procedure for initiation of voluntary ethanol consumption in the rat was evaluated in terms of ease of initiation, consistency, and resulting brain ethanol levels. The “jello shot” consists of 10% ethanol in gelatin along with a caloric source (Polycose). Initiation of “jello shot” consumption in Sprague-Dawley rats required no food or water restriction and resulted in initial daily (8.4±0.6 g/kg body weight) and eventual hourly (1.1±0.1 g/kg body weight) intake of ethanol comparable to other procedures using either alcohol-preferring or non-genetically selected rats. Rat intake of ethanol via “jello shots” recovered quickly from environmental alterations and surgical implantation of a guide cannula. During 1-hr free access sessions, consumption of the “jello shot” occurred during the initial 10 minutes and resulted in a dose-related increase in ethanol levels in nucleus accumbens measured using microdialysis. These brain ethanol levels were comparable to those achieved using other self-administration methods. However, when 0.5 g/kg ethanol was gavaged either in “jello shot” or saline, there was about a 20% decrease in brain ethanol concentrations after gavage of the “jello shot” compared to saline. Even so, lack of a need for initial food or water deprivation and the rapidity with which stable self-administration can be achieved both suggest utility of the “jello shot” as a completely voluntary ethanol procedure.
Keywords: ethanol self-administration, water deprivation, nucleus accumbens, gelatin, Polycose
Alcohol ranks second only to tobacco in terms of the magnitude of adverse public health consequences of its abuse. It is important to develop animal models that emulate conditions of human abuse in order to study neural mechanisms implicated in the etiology of alcoholism. Animal models of alcoholism usually induce animals to drink sufficient quantities of ethanol by initial temporary food or water restriction to encourage rats to partake of unfamiliar tastes. For example, Czachowski et al. (1999) initiates ethanol consumption by providing the 10% ethanol solution as the only available fluid for three days before operant training. Additionally, the fluid received as a result of barpressing is the only fluid available during the first 5–7 days of operant training. Even when sucrose or saccharin is added to the ethanol solution to provide additional reinforcement, rats still need to be initially water deprived in order to encourage them to consume the novel sweet taste (reviewed in Samson & Czachowski 2004). Another complicating factor is that the sweetener used to increase amounts of ethanol self-administration can change ethanol absorption either by decreasing gastric emptying time or by altering ethanol metabolism such that equivalent blood or brain ethanol levels are not achieved (Mathews et al., 2001; Roberts et al, 1999). A recently described procedure (Rowland et. al., 2005) used an ethanol-containing gelatin (10% ethanol, 10% Polycose®, 0.25% gelatin, w/w) to induce robust and reliable self-administration without the need for initial food or water restriction. This easily prepared and stored vehicle for ethanol administration also appears to remain stable over time in terms of ethanol content. In the present studies, we investigate the ability of this “jello shot” procedure to produce brain ethanol levels comparable to liquid ethanol procedures.
Methods
Animals and housing
Female Sprague-Dawley rats obtained from Harlan (Indianapolis, IN) initially weighing 253±3 g were housed individually in polycarbonate cages with Sani Chips (Harlan) bedding. They were not monitored for estrous cyclicity. They were housed in a vivarium with a reverse 12:12 light dark cycle (lights off @ 0800) and an ambient temperature maintained at 23±2 °C. Purina 5001 Rodent Chow and water was available ad libitum at all times. Rats were randomly divided into two groups for use in “jello shot” self-administration or gavage experiments and weighed at least once a week. The experimental protocol was approved by the University of Florida Institutional Animal Care and Use Committee and the procedures were in compliance with the National Institute of Health Guide for Care and Use of Laboratory Animals (Publication No. 85-23, revised 1985).
Ethanol Treatment
The “jello shots” were made from 10% ethanol (w/w), 10% Polycose® (Abbott Laboratories, Abbott Park, IL) and 0.25% gelatin (Knox brand, Kraft Foods, Northfield, IL) in water, and solidified overnight in a refrigerator in small glass jars. Under refrigerated and sealed conditions, ethanol levels in the gelatin remained stable at 10% for at least one week. Additionally, we determined that ethanol content of the jars did not decrease significantly when left open at room temperature for up to three hours. After 24 hrs, opened at room temperature, the top layer of gel would lose approximately 30% of ethanol content.
In the first group of rats, the jars were suspended in holders from the sides of the cage (see figure 1) for 24 hrs for the first two days of exposure, then for 6 hrs for two days, then 3 hrs for two days and finally for 1 hr for about 2 weeks (see figure 2). This one-hour free access period occurred between 10 AM and noon each day, including weekends. The jars were weighed prior to and after the allotted period of time in the cage and the difference was calculated. Cages and jars were inspected for evidence of spillage or contamination but evidence for this was negligible. To estimate individual ethanol doses, g of “jello shot” consumed was transformed into g of ethanol/kg body weight.
Figure 1.
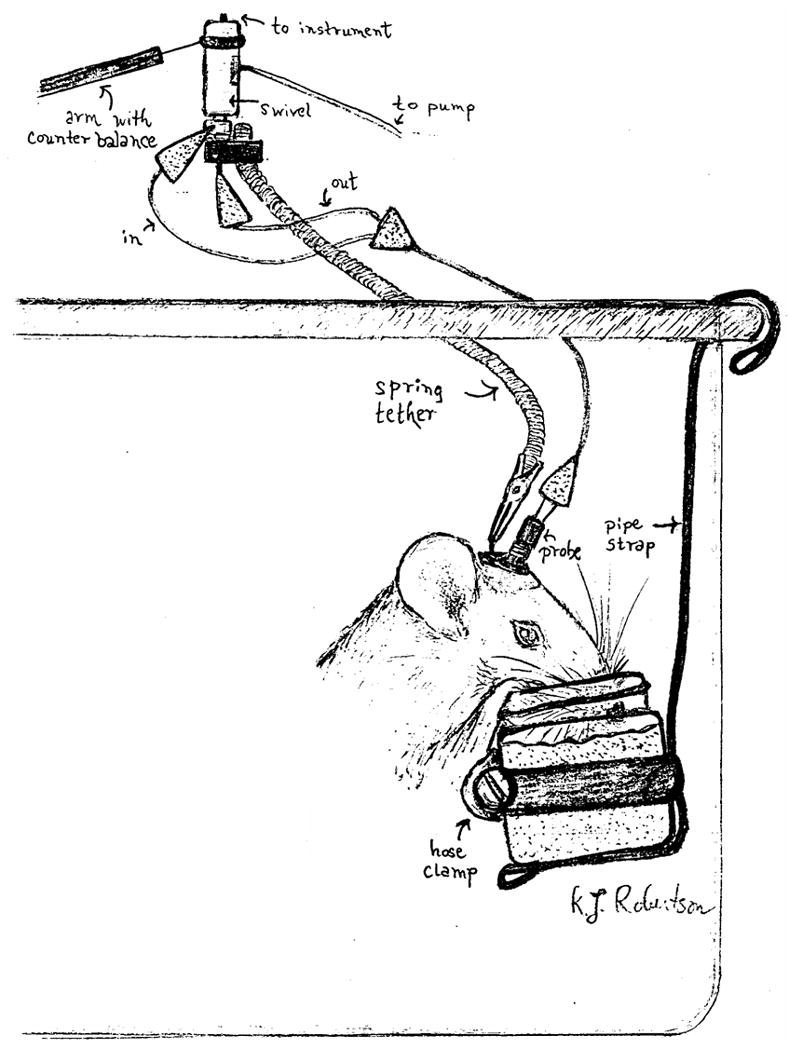
A graphic representation of the “jello shot” procedure.
Figure 2.
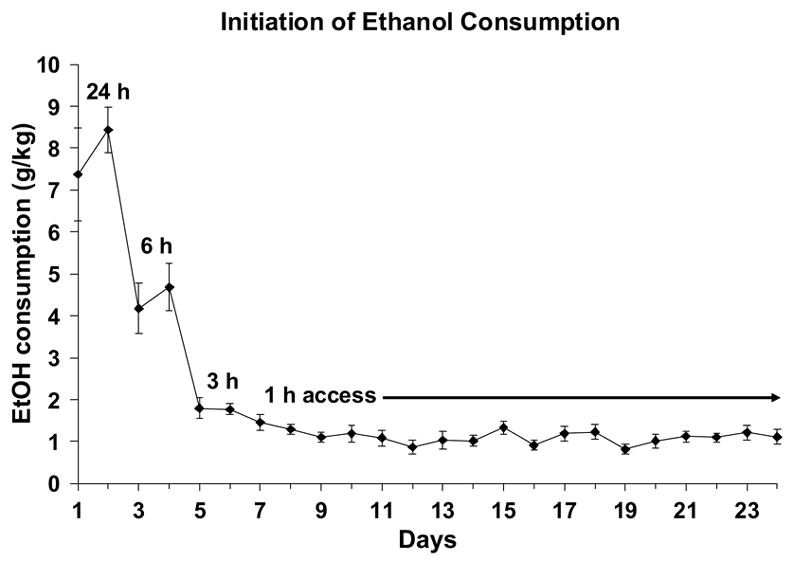
Rats received free access to 10% ethanol in Polycose gelatin for 24 hrs on the first and second days, 6 hrs on the third and fourth days, 3 hrs on the fifth and sixth days and 1 hour on all subsequent days. Stable levels of self-administration were achieved within a few days that remained stable for at least three weeks. Shown are means±SEMs for N = 14.
At least one week prior to surgery to implant guide cannulas, each rat was accustomed to eating the “jello shot” under microdialysis conditions (designated rl1, rl2, rl3 etc in Figure 3). This consisted of removing the rat’s cage from the housing rack and placing it on a table in the vivarium next to two other rat-occupied cages and with a red light shining on it. An experimenter was seated nearby and tapped lightly on the cage every 10 minutes to accustom the rats to periodic mild disturbances. After 2 hrs, animals were given 1-hr free access to the “jello shot”. They were then returned to their regular housing rack. This adaptation procedure occurred daily until surgery. Rats did not receive “jello shot” access on the day of surgery. After surgery, each rat was allowed to recover for 2 additional days before daily ethanol access was restarted under microdialysis conditions as described above except that rats were also tethered to a swivel in the top of the cage by a spring attached to a clip embedded in the dental cement on their skulls. Habituation to the tethering procedure continued for at least five daily sessions (indicated by ps1, ps2 etc in Figure 3). The dialysis experiment occurred 7–11 days after surgery only when levels of consumption had stabilized.
Figure 3.
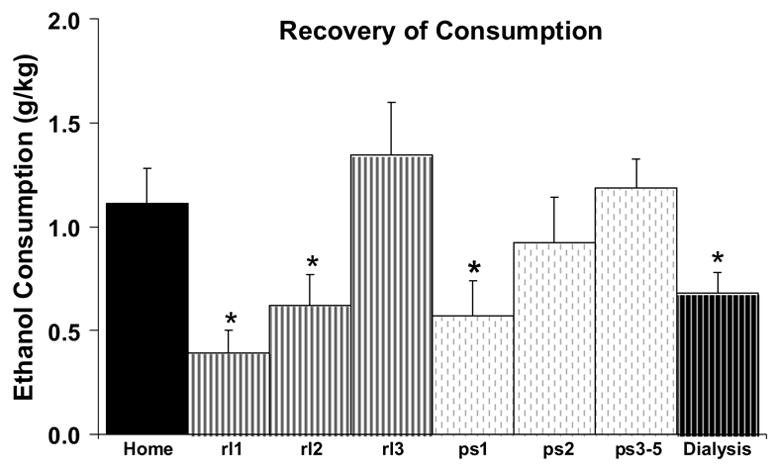
Mean ethanol consumption (on each of nine days) after environmental and surgical disruption. “Home” indicates mean consumption for the 2 days preceding the first day of ethanol access in the microdialysis cage. “rl1, rl2, rl3” indicates mean consumption on each of the first three days when “jello shot” was administered under microdialysis conditions. “ps1, ps2 and ps3–5” indicates consumption during successive “jello shot” access days after guide cannula surgery when rats were tethered to a swivel. “Dialysis” indicates mean consumption during the microdialysis experiment. Shown are means±SEMs for N = 14.
A second group of female rats (ethanol-naïve) had no prior exposure to ethanol or habituation to the test procedure although they were weighed weekly and handled on a daily basis.
Surgery and Microdialysis
On the day of surgery, each rat was anesthetized with ketamine/xylazine (87 and 13 mg/kg respectively) and placed in a stereotaxic apparatus for surgical implantation of a unilateral guide cannula (21 gauge 8mm long; Plastics One, Roanoke, VA). Cannulae were implanted to end within 1 mm above the NAc using the following flat skull coordinates from bregma: +1.6 anterior, +1.7 lateral, −6.2 ventral. The guide cannula was secured to the skull with dental cement anchored by two stainless steel screws.
Microdialysis probes (o.d. 270 μm; active length 2 mm; cellulose membrane, 13,000 MWCO) were constructed by the method of Pettit and Justice (1991). The probe was connected to a single channel swivel (Instech, Plymouth Meeting, PA) and perfused with artificial cerebrospinal fluid (aCSF; 145 mM NaCl, 2.8 mM KCl, 1.2 mM MgCl2, 1.2 mM CaCl2, 1.55 mM Na2HPO4, 0.45 mM NaH2PO4, pH 7.4) at 1 μl/min (Harvard Apparatus, South Nattick MA). Recovery of ethanol by each dialysis probe was determined at the start of each experiment, before probe implantation, by immersing the probe in 10 mM ethanol in aCSF (see below). After this, the dialysis probe was inserted into the guide cannula while the rat was briefly sedated with halothane.
In the rats trained to self-administer ethanol via the “jello shot” technique, one 10-min basal dialysate sample was collected 2 hr after probe implantation followed by the 1-hr gelatin access period during which 6 dialysate samples were taken. An additional 6–12 samples were taken after ethanol was removed. The behavior of the animal during the 1-hr access period of the microdialysis experiment was observed to allow for analysis of the time course of consumption. Each 30-s interval was scored as a “1” if the animal displayed ingestive behavior (licking, nibbling of gelatin) at any time within that interval, or as a “0” otherwise. Scores were averaged within each 5-min period of gelatin access for each rat.
The ethanol-naïve rats received ethanol via intragastric gavage during the microdialysis experiment. Two hrs after probe insertion and immediately after the basal sample was taken, ethanol (0.5 g/kg) was gavaged in either water or in the gelatin vehicle and microdialysis samples were collected as described above. Each rat received both treatments, in a counterbalanced fashion, at least 3 hrs apart after brain ethanol had reached undetectable levels for at least 60 minutes.
Ethanol Assay
The ethanol content of each dialysate sample was determined by the alcohol dehydrogenase assay (see Kristoffersen & Smith-Kielland 2005) adapted for small volume microdialysate samples. Dialysate samples (10 μl) were stored in 100 μl 0.6 M glycine buffer (pH 9.2) on ice until all samples were collected. A standard curve was prepared containing 10 μl of 0, 0.32, 0.63, 1.25, 2.5, 5, 10 and 20 mM ethanol added to 100 μl glycine buffer both before and after sample collection, to ensure that ethanol evaporation was minimal during the 3–4 hr dialysis experiment. After all samples were collected, 100 μl of enzyme solution (0.88 mg NAD and 0.29 mg ADH per ml of 0.6 M glycine buffer) were added to each sample and then all samples were incubated at 37°C in a shaking water bath for 20 minutes. Samples were then kept on ice for at least 5 minutes, before transfer to a 96-well plate (Costar, Corning NY) on ice. Absorbance was read at 340 nm using a Synergy HT platereader (Bio-Tek, Winooski VT). Absorbance was converted to mM ethanol by the use of a polynomial equation since at these low volumes and concentrations, the standard curve was not linear. Fits were generally better than R2 = 0.98, and there was less than 10% error when the absorbance of standard curve values were recalculated back to mM concentrations.
Probe calibrations
Prior to implantation of each probe into an animal’s guide cannula, extraction efficiency of that probe was determined by measuring the amount of ethanol in two 10-min dialysate samples when the probe was placed in a 10 mM ethanol solution stirred at 37°C. The extraction efficiency was the ratio of the dialysate concentration and the actual concentration of the 10 mM standard. All subsequent in vivo dialysate samples were corrected by dividing the measured concentration by the extraction efficiency.
In separate experiments (N = 6), we determined the appropriateness of this in vitro calibration method by comparing extraction efficiency using different concentration of ethanol standards (1.25, 2.5, 5, 10 and 20 mM). The data were plotted as ethanol gain to probe versus outside solution concentration and the slope of this line was called the Ed for diffusion into the probe under in vitro conditions. Similarly, in separate experiments (N=6) we determined the Ed for diffusion of ethanol out of the probe, both in vivo and in vitro, as described by Robinson et al (2000). An initial dialysate sample was taken while the probe was perfused with aCSF. Then the perfusate was switched to either 2.5, 5, 10, or 20 mM ethanol in aCSF. After at least 10-min equilibration time, duplicate dialysate samples were collected for 10 min each. The perfusate was then switched in a random order to another concentration. The slope obtained from linear regression of the data indicated the in vitro delivery Ed. For three of these probes, this procedure was repeated 2 hrs after the probe was inserted into a guide cannula placed in nucleus accumbens as described above. The data were plotted as ethanol loss from probe versus perfusate concentration. The slope obtained from linear regression of the data indicated the in vitro and in vivo Ed for delivery of ethanol, respectively.
Statistics
Dialysate ethanol levels in each 10-min sample were converted to mM concentration and then corrected for efficiency using the extraction efficiency determined by the in vitro calibration with a 10 mM standard. The area under the curve (AUC) was calculated for each rat by summing the mM values calculated over time. The maximal ethanol concentration (Cmax) and the time to maximal concentration (Tmax) were determined visually from the graphs of dialysate concentration over time. ANOVA or paired T-test was used to analyze changes in consumption levels (g ethanol/kg body weight) as well as resulting mM brain ethanol concentrations over time, AUC, Tmax and Cmax values. Paired T-test was used to analyze differences in Ed, AUC, Tmax and Cmax values.
Results
The day-by-day intakes of the jello shot while access was tapered from 24 to 1 hr per day are shown in Figure 2. On the first day of 24-hr access, average consumption was over 7 g/kg ethanol with only 3 out of 14 rats consuming less than 3.0 g/kg per day. On the second day of 24-hr access, no rat ate less than 3.0 g/kg per day and average consumption was increased to over 8 g/kg/day. Rats consumed progressively less ethanol as the access time per day decreased (from 24 to 6 to 3 to 1 hr) until reaching an average consumption of 1.2±0.2 g/kg ethanol during the days in which they had 1-hr access to the “jello shots”. When these data were analyzed using a one-way ANOVA, there was a significant effect of Days (F(17,221) = 49.2; p < 0.001), which was entirely due to a significant decrease in consumption during the first 8 days of jello shot access (F(7,91) = 40.9; p < 0.001). There was no significant effect of days during the last 10 days of consumption before starting the habituation procedures (F(9,117) = 1.6; NS).
When presentation of the 10% ethanol “jello shot” took place in the novel environment of the microdialysis set-up for their 1-hr gelatin access period (Figure 3), consumption was initially decreased about 60% but resumed previous levels within a couple of days. Similarly, when “jello shot” presentation was resumed in the dialysis cage post-surgery, with the addition of the tethering procedure, there was a 60% decrease in mean ethanol consumption that recovered within a few days. Even so, there was significantly lower consumption during the microdialysis experiment (Figure 3) compared to prior consumption either before surgery or on after surgery. These observations were supported by a significant effect of days (F(7,91) = 7.4; p < 0.001), which was due to significant decreases in consumption on rl1, rl2, ps1 and the day of the dialysis experiment relative to the home cage consumption. The behavioral observations for all rats during the dialysis experiment indicate that most of the gel was consumed in the first 10–15 minutes, after which the rats remained inactive for the rest of the hour (Figure 4).
Figure 4.
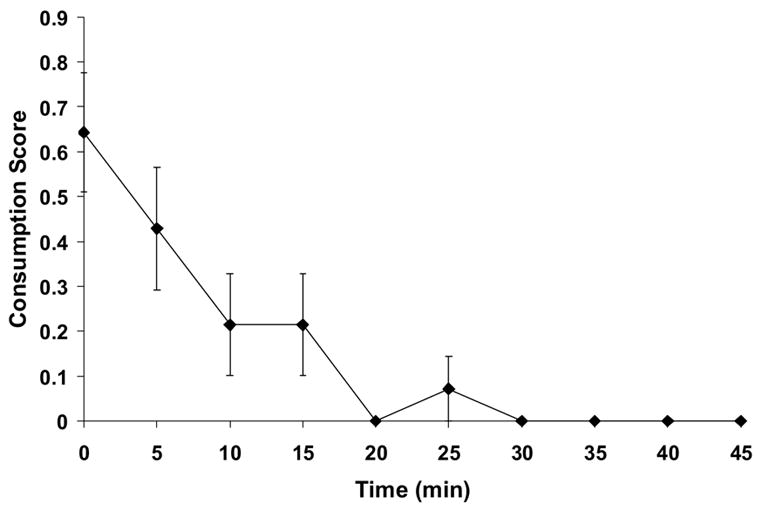
Time course of “jello shot” Consumption. Mean consumption scores during the microdialysis experiment was scored on 30-s intervals for the 60-min ethanol access period. Behavior consistent with consumption (chewing, licking) was assigned a “1” and non-ingestive behavior was assigned a “0”. Values for 10 time points (5 min) were averaged for each animal, and mean values were plotted for each 5-min interval.
Prior to each microdialysis experiment described below, extraction efficiency of the probe used in each experiment was determined in vitro using 10 mM ethanol as a standard. The average extraction efficiency for the 25 microdialysis experiments was 0.35±0.02. In separate experiments (N = 6), we determined the appropriateness of this in vitro calibration by determining Ed into and out of the probe under in vitro and in vivo conditions. We found that extraction efficiency of ethanol into the probe under in vitro conditions did not differ significantly (ranging from 0.31 to 0.40) regardless of the concentration of ethanol (1.25, 2.5, 5, 10 and 20 mM) in the tube, with no relationship between efficiency and ethanol concentration. When the data were plotted as ethanol gain to probe versus outside solution concentration (Figure 5), the slope obtained from linear regression of the data (Ed, in vitro in) was 0.35±0.04 (n = 6) which was not significantly different from the extraction efficiency calculated for the 10 mM standard. We next determined the Ed for diffusion of ethanol out of the probe, both in vivo and in vitro (Figure 5). The Ed for diffusion out of the probe under in vitro conditions (Ed in vitro out) was 0.53±0.03 (n = 6) while Ed for diffusion out of the probe under in vivo conditions (Ed in vivo out) was 0.34±0.03 (n = 3). The in vitro Ed ratio (Ed diffusionIN/Ed diffusionOUT) was 0.61±0.04, thus, the Ed values for in vitro diffusion into and out of the probe were significantly different (T-test, p < 0.01) as were the Ed values for diffusion out of the probe in vivo vs in vitro (p < 0.01). However, there was no difference in the Ed values for diffusion out of the probe under in vivo conditions and diffusion into the probe under in vitro conditions (p = 0.88).
Figure 5.
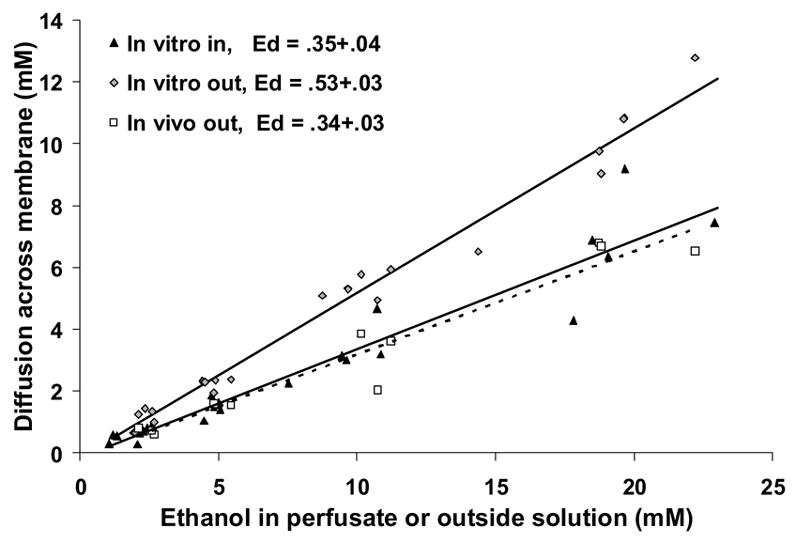
The effect of diffusion direction on ethanol Ed into and out of microdialysis probes under in vitro and in vivo conditions. The data are plotted as the diffusion of ethanol across the probe membrane versus the ethanol concentration from where it is diffusing (e.g., perfusate, outside solution). The experiment-wise slope for each condition is shown here, but individual slopes were used for statistical analyses. Diffusion direction significantly affected Ed when measured under in vitro conditions, with diffusion out of the probe higher than diffusion into the probe (p > 0.05). There was no difference between Ed into the probe in vitro (lower solid line) and Ed out of the probe in vivo (dotted line).
Brain ethanol levels during the 1-hr free access to “jello shot” are shown in Figure 6a. Based on each rat’s consumption during the dialysis experiment, rats were divided into those consuming more than 0.7 g/kg (high consumers; mean intake = 0.9±0.1 g/kg ethanol, N = 7) and less than 0.7 g/kg (low consumers; mean intake = 0.4±0.1, N = 7). The respective Cmax values were 8.2±2.1 and 3.7±0.7 mM and these occurred for both groups between 20 and 30 min after the “jello shots” were introduced into the cage. When individual AUCs were calculated, there was a significant correlation between dose and resulting brain ethanol levels (Figure 6b).
Figure 6.
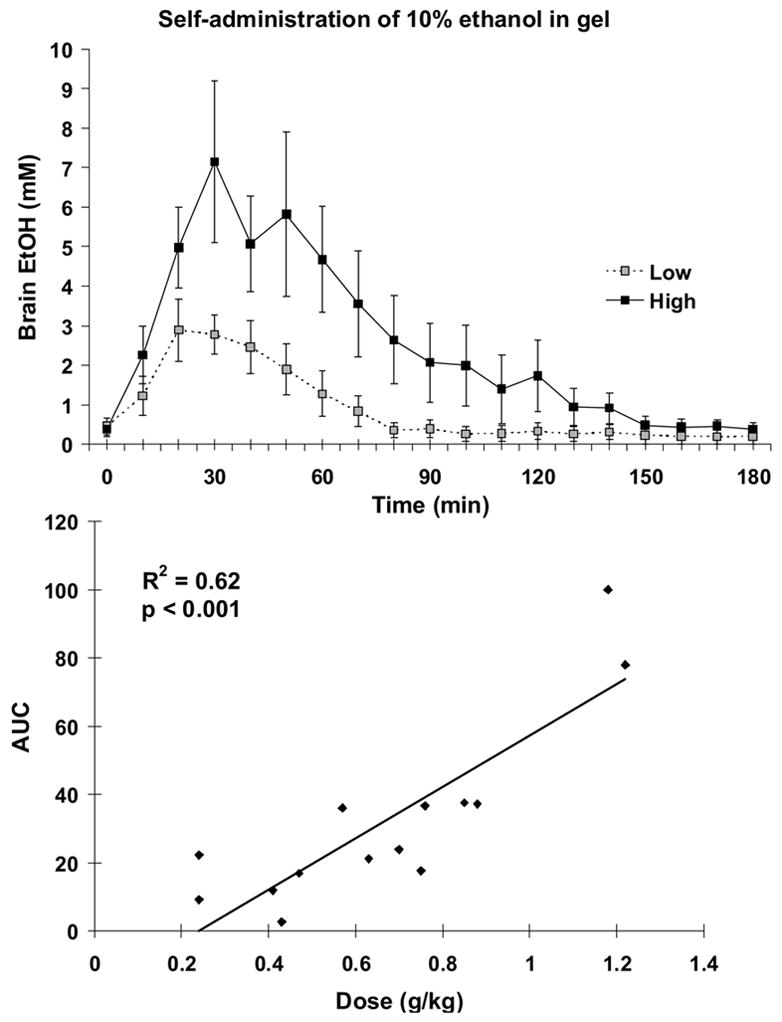
Panel A. Brain ethanol levels determined every 10 minutes during and after gelatin access. The majority of ethanol-containing gelatin was consumed within 10 minutes. For rats consuming less than 0.7 g/kg ethanol (Low; N = 7), the AUC was 16.08±4.0. For rats consuming more than 0.7 g/kg ethanol (High; N = 7), the AUC was 47.3±11.3. Panel B. There was a significant correlation between dose of ethanol consumed and AUC.
When a separate group of ethanol-naïve rats received gavage of 0.5 g/kg ethanol, (Figure 7), brain ethanol levels were lower by about 20% when the ethanol was delivered via a gelatin vehicle versus a water vehicle. ANOVA of the mM concentrations in each sample over time indicated a significant main effect of vehicle (F(1,7) = 6.3, p < 0.05) and time (F(12,84) = 49.1, p < 0.001). The AUC for ethanol in gelatin was also about 20% lower than the AUC for ethanol in water (paired T-test, p < 0.05). Cmax values were significantly decreased by about 20% (7.0±0.9 mM for gelatin vs 9.1 ± 0.9 mM for water, paired T-test, p < 0.05). There was no difference in Tmax values (26.3±2.8 min for gelatin vs 22.5±1.7 for water, paired T-test, p = 0.76).
Figure 7.
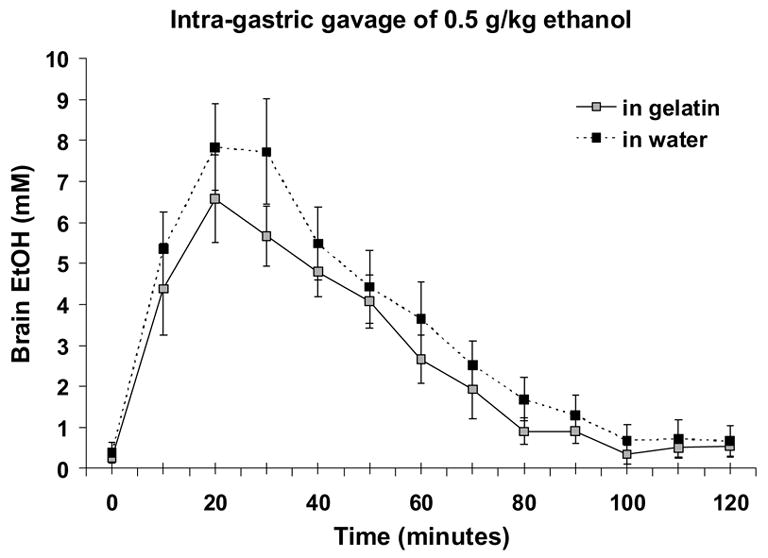
Brain ethanol levels after intragastric gavage of 0.5 g/kg ethanol either in “jello shot” or in water. Ethanol levels were decreased about 20% by the gelatin vehicle when data were analyzed over time and for calculated AUCs (gelatin = 33.5±5.8, water = 42.4±7.2). Shown are means and SEMs for N = 8.
Discussion
When a sweetener is used to increase ethanol palatability, consumption is increased in non-selected rat strains by about 1 g/kg in a short free access session (Doyon et al., 2005; Gonzales et al, 1998). However, this procedure initially requires from one to three days of water restriction to induce initial consumption of the sweetened solution (Czachowski et al., 1999). A comparable level of ethanol consumption can usually be maintained in Wistar or Long-Evans rats if the sucrose or saccharin is slowly faded out leaving only 10% ethanol in water (Bienkowski et al., 2000; Heyser et al., 2003). The ethanol consumption levels we have reported using the “jello shot” were generally higher than 1 g/kg in a 1-hr free access session but it remains to be tested whether this would remain constant if the Polycose® were removed from the gelatin vehicle.
The voluntary consumption of the “jello shot” resulted in pharmacologically relevant concentrations of ethanol into the brain that are comparable to previously published reports after similar amounts of voluntary ethanol drinking (Nurmi et al., 1999). Previous findings measuring the effect of a gavaged dose of 0.5 g/kg ethanol, indicated brain ethanol concentrations of about 12–15 mM ethanol (Quertemont et al., 2003) which is about two-fold higher than our peak dialysate ethanol concentrations after the same treatment. Both experiments used comparable methods for assessing in vitro probe recovery, although the previous study used gas chromatography to determine ethanol concentrations rather than the enzymatic assay used presently. It is possible that food availability during the dialysis experiments also differed.
The quantitative measurement of ethanol concentration in the brain using microdialysis is a complex issue requiring determination of differences between flow into and out of the probe in order to compare Ed ratios (Ed diffusionIN/Ed diffusionOUT) under both in vivo and in vitro conditions (Robinson et al., 2000). The in vitro Ed ratio in the present study was 0.61±0.04 which was less than 0.78 previously obtained by Robinson et al. (2000). The difference between these two estimates is likely due to the difference in flow rates of the probes (1 vs 2 μL/min, respectively). The Ed for diffusion out of the probe under in vivo conditions (0.34), which has been shown to be a more accurate correction factor for microdialysis estimations of extracellular concentrations of ethanol (Robinson et al., 2000; Robinson et al., 2002), was not significantly different from the Ed for delivery into the probe in vitro (which we used to correct all the values from the “jello shot” experiments). However, even using either of these correction factors, data are generally still about 30% less than what would be expected when blood ethanol levels are determined. On the other hand, using the in vivo Ed ratio is the most accurate correction factor in terms of obtaining brain ethanol levels equal to measured blood ethanol levels (Robinson et al., 2000). We did not perform experiments to determine the Ed for diffusion into the probe under in vivo conditions therefore we could not calculate the in vivo Ed. However, based on previous determinations of this ratio (Robinson et al., 2002), we expect our values to be about one third of actual brain concentrations although again, flow rate differences may alter this slightly.
The wide adoption of the sucrose fading technique (Samson 1986) has prompted questions about whether the use of a nutritive sweetener can affect ethanol metabolism. While some evidence suggests that sucrose does not significantly perturb normal ethanol metabolism (Czachowski et al., 1999), the contrary has also been observed (Matthews et al., 2001; Roberts et al., 1999). For these reasons, the possibility that resultant brain ethanol levels would be decreased by the addition of the Polycose® or gelatin was measured. There was about a 20% decrease in resulting brain ethanol concentrations when ethanol was gavaged via the “jello shot”. It is likely that both the carbohydrate and protein constituents of this vehicle delayed gastric emptying and slowed ethanol absorption, although an interaction with ethanol metabolism should not be excluded.
The “jello shot” procedure (Rowland et al., 2005) is useful in inducing reliable levels of ethanol intake in a short period of time, particularly in the Sprague-Dawley strain of rat which usually exhibit lower levels of ethanol consumption (Martinetti et al., 2006). Although the intake levels achieved may be described as only somewhat above average, they still appear to be pharmacologically relevant based on the resulting brain ethanol levels, though further study is certainly warranted. The most striking characteristic of this methodology is the ease with which animals will self-administer the “jello shots” even on the first day of exposure, requiring only about a week of training before stable consumption is achieved. This consumption is only temporarily disrupted by environmental changes or guide cannula implantation surgery. Although animals were completely habituated to the tethering apparatus used in subsequent microdialysis experiments, there was still a significant decrease in consumption of the “jello shot” on the actual day of microdialysis testing, which may have been related to probe insertion. The diet is easily made and stored, and remains stable over time especially when refrigerated. Additionally, we feel that the lack of any need for food or water restriction are attractive characteristics of the initiation procedure. This latter point is especially significant when one considers animal welfare issues. Finally, since most alcoholic beverages consumed by humans contain carbohydrates, and in some cases gelatin or other proteins, this vehicle for ethanol self-administration may more closely model human ethanol consumption since it masks aversive taste properties of the ethanol in solution (Ralevski et al., 2006).
Acknowledgments
We would like to thank Rigel Christian, Jaime Bastian, Kim Robertson and Dr. Cheryl Vaughan for technical assistance with these experiments. This work was supported by the University of Florida Brain and Spinal Cord Injury Rehabilitation Trust Fund and PHS grant AA014708.
Footnotes
Publisher's Disclaimer: This is a PDF file of an unedited manuscript that has been accepted for publication. As a service to our customers we are providing this early version of the manuscript. The manuscript will undergo copyediting, typesetting, and review of the resulting proof before it is published in its final citable form. Please note that during the production process errors may be discovered which could affect the content, and all legal disclaimers that apply to the journal pertain.
References
- Bienkowski P, Koros E, Kostowski W, Bogucka-Bonikowska A. Reinstatement of ethanol seeking in rats: Behavioral analysis. Pharmacol Biochem Behav. 2000;66:123–8. doi: 10.1016/s0091-3057(00)00194-5. [DOI] [PubMed] [Google Scholar]
- Czachowski CL, Samson HH, Denning CE. Blood ethanol concentrations in rats drinking sucrose/ethanol solutions. Alcohol Clin Exp Res. 1999;23:1331–5. [PubMed] [Google Scholar]
- Doyon WM, Anders SK, Ramachandra VS, Czachowski CL, Gonzales RA. Effect of operant self-administration of 10% ethanol plus 10% sucrose on dopamine and ethanol concentrations in the nucleus accumbens. J Neurochem. 2005;93:1469–81. doi: 10.1111/j.1471-4159.2005.03137.x. [DOI] [PubMed] [Google Scholar]
- Gonzales RA, Weiss F. Suppression of ethanol-reinforced behavior by naltrexone is associated with attenuation of the ethanol-induced increase in dialysate dopamine levels in the nucleus accumbens. J Neurosci. 1998;18:10663–71. doi: 10.1523/JNEUROSCI.18-24-10663.1998. [DOI] [PMC free article] [PubMed] [Google Scholar]
- Gonzales RA, McNabb J, Yim HJ, Ripley T, Bungay PM. Quantitative microdialysis of ethanol in rat striatum. Alcohol Clin Exp Res. 1998;22:858–67. [PubMed] [Google Scholar]
- Heyser CJ, Schulteis G, Durbin P, Koob GF. Chronic acamprosate eliminates the alcohol deprivation effect while having limited effects on baseline responding for ethanol in rats. Neuropsychopharm. 2003;18:125–33. doi: 10.1016/S0893-133X(97)00130-9. [DOI] [PubMed] [Google Scholar]
- Kristoffersen L, Smith-Kielland A. An automated alcohol dehydrogenase method for ethanol quantification in urine and whole blood. J Analytical Toxicol. 2005;29:387–9. doi: 10.1093/jat/29.5.387. [DOI] [PubMed] [Google Scholar]
- Martinetti MP, Lowery EG, Vona SR, Wichnick AM, Adler RA, Finch DG. Limited access consumption of ascending ethanol concentration in alcohol-preferring and Sprague-Dawley rats. Alcohol Clin Exp Res. 2006;30:836–843. doi: 10.1111/j.1530-0277.2006.00098.x. [DOI] [PubMed] [Google Scholar]
- Matthews DB, Overstreet DH, Rezvani AH, Devaud LL, Morrow AL. Effects of sweetened ethanol solutions on ethanol self-administration and blood ethanol levels. Pharmacol Biochem Behav. 2001;68:13–21. doi: 10.1016/s0091-3057(00)00458-5. [DOI] [PubMed] [Google Scholar]
- Nurmi M, Kiianmaa K, Sinclair JD. Brain ethanol levels after voluntary ethanol drinking in AA and Wistar rats. Alcohol. 1999;19:113–8. doi: 10.1016/s0741-8329(99)00022-1. [DOI] [PubMed] [Google Scholar]
- Pettit HO, Justice JB., Jr Effect of dose on cocaine self-administration behavior and dopamine levels in the nucleus accumbens. Brain Res. 1991;539:94–102. doi: 10.1016/0006-8993(91)90690-w. [DOI] [PubMed] [Google Scholar]
- Quertemont E, Green HL, Grant KA. Brain ethanol concentrations and ethanol discrimination in rats: effects of dose and time. Psychopharmacol. 2003;168:262–70. doi: 10.1007/s00213-003-1437-7. [DOI] [PubMed] [Google Scholar]
- Ralevski E, Gueorguieva R, Limoncelli DD, Husain R, Serrita Jane J, Petrakis I. Gelatin “shots” as a new method for alcohol administration in a laboratory setting. Alcohol Clin Exp Res. 2006;30:473–479. doi: 10.1111/j.1530-0277.2006.00064.x. [DOI] [PubMed] [Google Scholar]
- Roberts AJ, Heyser CJ, Koob GF. Operant self-administration of sweetened versus unsweetened ethanol: effects on blood alcohol levels. Alcohol Clin Exp Res. 1999;23:1151–7. [PubMed] [Google Scholar]
- Robinson DL, Lara JA, Brunner LJ, Gonzales RA. Quantification of ethanol concentrations in the extracelleular fluid of the rat brain: In vivo calibration of microdialysis probes. J Neurochem. 2000;75:1685–93. doi: 10.1046/j.1471-4159.2000.0751685.x. [DOI] [PubMed] [Google Scholar]
- Robinson DL, Brunner LJ, Gonzales RA. Effects of gender and estrous cycle on the pharmacokinetics of ethanol in the rat brain. Alcohol Clin Exp Res. 2002;26:165–72. [PubMed] [Google Scholar]
- Rowland NE, Nasrallah N, Robertson KL. Accurate caloric compensation in rats for electively consumed ethanol-beer or ethanol-polycose mixtures. Pharmacol Biochem Behav. 2005;80:109–14. doi: 10.1016/j.pbb.2004.10.010. [DOI] [PubMed] [Google Scholar]
- Samson HH. Initiation of ethanol reinforcement using a sucrose-substitution procedure in food- and water-sated rats. Alcohol Clin Exp Res. 1986;10:436–42. doi: 10.1111/j.1530-0277.1986.tb05120.x. [DOI] [PubMed] [Google Scholar]
- Samson HH, Czachowski CL. Behavioral measures of alcohol self-administration and intake control: rodent models. Intl Rev Neurobiology. 2003;54:107–43. doi: 10.1016/s0074-7742(03)54004-1. [DOI] [PubMed] [Google Scholar]
- Samson HH, Files FJ, Denning C. Chronic ethanol self-administration in a continuous-access operant situation: the use of a sucrose/ethanol solution to increase daily ethanol intake. Alcohol. 1999a;19:151–5. doi: 10.1016/s0741-8329(99)00032-4. [DOI] [PubMed] [Google Scholar]
- Samson HH, Files FJ, Denning C, Marvin S. Comparison of alcohol-preferring and nonpreferring selectively bred rat lines. I. Ethanol initiation and limited access operant self-administration. Alcohol Clin Exp Res. 1998;22:2133–46. [PubMed] [Google Scholar]
- Samson HH, Sharpe AL, Denning C. Initiation of ethanol self-administration in the rat using sucrose substitution in a sipper-tube procedure. Psychopharmacology. 1999b;147:274–9. doi: 10.1007/s002130051167. [DOI] [PubMed] [Google Scholar]
- Shoemaker W, Vavrousek-Jakuba E, Arons CD, Kwok FC. The acquisition and maintenance of voluntary ethanol drinking in the rat: effects of dopaminergic lesions and naloxone. Behavioral Brain Res. 2002;137:139–48. doi: 10.1016/s0166-4328(02)00290-5. [DOI] [PubMed] [Google Scholar]