

Abstract
The expression levels of a number of genes associated with inflammation and immune function change with advancing age. Melatonin modulates gene expression levels of several of these genes. Therefore the declining levels of melatonin associated with age may play a role in the physiological effects of aging. We used oligonucleotide microarrays to measure age-related changes in mRNA expression in the murine CNS, and to study the effect of prolonged administration of dietary melatonin upon these changes. CB6F1 male mice were fed 40ppm melatonin for 2.1 months prior to sacrifice at age 26.5 months, and compared with both age-matched controls and young, 4.5-month-old untreated controls. Total RNA was extracted from whole brain (excluding cerebellum and brain stem) and individual samples were hybridized to Affymetrix Mouse 430-2.0 arrays. The expression of a substantial number of genes was modulated by melatonin treatment and changes in selected genes were validated by quantitative reverse transcription polymerase chain reaction (qRT-PCR). A subset of these genes did not change with age. Conversely, some genes modulated by age were also modulated by melatonin treatment. In general melatonin treatment drove the expression levels of these genes closer to the expression levels detected in the younger animals. Notably, the abundance of lipocalin 2 (Lcn2) mRNA increased with age and was decreased in old animals treated with melatonin. Lcn2 is a member of the acute phase response family of proteins and its mRNA levels in the brain increase in response to inflammation. Many of the genes with expression reduced by melatonin are involved in inflammation and the immune system. This suggests that melatonin treatment may influence the inflammatory responses of old animals, driving them to resemble more closely those occurring in young animals.
Keywords: aging, brain, diet, melatonin, mRNA, immunity, microarray
1. Introduction
Markers of chronic inflammation and oxidative damage increase in the mammalian CNS with age, whereas melatonin has demonstrated antioxidant, anti-inflammatory and immunomodulatory properties (Zhang et al., 1997; Reiter et al., 2000; Sharman et al., 2002a, b; Sharman et al., 2004; Pei and Cheung, 2004). The pulsatile nocturnal peak level of melatonin decreases with age in rats (Pang et al., 1990), mice (Lahiri et al., 2004a) and humans (Tozawa et al., 2003), and is predicted to be involved in regulation of sleep, which is commonly disturbed in the elderly (Foley et al., 1995).
The only well-established means of lengthening the lifespan of animals is caloric restriction, and notably, short-term caloric restriction increases melatonin levels in brain and gut (Bubenik et al., 1992). Moreover, dietary supplementation with melatonin increases the lifespan of mice (Peirpaoli et al., 1994; Anisimov et al., 2000) and rats (Oaknin-Bendahan et al., 1995). Thus it is reasonable to conclude that melatonin may play a role in promoting life extension. However, little is known of the mechanisms by which melatonin exerts these effects.
Melatonin is secreted by the pineal gland, which in mice is located atop the cerebral cortex but outside the blood-brain barrier. Melatonin receptor mRNA is detected in a number of areas within the CNS, including the pituitary pars tuberalis, the suprachiasmatic nucleus of the hypothalamus (von Gall et al., 2002), the hippocampus and cerebellum (Al-Ghoul et al., 1998). In the rat, melatonin receptor density decreases with age in the hypothalamus and the hippocampus (Laudon et al., 1998), and melatonin supplementation increases both melatonin levels (Menedez-Pelaez et al., 1993; Lahiri et al., 2004a) and melatonin binding (Oaknin-Bendahan et al., 1995) in the brains of older animals. In the current study we sought to gain a better understanding of melatonin’s possible neuroprotective mechanisms by comparing the age-related CNS gene expression patterns of young and old mice and old mice receiving dietary melatonin. We sought to improve the understanding of the aging process in the brain generally; thus we measured gene expression changes related to aging and melatonin common to the cerebrum as a whole, rather than inquire into detailed changes occurring in specific regions.
2. Experimental Procedures
2.1. Animal treatment
Male CB6F1 mice, a hybrid between C57BL/6JM and BALB/cJF from Harlan Labs (Indianapolis, IN), aged 4.5 months (young group, YC) and 26.5 months (old group, OC), were housed two to four per cage and maintained on a 12 hour light/dark cycle in a temperature controlled (22±1 ºC) room. The CB6F1 hybrid was used in order to take advantage of the vigor – increased disease resistance, better survival under stress and greater natural longevity – typical of hybrids, while maintaining genetic similarity to the published C57BL/6 mouse genome sequence (Waterston et al., 2002). Food and water were provided ad libitum. Young (YC) and old (OC) control animals were fed a pelleted minimal basal diet (AIN-93M, Dyets #100900, Dyets Inc., Bethlehem, PA) consisting of 10% sucrose and 14% casein (w/w) as well as a minimal salt and vitamin mix. This basal diet was supplemented with 40 ppm (w/w) melatonin (Sigma-Aldrich, St. Louis, MO) in a separate group of old mice (OM). The dosage level was confirmed by independent testing (Irvine Nutri-Chemical Laboratories, Irvine, CA). This dosage was chosen because we have shown previously that it lowers levels of reactive oxygen species and improves activity in older mice (Bondy et al., 2002). 9.3 weeks later, young mice were sacrificed at 4.5 months of age, old at 26.5 months of age.
Separately-caged sentinel animals were maintained in the same room to monitor for the occurrence of infectious disease; no disease was detected during the treatment period. All experiments were approved by the Institutional Animal Care and Use Committee at the University of California, Irvine, and conformed to the National Institute of Health guide for the care and use of laboratory animals.
2.2. RNA extraction and purification
Mice were killed by cervical dislocation between 10:40 and 14:40 hours and were visually inspected for signs of disease or other pathology; brain tissues were excised quickly, immediately frozen on dry ice and stored at −80 ºC. Cerebellum and brain stem were removed; total RNA was extracted from the remaining tissue using the TRI Reagent kit (Molecular Research Center Inc., Cincinnati, OH), following the manufacturer’s protocol. Aliquots of the total RNA were further purified on an RNeasy column (Qiagen Inc., Valencia, CA) to yield a 260 nm to 280 nm absorbance ratio of ≥ 1.9. RNA concentrations were determined by absorption at 260-nm wavelength with an ND-1000 spectrometer (Nanodrop Technologies, Wilmington, DE).
2.3. Gene array processing and analysis
A 20 μg aliquot of total RNA from each of three animals per treatment group was processed and applied to a Mouse Genome 430 2.0 GeneArray® chip (45,037 probe sets) according to the manufacturer’s protocol (Affymetrix, Santa Clara, CA). Briefly, total RNA was reverse transcribed using a T7-Oligo(dT) Promoter Primer in the first-strand cDNA synthesis reaction. Following RNase H-mediated second-strand cDNA synthesis, the double-stranded cDNA was purified and served as a template for vitro transcription (IVT). The IVT reaction was carried out in the presence of T7 RNA polymerase and a biotinylated nucleotide analog/ribonucleotide mix for complementary RNA (cRNA) amplification and biotin labeling. The biotinylated cRNA targets were then cleaned up, fragmented, and hybridized to GeneChip expression arrays according to the manufacturer’s instructions. All reagents used were as supplied in the manufacturer’s One-Cycle Target Labeling and Control Reagents kit. The background, noise, housekeeper gene levels and 3′/5′ ratio values of all chips were within the quality control limits set by Affymetrix (Supplemental Table A). Normalized expression values from the raw data were generated using default settings for the Robust Multi-array Average (RMA) method (Irizarry et al., 2003) within GeneSpring (Silicon Genetics, Redwood City, CA). Subsequent statistical analysis was also performed in GeneSpring. The cross-gene error model was applied with replicates; poor-quality probe sets with p-values > 0.2 were eliminated. In order to focus only on genes that could be verified readily by qRT-PCR, probe sets with expression levels in the lowest 5%, or which had expression changes < 30% between the OC and OM groups, were dropped from consideration.
2.4. qRT-PCR gene expression analysis
qRT-PCR analysis was used to measure the expression levels of selected mRNA transcripts. Methylenetetrahydrofolate dehydrogenase 1 (Mthfd1) was chosen as a control gene as it has moderate expression levels in this tissue and its expression level has previously shown to remain consistent under a variety of experimental manipulations in similar tissues (Adlard et al., 2004). Reactions utilizing equal amounts of total RNA from each sample were carried out on a LightCycler instrument (Roche Diagnostics, Indianapolis, IN) using the QuantiTect SYBR Green RT-PCR reagent kit (Qiagen, Valencia, CA) according to the manufacturers’ directions. Product fluorescence was detected at the end of the elongation cycle at 72 °C. Melting curves all exhibited a single, sharp peak at a temperature characteristic of the primer pair used and none of the primer pairs produced amplicons in the absence of sample or reverse transcriptase. Expression levels for each sample, normalized to Young Control expression, were calculated as the average of two measurements, relative to Mthfd1 expression.
2.5 Data and statistical analyses
Expression ratios were calculated as the power-2 exponential of the log2 differences. The acceptance criterion for gene array expression changes was a one-way ANOVA t-test p-value of < 0.05.
For qRT-PCR mRNA analyses, differences between groups were assessed by one-way Analysis of Variance; this was followed by Gabriel’s multiple comparisons procedure test as computed using the Clinstat program (Bland, 2000). In all cases, the acceptance level of significance was p<0.05 using a two-tailed distribution.
3. Results
The entire set of 45,037 probe sets was analyzed for expression changes between young and old animals and old animals fed diets supplemented with melatonin. In order to validate the results from the arrays, three of the genes were further studied by qRT-PCR. The results from these analyses broadly confirmed the arrays (Fig. 1). A representative experimental plot for serum and glucocorticoid-induced kinase (SGK) is shown in Fig. 2.
Figure 1.
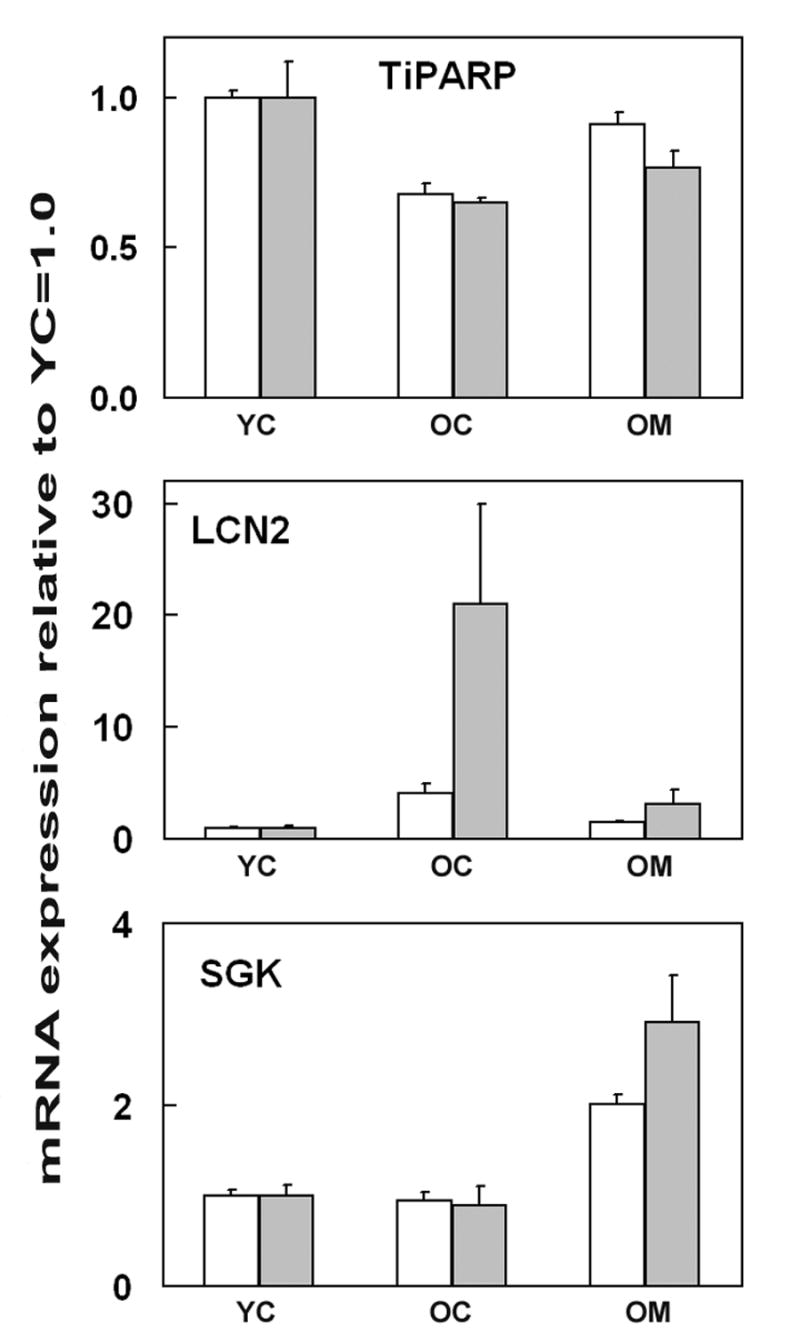
qRT-PCR (gray bars) compared to microrarray analysis (open bars) of cortical levels of TiPARP, Lcn2 and Sgk mRNA expression in 4.5 and 26.5 month-old mice (YC and OC, respectively). One group of 26.5 month-old mice (OM) received 40 ppm dietary melatonin for the preceding 9.3 weeks. Bars represent mean ± SE (n = 3) mRNA expression levels relative to YC=1.0, and as adjusted by Mthfd1 ‘housekeeper’ gene expression (qRT-PCR), or normalized with RMA (microarray).
Figure 2.
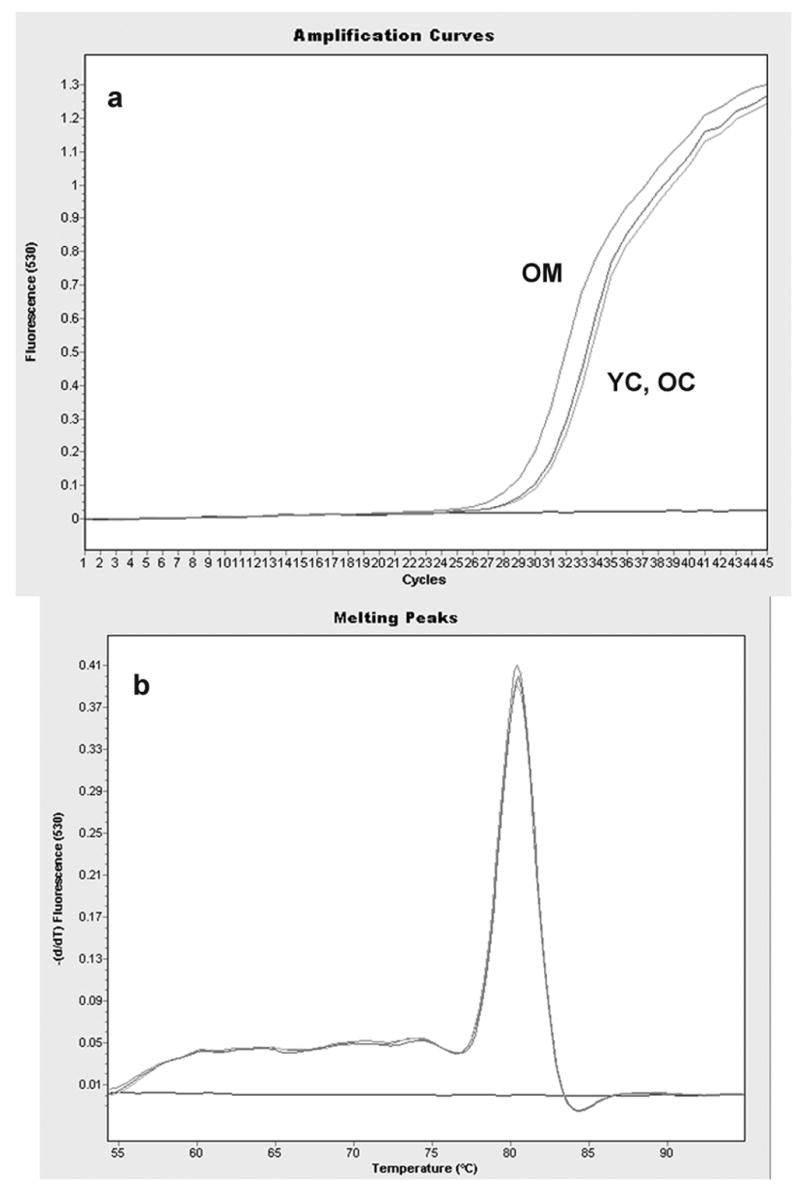
Quantitative, real-time RT-PCR plot for serum and glucocorticoid-induced kinase (SGK) mRNA expression. a: plot of SYBR green fluorescence intensity (530nm, arbitrary units) versus number of PCR cycles. A single, representative curve is shown for each treatment group; YC = young control, OC = old control, OM = old melatonin group. Indicated mRNA expression levels: OM >> YC > OC. b: Overlapping melting peaks of the above samples resulting from a first derivative plot of final product fluorescence versus temperature (melting curve). Overlapping peaks and lack of other significant features indicates accurate, single-product amplification and lack of primer-dimer or other spurious product formation. The unresponsive curve at bottom of each plot was produced by a negative (no RNA) control sample.
Analysis within GeneSpring yielded an age- or melatonin-related set of 432 probe sets with expression ratio changes in excess of ±30% and with p<0.05 (Supplemental Table B). The 30% value was chosen so as to identify genes with the smallest changes that would have an acceptably small probability of being false positives and could be readily verified by qRT-PCR.
Expression ratios for multiple probe sets representing a single unique gene were averaged. All resulting genes, classified as either changing with melatonin alone, or with both age and melatonin, are listed (Tables 1 and 2). Expression levels of seven genes that increased with age were decreased by melatonin treatment to approach levels in YC (Table 1); similarly, two genes were decreased with age and increased with melatonin treatment (Table 1). Four genes were decreased by both age and melatonin (Table 2). All of the seven genes whose expression was elevated with age and reduced by melatonin treatment have immune-related functionality; these included lipocalin 2, immunoglobulin heavy chain 6 (Igh-6, heavy chain of IgM), and immunoglobulin κ chain V8 (Igk-V8).
Table 1.
List of probe sets with significant age-related gene expression changes the directions of which were reversed in the melatonin-treated animals. Probe sets are identified by gene abbreviations and GenBank accession numbers. Normalized expression values from the raw microarray data were generated using the Robust Multi-array Average (RMA) method (Irizarry et al., 2003) within GeneSpring.
| Gene | Genbank Accession | YC | OC | OM | OC/YC | OM/OC | Function | Description |
|---|---|---|---|---|---|---|---|---|
| Normalized Expression | ||||||||
| Increased with age, decreased by melatonin | ||||||||
| AV057155 | 0.29 | 7.12 | 1.39 | 24.7 | 0.20 | possibly immunity | Transcribed locus, similar to XP-132633.3 immunoglobulin kappa chain (V28) | |
| Igk-V8 |
BC013496
BI107286 BG966217 |
0.50
0.66 0.77 |
4.03
3.50 2.19 |
1.26
1.17 1.10 |
8.06
5.29 2.85 |
0.31
0.34 0.50 |
Immunity | Immunoglobulin kappa chain variable 8 |
| Lcn2 | X14607 | 0.74 | 3.01 | 1.13 | 4.09 (21.0) | 0.38 (0.15) | Immunity | Lipocalin 2 |
| Igh-6 |
BB226392
AI326478 |
0.71
0.78 |
2.02
1.72 |
1.04
1.02 |
2.85
2.21 |
0.52
0.60 |
Immunity | Immunoglobulin IgM heavy chain 6 |
| Lrg1 | NM_029796 | 0.59 | 1.44 | 0.98 | 2.44 | 0.68 | Immunity | Leucine-rich α- 2-glycoprotein 1 |
| Igj | BC006026 | 0.83 | 1.62 | 1.07 | 1.96 | 0.66 | Immunity | Immunoglobulin joining chain |
| Gvin1 | BM243571 | 0.92 | 1.20 | 0.89 | 1.31 | 0.75 | Immunity | GTPase, very large interferon inducible 1; Iigs1; Vlig-1 |
| Decreased with age, increased by melatonin | ||||||||
| Tiparp | BB762264 | 1.06 | 0.72 | 0.96 | 0.68 (0.65) | 1.34 (1.18) | Histone ribosylation | TCDD-inducible poly(ADP-ribose) polymerase |
| Agxt2l1 | BC022644 | 1.03 | 0.77 | 1.03 | 0.75 | 1.34 | Transaminase | Alanine-glyoxylate aminotransferase 2-like 1 |
OC/YC = ratio of expression in old control animals to expression in young control animals; OM/OC = ratio of expression in old melatonin-fed animals to expression in old control animals. Bold ratios determined by gene chip analysis; ratios in parentheses determined by qRT-PCR.
Table 2.
List of probe sets with significant melatonin-related gene expression changes. Probe sets are identified by gene abbreviations and GenBank accession numbers. Normalized expression values from the raw microarray data were generated using the Robust Multi-array Average (RMA) method (Irizarry et al., 2003) within GeneSpring.
| Gene
Name |
Genbank Accession Code | OC/YC | OM/OC | Function | Description |
|---|---|---|---|---|---|
| Significantly increased by melatonin | |||||
| Sgk | NM_011361 | 0.95 (0.89) | 2.12 (3.30) | Extracellular stress response | Serum/glucocorticoid regulated kinase |
| Rbm3 | AY052560 | 0.90 (0.88) | 1.73 (1.71) | Hypoxia and cold stress response | Possible splice variant of RNA-binding motif protein 3 mRNA |
| Nfkbia |
NM_010907
AI462015 |
0.96
0.92 |
1.70
1.58 |
Inflammation, oxidative stress | Nuclear factor of kappa light chain gene enhancer in B-cells inhibitor |
| Nfkbia | BB096843 | 0.95 | 1.63 | Inflammation, oxidative stress | cDNA clone 9430057A10 3′ similar to U57524 IκBαChain non-coding mRNAsequence. |
| [EST] | BB427399 | 1.22 | 1.59 | EST from Mus musculus adult male hippocampus cDNA | |
| Pdk4 | NM_013743 | 0.94 | 1.54 | Fatty acid/carbohydrate metabolic switch | Pyruvate dehydrogenase kinase, isoenzyme 4 |
| Ddit4 | AK017926 | 0.83 | 1.54 | Stress and ROS response | DNA-damage-inducible transcript 4 |
| [EST] | BE956710 | 1.29 | 1.44 | Mus musculus transcribed sequence | |
| Cebpd | BB831146 | 1.19 | 1.42 | Acute phase response; fear modulation | CCAAT/enhancer binding protein (C/EBP), delta |
| Fkbp5 | AI098139 | 0.98 | 1.41 | Steroid receptor activation | FK506 binding protein 5 |
| Rhou | AF378088 | 1.15 | 1.32 | Cell shape | Ras homolog gene family, member U |
| Cirbp | NM_007705 | 1.09 | 1.31 | Stress | Cold inducible RNA binding protein |
| [EST] | BI133499 | 1.15 | 1.31 | EST from Mus musculus adult male corpora quadrigemina cDNA | |
| Significantly decreased by melatonin | |||||
| [EST] | BI076714 | 1.16 | 0.74 | NIA Mouse Newborn Ovary cDNA Library Mus musculus cDNA clone L0223B10 3′, mRNA sequence. | |
| [EST] | BG066678 | 1.04 | 0.75 | EST | NIA Mouse 15K cDNA Clone Set Mus musculus cDNA clone H3044G12 3′, mRNA sequence. |
| Ets1 | BB151715 | 1.14 | 0.76 | Oncogene | E26 avian leukemia oncogene 1, 5′ domain |
| CD93 | AV319144 | 0.93 | 0.77 | Immunity | CD93 Antigen; Complement component 1, q subcomponent, receptor 1. |
| Significantly increased by both age and melatonin | |||||
| S3-12 | NM_020568 | 1.94 (1.33) | 1.31 (3.61) | Lipid sequestration | Plasma membrane associated protein, S3-12 |
| Arrdc2 | AW542672 | 1.38 | 1.57 | Unknown | Arrestin domain containing 2; Ilad1 |
| Alas2 | M63244 | 1.35 | 1.73 | Heme biosynthesis | Aminolevulinic acid synthase 2, erythroid |
| Hbb-b2 | BC027434 | 1.31 | 1.32 | Oxygen transport | Hemoglobin, beta adult minor chain |
| Significantly decreased by both age and melatonin | |||||
| Hspa1b |
M12573
M12573 |
0.35
0.39 |
0.69
0.67 |
Stress | Heat shock protein 1B; Hsp70 |
| Serpinh1 | BI220012 | 0.53 (0.57) | 0.76 (0.67) | Stress | Serine (or cysteine) proteinase inhibitor, Hsp47 |
| Hspb1 | U03561 | 0.53 | 0.72 | Stress | Heat shock protein 1; Hsp25 |
| Hist2h3c2 | BC015270 | 0.68 | 0.74 | Histone 2, H3c2 | |
OC/YC = ratio of expression in old control animals to expression in young control animals; OM/OC = ratio of expression in old melatonin-fed animals to expression in old control animals. Bold ratios determined by gene chip analysis; ratios in parentheses determined by qRT-PCR.
Four genes, including three stress-inducible heat shock proteins, were significantly decreased by age, and decreased further by melatonin treatment. Another set of four genes, including plasma membrane associated protein S3–12 and arrestin domain containing protein 2 (Arrdc2), were increased by both age and melatonin (Table 2).
Genes whose expression levels were unaffected by age but increased by melatonin, included CCAAT/enhancer binding protein delta (Cebpd), DNA-damage-inducible transcript 4 (Ddit4), and pyruvate dehydrogenase kinase enzyme (Pdk4). Genes depressed by melatonin and unaltered with age included the oncogene, Ets-1 (Table 2).
We measured the mRNA expression of arylalkylamine N-acetyltransferase (AANAT), the rate-limiting enzyme involved in the conversion of serotonin to melatonin, and of the melatonin-specific receptors Mtnr1a and RORa by qRT-PCR. Aside from a non-significant tendency for melatonin to lower their expression slightly, none were significantly affected by age or melatonin (data not shown). The data imply that the levels of these genes may have remained unchanged by these treatments throughout the major part of the brain we sampled; it is also possible that substantial changes in one region were counterbalanced by opposing changes in another region.
The mRNA expression for a second melatonin receptor Mtnr1b was not detectable by qRT-PCR (data not shown; the M430 genechip has no probe sets corresponding to this transcript). Two possibilities are consistent with this result. One is that Mtnr1b is expressed at very low levels in a relatively limited brain region; Mtnr1b mRNA has been detected in rat hypothalamus, for example (Sallinen et al., 2005). A second possibility is that Mtnr1b is not expressed at detectable levels anywhere in brain, consonant with its nondetectability in ovine hypothalamus (Migaud et al., 2005).
4. Discussion
4.1. Genes changed by age and reversed by melatonin
4.1.1. Immunoglobulins
All seven unique genes whose expression was both increased with age and reduced by melatonin treatment in aged animals are related to immune function. Genespring classifies as immune-related only 278 probe sets out of the total of over 40,000 measured. However, melatonin is additionally involved in a number of other age-modulated processes, such as antioxidant status and circadian rhythm signaling. While melatonin supplementation could be predicted to result in reversal of age-related increases in genes associated with any of these processes, only reversals of age-related increases in immunity-related genes were detected. Thus, for all seven genes that were elevated with age and depressed by melatonin treatment to be immune-related, is especially remarkable.
Four of these immune-related genes were immunoglobulins – Igk-V8, Igh-6, Igj, and an immunoglobulin-related EST. The gene chip used has probe sets for at least 12 distinct immunoglobulin genes, with many redundancies, indicating that only a minority of immunoglobulin genes may be modulated by age and melatonin.
4.1.2. Lipocalin 2
Lipocalin 2 (Lcn2/NGAL/24p3) sequesters iron by binding to lipophilic iron chelators as part of the innate immune response to bacterial infection (Flo et al., 2004). Lcn2 also plays a role in normal iron metabolism (Elangovan et al., 2004). The proper functioning of Lcn2 may be especially important for myelin and oligodendrocytes, which contain particularly high levels of iron. Apoptosis of oligodendrocytes and myelin degeneration are both associated with brain aging, and are particularly pronounced in Alzheimer’s disease (Bartzokis, 2004).
We observed significantly higher Lcn2 mRNA expression in old animals compared to young controls and this may relate to the age-induced accumulation of iron in the CNS (Zecca et al., 2004). Increased Lcn2 levels in other tissues are associated with numerous pathological conditions; among these are psoriasis and squamous cell carcinoma in skin (Mallbris et al., 2002), cisplatin-induced nephrotoxicity (Mishra et al., 2004), and the hepatic acute phase inflammatory response (Liu et al., 1995). By analogy the age-related increases in Lcn2 expression seen here may have relevance to neural pathology, and the melatonin-induced Lcn2 reduction may help to maintain CNS functionality. Determining the extent to which Lcn2 protein levels follow these changes in mRNA is an important area for future study.
The promoter region of the murine Lcn2 gene contains an activation site for NF-κB (Cowland et al., 2003), and levels of activated NF-κB increase in murine cortex with age (Ye and Johnson, 2001). Thus, increased levels of NF-κB activation in the aged brain may explain, at least in part, the increased levels of Lcn2 mRNA observed. The increased levels of Lcn2 in turn add support to the notion that the aged brain is in a chronically inflamed state relative to the young.
Two genes, Tiparp and Agxt2l1, had the opposite response: their expression levels decreased with age and were restored to young-animal levels by melatonin; in contrast to the genes with expression increased by age, neither is immune-related.
4.2. Genes decreased by both age and melatonin
4.2.1. Heat shock proteins
Heat shock proteins are molecular chaperones that facilitate the correct folding of other proteins. They are highly inducible and their increased CNS expression in response to a variety of pathological conditions confers neuroprotection (Yenari, 2002). Three of the four unique genes whose mRNA expression was decreased by both age and melatonin are heat shock proteins: Hspa1b (Hsp70), Serpinh1 (Hsp47), and Hspb1 (Hsp25). A fourth heat shock gene – Dnajb11, that previously has been reported to decrease significantly in aged mouse cortex (Jiang et al., 2001), declined by 20% in our study (microarray data not shown). However, age does not appear to decrease the expression of heat shock genes in all cases. The heat shock protein Dnajb13 was reported to increase in C57BL/6 mouse cortex (Lee et al., 2000), paralleling our report of an age-related increase of Hsp70 expression in B6C3F1 mouse cortex (Sharman et al., 2004).
How heat shock gene expression changes affect animal fitness may vary with differing treatments. Given a greater requirement for repair of miss-folded proteins in aged cortex, the age-related decreased expression of these genes could result in a decline in brain function in aged animals. However, Lee et al., (2000) found that caloric restriction, a treatment widely found to result in life extension and improved function in aged animals, decreased the expression of Dnajb13; this decrease could be interpreted as a response to a decreased protein repair requirement in aged calorically-restricted animals. We propose that the decrease in heat shock gene expression produced by melatonin, as observed in both this and our previous study, may be a response to a similarly-improved condition.
4.3. Genes altered by melatonin but not changed with age
4.3.1. Serum/glucocorticoid-regulated kinase (Sgk)
Gene array measurements (confirmed by qRT-PCR analysis) revealed that melatonin treatment increased expression of serum/glucocorticoid-regulated kinase (Sgk) in aged mice above corresponding levels in young animals. Increased CNS levels of Sgk may be beneficial via reduction of excitotoxicity through stimulation of the glutamate transporter, EAAT4 (Bohmer et al., 2004). In cultured rat spinal cord neurons, the number of dendrites and dendritic branch points are increased by increased Sgk gene expression (David et al., 2005). Higher hippocampal expression levels in rats correlate with faster spatial learning in the Morris water maze test (Tsai et al., 2002). Thus increased levels of Sgk expression in the CNS produced following melatonin supplementation may result in similar beneficial effects. Such effects may also contribute to improved learning in older humans observed with nightly administration of 1 mg of melatonin (Peck et al., 2004).
4.3.2. Nfkbia
NF-κB inhibitor α (Nfkbia/IκBα) prevents activation of the transcription factor NF-κB which regulates expression of a number of oxidative-stress-related and inflammatory mediators such as cyclooxygenase-2 (COX-2) (Wu, 2005). Increases in Nfkbia expression may thus be anti-inflammatory; decreased expression is deleterious as Nfkbia knockout mice are perinatally lethal (Cheng et al., 1998). Our present results showing an increased Nfkbia expression with melatonin are consistent with a neuroprotective and anti-inflammatory role for this substance.
4.3.3. DNA-damage-inducible transcript 4
Given melatonin’s demonstrated neuroprotective properties in an in vivo stroke model (Kilic et al., 2005), upregulation of the stress-responsive gene DNA-damage-inducible transcript 4 (Ddit4/REDD1/dig2/RTP801) following melatonin treatment, is paradoxical. Ddit4 gene expression is upregulated by hypoxia in cell culture and by ischemia in rat brain, but its increased expression is accompanied by increased toxicity in non-dividing neuron-like PC12 cells and protection of MCF7 breast carcinoma cells (Shoshani et al., 2002). Furthermore, Ddit4 gene expression is increased by exposure of human neuroblastoma CHP134 cells to amyloid beta (Aβ) protein, and transient overexpression of the sense gene heightened Aβ toxicity, while overexpression of the antisense gene reduced susceptibility to Aβ in these cells (Kim et al., 2003). These results are consonant with our failure to observe any improvement in cortical histopathology or memory after chronic feeding of melatonin in a triple-transgenic mouse model of Alzheimer’s disease (Sharman, Bondy and LaFerla, unpublished results). However, in our earlier animal studies on non-transgenic mice, we observed a significant reduction in levels of Aβ peptides only in middle-aged (12 months old) compared with older mice (27 months old) (Lahiri et al., 2004b). The reason for the age dependency of effects of melatonin supplementation on levels of these proteins is unclear; nevertheless these data are consistent with the very modest benefits of melatonin for Alzheimer’s disease patients in a recent clinical trial (Asayama et al., 2003).
4.3.4. C/EBP-δ
CCAAT/enhancer binding protein (C/EBP)-δ is a transcription factor widely expressed in mammalian CNS (Reiter et al., 2000). C/EBP-δ mRNA levels are elevated by melatonin supplementation and is expressed throughout the CNS, including the hippocampus. In one study, targeted gene deletion of C/EBP-δ produced an enhanced contextual fear response in mice after 24 hours, but not after 30 minutes (Sterneck et al., 1998). Conversely, hippocampal C/EBP-δ mRNA expression was increased 20 hours after inhibitory avoidance training in the rat (Taubenfeld et al., 2002). These two studies point to an important role for this transcription factor in long-term memory consolidation, and the observed elevation of C/EBP-δ suggests melatonin supplementation has the potential to benefit memory consolidation.
Overexpression of C/EBP-δ led to accumulation of myelin protein zero (P0) and myelin basic protein (MBP) mRNAs in a Schwann cell myeloma cell culture model (Kamaraju et al., 2004). Loss of C/EBP-δ also promotes chromosomal instability in fibroblast cell culture (Huang et al., 2004) implying that it can function as a tumor suppressor. Consistent with this role for C/EBP-δ is our observation that untreated old animals exhibited a higher incidence of tumors than melatonin-supplemented ones.
4.3.5. Pyruvate dehydrogenase kinase (pdk4)
Melatonin increased the mRNA expression for pyruvate dehydrogenase kinase (pdk4). Pdk4 phosphorylates the pyruvate dehydrogenase complex, resulting in a suppression of complex activity and a shift from carbohydrate to fatty acid metabolism. Pdk4 gene expression is also elevated in several tissues of the ground squirrel Spermophilus tridecemlineatus during hibernation (Buck et al., 2002); the parallel elevation of Pdk4 by melatonin is consistent with the finding that melatonin supplementation lengthens hibernation duration in the related species Spermophilus lateralis (Saarela and Reiter, 1994).
4.3.6. Ets-1
The melatonin-induced decrease in Ets1 mRNA expression is consistent with melatonin being oncostatic (Saez et al., 2005). Ets1 protein is upregulated in many tumors including brain tumors such as astrocytomas and meningiomas, and the degree of expression upregulation correlates with tumor invasiveness (Dittmer, 2003). The light experienced by night shift workers suppresses their nocturnal melatonin secretion, and female night shift workers have increased breast cancer incidence (Davis et al., 2001). Moreover, urinary levels of melatonin’s excretory product 6-sulfatoxymelatonin are decreased in breast cancer patients (Schernhammer et al., 2004).
4.4. Broad relevance of results
The results reported here on immune function are in broad accord with our earlier study using a different gene array, different dietary melatonin schedule and a different mouse strain (Sharman et al., 2004). The generality of these findings is further confirmed by the good correlation obtained when comparing mouse and human genes that change markedly with age (Sharman et al., 2005).
Expression of genes for melatonin receptors was not significantly changed with age. The simplest interpretation of this is that the reduction of melatoninergic activity occurring with age, leads to little overall alteration of receptor gene expression. It is also possible that increased receptor gene expression in one part of the brain is negated by a decrease of similar magnitude in another part.
The protective effects of melatonin, together with its low toxicity and its capacity to increase mRNA levels of immune- and memory-related proteins, suggest that this hormone should be investigated further as a treatment of age-related neurological disorders.
Supplementary Material
Acknowledgments
This work was supported in part by grants from the National Institutes of Health (ES 7992, AG 16794, AG 14882 and AG18884).
Footnotes
Publisher's Disclaimer: This is a PDF file of an unedited manuscript that has been accepted for publication. As a service to our customers we are providing this early version of the manuscript. The manuscript will undergo copyediting, typesetting, and review of the resulting proof before it is published in its final citable form. Please note that during the production process errors may be discovered which could affect the content, and all legal disclaimers that apply to the journal pertain.
References
- Adlard PA, Perreau VM, Engesser-Cesar C, Cotman CW. The timecourse of induction of brain-derived neurotrophic factor mRNA and protein in the rat hippocampus following voluntary exercise. Neurosci Lett. 2004;363:43–48. doi: 10.1016/j.neulet.2004.03.058. [DOI] [PubMed] [Google Scholar]
- Al-Ghoul WM, Herman MD, Dubocovich ML. Melatonin receptor subtype expression in human cerebellum. Neuroreport. 1998;9:4063–4068. doi: 10.1097/00001756-199812210-00011. [DOI] [PubMed] [Google Scholar]
- Anisimov VN, Zavarzina N, Zabezhinskii MA, Popovich IG, Anikin IV, Zimina OA, Solov’ev MV, Shtylik AV, Arutiunian AV, Oparina TI, Prokopenko VM, Khavinson VKh. The effect of melatonin on the indices of biological age, on longevity and on the development of spontaneous tumors in mice. Vopr Onkol. 2000;46:311–319. [PubMed] [Google Scholar]
- Asayama K, Yamadera H, Ito T, Suzuki H, Kudo Y, Endo S. Double blind study of melatonin effects on the sleep-wake rhythm, cognitive and non-cognitive functions in Alzheimer type dementia. J Nippon Med Sch. 2003;70:334–341. doi: 10.1272/jnms.70.334. [DOI] [PubMed] [Google Scholar]
- Bartzokis G. Age-related myelin breakdown: a developmental model of cognitive decline and Alzheimer’s disease. Neurobiol Aging. 2004;25:5–18. doi: 10.1016/j.neurobiolaging.2003.03.001. [DOI] [PubMed] [Google Scholar]
- Bland M. An Introduction to Medical Statistics. Oxford University Press; Oxford: 2000. pp. 3–177. [Google Scholar]
- Bohmer C, Philippin M, Rajamanickam J, Mack A, Broer S, Palmada M, Lang F. Stimulation of the EAAT4 glutamate transporter by SGK protein kinase isoforms and PKB. Biochem Biophys Res Commun. 2004;324:1242–1248. doi: 10.1016/j.bbrc.2004.09.193. [DOI] [PubMed] [Google Scholar]
- Bondy SC, Yang YE, Walsh TJ, Gie YW, Lahiri DK. Dietary modulation of age-related changes in cerebral pro-oxidant status. Neurochem Int. 2002;40:123–130. doi: 10.1016/s0197-0186(01)00084-5. [DOI] [PubMed] [Google Scholar]
- Bubenik GA, Ball RO, Pang SF. The effect of food deprivation on brain and gastrointestinal tissue levels of tryptophan, serotonin, 5-hydroxyindoleacetic acid, and melatonin. J Pineal Res. 1992;12:7–16. doi: 10.1111/j.1600-079x.1992.tb00020.x. [DOI] [PubMed] [Google Scholar]
- Buck MJ, Squire TL, Andrews MT. Coordinate expression of the PDK4 gene: a means of regulating fuel selection in a hibernating mammal. Physiol Genomics. 2002;8:5–13. doi: 10.1152/physiolgenomics.00076.2001. [DOI] [PubMed] [Google Scholar]
- Cheng JD, Ryseck RP, Attar RM, Dambach D, Bravo R. Functional redundancy of the nuclear factor kappa B inhibitors I kappa B alpha and I kappa B beta. J Exp Med. 1998;188:1055–1062. doi: 10.1084/jem.188.6.1055. [DOI] [PMC free article] [PubMed] [Google Scholar]
- Cowland JB, Sorensen OE, Sehested M, Borregaard N. Neutrophil gelatinase-associated lipocalin is up-regulated in human epithelial cells by IL-1b, but not by TNF-a. J Immunol. 2003;171:6630–6639. doi: 10.4049/jimmunol.171.12.6630. [DOI] [PubMed] [Google Scholar]
- David S, Stegenga SL, Hu P, Xiong G, Kerr E, Becker KB, Venkatapathy S, Warrington JA, Kalb RG. Expression of serum- and glucocorticoid-inducible kinase is regulated in an experience-dependent manner and can cause dendrite growth. J Neurosci. 2005;25:7048–7053. doi: 10.1523/JNEUROSCI.0006-05.2005. [DOI] [PMC free article] [PubMed] [Google Scholar]
- Davis S, Mirick DK, Stevens RG. Night shift work, light at night, and risk of breast cancer. J Natl Cancer Inst. 2001;93:1557–1562. doi: 10.1093/jnci/93.20.1557. [DOI] [PubMed] [Google Scholar]
- Dittmer J. The biology of the Ets1 proto-oncogene. Mol Cancer. 2003;2:29–49. doi: 10.1186/1476-4598-2-29. [DOI] [PMC free article] [PubMed] [Google Scholar]
- Elangovan N, Lee YC, Tzeng WF, Chu ST. Delivery of ferric ion to mouse spermatozoa is mediated by lipocalin internalization. Biochem Biophys Res Commun. 2004;319:1096–1104. doi: 10.1016/j.bbrc.2004.05.091. [DOI] [PubMed] [Google Scholar]
- Flo TH, Smith KD, Sato S, Rodriguez DJ, Holmes MA, Strong RK, Akira S, Aderem A. Lipocalin 2 mediates an innate immune response to bacterial infection by sequestrating iron. Nature. 2004;432:917–921. doi: 10.1038/nature03104. [DOI] [PubMed] [Google Scholar]
- Foley DJ, Monjan AA, Brown SL, Simonsick EM, Wallace RB, Blazer DG. Sleep complaints among elderly persons: an epidemiologic study of three communities. Sleep. 1995;18:425–432. doi: 10.1093/sleep/18.6.425. [DOI] [PubMed] [Google Scholar]
- Huang AM, Montagna C, Sharan S, Ni Y, Ried T, Sterneck E. Loss of CCAAT/enhancer binding protein delta promotes chromosomal instability. Oncogene. 2004;23:1549–1557. doi: 10.1038/sj.onc.1207285. [DOI] [PubMed] [Google Scholar]
- Irizarry RA, Hobbs B, Collin F, Beazer-Barclay YD, Antonellis KJ, Scherf U, Speed TP. Exploration, normalization, and summaries of high density oligonucleotide array probe level data. Biostatistics. 2003;4:249–264. doi: 10.1093/biostatistics/4.2.249. [DOI] [PubMed] [Google Scholar]
- Jiang CH, Tsien JZ, Schultz PG, Hu Y. The effects of aging on gene expression in the hypothalamus and cortex of mice. Proc Natl Acad Sci U S A. 2001;98:1930–1934. doi: 10.1073/pnas.98.4.1930. [DOI] [PMC free article] [PubMed] [Google Scholar]
- Kamaraju AK, Adjalley S, Zhang P, Chebath J, Revel M. C/EBP-delta induction by gp130 signaling. Role in transition to myelin gene expressing phenotype in a melanoma cell line model. J Biol Chem. 2004;279:3852–3861. doi: 10.1074/jbc.M310443200. [DOI] [PubMed] [Google Scholar]
- Kilic U, Kilic E, Reiter RJ, Bassetti CL, Hermann DM. Signal transduction pathways involved in melatonin-induced neuroprotection after focal cerebral ischemia in mice. J Pineal Res. 2005;38:67–71. doi: 10.1111/j.1600-079X.2004.00178.x. [DOI] [PubMed] [Google Scholar]
- Kim JR, Lee SR, Chung HJ, Kim S, Baek SH, Kim JH, Kim YS. Identification of amyloid b-peptide responsive genes by cDNA microarray technology: involvement of RTP801 in amyloid b-peptide toxicity. Exp Mol Med. 2003;35:403–411. doi: 10.1038/emm.2003.53. [DOI] [PubMed] [Google Scholar]
- Lahiri DK, Chen D, Ge YW, Bondy SC, Sharman EH. Dietary supplementation with melatonin reduced levels of amyloid beta-peptides in the murine cerebral cortex. J Pineal Res. 2004a;36:224–231. doi: 10.1111/j.1600-079X.2004.00121.x. [DOI] [PubMed] [Google Scholar]
- Lahiri DK, Ge YW, Sharman EH, Bondy SC. Age-related changes in serum melatonin in mice: higher levels of combined melatonin and 6-hydroxymelatonin sulfate in the cerebral cortex than serum, heart, liver and kidney tissues. J Pineal Res. 2004b;36:217–223. doi: 10.1111/j.1600-079X.2004.00120.x. [DOI] [PubMed] [Google Scholar]
- Laudon M, Nir I, Zisapel N. Melatonin receptors in discrete brain areas of the male rat. Impact of aging on density and on circadian rhythmicity. Neuroendocrinology. 1988;48:577–583. doi: 10.1159/000125066. [DOI] [PubMed] [Google Scholar]
- Lee CK, Weindruch R, Prolla TA. Gene expression profile of the ageing brain. Nat Genet. 2000;25:294–297. doi: 10.1038/77046. [DOI] [PubMed] [Google Scholar]
- Liu Q, Nilsen-Hamilton M. Identification of a new acute phase protein. J Biol Chem. 1995;270:22565–22570. doi: 10.1074/jbc.270.38.22565. [DOI] [PubMed] [Google Scholar]
- Mallbris L, O’Brien KP, Hulthen A, Sandstedt B, Cowland JB, Borregaard N, Stahle-Backdahl M. Neutrophil gelatinase-associated lipocalin is a marker for dysregulated keratinocyte differentiation in human skin. Exp Dermatol. 2002;11:584–591. doi: 10.1034/j.1600-0625.2002.110611.x. [DOI] [PubMed] [Google Scholar]
- Menendez-Pelaez A, Poeggeler B, Reiter RJ, Barlow-Walden L, Pablos MI, Tan DX. Nuclear localization of melatonin in different mammalian tissues: immunocytochemical and radioimmunoassay evidence. J Cell Biochem. 1993;53:373–382. doi: 10.1002/jcb.240530415. [DOI] [PubMed] [Google Scholar]
- Migaud M, Daveau A, Malpaux B. MTRN1A melatonin receptors in the ovine pre-mammillary hypothalamus: day-night variation in the expression of the transcripts. Biol Reprod. 2005;72:393–398. doi: 10.1095/biolreprod.104.030064. [DOI] [PubMed] [Google Scholar]
- Mishra J, Mori K, Ma Q, Kelly C, Barasch J, Devarajan P. Neutrophil gelatinase-associated lipocalin: a novel early urinary biomarker for cisplatin nephrotoxicity. Am J Nephrol. 2004;24:307–315. doi: 10.1159/000078452. [DOI] [PubMed] [Google Scholar]
- Oaknin-Bendahan S, Anis Y, Nir I, Zisapel N. Effects of long-term administration of melatonin and a putative antagonist on the ageing rat. Neuroreport. 1995;6:785–788. doi: 10.1097/00001756-199503270-00020. [DOI] [PubMed] [Google Scholar]
- Pang SF, Tsang CW, Hong GX, Yip PC, Tang PL, Brown GM. Fluctuation of blood melatonin concentrations with age: result of changes in pineal melatonin secretion, body growth, and aging. J Pineal Res. 1990;8:179–192. doi: 10.1111/j.1600-079x.1990.tb00678.x. [DOI] [PubMed] [Google Scholar]
- Peck JS, LeGoff DB, Ahmed I, Goebert D. Cognitive effects of exogenous melatonin administration in elderly persons: a pilot study. Am J Geriatr Psychiatry. 2004;12:432–436. doi: 10.1176/appi.ajgp.12.4.432. [DOI] [PubMed] [Google Scholar]
- Pei Z, Cheung RT. Pretreatment with melatonin exerts anti-inflammatory effects against ischemia/reperfusion injury in a rat middle cerebral artery occlusion stroke model. J Pineal Res. 2004;37:85–91. doi: 10.1111/j.1600-079X.2004.00138.x. [DOI] [PubMed] [Google Scholar]
- Pierpaoli W, Regelson W. Pineal control of aging: effect of melatonin and pineal grafting on aging mice. Proc Natl Acad Sci U S A. 1994;91:787–791. doi: 10.1073/pnas.91.2.787. [DOI] [PMC free article] [PubMed] [Google Scholar]
- Ramji DP, Foka P. CCAAT/enhancer-binding proteins: structure, function and regulation. Biochem J. 2002;365:561–575. doi: 10.1042/BJ20020508. [DOI] [PMC free article] [PubMed] [Google Scholar]
- Reiter RJ, Tan DX, Qi W, Manchester LC, Karbownik M, Calvo JR. Pharmacology and physiology of melatonin in the reduction of oxidative stress in vivo. Biol Signals Recept. 2000;9:160–171. doi: 10.1159/000014636. [DOI] [PubMed] [Google Scholar]
- Saarela S, Reiter RJ. Function of melatonin in thermoregulatory processes. Life Sci. 1994;54:295–311. doi: 10.1016/0024-3205(94)00786-1. [DOI] [PubMed] [Google Scholar]
- Saez MC, Barriga C, Garcia JJ, Rodriguez AB, Ortega E. Effect of the preventive-therapeutic administration of melatonin on mammary tumour-bearing animals. Mol Cell Biochem. 2005;268:25–31. doi: 10.1007/s11010-005-2994-3. [DOI] [PubMed] [Google Scholar]
- Sallinen P, Saarela S, Ilves M, Vakkuri O, Leppaluoto J. The expression of MT1 and MT2 melatonin receptor mRNA in several rat tissues. Life Sci. 2005;76:1123–1134. doi: 10.1016/j.lfs.2004.08.016. [DOI] [PubMed] [Google Scholar]
- Schernhammer ES, Rosner B, Willett WC, Laden F, Colditz GA, Hankinson SE. Epidemiology of urinary melatonin in women and its relation to other hormones and night work. Cancer Epidemiol Biomarkers Prev. 2004;13:936–943. [PubMed] [Google Scholar]
- Sharman KG, Sharman EH, Bondy SC. Dietary melatonin selectively reverses age-related changes in cortical basal cytokine mRNA levels, and their responses to an inflammatory stimulus. Neurobiol Aging. 2002a;23:633–638. doi: 10.1016/s0197-4580(01)00329-3. [DOI] [PubMed] [Google Scholar]
- Sharman EH, Vaziri ND, Ni Z, Sharman KG, Bondy SC. Reversal of biochemical and behavioral parameters of brain aging by melatonin and acetyl L-carnitine. Brain Res. 2002b;957:223–230. doi: 10.1016/s0006-8993(02)03551-5. [DOI] [PubMed] [Google Scholar]
- Sharman EH, Sharman KG, Lahiri DK, Bondy SC. Age-related changes in murine CNS mRNA gene expression are modulated by dietary melatonin. J Pineal Res. 2004;36:165–170. doi: 10.1046/j.1600-079x.2003.00112.x. [DOI] [PubMed] [Google Scholar]
- Sharman EH, Sharman KG, Bondy SC. Parallel changes in gene expression in aged human and mouse cortex. Neurosci Lett. 2005;390:4–8. doi: 10.1016/j.neulet.2005.07.042. [DOI] [PubMed] [Google Scholar]
- Shoshani T, Faerman A, Mett I, Zelin E, Tenne T, Gorodin S, Moshel Y, Elbaz S, Budanov A, Chajut A, Kalinski H, Kamer I, Rozen A, Mor O, Keshet E, Leshkowitz D, Einat P, Skaliter R, Feinstein E. Identification of a novel hypoxia-inducible factor 1-responsive gene, RTP801, involved in apoptosis. Mol Cell Biol. 2002;22:2283–2293. doi: 10.1128/MCB.22.7.2283-2293.2002. [DOI] [PMC free article] [PubMed] [Google Scholar]
- Sterneck E, Paylor R, Jackson-Lewis V, Libbey M, Przedborski S, Tessarollo L, Crawley JN, Johnson PF. Selectively enhanced contextual fear conditioning in mice lacking the transcriptional regulator CCAAT/enhancer binding protein delta. Proc Natl Acad Sci U S A. 1998;95:10908–10913. doi: 10.1073/pnas.95.18.10908. [DOI] [PMC free article] [PubMed] [Google Scholar]
- Taubenfeld SM, Wiig KA, Monti B, Dolan B, Pollonini G, Alberini CM. Fornix-dependent induction of hippocampal CCAAT enhancer-binding proteins β and δ co-localizes with phosphorylated cAMP response element-binding protein and accompanies long-term memory consolidation. J Neurosci. 2001;21:84–91. doi: 10.1523/JNEUROSCI.21-01-00084.2001. [DOI] [PMC free article] [PubMed] [Google Scholar]
- Tozawa T, Mishima K, Satoh K, Echizenya M, Shimizu T, Hishikawa Y. Stability of sleep timing against the melatonin secretion rhythm with advancing age: clinical implications. J Clin Endocrinol Metab. 2003;88:4689–4695. doi: 10.1210/jc.2003-030147. [DOI] [PubMed] [Google Scholar]
- Tsai KJ, Chen SK, Ma YL, Hsu WL, Lee EH. Sgk, a primary glucocorticoid-induced gene, facilitates memory consolidation of spatial learning in rats. Proc Natl Acad Sci U S A. 2002;99:3990–3995. doi: 10.1073/pnas.062405399. [DOI] [PMC free article] [PubMed] [Google Scholar]
- von Gall C, Stehle JH, Weaver DR. Mammalian melatonin receptors: molecular biology and signal transduction. Cell Tissue Res. 2002;309:151–162. doi: 10.1007/s00441-002-0581-4. [DOI] [PubMed] [Google Scholar]
- Waterston RH, Lindblad-Toh K, Birney E, et al. Initial sequencing and comparative analysis of the mouse genome. Nature. 2002;420:520–562. doi: 10.1038/nature01262. [DOI] [PubMed] [Google Scholar]
- Wu KK. Control of cyclooxygenase-2 transcriptional activation by pro-inflammatory mediators. Prostaglandins Leukot Essent Fatty Acids. 2005;72:89–93. doi: 10.1016/j.plefa.2004.11.001. [DOI] [PubMed] [Google Scholar]
- Ye SM, Johnson RW. Regulation of interleukin-6 gene expression in brain of aged mice by nuclear factor kappaB. J Neuroimmunol. 2001;117:87–96. doi: 10.1016/s0165-5728(01)00316-2. [DOI] [PubMed] [Google Scholar]
- Yenari MA. Heat shock proteins and neuroprotection. Adv Exp Med Biol. 2002;513:281–299. doi: 10.1007/978-1-4615-0123-7_10. [DOI] [PubMed] [Google Scholar]
- Zecca L, Youdim MB, Riederer P, Connor JR, Crichton RR. Iron, brain ageing and neurodegenerative disorders. Nat Rev Neurosci. 2004;5:863–873. doi: 10.1038/nrn1537. [DOI] [PubMed] [Google Scholar]
- Zhang Z, Inserra PF, Liang B, Ardestani SK, Elliott KK, Molitor M, Watson RR. Melatonin, immune modulation and aging. Autoimmunity. 1997;26:43–53. doi: 10.3109/08916939709009549. [DOI] [PubMed] [Google Scholar]
Associated Data
This section collects any data citations, data availability statements, or supplementary materials included in this article.