

Abstract
Computational methods have been used in biology for sequence analysis (bioinformatics), all-atom simulation (molecular dynamics and quantum calculations), and more recently for modeling biological networks (systems biology). Of these three techniques, all-atom simulation is currently the most computationally demanding, in terms of compute load, communication speed, and memory load. Breakthroughs in electrostatic force calculation and dynamic load balancing have enabled molecular dynamics simulations of large biomolecular complexes. Here, we report simulation results for the ribosome, using approximately 2.64 million atoms, the largest all-atom biomolecular simulation published to date. Several other nanoscale systems with different numbers of atoms were studied to measure the performance of the NAMD molecular dynamics simulation program on the Los Alamos National Laboratory Q Machine. We demonstrate that multimillion atom systems represent a 'sweet spot' for the NAMD code on large supercomputers. NAMD displays an unprecedented 85% parallel scaling efficiency for the ribosome system on 1024 CPUs. We also review recent targeted molecular dynamics simulations of the ribosome that prove useful for studying conformational changes of this large biomolecular complex in atomic detail.
Keywords: molecular dynamics simulation, ribosome, RNA, high performance computing
1. Introduction
With the explosive growth of computational power in recent years, the biomolecular dynamics simulation community is able to attack ever more physiologically relevant biological systems. Considering that the BlueGene/L Machine of Livermore Labs is able to sustain 280 teraflops, a petaflop computer may be available in the near future. While the amount of physiological time simulated in biomolecular dynamics simulations has been the traditional benchmark for biomolecular simulation (Duan and Kollman 1998), a second dimension of measurement is equally important. The size of the system, defined by the number of atoms simulated, is crucial to make contact between theoretical and experimental studies of physiologically important systems. The lower than expected number of genes found in the sequencing of the human genome(Lander et al. 2001) has underscored the importance of complex interactions between macromolecules and macromolecular complexes. Large system sizes (i.e., Natoms > 106 and L > 10 nm, where Natoms is the number of atoms including solvent and L is the extent of the complex) are required to simulate these macromolecular machines. While embarrassingly parallel techniques have produced the thermodynamics of protein folding systems (Garcia and Onuchic 2003) and total sampling times on the order of 500 microseconds for small systems (Sorin et al. 2005), sophisticated parallel dynamic load-balancing techniques have made multimillion-atom simulations possible (Sanbonmatsu et al. 2005). Here, we briefly review progress in increasing the simulation system size and present recent performance results produced by simulations of the ribosome on the LANL Q-Machine using the NAMD simulation code. We emphasize that this review is by no means complete, but serves as a starting point for more extensive reviews.
Biomolecular dynamics simulations originally simulated very short timescale dynamics (τ ~ 10 ps, where τ is the physiological time simulated) of small proteins (bovine pancreatic trypsin inhibitor, Natoms~500) in absence of solvent molecules due to limitations in compute power (McCammon 1977; Karplus and McCammon 2002). Increases in computing power allowed inclusion of solvent for small systems (bovine pancreatic trypsin inhibitor, Natoms~3100, τ ~ 25 ps) (Van Gunsteren and Karplus 1982). Fast multipole algorithms were used to achieve simulation sizes of 1.26 x10⁴ (τ ~ 40 ps, photosynthetic reaction center of Rhodopseudomonas viridis) (Heller et al. 1990), 2.4x10⁴ (POPC lipid bilayer patch) (Board et al. 1992), and 3.6x10⁴ atoms (τ ~ 1 ps, estrogen receptor binding domain plus DNA complex) (Nelson et al. 1996). Simulations of the HIV-1 protease using a CRAY YMP with vector parallelization were also performed (Natoms ~ 2.3x10⁴, τ ~ 40 ps) (Harte et al. 1992).
An impressive multipole simulation of the tomato bushy stunt virus was performed (Natoms ~ 4.88x10⁵, τ ~ 5 ps); however the simulation utilized the symmetry properties of the virus by imposing symmetry constraints and included approximately 8x10³ independently moving atoms (Mathiowetz et al. 1994). The fast multipole method was also combined with a multiple-time-step method to simulate systems of 3.6x10⁴ atoms (Streptavidin, τ ~ 1.2 ns) (Eichinger et al. 1997). Binding of the estrogen receptor to DNA was studied in the same year using a fast multiple method (Natoms ~ 3.6x10⁴, τ ~ 100 ps) (Kosztin et al. 1997). A significant improvement in parallelization was made using Eulerian domain decomposition with dynamic load-balancing to simulate the solvated acetylcholinesterase dimer in absence of long-range forces (Natoms = 131,660, τ ~ 0.2 ps) (Clark et al. 1994; Eichinger et al. 1997).
The particle mesh Ewald algorithm (Darden et al. 1993), which evaluates the electrostatic term of the molecular dynamics potential, enabled extremely efficient calculations of long-range forces and is used for the majority of biomolecular simulations performed today (Young et al. 2001; Hansson et al. 2002; Karplus and McCammon 2002; Tajkhorshid et al. 2002; Grater et al. 2005; Grubmuller 2005). This algorithm has played a key role in producing stable trajectories of nucleic acid molecules (Auffinger and Westhof 1998; Auffinger et al. 1999; Sarzynska et al. 2000; Auffinger and Westhof 2001; Sanbonmatsu and Joseph 2003; Cheatham 2004; Spackova and Sponer 2006). Particle-mesh Ewald simulations using the NAMD code of FN-III (Natoms~1.26x10⁵, sampling of 12 ns for the entire study) were also performed (Gao et al. 2002). A large particle-mesh Ewald simulation of electroporation of a DOPC lipid bilayer (Natoms~4.2x10⁵, τ > 3.5 ns) (Tieleman 2004) was recently performed using GROMACS (Van Der Spoel et al. 2005). We note that a large coarse grain calculation (Nparticles > 4x10⁵) of phospholipid vesicle formation was performed using a screened coulomb potential, neglecting long-range forces (Marrink and Mark 2003).
Finally, more sophisticated dynamic load balancing in the NAMD code has produced simulations of > 3x10⁵ atoms using the Pittsburgh Supercomputing center Lemieux machine with 1 GB RAM per processor (f1ATPase macromolecular complex, 3.26x10⁵ atoms)(Phillips et al. 2002), and, more recently, the satellite tobacco mosaic virus using the NCSA Cobalt machine with ~ 4GB RAM/CPU (~106 atoms)(Freddolino et al. 2006). The improved load-balancing was achieved by replacing spatial domains by meta-domains, based on compute-load, as the smallest parallel decomposition unit. In particular, NAMD is built on top of the C++ parallel interface, CHARM++ (Kale and Kirshnan 1996). CHARM++ uses a more general form of domain decomposition where, in addition to spatial domain decomposition, a second level of parallelization is used, namely the distribution of the force calculation for each particle across processors. As in standard spatial decomposition, particles are divided into cubes according to their position in the spatial domain (a cube is referred to as a 'patch' in CHARM++ nomenclature). A computational object is then created for each pair of neighboring cubes. This object is then decomposed into a number of sub-objects based on the different contributions to the force (e.g., bond, angle, dihedral, constraint and electrostatic contributions). However, this division into subsets of interactions does not give equal computational weight to each term in the potential, but is constructed to yield equal computational work to each computational object, producing unprecedented load-balancing for biomolecular systems with long-range forces. When the calculation for a given patch requires data from other processors, a proxy patch is used, in a manner analogous to ghost cells in conventional domain decomposition. The parallel decomposition performance is measured during the simulation and the distribution of compute objects on processors is changed throughout the simulation to ensure optimal load-balancing. The key advantage of CHARM+++ is that it enables the overlap of compute and communication operations, dramatically improving parallel performance. We emphasize that the implementation of this algorithm is more complicated than this simplistic description and has been described in detail previously (Kale and Kirshnan 1996; Phillips et al. 2002).
While this method represents a significant breakthrough in scaling, the memory overhead for this particular implementation is prohibitive, in the sense that simulations of RNA complexes with counter ions with Natoms > 2x10⁶ atoms require more than 2 GB RAM per processor. In particular, using the Los Alamos National Laboratory Q Machine (SC03 2004), we have found that these simulations can be performed with 4 GB RAM per processor but cannot be performed with 1 GB RAM per processor. We have simulated the dynamics of the ribosome (2.64x10⁶ atoms) for a total of 22 ns sampling (including one 4 ns trajectory and many 2 ns trajectories) using the Los Alamos Q-Machine and the NAMD molecular dynamics package of Klaus Schulten and coworkers (Kale et al. 1999).
In figure 1 we show the largest sustained-performance biomolecular simulations, to our knowledge, performed to date at the time of publication. We define “sustained-performance simulations” as simulations lasting ~10 ps or longer, requiring on the order of 5x10³ to 104 time steps, depending on the particular time step chosen. This definition includes early production quality simulations, but excludes simulations performed merely for the purposes of benchmarking or performance testing. We note that in several cases, systems used for performance testing were eventually simulated for production-length time scales; however, these simulations were published after the publication of production-length simulations of larger systems and therefore were not the largest sustained-performance simulations at the time of publication.
Figure 1.
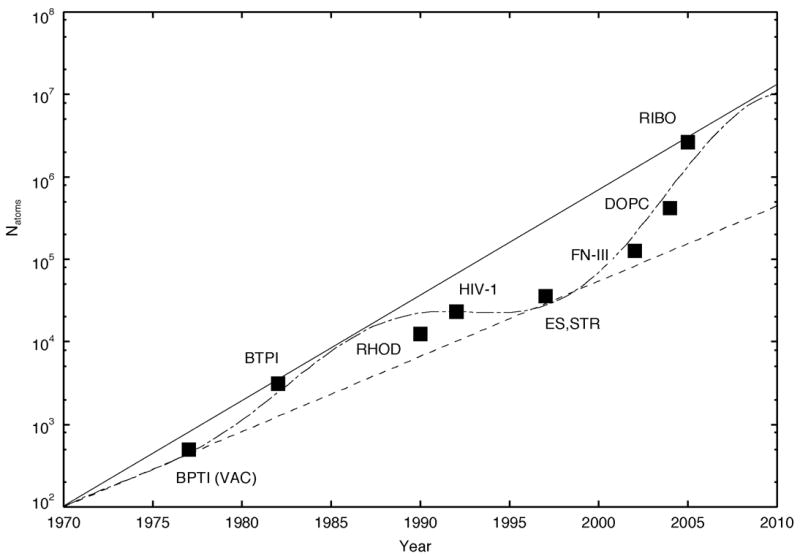
Increase in simulation system size with respect to year simulated. The largest bio-molecular sustainted performance simulations to date at the time of publication to our knowledge are shown. All simulations include explicit solvent unless otherwise noted. BPTI (VAC), bovine pancreatic trypsin inhibitor without solvent (McCammon 1977; Karplus and McCammon 2002); BPTI, bovine pancreatic trypsin inhibitor with solvent (Van Gunsteren and Karplus 1982); RHOD, photosynthetic reaction center of Rhodopseudomonas viridis (Heller et al. 1990); HIV-1, HIV-1 protease (Harte et al. 1992) ; ES, estrogen-DNA (Kosztin et al. 1997); STR, streptavidin (Eichinger et al. 1997); FN-III (Gao et al. 2002); DOPC, DOPC lipid bilayer (Tieleman 2004); RIBO, ribosome (Sanbonmatsu et al. 2005). Solid curve, Moore’s law doubling every 28.2 months. Dashed curve, Moore’s law doubling every 39.6 months. Dot-dashed curve, sinosoidal doubling fit (described in text).
The same set of simulations would be included by another definition requiring simulations of length 10 ps for years 1970–1979, 10–100 ps for years 1980–1995, 100 ps - 1 ns for years 1995–1999, and 1 ns - 100 ns for years 2000–2007. This definition reflects “typical” simulation lengths for a given historical time period. While this definition may appear to be be the most useful, it is also the most arbitrary and subjective (unless one were to record the simulation times of a large number of published simulations and average over these simulation times). A third definition uses the number of CPU-hours required for the simulation; however, this definition “punishes” computers with faster CPUs, requiring longer physiological times for computers with faster CPUs. The 10 ps “sustained performance” definition happens to be sufficient for the purposes of this discussion because, to date, simulation times for performance studies have been less than 10 ps. However, an improved definition may be necessary in the future to exclude performance studies with simulation times > 10 ps. Finally, we emphasize that while our list is by no means complete nor definitive, we provide the list as a first step in compiling a complete list.
Figure 1 also displays so-called “Moore’s law” curves of the form, a2(t-t0)/τM, where a=100 atoms, t0 = 1970 years, and τM = 2.35 years (28.2 months) for the solid curve and 3.3 years (39.6 months) for the dashed curve. The dot-dashed curve depicts a crude and arbitrary fit of the simulation size data points of the form, a2(b(t-t0)+c(t-t0)sin2d(t-t0+φ))/τM, where a = 100 atoms, b = 0.99, c = 0.4, d = 0.14, t0 = 1970 years, φ = −5 years, and τM = 3.3 years (39.6 months). Since 1977, the increase in system size appears to lag behind the traditional Moore’s law of doubling every 18 months, possibly due to the inefficiencies of biomolecular dynamics simulation codes, with respect to single CPU usage and parallelization. However, in the past four years, the system size has doubled approximately every nine months, out-pacing the traditional Moore’s law. This is consistent with the appearance of more efficient code and the fact that the increase in speed of supercomputers is also out-pacing the traditional Moore’s law. Extrapolating along our sinosoidal doubling curve (dot-dashed curve in Fig. 1), a simulation size of Natoms~107 is expected by 2010.
Biomolecular dynamics simulations originally focused on protein dynamics (Doniach and Eastman 1999), drug design, and protein folding (Karplus and McCammon 2002; Gnanakaran et al. 2003). More recently, progress has been made in simulating the conformational changes occurring in large protein complexes (Elcock 2002; Karplus and McCammon 2002), Attention has shifted to understanding gene expression, which is a major focus of molecular biology. In this case, emphasis is placed on how molecular machines (generally taking the form of large protein or ribonulceoprotein complexes) perform their function, i.e. the molecular basis for conformational changes which occur during gene expression (Bockmann and Grubmuller 2002; Sanbonmatsu et al. 2005). The understanding of macromolecular complexes in atomic detail is of great importance in understanding gene expression. In particular, molecular dynamics simulations of molecular machines make contact between phenomenological systems biology models of gene expression and all-atom crystallography structures of molecular machines.
In this work, we focus on the ribosome, a molecular machine that is central to the genetic code. The ribosome is responsible for translating genetic information from the 4-letter alphabet of nucleic acid to the 20-letter alphabet of protein. The ribosome is one of the most highly conserved biomolecules across species and constitutes a substantial fraction of the dry mass of the cell (~25% in E. coli). In addition to its important biological role, the ribosome is also the target of several large classes of antibiotics (Brodersen et al. 2000). The ribosome simulations described below not only examine a crucial molecular machine for gene expression, but have also opened the door for simulations of large molecular machines important for gene expression and drug design.
2. Materials and Methods
2.1. Los Alamos National Laboratory Q Machine
The Los Alamos National Laboratory Q Machine currently has 2048 HP Alphaserver ES45 nodes, each with 4 EV6 1.25 GHz CPUs and an 8 MB cache. Nodes are connected with a Quadrics high speed interconnect with ~2 μs latency and 300 MB/s bandwidth. 256 nodes have 16 GB RAM (i.e., 1024 CPUs with 4 GB RAM per CPU). A second machine (“QSC”) of 256 nodes has identical architecture. Each node on the QSC cluster has 16 GB RAM, or 4 GB RAM per processor. Application simulations were performed on 768 processors on the Q machine cluster and 512 processors on the QSC cluster. Scaling simulations achieved a maximum of ~437 GFLOP/s on the QSC cluster using 1024 processors.
2.2. Simulation Set-up
To understand the parallelization efficiency measured for the ribosome simulation in comparison to previous scaling studies, several systems with different numbers of atoms were studied. Three ribosome simulations were performed: (1) the small subunit of the ribosome, Natoms ~ 1.07x10⁶, two simulations of 8.9 ns and 13 ns, based on PDB structure 1J5E (Wimberly et al. 2000); (2) the 70S ribosome, Natoms ~ 2.03x10⁶, one simulation of 10.45 ns, based on model described previously (Tung and Sanbonmatsu 2004); (3) larger 70S ribosome system with larger messenger RNA, Natoms ~ 2.64x10⁶, one 4 ns simulation, based on model described previously (Sanbonmatsu et al. 2005). Furthermore, simulations of (4) the ribosomal decoding center (Natoms ~ 1.63x10⁴) (Sanbonmatsu and Joseph 2003) and (5) transfer RNA (Natoms ~ 5.73x10⁴) were performed. Finally, to make contact with previous scaling studies (Phillips et al. 2002), the NAMD benchmark systems (6) apoa1 (Natoms ~ 9.22x10⁴) and (7) f1ATPase (Natoms ~ 3.28x10⁵), were studied. Two sets of simulations were performed for the NAMD benchmark systems, one using parameters similar to those used in previous studies and a second set of simulations using parameters used in our ribosome simulations (described below).
In simulations (1)–(5), ions were placed randomly in a box around the solute at concentrations of 0.1 M KCl and 7 mM MgCl2. Ions were then equilibrated with the NAMD molecular dynamics simulation code and AMBER force field using a continuum water model with 5 Å radius for the ions to ensure electrostatic energy convergence. In the case of the whole ribosome simulations, the ion-solute systems were equilibrated for 10 ns. Energy equilibrium was reached in approximately 1.5 ns. Subsequently, the ion-solute systems were embedded in a TIP3P water solvent box using the solvate routine (Kale et al.). The ion-solvent-solute systems were minimized using steepest descent minimization. Next the solvent and ions were gradually heated via constant volume molecular dynamics and temperature coupling from temperature T =10 K to T=300 K over 200 ps, while keeping the solute fixed in place.
The system was then equilibrated with respect to volume running at constant pressure, P= 1 atm, for 200 ps using Langevin-Nose-Hoover pressure coupling. The solute was then restrained with harmonic positional restraints at 200 kcal/mol Å2 which were gradually lowered to 1 kcal/mol Å2 over ~ 1.2 ns. The restraints were set to 0 with the exception of bases near the large subunit proteins in the 70S ribosome systems, which could not be modeled in the case of 70S ribosome simulations. The restraints are used to mimic the presence of these missing proteins. The total equilibration time was approximately 1.6 ns. A similar procedure was followed for the other systems, with the exception of the NAMD benchmark systems. For production molecular dynamics with solvent, all simulations use a time step of 2 fs, SHAKE constraints on all hydrogens, particle mesh Ewald electrostatics with a grid spacing of ~ 1 Å, cutoff = 9 Å, multiple time steps, the AMBER force field, constant pressure and NAMD unless otherwise stated. We chose a time step of 2 fs, SHAKE and the cutoff = 9 Å as an efficient set of parameters that is consistent with our previous work as well as the work of many others using the AMBER suite of simulation codes for protein and nucleic acid (Cheatham and Kollman 2000; Garcia and Sanbonmatsu 2001; Auffinger and Westhof 2002; Case et al. 2002; Sanbonmatsu and Joseph 2003).
We purposely repeated the NAMD benchmark system simulations with two sets of parameters to compare our simulation performance results to those of previous studies. The starting structure of the apoa1 system was taken from the NAMD benchmark website (Phillips 2005). The starting structure of the f1ATPase system was obtained from Jim Phillips (Jim Phillips, private communication) and was described previously (Phillips et al. 2002). The first set of parameters for these systems (apoa1 and f1ATPase) was similar to those used above. The second set was identical to those used for the previous benchmark simulations (Phillips et al. 2002). The second set of parameters uses a time step of 1 fs, no SHAKE constraints, constant volume and a cutoff = 12 Å. Both sets of simulations of the benchmark systems used the CHARMM force field.
2.3. Performance measurement
Performance of NAMD on the Q Machine as a function of processors and number of atoms was measured based on short test simulation runs. Results are reported in FLOP/s, where the number of floating point operations per cycle for each system was determined by the perfex monitoring utility. To measure the total number of floating point operations per time step, the perfex utility was used for single processor simulations of each simulation system on the LANL Theta SGI Origin 2000 system, as done previously by Phillips and coworkers (Phillips et al. 2002). Operation counts for 20 and 40 steps were calculated to remove startup operations as previously (Phillips et al. 2002). To measure execution time, production solute/solvent/ion systems were prepared as described above. Once equilibrated, restart simulations were run for 200 cycles, load balanced by complete reassignment based on measurement over cycles 100–200, and load balanced again by refinement based on measurement over cycles 300–400. Execution time was measured over steps 2100–2440 after restart. For single processor simulations, restart runs were performed starting at step 2020. Execution time was measured over steps 2100–2440.
3. Performance Results
The major result of our performance study is the demonstration of the increase in performance with respect to the number of atoms simulated. This results from the increase in the ratio between the compute time and the communication time as a function of the system size, which is expected for efficient parallel code. Figures 2a and 3 display the increase in performance as a function of the number of processors. For the apao1 (Natoms = 9.22x10⁴) and f1atpase (Natoms = 3.28x10⁵) comparison systems, two curves are shown. The solid curves with filled triangles and circles represent system parameters with dt= 2 fs and cutoff = 9 Å. The dashed curves with open triangles and circles represent system parameters with dt= 1 fs and cutoff = 12 Å. The number of operations in the apoa1 system with dt = 1 fs and cutoff = 12 Å is approximately 83% greater than with dt = 2 fs and cutoff = 9 Å. The number of operations in the f1atpase system is 92% greater. Thus, due to the larger number of local interactions (proportional to ~(12 Å/9 Å)3 ), the compute load is significantly greater when using the Phillips, et al. parameters. As a result, the scaling and performance is greater; however, the execution time is significantly longer (Fig. 2b). Furthermore, the physiological time simulated per wall clock day is substantially lower with the Phillips parameters due to the smaller time step (Fig. 4). Our peak performance was achieved for the whole ribosome system (Natoms ~ 2.64x10⁶) at 437 GFLOP/s.
Figure 2.
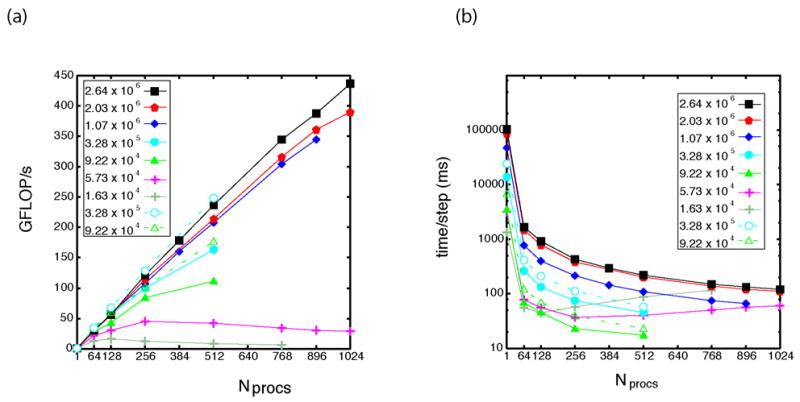
Performance of NAMD on the LANL Q-Machine as a function of number of atoms. Solid symbols used a cutoff of 9 Å and dt = 2 fs with SHAKE. Open symbols used a cutoff of 12 Å and dt = 1 fs without SHAKE (Phillips, et al. parameters), resulting in a factor of ~2 increase in compute load and higher parallel efficiency but longer wall clock time per step. (a) Performance measured in GFLOP/s vs. number of processors. Performance increases with increasing system size. (b) Execution time per step as a function of the number of processors.
Figure 3.

Parallel performance curve. Speed-up as a function of processors for systems with different numbers of atoms. Black curve represents ideal speed-up.
Figure 4.

Physiological time simulated vs. number of processors for different numbers of atoms. The ‘turn-over’ in efficiency occurs between Natoms = 5.73x10⁴ and 9.22x10⁴.
The relative performance as a function of processors has a speed-up of ~867 for the larger whole ribosome system (~85% efficient), where efficiency = speed-up/Nprocs, speed-up = t1/tNprocs, t1 is the execution time on a single processor without MPI and tNprocs is the execution time on Nprocs processors (Fig. 3). A “turnover” in performance with respect to the number of atoms results from the increase in the ratio between the compute time and the communication time. That is, the compute time scales with the number of atoms. For systems with small numbers of atoms, the communication time between processors is actually longer than than the compute time, resulting in poor scaling with respect to processor number. For example, in the case of Natoms = 1.63x10⁴, simulations on 1024 CPUs are much slower than simulations on 256 CPUs. For systems with large numbers of atoms, the communication time is much smaller than the compute time, resulting in efficient scaling. Thus, in the case of Natoms = 2.64x10⁶, simulations on 1024 CPUs approach speeds four times faster than simulations on 256 CPUs. The turnover in speed-up occurs near Nprocs=256 and 5.73x10⁴< Natoms < 9.22x10⁴.
The increase in performance with respect to the number of atoms is shown explicitly in Fig. 5 for the case of Nprocs = 512. The large increase between Natoms= 5.73x10⁴ and Natoms =9.22x10⁴ corresponds to the turnover point. The higher performance curve (black dashed curve) uses the Phillips parameters, which have a significantly larger compute load than our parameters for the same number of atoms. To compare execution times between systems with different numbers of atoms, we also show the physiological time simulated per day multiplied by the total number of atoms in the simulation (Natoms x ns /day).
Figure 5.
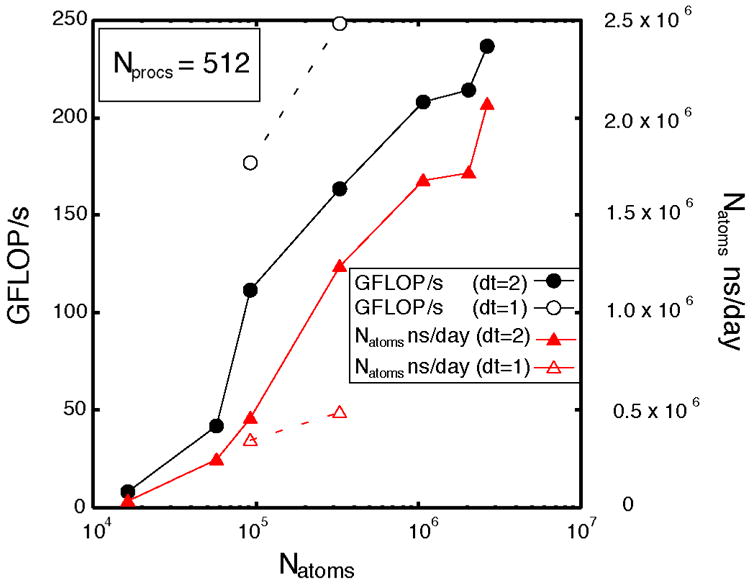
Performance vs. the number of atoms (black curves) and total number of atoms-ns simulated per day vs. number of atoms (red curves) for a constant number of processors (Nprocs =512). Dashed curves with open symbols use Phillips, et al. parameters.
Memory usage vs. the number of processors for different system sizes is displayed in Fig. 6. The memory usage of the master node is shown; however, we note that simulations using > 1024 processors with > 2x10⁶ atoms terminated with memory problems even when running with the master on a 16 GB node (4 GB/process) and other processes on 4 GB nodes (1 GB/process). Figure 6 shows that NAMD requires more than 2 GB/process for simulations with Nprocs > 768 and Natoms > 2x10⁶.
Figure 6.

Memory usage vs. number of processors for different numbers of atoms. Simulations with Natoms > 2x10⁶ require > 2 GB RAM per processor.
4. Targeted Molecular Dynamics Simulations
To illustrate the utility of large-scale simulations, we briefly review results of targeted molecular dynamics simulations that simulate the conformational change on the ribosome occurring during the accommodation of tRNA by the ribosome during decoding. During accommodation, the aminoacyl tRNA moves from the A/T state to the A/A state. This conformational change is the rate-limiting step of decoding for the acceptance of cognate (Gromadski and Rodnina 2004). While calculations based on coarse grain sequence-independent potentials have observed many interesting conformational changes, these methods have not captured the accommodation motion of tRNA into the ribosome during decoding (Tama et al. 2003; Trylska et al. 2005).
Because the accommodation rate of cognate tRNAs is ≈ 7/s (Gromadski and Rodnina 2004), we have implemented the targeted MD algorithm (Schlitter et al. 1994; Ma et al. 2000; Young et al. 2001) in explicit solvent (Fig. 7), which gradually reduces the root-mean-squared distance (RMSD) of the complex to the A/A state while allowing thermal fluctuations of the structure at any given RMSD. Thus, the simulation provides a stochastic pathway from the A/T state to the A/A state. The targeted molecular dynamics simulations produce stereochemically feasible pathways with candidate tRNA-rRNA interactions that can be tested via site-directed mutagenesis. The simulations were described in detail previously and will thus be summarized (Sanbonmatsu et al. 2005). To simulate single accommodation events, as opposed to spontaneous rates, eight simulations were performed with durations of 2 ns each. To determine whether numerical artifacts were introduced due to the time scale, simulations of 1 ns and 4 ns were also performed.
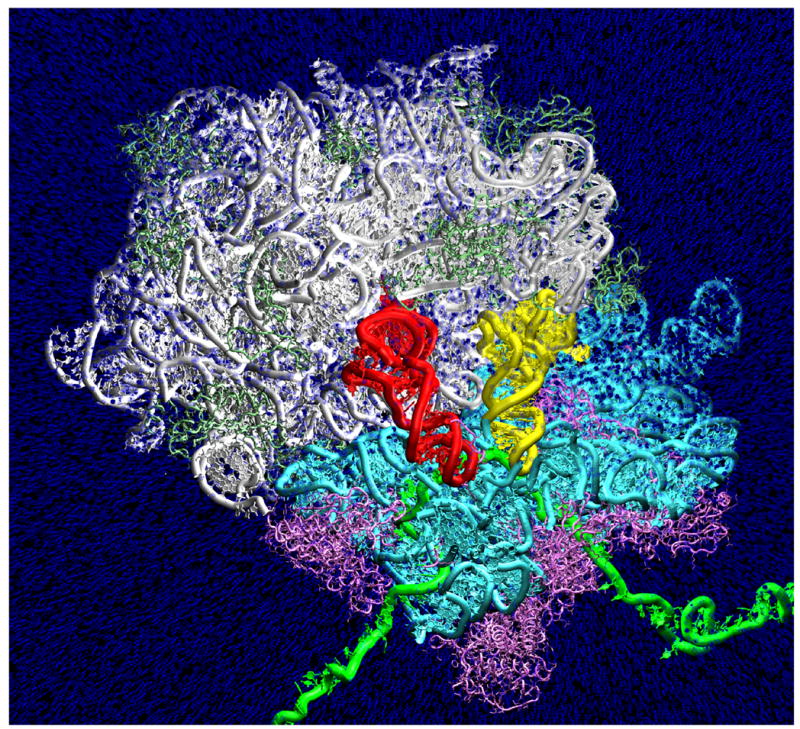
Figure 7.

Solvation shell of the ribosome. Cyan, water density contours at ~ 3 times the bulk density, averaged over 1 ns. White = small subunit, Green = large subunit, Pink = mRNA, Red = aminoacyl-tRNA, Yellow = peptidyl-tRNA.
As expected, the body of the aminoacyl-tRNA relaxes from the kinked A/T state(Valle et al. 2003) to the native-like A/A state (Fig. 8). An accommodation wall region is defined by the motion of the acceptor arm and elbow of the tRNA, as it sweeps over the large ribosomal subunit during accommodation. Specifically, large subunit helix LH89 is positioned to act as a guide rail, ensuring that fluctuations in the tRNA elbow angle are sufficiently small to allow the 3’-CCA end to reach the peptidyl transferase center. LH38 and LH69 are positioned to prevent the aminoacyl-tRNA from over-shooting its A/A state equilibrium position.
Figure 8.
Aminoacyl-tRNA moves from the A/T state to the A/A state during the targeted molecular dynamics simulations. Blue, oxygen atom on every 5th water molecule. White, 23S rRNA; light green, 50S ribosomal proteins; cyan, 16S rRNA; magenta, 30S ribosomal proteins; yellow, aminoacyl-tRNA; red, peptidyl-tRNA; green, mRNA. The top portion of the simulation domain is not shown in order to display the full tRNAs.
Interestingly, the 23S rRNA A-loop (H92) is positioned to block the entrance of the 3’-CCA end of the aminoacyl-tRNA into the peptidyl transferase center (Fig. 9). During the simulations, the CCA end indeed flexes backwards relative to the motion of the tRNA body as the CCA end encounters the A-loop. Subsequently, both the CCA end and the A-loop flex, allowing the CCA end to enter the peptidyl transferase center (Fig. 9). The flexing of the CCA end is significant and constitutes a second flex region on the tRNA, in addition to that discovered by Frank and co-workers (Valle et al. 2003). The 4 ns validation simulation displayed similar behavior demonstrating that 4 ns simulations offer little new information in comparison to 2 ns simulations (Sanbonmatsu et al. 2005).
Figure 9.
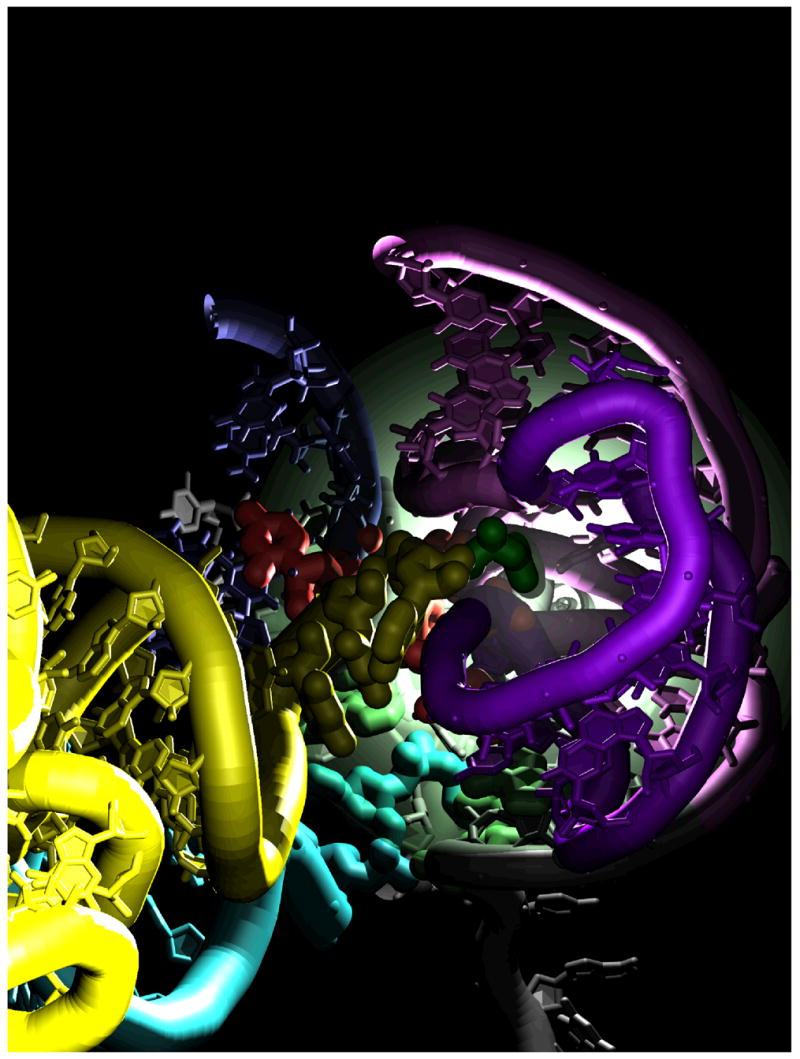
Entrance of the aminoacyl-tRNA 3’-CCA end (yellow) into the peptidyl transferase center of the large ribosomal subunit. Green, aminoacyl-tRNA amino acid; purple, 23S rRNA A-loop (LH92); pink, 23S rRNA LH90; blue, 23S rRNA LH89; red, universally conserved accommodation gate nucleotides; light green, peptidyl transferase center nucleotides that interact with the 3’-CCA end in the x-ray crystallography structure representing A/A state; cyan, peptidyl-tRNA amino acid.
The simulations produced interactions between the aminoacyl-tRNA and the 10 universally conserved 23S rRNA nucleotides (2451, 2452, 2506, 2508, 2553, 2583, 2584, 2585, 2662, 2663) identified previously by x-ray crystallography(Hansen et al. 2002) and cryo-EM(Valle et al. 2003). In addition, the simulations identified 8 universally conserved 23S rRNA nucleotides (1943, 1953, 1955, 2492, 2552, 2556, 2573, 2602) as important for accommodation that cannot be observed in x-ray crystallography or cryo-EM because the interactions occur during the process of accommodation, rather than before or after accommodation.
The simulation results demonstrate the suitability of the targeted molecular dynamics algorithm for this particular problem. We emphasize that the accommodation problem differs significantly from that of protein folding. While protein folding requires exhaustive sampling of conformational space, accommodation essentially consists of two hinge movements of the tRNA inside a largely immobile ribosome. Because the tRNA itself is almost entirely constrained by steric interactions with the ribosome, accommodation requires a miniscule exploration of conformational space due to the small number of possibilities available (in comparison to protein folding), be it in vitro, in vivo or in silico. Targeted molecular dynamics allows us to produce accommodation pathways that are entirely consistent with experimentally determined initial and final states.
Acknowledgments
We are grateful to the LANL Q machine committee, especially Andy White and Manuel Vigil, for Institutional Computing. The work was performed under the auspices of the U.S. Department of Energy contract W-7405-ENG-36 and supported by NIH grant R01-GM072686. The authors are grateful to Jim Phillips for assistance in porting NAMD to the ASC Q Machine and for providing the f1APTase benchmark system for testing purposes. We thank Laura Monroe for assistance with visualization and Angel E. Garcia for useful discussions.
Footnotes
Publisher's Disclaimer: This is a PDF file of an unedited manuscript that has been accepted for publication. As a service to our customers we are providing this early version of the manuscript. The manuscript will undergo copyediting, typesetting, and review of the resulting proof before it is published in its final citable form. Please note that during the production process errors may be discovered which could affect the content, and all legal disclaimers that apply to the journal pertain.
References
- Auffinger P, LouiseMay S, Westhof E. Molecular dynamics simulations of solvated yeast tRNA(Asp) Biophysical Journal. 1999;76(1pt 1):50–64. doi: 10.1016/S0006-3495(99)77177-8. [DOI] [PMC free article] [PubMed] [Google Scholar]
- Auffinger P, Westhof E. Simulations of the molecular dynamics of nucleic acids. Current Opinion in Structural Biology. 1998;8(2):227–236. doi: 10.1016/s0959-440x(98)80044-4. [DOI] [PubMed] [Google Scholar]
- Auffinger P, Westhof E. Water and ion binding around r(UpA)(12) and d(TpA)(12) oligomers: Comparison with RNA and DNA (CpG)(12) duplexes. Journal of Molecular Biology. 2001;305(5):1057–1072. doi: 10.1006/jmbi.2000.4360. [DOI] [PubMed] [Google Scholar]
- Auffinger P, Westhof E. Melting of the solvent structure around a RNA duplex: a molecular dynamics simulation study. Biophys Chem. 2002;95(3):203–210. doi: 10.1016/s0301-4622(01)00257-5. [DOI] [PubMed] [Google Scholar]
- Board J, Causey J, Leathrum J, Windemuth A, Schulten K. Accelerated molecular dynamics simulation with the parallel fast multipole algorithm. Chemical Physics Letters. 1992;198:89–94. [Google Scholar]
- Bockmann RA, Grubmuller H. Nanoseconds molecular dynamics simulation of primary mechanical energy transfer steps in F1-ATP synthase. Nature Structural Biology. 2002;9(3):198–202. doi: 10.1038/nsb760. [DOI] [PubMed] [Google Scholar]
- Brodersen DE, Clemons WM, Carter AP, Morgan-Warren RJ, Wimberly BT, Ramakrishnan V. The structural basis for the action of the antibiotics tetracycline; pactamycin; and hygromycin B on the 30S ribosomal subunit. Cell. 2000;103(7):1143–1154. doi: 10.1016/s0092-8674(00)00216-6. [DOI] [PubMed] [Google Scholar]
- Case DA, Pearlman DA, Caldwell JW, Cheatham TE, III, Wang J, Ross WS, Simmerling CL, Darden TA, Merz KM, Stanton RV, Cheng AL, Vincent JJ, Crowley M, Tsui V, Gohlke H, Radmer RJ, Duan Y, Pitera J, Massova I, Seibel GL, Singh UC, Weiner PK, Kollman PA. AMBER. University of California, San Francisco; San Francisco: 2002. [Google Scholar]
- Cheatham TE., 3rd Simulation and modeling of nucleic acid structure, dynamics and interactions. Curr Opin Struct Biol. 2004;14(3):360–367. doi: 10.1016/j.sbi.2004.05.001. [DOI] [PubMed] [Google Scholar]
- Cheatham TE, Kollman PA. Molecular dynamics simulation of nucleic acids. Annual Review of Physical Chemistry. 2000;51:435–471. doi: 10.1146/annurev.physchem.51.1.435. [DOI] [PubMed] [Google Scholar]
- Clark TW, Hanxleden RV, McCammon JA, Scott LR. Parallelizing Molecular Dynamics using Spatial Decomposition; Proceedings of the Scalable High-Performance Computing Conference; 1994. pp. 95–102. [Google Scholar]
- Darden T, York D, Pedersen L. Particle Mesh Ewald: An N. Log(N) Method for Ewald Sums in Large Systems. Journal of Chemical Physics. 1993;98(12):10089–10092. [Google Scholar]
- Doniach S, Eastman P. Protein dynamics simulations from nanoseconds to microseconds. Current Opinion in Structural Biology. 1999;9:157–163. doi: 10.1016/S0959-440X(99)80022-0. [DOI] [PubMed] [Google Scholar]
- Duan Y, Kollman PA. Pathways to a protein folding intermediate observed in a 1-microsecond simulation in aqueous solution. Science. 1998;282(5389):740–744. doi: 10.1126/science.282.5389.740. [DOI] [PubMed] [Google Scholar]
- Eichinger M, Grubmuller H, Heller H, Tavan P. FAMUSAMM: An Algorithm for rapid evaluation of electrostatic interactions in molecular dynamics simulations. Journal of Computational Chemistry. 1997;18(14):1729–1749. [Google Scholar]
- Elcock AH. Modeling supramolecular assemblages. Current Opinion in Structural Biology. 2002;12:154–160. doi: 10.1016/s0959-440x(02)00303-2. [DOI] [PubMed] [Google Scholar]
- Freddolino PL, Arkhipov AS, Larson SB, McPherson A, Schulten K. Molecular dynamics simulations of the complete satellite tobacco mosaic virus. Structure. 2006;14(3):437–449. doi: 10.1016/j.str.2005.11.014. [DOI] [PubMed] [Google Scholar]
- Gao M, Craig D, Vogel V, Schulten K. Identifying unfolding intermediates of FN-III(10) by steered molecular dynamics. J Mol Biol. 2002;323(5):939–950. doi: 10.1016/s0022-2836(02)01001-x. [DOI] [PubMed] [Google Scholar]
- Garcia A, Onuchic J. Folding a protein in a computer: An atomic description of the folding/unfolding of protein A. Proc Natl Acad Sci USA. 2003;100(24):13898–13903. doi: 10.1073/pnas.2335541100. [DOI] [PMC free article] [PubMed] [Google Scholar]
- Garcia A, Sanbonmatsu K. Exploring the energy landscape of a beta hairpin in explicit solvent. Proteins. 2001;42(3):345–354. doi: 10.1002/1097-0134(20010215)42:3<345::aid-prot50>3.0.co;2-h. [DOI] [PubMed] [Google Scholar]
- Gnanakaran S, Nymeyer H, Portman J, Sanbonmatsu K, Garcia A. Peptide folding simulations. Curr Op Struct Biol. 2003;13(2):168–174. doi: 10.1016/s0959-440x(03)00040-x. [DOI] [PubMed] [Google Scholar]
- Grater F, Shen J, Jiang H, Gautel M, Grubmuller H. Mechanically induced titin kinase activation studied by force-probe molecular dynamics simulations. Biophys J. 2005;88(2):790–804. doi: 10.1529/biophysj.104.052423. [DOI] [PMC free article] [PubMed] [Google Scholar]
- Gromadski KB, Rodnina MV. Kinetic determinants of high-fidelity tRNA discrimination on the ribosome. Mol Cell. 2004;13(2):191–200. doi: 10.1016/s1097-2765(04)00005-x. [DOI] [PubMed] [Google Scholar]
- Grubmuller H. Force probe molecular dynamics simulations. Methods Mol Biol. 2005;305:493–515. doi: 10.1007/978-1-59259-912-7_23. [DOI] [PubMed] [Google Scholar]
- Hansen JL, Schmeing TM, Moore PB, Steitz TA. Structural insights into peptide bond formation. Proc Natl Acad Sci U S A. 2002;99(18):11670–11675. doi: 10.1073/pnas.172404099. [DOI] [PMC free article] [PubMed] [Google Scholar]
- Hansson T, Oostenbrink C, van Gunsteren W. Molecular dynamics simulations. Curr Opin Struct Biol. 2002;12(2):190–196. doi: 10.1016/s0959-440x(02)00308-1. [DOI] [PubMed] [Google Scholar]
- Harte WE, Jr, Swaminathan S, Beveridge DL. Molecular dynamics of HIV-1 protease. Proteins. 1992;13(3):175–194. doi: 10.1002/prot.340130302. [DOI] [PubMed] [Google Scholar]
- Heller H, Grubmuller H, Schulten K. Molecular dynamics simulation on a parallel computer. Molecular Simulation. 1990;5:133–165. [Google Scholar]
- Kale L, Skeel R, Bhandarkar M, Brunner R, Gursoy A, Krawetz N, Phillips J, Shinozaki A, Varadarajan K, Schulten K. http://www.ks.uiuc.edu/Research/vmd/plugins/
- Kale L, Skeel R, Bhandarkar M, Brunner R, Gursoy A, Krawetz N, Phillips J, Shinozaki A, Varadarajan K, Schulten K. NAMD2: Greater scalability for parallel molecular dynamics. Journal of Computational Physics. 1999;151(1):283–312. [Google Scholar]
- Kale LV, Kirshnan S. In: Charm++: parallel programming with message-driven objects. in Parallel Programming using C++ Wilson GV, Lu P, editors. MIT Press; Boston: 1996. pp. 175–213. [Google Scholar]
- Karplus M, McCammon J. Molecular dynamics simulations of biomolecules. Nature Structural Biology. 2002;9(9):646–652. doi: 10.1038/nsb0902-646. [DOI] [PubMed] [Google Scholar]
- Kosztin D, Bishop TC, Schulten K. Binding of the estrogen receptor to DNA. The role of waters. Biophys J. 1997;73(2):557–570. doi: 10.1016/S0006-3495(97)78093-7. [DOI] [PMC free article] [PubMed] [Google Scholar]
- Lander ES, Linton LM, Birren B, Nusbaum C, Zody MC, Baldwin J, Devon K, Dewar K, Doyle M, FitzHugh W, Funke R, Gage D, Harris K, Heaford A, Howland J, Kann L, Lehoczky J, LeVine R, McEwan P, McKernan K, Meldrim J, Mesirov JP, Miranda C, Morris W, Naylor J, Raymond C, Rosetti M, Santos R, Sheridan A, Sougnez C, Stange-Thomann N, Stojanovic N, Subramanian A, Wyman D, Rogers J, Sulston J, Ainscough R, Beck S, Bentley D, Burton J, Clee C, Carter N, Coulson A, Deadman R, Deloukas P, Dunham A, Dunham I, Durbin R, French L, Grafham D, Gregory S, Hubbard T, Humphray S, Hunt A, Jones M, Lloyd C, McMurray A, Matthews L, Mercer S, Milne S, Mullikin JC, Mungall A, Plumb R, Ross M, Shownkeen R, Sims S, Waterston RH, Wilson RK, Hillier LW, McPherson JD, Marra MA, Mardis ER, Fulton LA, Chinwalla AT, Pepin KH, Gish WR, Chissoe SL, Wendl MC, Delehaunty KD, Miner TL, Delehaunty A, Kramer JB, Cook LL, Fulton RS, Johnson DL, Minx PJ, Clifton SW, Hawkins T, Branscomb E, Predki P, Richardson P, Wenning S, Slezak T, Doggett N, Cheng JF, Olsen A, Lucas S, Elkin C, Uberbacher E, Frazier M, Gibbs RA, Muzny DM, Scherer SE, Bouck JB, Sodergren EJ, Worley KC, Rives CM, Gorrell JH, Metzker ML, Naylor SL, Kucherlapati RS, Nelson DL, Weinstock GM, Sakaki Y, Fujiyama A, Hattori M, Yada T, Toyoda A, Itoh T, Kawagoe C, Watanabe H, Totoki Y, Taylor T, Weissenbach J, Heilig R, Saurin W, Artiguenave F, Brottier P, Bruls T, Pelletier E, Robert C, Wincker P, Smith DR, Doucette-Stamm L, Rubenfield M, Weinstock K, Lee HM, Dubois J, Rosenthal A, Platzer M, Nyakatura G, Taudien S, Rump A, Yang H, Yu J, Wang J, Huang G, Gu J, Hood L, Rowen L, Madan A, Qin S, Davis RW, Federspiel NA, Abola AP, Proctor MJ, Myers RM, Schmutz J, Dickson M, Grimwood J, Cox DR, Olson MV, Kaul R, Raymond C, Shimizu N, Kawasaki K, Minoshima S, Evans GA, Athanasiou M, Schultz R, Roe BA, Chen F, Pan H, Ramser J, Lehrach H, Reinhardt R, McCombie WR, de la Bastide M, Dedhia N, Blocker H, Hornischer K, Nordsiek G, Agarwala R, Aravind L, Bailey JA, Bateman A, Batzoglou S, Birney E, Bork P, Brown DG, Burge CB, Cerutti L, Chen HC, Church D, Clamp M, Copley RR, Doerks T, Eddy SR, Eichler EE, Furey TS, Galagan J, Gilbert JG, Harmon C, Hayashizaki Y, Haussler D, Hermjakob H, Hokamp K, Jang W, Johnson LS, Jones TA, Kasif S, Kaspryzk A, Kennedy S, Kent WJ, Kitts P, Koonin EV, Korf I, Kulp D, Lancet D, Lowe TM, McLysaght A, Mikkelsen T, Moran JV, Mulder N, Pollara VJ, Ponting CP, Schuler G, Schultz J, Slater G, Smit AF, Stupka E, Szustakowski J, Thierry-Mieg D, Thierry-Mieg J, Wagner L, Wallis J, Wheeler R, Williams A, Wolf YI, Wolfe KH, Yang SP, Yeh RF, Collins F, Guyer MS, Peterson J, Felsenfeld A, Wetterstrand KA, Patrinos A, Morgan MJ, de Jong P, Catanese JJ, Osoegawa K, Shizuya H, Choi S, Chen YJ. Initial sequencing and analysis of the human genome. Nature. 2001;409(6822):860–921. doi: 10.1038/35057062. [DOI] [PubMed] [Google Scholar]
- Ma J, Sigler P, Xu Z, Karplus M. A dynamic model for the allosteric mechanism of GroEL. Journal of Molecular Biology. 2000;302(2):303–313. doi: 10.1006/jmbi.2000.4014. [DOI] [PubMed] [Google Scholar]
- Marrink SJ, Mark AE. Molecular dynamics simulation of the formation, structure, and dynamics of small phospholipid vesicles. J Am Chem Soc. 2003;125(49):15233–15242. doi: 10.1021/ja0352092. [DOI] [PubMed] [Google Scholar]
- Mathiowetz AM, Jain A, Karasawa N, Goddard WA., 3rd Protein simulations using techniques suitable for very large systems: the cell multipole method for nonbond interactions and the Newton-Euler inverse mass operator method for internal coordinate dynamics. Proteins. 1994;20(3):227–247. doi: 10.1002/prot.340200304. [DOI] [PubMed] [Google Scholar]
- McCammon JA, Gelin BR, Karplus M. Dynamics of folded proteins. Nature. 1977;267:585–590. doi: 10.1038/267585a0. [DOI] [PubMed] [Google Scholar]
- Nelson M, Humphrey W, Gursoy A, Dalke A, Kale L, Skeel R, Schulten K. NAMD - A parallel, object-oriented molecular dynamics program. International Journal of Supercomputer Applications and High Performance Computing. 1996;10:251–268. [Google Scholar]
- Phillips J. NAMD Performance. 2005 http://www.ks.uiuc.edu/Research/namd/performance.html.
- Phillips J, Gengbin Z, Kumar S, Kale L. NAMD: Biomolecular simulation on thousands of processors; Proceedings of the SuperComputing 2002 annual meeting.2002. [Google Scholar]
- Sanbonmatsu KY, Joseph S. Understanding discrimination by the ribosome: Stability testing and groove measurement of codonanticodon pairs. J Mol Biol. 2003;328(1):33–47. doi: 10.1016/s0022-2836(03)00236-5. [DOI] [PubMed] [Google Scholar]
- Sanbonmatsu KY, Joseph S, Tung CS. Simulating movement of tRNA into the ribosome during decoding. Proc Natl Acad Sci U S A. 2005;102(44):15854–15859. doi: 10.1073/pnas.0503456102. [DOI] [PMC free article] [PubMed] [Google Scholar]
- Sarzynska J, Kulinski T, Nilsson L. Conformational dynamics of a 5S rRNA hairpin domain containing loop D and a single nucleotide bulge. Biophysical Journal. 2000;79(3):1213–1227. doi: 10.1016/S0006-3495(00)76376-4. [DOI] [PMC free article] [PubMed] [Google Scholar]
- SC03. 2004 http://www.top500.org/lists/2003/11/2. In Top 500 list.
- Schlitter J, Engels M, Kruger P. Targeted molecular dynamics: a new approach for searching pathways of conformational transitions. J Mol Graph. 1994;12(2):84–89. doi: 10.1016/0263-7855(94)80072-3. [DOI] [PubMed] [Google Scholar]
- Sorin EJ, Rhee YM, Pande VS. Does water play a structural role in the folding of small nucleic acids? Biophys J. 2005;88(4):2516–2524. doi: 10.1529/biophysj.104.055087. [DOI] [PMC free article] [PubMed] [Google Scholar]
- Spackova N, Sponer J. Molecular dynamics simulations of sarcin-ricin rRNA motif. Nucleic Acids Res. 2006;34(2):697–708. doi: 10.1093/nar/gkj470. [DOI] [PMC free article] [PubMed] [Google Scholar]
- Tajkhorshid E, Nollert P, Jensen MO, Miercke LJ, O'Connell J, Stroud RM, Schulten K. Control of the selectivity of the aquaporin water channel family by global orientational tuning. Science. 2002;296(5567):525–530. doi: 10.1126/science.1067778. [DOI] [PubMed] [Google Scholar]
- Tama F, Valle M, Frank J, Brooks C. Dynamic reorganization of the functionally active ribosome explored by normal mode analysis and cryoelectron microscopy. Proc Natl Acad Sci USA. 2003;100(16):9319–9323. doi: 10.1073/pnas.1632476100. [DOI] [PMC free article] [PubMed] [Google Scholar]
- Tieleman DP. The molecular basis of electroporation. BMC Biochem. 2004;5:10. doi: 10.1186/1471-2091-5-10. [DOI] [PMC free article] [PubMed] [Google Scholar]
- Trylska J, Tozzini V, McCammon JA. Exploring Global Motions and Correlations in the Ribosome. Biophys J. 2005 doi: 10.1529/biophysj.104.058495. [DOI] [PMC free article] [PubMed] [Google Scholar]
- Tung CS, Sanbonmatsu KY. Atomic model of the Thermus thermophilus 70S ribosome developed in silico. Biophys J. 2004;87(4):2714–2722. doi: 10.1529/biophysj.104.040162. [DOI] [PMC free article] [PubMed] [Google Scholar]
- Valle M, Zavialov A, Li W, Stagg SM, Sengupta J, Nielsen RC, Nissen P, Harvey SC, Ehrenberg M, Frank J. Incorporation of aminoacyl-tRNA into the ribosome as seen by cryoelectron microscopy. Nature Structural Biology. 2003;10(11):899–906. doi: 10.1038/nsb1003. [DOI] [PubMed] [Google Scholar]
- Van Der Spoel D, Lindahl E, Hess B, Groenhof G, Mark AE, Berendsen HJ. GROMACS: fast, flexible, and free. J Comput Chem. 2005;26(16):1701–1718. doi: 10.1002/jcc.20291. [DOI] [PubMed] [Google Scholar]
- Van Gunsteren W, Karplus M. Protein dynamics in solution and in a crystalline environment: a molecular dynamics study. Biochemistry. 1982;21:2259–2274. doi: 10.1021/bi00539a001. [DOI] [PubMed] [Google Scholar]
- Wimberly BT, Brodersen DE, Clemons WM, MorganWarren RJ, Carter AP, Vonrhein C, Hartsch T, Ramakrishnan V. Structure of the 30S ribosomal subunit. Nature. 2000;407(6802):327–339. doi: 10.1038/35030006. [DOI] [PubMed] [Google Scholar]
- Young MA, Gonfloni S, Superti-Furga G, Roux B, Kuriyan J. Dynamic coupling between the SH2 and SH3 domains of c-Src and Hck underlies their inactivation by C-terminal tyrosine phosphorylation. Cell. 2001;105:115–126. doi: 10.1016/s0092-8674(01)00301-4. [DOI] [PubMed] [Google Scholar]