

SUMMARY
The molybdenum cofactor is ubiquitous in nature, and the pathway for Moco biosynthesis is conserved in all three domains of life. Recent work has helped to illuminate one of the most enigmatic steps in Moco biosynthesis, that of metal ligation to molybdopterin (the organic component of the cofactor) to form active cofactor. In Escherichia coli, the MoeA protein mediates Mo ligation to molybdopterin while the MogA protein enhances this process in an ATP-dependent manner. The x-ray crystal structures for both proteins have been previously described as well as two essential MogA residues; Asp49 and Asp82. Here we describe the detailed mutational analysis of the MoeA protein. Variants of conserved residues at the putative active site of MoeA were analyzed for loss of function in two different, previously described assays; one employing moeA− crude extracts, and the other utilizing a defined system. Oddly, no correlation was observed between the observed activity in the two assays. In fact, our results showed a general trend towards an inverse relationship between the activity in each assay. Moco binding studies indicated a strong correlation between a variant’s ability to bind Moco and its activity in the purified components assay. Crystal structures of the functionally characterized MoeA variants revealed no major structural changes, indicating that the functional differences observed are not due to disruption of the protein structure. Based upon these results, two different functional areas were assigned to regions at or near the MoeA active site cleft.
Keywords: molybdopterin, MPT, Moco, molybdenum, MoeA, MogA, gephyrin, Cnx1, cinnamon PDB IDs for the variants: 2NQK (D59N), 2NQM (T100A), 2NQN (T100W), 2NQQ (R137Q), 2NQR (D142N), 2NQS (E188A), 2NQU (E188Q), 2NQV (D228A), 2NRO (K279Q), 2NRP (R350A), and 2NRS (S371W)
All molybdenum-containing enzymes with the exception of nitrogenase, utilize a molybdenum cofactor (Moco)1 consisting of a mononuclear Mo atom coordinated via a cis-dithiolene moiety to the organic molecule molybdopterin (MPT). Moco-containing enzymes function as oxidoreductases in a myriad of reactions in carbon, nitrogen, and sulfur cycles (1). In Escherichia coli, biosynthesis of Moco begins with the conversion of guanosine to the pterin intermediate precursor Z. This step is catalyzed by the MoaA and MoaC proteins (2, 3). MPT is synthesized from precursor Z by the MoaD and MoaE proteins, which together comprise MPT synthase, while the MoeB protein helps to regenerate active MPT synthase (4-7). Ligation of the Mo atom to MPT requires the MoeA and MogA proteins along with the ModABC molybdate transporter system (8, 9). In prokaryotes, the pterin is generally further modified by the covalent addition of GMP at the MPT C4′ phosphate, a reaction catalyzed by the MobA protein (10, 11).
Until recently, the functions of the MoeA and MogA proteins remained enigmatic. Initial studies demonstrated that both proteins are required for in vivo Mo ligation (9, 12, 13). However, the proteins were found to have two different functions; while MoeA facilitated the activation of Mo-free recombinant human sulfite oxidase (SO) in moeA− crude extracts, MogA was inactive in a similar assay (9). More recently we demonstrated that MoeA mediates Mo ligation to de novo synthesized MPT at low concentrations of molybdate in a fully-defined assay (14). MogA was not required in this system and was actually antagonistic towards apo-SO reconstitution, a result of MogA’s tight binding to and sequestration of MPT. However, following reports of a possible MPT-adenylate intermediate catalyzed by the Arabidopsis thaliana Cnx1G domain (15, 16), we observed that, in the presence of ATP and Mg2+, MogA enhanced MoeA-mediated Mo ligation. These results, supported by studies of the Cnx1 protein, showed that MoeA mediates metal ligation, while MogA helps to facilitate this step in vivo in an ATP-dependent manner, possibly by the creation of an MPT-adenylate intermediate thereby priming the MPT for Mo ligation (14, 17).
The X-ray crystal structures of E. coli MoeA has previously been solved, and a putative active site assigned (18, 19). To gain a more thorough understanding of the mechanism of MoeA-mediated molybdenum ligation, a detailed site-directed mutagenesis study of conserved residues at the putative MoeA active site was undertaken. These variants were analyzed for Moco binding and for loss of function in both the moeA− crude extract assay and the fully-defined system. Results from these experiments were utilized to provide the first picture of the distribution of function across the MoeA 3-D structure.
MATERIALS AND METHODS
Mutagenesis of MoeA
Using the Transformer Site-Directed Mutagenesis Kit (BD/Clontech), site-directed mutagenesis of conserved MoeA residues was performed on pJNeA11, which contains the E. coli moeA gene in a pET11a expression vector (Novagen) (19). Substitutions were made at residues Asp59, Thr100, Arg137, Asp142, Glu188, Asp228, Asp259, Lys275, Lys279, Arg350, and Ser371 using 5′-phosphorylated mutagenic primers overlapping the codon to be modified. Oligonucleotides were synthesized by Invitrogen Custom Primers, and automated sequencing was performed by the Duke University DNA Analysis Facility.
A deletion of the domain II “cap” (termed Δ-MoeA) was also made to remove residues Phe53 through Arg139, leaving a Pro51-Gly52-Gly140 linker. For this, mutagenic primers were designed to engineer XmaI restriction sites at Pro51/Gly52 (5′ Phos-CCGCTTGATGTTCCCGGGTTTGATAACTCCGCAATGG 3′) and at Arg138/Arg139 (5′ Phos-GGGCAAAATATTCGCCCCGGGGGTGAAGATATCTCTGCAGG 3′). Mutagenesis with these primers was performed on pJNeA11 as described above. The resulting plasmid was subsequently digested with XmaI and religated to create the pET11a-Δ-MoeA construct. Δ-MoeA has a monomer molecular mass of 34.7 kDa compared to 44 kDa for wild-type MoeA.
For expression of MoeA variants, a λ DE3 lysogenization kit (Novagen) was used to integrate the gene for T7 RNA polymerase into the chromosome of the moeA− strain AH69 (20). All MoeA variants were purified using the method previously described for wild-type MoeA (19) except that the proteins were expressed in the AH69(DE3) strain and cells were lysed in the presence of 1 μg/ml leupeptin and 1 mM benzamidine-HCl. With the exception of T100W, S371W, and Δ-MoeA, protein concentrations were calculated using the ∈280 of 0.61 (mg/ml) −1cm−1 calculated for wild-type MoeA (19). The T100W and S371W variants were quantitated using the BCA protein assay (Pierce), while Δ-MoeA was quantitated using a calculated (based upon primary sequence) ∈280 of 0.71 (mg/ml) −1cm−1 or 24,390 M−1cm−1.
Complementation of E. coli moeA−
Recovery of in vivo NR activity in the moeA− AH69(DE3) strain was assayed after transformation with a pET11a expression plasmid bearing the gene either for wild type MoeA or one of the MoeA variants. Each transformed strain was streaked onto LB/agar plates containing 50 μg/ml carbenicillin and grown overnight at 37 °C. NR activity in the cells was assayed using the previously described overlay method (21).
Activity Assays
Experiments to assay the ability of the MoeA variants to support reconstitution of Mo-free (but MPT-containing) recombinant SO in moeA− crude extract were performed as described previously (9). Assays to monitor the ability of the MoeA variants to mediate the activation of apo-SO using purified components were performed by the method described for wild-type MoeA (14). Data was analyzed using Kaleidograph software (Synergy).
Moco Binding Assays
Gel filtration experiments were performed to assay the ability of the MoeA variants to bind Moco. To obtain Moco, recombinant SO was purified from the mobAB− strain, TP1000 (22), as described by Temple, et al. (23). Moco was released by anaerobic heat denaturation of the SO for 1 min at 100 °C, in a buffer containing 100 mM NaCl, 50 mM Tris, pH 7.5. The sample was subsequently spun in a microcentrifuge at 14,000 rpm for 1 minute to pellet precipitated SO. For the assay, 50 μl of the Moco supernatant was mixed with 4.5 nmoles of wild-type or variant MoeA to a final volume of 100 μl in 100 mM NaCl, 50 mM Tris, pH 7.5. Following a 10 minute, room temperature incubation, the mixture was applied to a PD-10 gel filtration column (GE Healthcare) equilibrated in the same buffer. The column was washed with 2.5 ml of buffer and the protein fraction was subsequently eluted with 800 μl of buffer, and collected into a tube containing 40 μl of 1% I2/2 % KI and 7 μl of 10% HCl. The sample was incubated at 100 °C for 20 minutes to convert MPT to the stable Form A derivative (24), and dephosphorylated overnight with 1 μl of calf intestine alkaline phosphatase. The presence of dephospho-Form A was monitored by HPLC analysis using an Agilent 1100 series fluorescence detector with an excitation wavelength of 295 nm and emission at 448 nm. Moco binding to BSA (Sigma) was used as a negative control in these experiments.
X-ray Crystallography
The D59N, T100A, T100W, R137Q, D142N, E188A, E188Q, D228A, K279Q, R350A and S371W MoeA variants were crystallized under conditions similar to that of wild type MoeA. With the exception of T100A, R137Q and D142N, all variants crystallized in space group P212121 with cell dimensions roughly corresponding to either of the two crystal forms described for wild type MoeA (19), with two MoeA monomers per asymmetric unit (Supplemental Table I). The T100A and D142N variants also crystallized in space group P212121, but with cell dimensions that are only distantly related to the NatI crystal form, and also contain two monomers in the asymmetric unit. In contrast, R137Q MoeA crystallized in space group P21 and contains four monomers in the asymmetric unit.
All diffraction data were collected on beamline X26C at the National Synchrotron Light Source at Brookhaven National Laboratory, at a wavelength of 1.1 Å on a Quantum 4R ADSC CCD detector. The structures of the variants were determined by molecular replacement using the wild type Nat I structure as a search model with the CCP4 program MOLREP (25). The structures were refined using alternate cycles of model building with O (26) and refinement with REFMAC (27).
RESULTS
Mutagenesis of MoeA
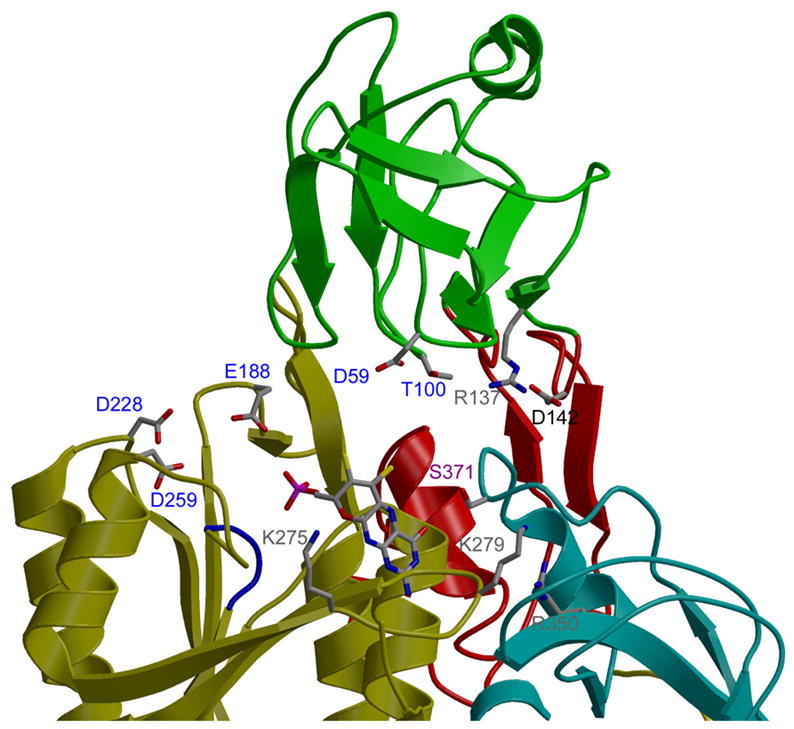
Based upon the previous crystal structure of MoeA (Fig. 1), putative active sites for MoeA were identified at the clefts formed at each end of the dimer between domain II of one monomer and domains III and IV of the other monomer (see arrows in Fig. 1). Sequence alignment of E. coli MoeA with prokaryotic and eukaryotic homologues (not shown) revealed several conserved residues that were grouped into one of two categories: residues potentially important for structural integrity, and residues localized at or near the cleft that are potentially important for function. The latter were chosen for further study. Conserved and variable substitutions were made at Asp59, Thr100, Arg137 (domain II), Asp142 (domain I), Glu188, Asp228, Asp259, Lys275, Lys279 (domain III), Arg350 and Ser371 (domain IV) (Fig. 2). Due to the unique nature of the flexible domain II “cap” (DALI searches revealed no structural homologues), a variant, termed Δ-MoeA, was also constructed wherein residues 53 through 139 were deleted, leaving a Pro51-Gly52-Gly140 β turn in place of domain II.
Figure 1. X-ray crystal structure of E. coli MoeA.
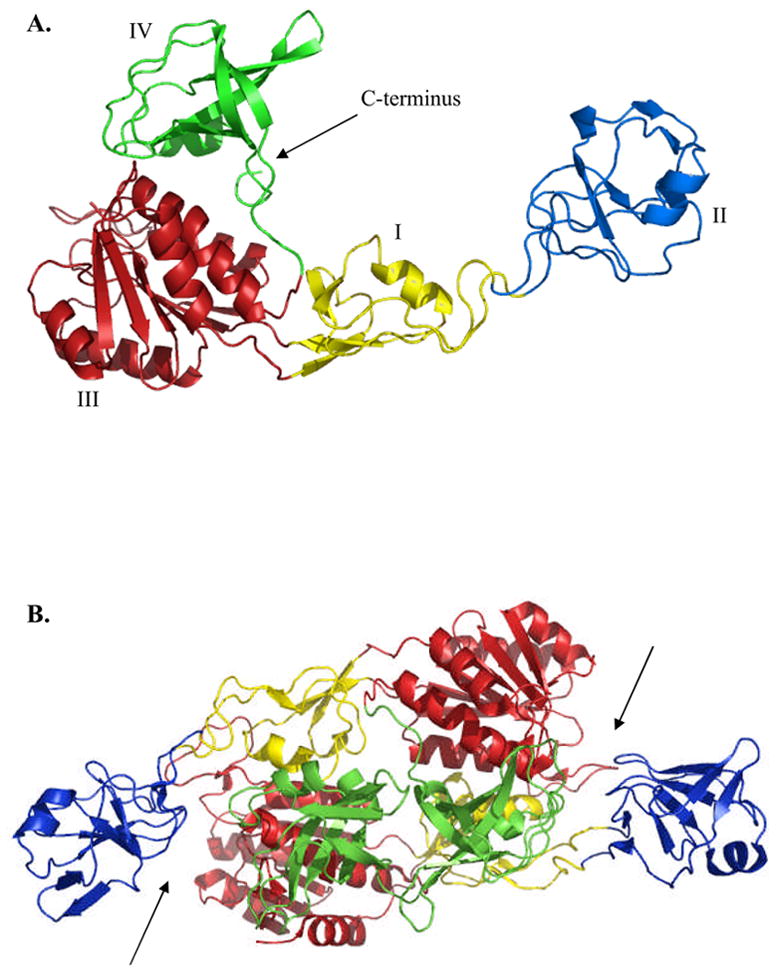
The MoeA monomer (A) and dimer (B) are both shown. The structures are colored according to domain as follows: yellow (I), blue (II), red (III), and green (IV). Arrows indicate the putative MoeA active site clefts. Figures were generated using PyMol.
Figure 2.
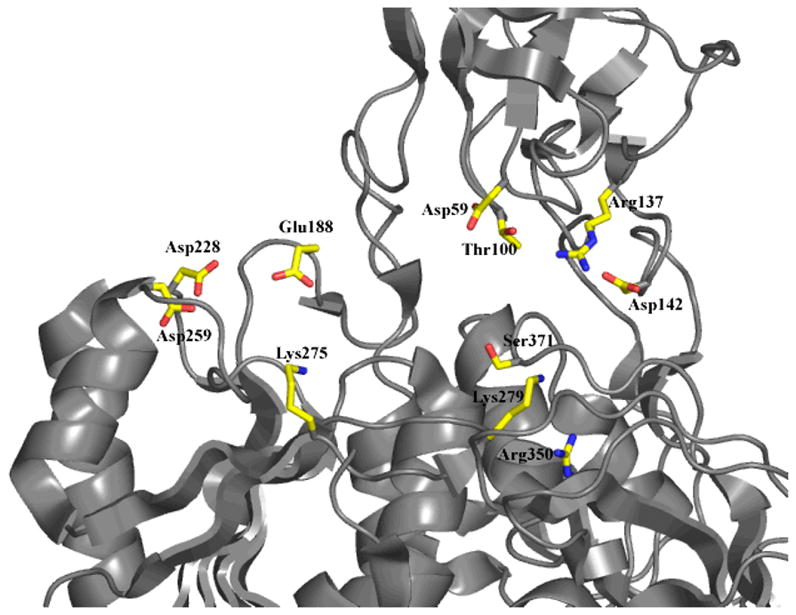
Location of mutated MoeA residues
All of the MoeA variants, including Δ-MoeA, could be purified using the same method as wild-type MoeA, indicating that the introduced mutations (even the deletion of domain II) did not interfere significantly with overall protein assembly and stability. Sedimentation equilibrium analysis revealed that the monomer-dimer association of MoeA was relatively unaffected by the deletion of domain II (data not shown). Thus, even in the absence of the intervening sequence giving rise to domain II, the polypeptide appears capable of folding correctly to generate the other three domains.
Prior to purification, all of the variants were assayed for complementation of the moeA− phenotype with an overlay assay for in vivo NR activity. Somewhat surprisingly, only the Δ-MoeA variant was completely inactive in this in vivo assay (data not shown). However, this does not imply that the other variants are fully active since the assay is not quantitative and extremely low levels of NR activity in the complemented cells would be required for a negative result in this assay.
Assays with the moeA− Crude Extract System
The variants were tested for the ability to reconstitute the activity of Mo-free recombinant SO in the moeA− crude extract assay, and the results are presented in Fig. 3 and Table I. Due to the complexity of this assay, standard Michaelis Menten analysis is precluded. Therefore, for comparisons of variant ability in this assay, the data was fit with the linear equation y = m*log10x + b, and the product of the slope (m = the change in the % of maximum wild type MoeA activity for every order of magnitude increase in protein concentration) and y-intercept, labeled the efficiency product (EP), was utilized for comparisons of variants to wild type MoeA and to other variants (Table I). To aide the viewer, only those variants that were severly attenuated in the assay are shown in the data plot in Figure 3, however all variants were analyzed the same way and the data included in Table I.
Figure 3. Analysis of MoeA variants using the moeA− crude extract assay.
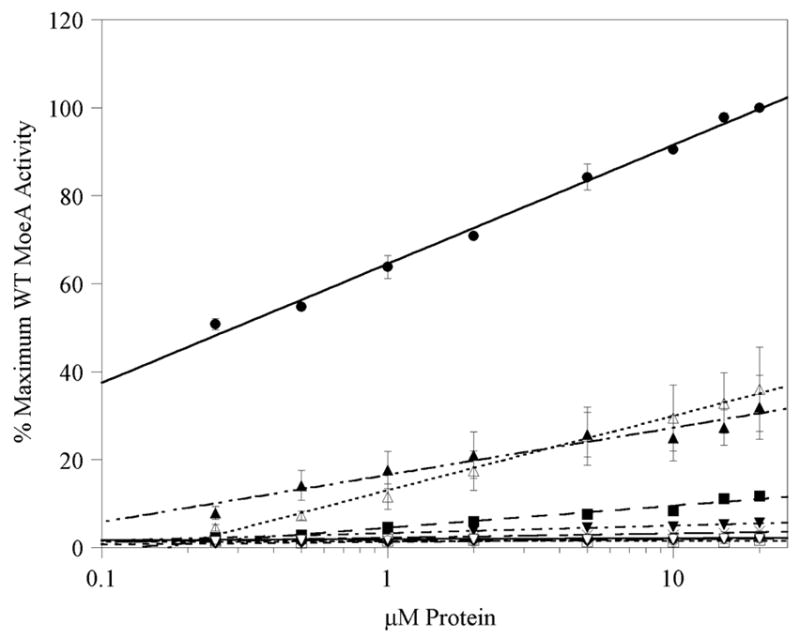
MoeA mutants were assayed for their ability to reconstitute recombinant SO activity in moeA−crude extract in the presence of 50 μM molybdate at various concentrations of each variant using the method previously described (9). To aide the viewer, data for variants that were only minimally effected have not been shown. Shown are the data for wild type MoeA (●), D59A (×), D59N (■), T100W (◇), E188A (◆), E188Q (□), D228A (▼), D228N (▲), D259A (▽), S371W (Δ), and Δ-MoeA (○). Results for each variant were normalized to activity acheived with 20 uM wild type MoeA, plotted vs [protein] and fitted with the logarithmic equation y = m log10(uM protein) + b. The slope and y-intercept (listed in Table I) were utilized for comparisons of the variants. Each variant was assayed in at least two separate experiments, in duplicate for each experiment. Error bars represent the standard deviation of the data.
Table I.
MoeA variant activity from crude extract analysisa
| MoeA Variant | Δ(% WTmax)/(log10[MoeA])b | % WTmax @ 1 uM MoeAc | Efficiency Productd |
|---|---|---|---|
| Wild-type | 27 ± 0.4 | 64.5 ± 0.6 | 1744 ± 44 |
| D59A | 1.0 ± 0.2 | 2.2 ± 0.2 | 2 ± 0.4 |
| D59N | 5.0 ± 0.6 | 4.5 ± 0.2 | 23 ± 1.7 |
| T100A | 20.7 ± 3.4 | 33.4 ± 3.3 | 696 ± 180 |
| T100W | 0.6 ± 0.1 | 1.3 ± 0.1 | 0.7 ± 0.2 |
| R137Q | 24.0 ± 7.2 | 41.5 ± 5.2 | 1016 ± 424 |
| D142N | 21.9 ± 0.5 | 52.6 ± 4.7 | 1154 ± 127 |
| E188A | 0.6 ± 0.3 | 1.4 ± 0.2 | 0.8 ± 0.5 |
| E188Q | 0.1 ± 0.1 | 1.4 ± 0.4 | 0.1 ± 0.1 |
| D228A | 1.7 ± 0.3 | 3.3 ± 0.8 | 5.7 ± 2.3 |
| D228N | 10.7 ± 1.9 | 16.5 ± 3.7 | 181 ± 71 |
| D259A | 0.2 ± 0.1 | 1.7 ± 0.1 | 0.4 ± 0.2 |
| K275Q | 28.6 ± 5.0 | 69.9 ± 14.7 | 2040 ± 771 |
| K279Q | 25.8 ± 7.2 | 37.3 ± 10.2 | 1000 ± 530 |
| R350A | 17.0 ± 6.6 | 38.6 ± 10.0 | 689 ± 424 |
| S371A | 30.6 ± 12.2 | 57.3 ± 13.7 | 1835 ± 1116 |
| S371W | 17.0 ± 4.4 | 13.0 ± 3.0 | 228 ± 108 |
| Δ-MoeA | 0.2 ± 0.2 | 1.9 ± 0.4 | 0.5 ± 0.04 |
For the crude extract assay, 100 % activity = 51.4 ± 9.3 U/mg SO at 20 μM wild type MoeA in the presence of 50 μM molybdate. Consult Fig. 3 for further explanation of the assay. In the absence of MoeA, activity was < 1 U/mg SO.
The change in the % of maximum wild type MoeA-facilitated SO activation in crude extract (51.4 U/mg SO) per 10-fold increase in [MoeA] (μM). Values are the slopes of the logarithmic best fit lines generated for the data using the equation y = m log10(μM protein) + b (see Figure 3). Variants were assayed in duplicate for each experiment, with at least two biological replicates for each variant. Shown are the averages of the results from each independent experiment (± standard deviation).
The % of maximum wild type MoeA-facilitated SO activation achieved at 1 μM MoeA.
The product of the data listed in columns 1 and 2 (± standard deviation).
The most drastic attenuation in activity was observed with variants of Asp59, Thr100, Glu188, Asp228, Asp259, and Ser371, as well as Δ-MoeA. The Δ-MoeA, T100W, and D259A variants were completely devoid of detectable activity, as were both substitutions of Glu188 (even the conservative mutation E188Q), each with an EP < 1, compared with 1744 for wild type MoeA. Note that Asp259 was chosen for study in the later stages of this project based upon a report demonstrating that the D259A mutation was highly attenuated in an assay utilizing crude extracts from the Neurospora crassa nit-1 mutant (28). Substitutions at Asp59 and Asp228 resulted in almost as severe a drop in activity, though a small amount of activity could still be detected, especially in the conservative mutations to Asn. Asp228 is in close spatial proximity to Glu188, and is homologous to one of the two functionally required aspartate residues of MogA, Asp49 (19, 29). Unlike E188Q, the conservative substitution D228N was partially active in the assay with an EP of 181, compared to an EP of 5.7 for D228A. In most cases, more drastic substitutions (I.e., mutation to an unrelated amino acid) caused more severe effects. The substitution of Thr100 with Ala had a mild effect (with an EP of ~700), while the same mutation at Ser371 had no significant effect. However, replacement of either of these residues with Trp caused a severe drop in activation (especially in the case of T100W). The remainder of the mutations resulted in mild (R137Q, D142N, K279Q, and R350A) to no (K275Q) effect on the ability of MoeA to function in the crude extract assay.
Assays Using Purified Components
The development of the recently described fully defined assay for MoeA (14) provided the opportunity for a more direct analysis of the effects of amino acid substitutions in MoeA. The results from these experiments, shown in Fig. 4 and Table II, were quite surprising since, with few exceptions, they was no correlation with what was observed in the crude extract assays. As for crude extract, to aide the viewer we have only included those variants that were significantly attenuated in activity in the plot in Fig. 4. Note that, though Michaelis Menten kinetic constants are presented for comparisons, the number of variables in the assay precluded an in depth kinetic analysis of MoeA. However, the values listed in Table II provided an excellent means for comparisons between the variants and the wild type protein. Overall, there was a general, though not universal, inverse relationship between each variant’s activity in the two assays, with only the T100A, D142N, S371A, S371W, and Δ-MoeA variants yielding similar activity results, relative to the wild type protein, in both assays. In the crude extract assays, mutation of Ser371 to Ala had little effect, while the S371W variant was strongly attenuated in activity. Although the Δ-MoeA variant was completely devoid of activity in the crude extract assay, it did exhibit a small amount of activity in the purified component system, with a θmax/Km of ~3, despite missing the domain II in its entirety.
Figure 4. In vitro analysis of MoeA variants using purified components.
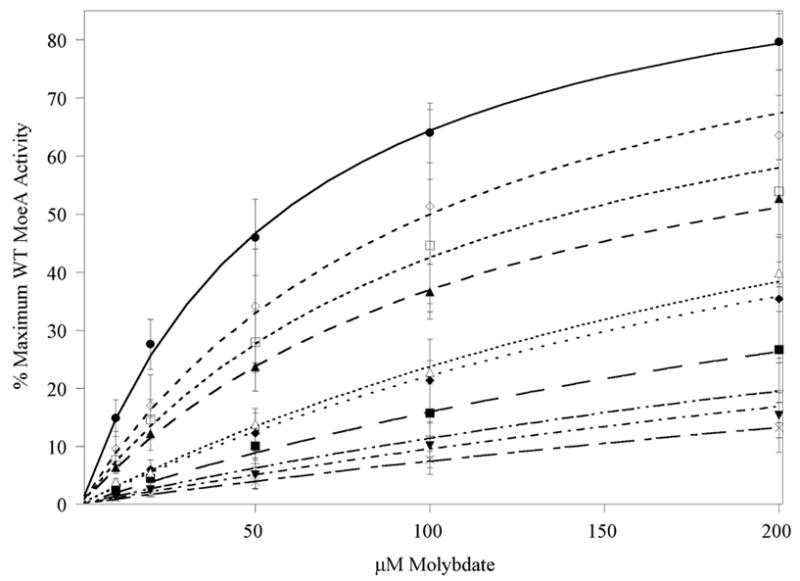
MoeA variants were assayed for the ability to mediate apo-SO reconstitution vs. [molybdate] in the presence of 20 μM MoeA as described for wild-type MoeA (14). To aide the viewer, only those variants that were significantly attenuated relative to wild type MoeA have been included in the plot. Shown are the data for wild type MoeA (●), T100A (▲), T100W (◇), R137Q (◆), K275Q (□), K279Q (▼), R350A (+), S371W (■), Δ-MoeA (Δ), and no protein (×). For data analysis, results for each variant were first normalized to the maximum level of apo-SO activation acheived with wild type MoeA in that experiment (up to 420 U/mg SO in the presence of 1 mM molybdate). Each variant was assayed in at least two separate experiments, in duplicate for each experiment. Normalized data were averaged and fitted to a standard michaelis-menton equation. A “Vmax” (labeled θmax: the maximum percentage of wild type MoeA activity) and Km (the [molybdate] required to reached ½ θmax) were extracted for all variants and are listed in Table II. Error bars represent the standard deviation of the data.
Table II.
MoeA variant activity from purified component assaya
| MoeA Variant | θmaxb | Kmc | θmax/Km |
|---|---|---|---|
| Wild-type | 103.8 ± 2.6 | 6.3 ± 1.8 | 17.4 ± 3.9 |
| Background | 64.9 ± 23.9 | 79.8 ± 30.2 | 0.9 ± 0.3 |
| D59A | 91.2 ± 3.1 | 3.0 ± 0.5 | 31 ± 3.8 |
| D59N | 87.7 ± 1.3 | 3.7 ± 0.4 | 24.1 ± 2.3 |
| T100A | 84.5 ± 5.9 | 13.2 ± 4.3 | 6.9 ± 2.2 |
| T100W | 104.0 ± 32.3 | 11.4 ± 2.9 | 9.7 ± 4 |
| R137Q | 95.6 ± 17.8 | 34.7 ± 10.1 | 3.0 ± 1.1 |
| D142N | 83.0 ± 17.5 | 3.4 ± 0.6 | 24.6 ± 0.9 |
| E188A | 94.0 ± 12.0 | 4.9 ± 0.5 | 19.2 ± 1.9 |
| E188Q | 104.0 ± 29.3 | 5.5 ± 1.1 | 19.1 ± 4.1 |
| D228A | 96.7 ± 7.6 | 6.3 ± 0.9 | 15.6 ± 3.4 |
| D228N | 95.5 ± 10.4 | 5.3 ± 0.2 | 18.1 ± 1.6 |
| D259A | 99.1 ± 1.3 | 4.0 ± 0.2 | 24.9 ± 1.1 |
| K275Q | 92.4 ± 7.4 | 12.6 ± 4.3 | 8.0 ± 3.2 |
| K279Q | 82.9 ± 5.2 | 100.8 ± 64.4 | 1.0 ± 0.5 |
| R350A | 69.3 ± 17.7 | 52.2 ± 14.5 | 1.4 ± 0.4 |
| S371A | 91.0 ± 12.4 | 6.5 ± 0.3 | 14.1 ± 2.3 |
| S371W | 77.3 ± 18.0 | 41.1 ± 13.0 | 2.0 ± 0.9 |
| Δ-MoeA | 101.2 ± 9.8 | 32.6 ± 2.9 | 3.1 ± 0.02 |
Values shown were extracted from Michaelis Menten fits of the data shown in Figure 4. Data was normalized to the maximum SO activity acheived with wild type MoeA. At 20 μM MoeA, the highest [molybdate] used in the experiement, 1 mM, resulted in up to 420 U/mg SO. Variants were assayed in duplicate for each experiment, with at least two biological replicates for each variant. Shown are the averaged results from each experiment (± standard deviation).
The maximum percentage of wild-type MoeA activity acheivable.
The concentration of molybdate (μM) required to reach ½ of the maximum level of activity acheivable for each variant.
While K279Q and R350A were only mildy affected in the crude extract system, both were almost completely inactive in the purified component assay, with 17 and 12-fold decreases in activity (as judged by θmax/Km values), respectively, compared to wild type MoeA (see Table II). This was very close to the background activity observed in abence of MoeA. The R137Q variant behaved similarly, though it was not as strongly affected in the defined assay, with only a 6-fold decrease in activity. Even more intriguing were the results obtained with variants of Asp59, Glu188, Asp228, Asp259, and Thr100. In stark contrast to the crude extract results, substitutions at Glu188 and Asp228 exhibited close to wild-type activity in the purified component assay, while Asp59 and Asp259 substitutions yielded higher than wild type activity. D142N, though only mildy effected in crude extracts, also yielded higher than wild-type activity in this assay. T100A was roughly half as active as wild-type MoeA using purified components, similar to its activity in crude extracts. However, T100W was completely inactive in the crude extract assay was only mildy effected in the defined assay, with a 1.8-fold decrease in activity. The K275Q variant was similar to T100A in the purified components assay, with a 2.2-fold decrease in activity, compared to a 2.5-fold decrease for T100A.
While the purified component system results appear to be in conflict with many of the observations from the crude extract assay, it should be pointed out that these are very different systems. A previous report from this laboratory demonstrated that removing lysate from the crude extract assay lowers the maximum activity observed with the assay (9). In contrast, preliminary experiments indicated that apo-SO reconstitution in the purified component system is actually inhibited by the addition of cell extracts (JD Nichols and KV Rajagopalan, unpublished data). Based upon the results presented above, it appears that these two systems are assaying different functions of the MoeA protein.
Moco binding
Initially, it was quite surprising that many of the variants displayed nearly opposite activity in the two in vitro assays. One trend that emerged early on in this work was that acidic residues were predominantly effected in crude extracts, while basic residues were the most heavily attenuated in the purified component assay. To explore this further, the ability of the MoeA variants to bind Moco released from heat-denatured SO was examined. The results presented in Fig. 5 revealed that the R137Q, K279Q, and R350A variants lacked significant Moco binding, while the K275Q, S371W, and Δ-MoeA variants showed a moderate decrease in Moco binding. In contrast, the Asp59, Asp142, and Asp259 variants all displayed an increased level of Moco binding relative to wild-type MoeA. The remaining variants were roughly equivalent to wild-type MoeA in this experiment. These data indicate that MoeA activity in the purified component assay is very dependent upon the ability of the protein to bind MPT; i.e., diminished apo-SO reconstitution correlates with diminished Moco binding.
Figure 5. Moco binding by MoeA variants.
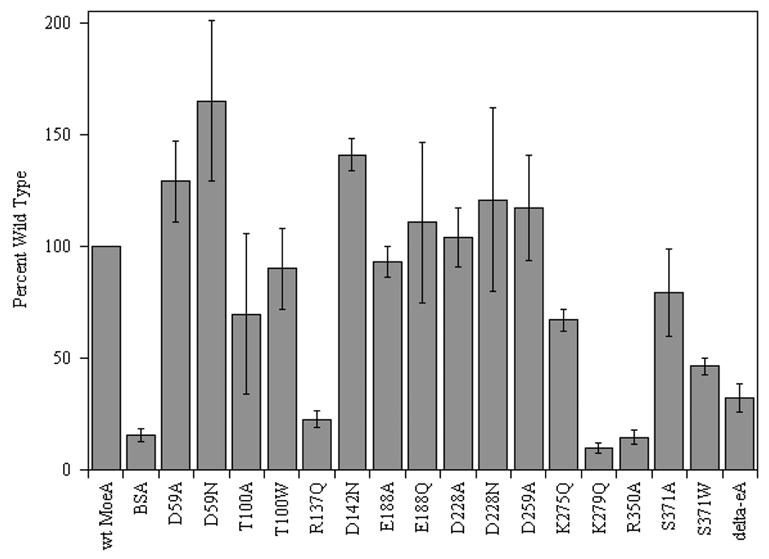
Moco binding assays were performed as described in “Materials and Methods”. The level of bound Moco was normalized to the level obtained with wild type MoeA following each experiment. Experiments were performed in triplicate for each variant. Error bars represent the standard deviation of the normalized data.
The results of our Moco-binding studies help to define the MPT binding site of E. coli MoeA. Based upon the structural homology between domain III of MoeA and MogA, and upon the recently published structure of the G-domain of Cnx1 (homologous to MogA) in complex with MPT (15), MPT was modeled into the active site of MoeA as shown in Fig. 6. In the model, the phosphate group of MPT is located in the proximity of MoeA residues 249–254 (SSGGVS). These residues display limited homology to the TXGGTG motif in MogA-related proteins. In the Cnx1 G-domain-MPT complex structure, these residues interact with the phosphate moiety of MPT. In the MPT-MoeA complex model, the tricyclic ring of MPT is in proximity to residues Lys275, Lys279, Arg350, and Ser371, mutations of which reduced MPT binding. Residues Glu188, Asp228, and Asp259, which do not significantly contribute to MPT binding, are more distant from the MPT molecule. Arg137 is the only residue whose substitution diminishes MPT binding even though it is not in close proximity to MPT in our model.
Figure 6. Model of MPT bound to MoeA.
MPT was modeled into the MoeA 3-D structure based upon the superposition of the Cnx1 G domain/MPT complex structure (15) and subdomain III of MoeA as determined with the program O. An initial transformation was generated by matching residues 131–156 of the Cnx1 G domain to corresponding regions of MoeA (residues 291–318 of monomer A in the NatI crystal). A refinement of this transformation matched all the corresponding secondary structure elements in the two proteins, resulting in an RMS deviation of 1.92 Å between the Cα atoms.
Structural Studies of MoeA Variants
The structures of the D59N, T100A, T100W, R137Q, D142N, E188A, E188Q, D228A, K279Q, R350A and S371W MoeA variants were determined by molecular replacement with the wild type Nat I structure as search model (19). Note that two slightly different structures (Nat I and II, PDB IDs 1G8L and R) were reported for the original wild type structure, with the primary difference being variation in the orientation of domain II. The MoeA mutant structures were refined at resolutions between 2.1 Å and 3.0 Å, with R factors comparable to that of the wild type MoeA structures (Supplemental Table II). Excluding the orientation of domain II relative to the MoeA core, there are no novel structural changes in these variants compared to those present in the two wild-type structures and all MoeA variants can be superimposed on the wild type structures with a root mean square (RMS) deviation of Cα atoms below 1 Å, indicating that the altered activities are not the result of structural perturbations, but are a direct functional consequence of the respective amino acid substitutions.. The orientation of domain II was more variable (See Fig. 7, and Supplemental Table III), as was the case for the two wild type structures (19). Domain II variability was most pronounced in the T100A and R137Q variants, where domain II of one monomer of each was poorly defined in the electron density maps. In the case of T100A, this domain had to be omitted from the model due to poor electron density, causing the relatively poor refinement statistics of the T100A structure (Supplemental Table II). This structural variability has been described primarily as a rigid body movement of domain II relative to the core of the MoeA dimer (19). In most cases, however, the variability in the orientation of domain II between the MoeA variants and wild-type MoeA was not significantly different from what was observed between the two wild-type (Nat I and Nat II) structures. The two exceptions are D142N and R137Q, as these variants have substitutions in the hinge region connecting domain II and the MoeA dimer core resulting in greater deviations in the observed domain II orientations compared to the wild-type structures (See Fig. 7 and Supplemental Table III).
Figure 7. Structural diversity of MoeA variants.
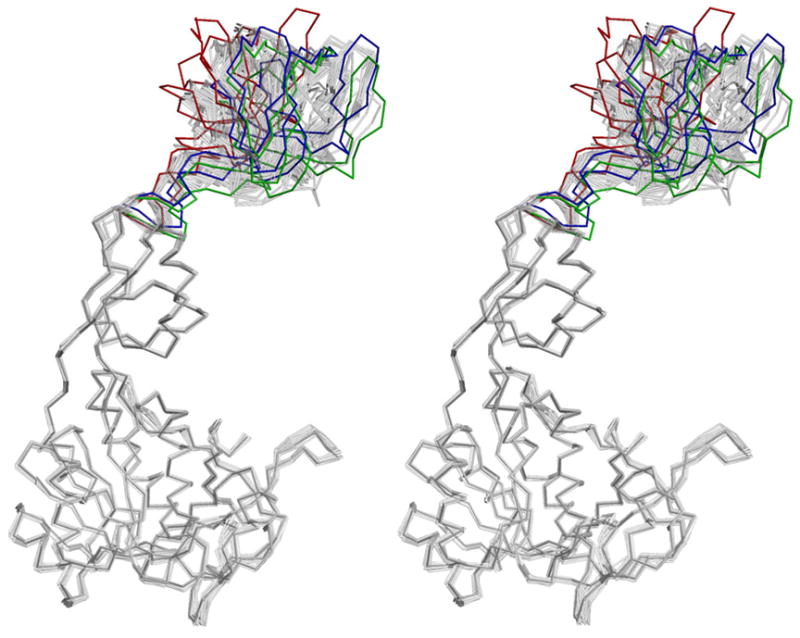
Stereo representation of all available variant monomers superimposed onto monomer A of the wild type Nat I crystal structure. Monomers were superimposed by alignment of domains I/III/IV, with all RMS deviations below 1 Å. Domain II from monomers C and D of R137Q and monomer A of D142N are highlighted in red, green, and blue, respectively.
As a consequence of the rigid body movement of domain II, the distances between Asp59 and Thr100, located on domain II, and Glu188, Asp228, and Asp259, located on domain III, are variable (data not shown). For example, a comparison of the various orientations of domain II in the wild-type structure revealed that the distance between the Cα atoms of Asp59 and Glu188 varies from 23.2 Å to 17.2 Å. Mutations at all five residues attenuated MoeA activity in the crude extract assay, but not in the purified components assay (with the exception of T100A), suggesting that they work coordinately during one aspect of MoeA function. The conformational change of domain II therefore could serve to bring Asp59/Thr100 and Glu188/Asp228/Asp259 into spatial proximity to facilitate this particular function.
DISCUSSION
The results from the variant experiments, summarized in Table III and Fig. 9, demonstrate a strong correlation between the ability to bind Moco and the level of activity of each variant in the purified component assay. Attenuation of activity in the crude extract assay was primarily observed with substitutions of acidic residues, while substitutions of basic residues resulted in diminished MPT binding and a loss of activity with purified components. The polar, uncharged residues Thr100 and Ser371 were effected in both systems, though Thr100 showed more attenuation in the crude extract system. Though not reflected in our model of MPT in the MoeA active site (Fig. 6), the importance of basic residues for proper Moco binding and activity with purified components might reflect an inability to properly coordinate the phosphate group of MPT or the negatively charged molybdate moeity of Moco in variants of these residues, though these possibilies have yet to be tested. Contrary to the purified component system, activity in the moeA− crude extract assay appears to be dependent upon a different aspect of MoeA function, something dependent upon acidic residues in the active site but independent of Moco-binding. While the apo-SO utilized in the purified component system is free of bound MPT, in extracts, the majority of MPT is already bound to SO (9). It is possible that, in the crude extract assays, MoeA must either a) pull MPT away from SO, ligate Mo, and release Moco for rebinding by apo-SO, b) ligate Mo while MPT is still bound to SO, or c) interact with other cellular factors to collectively facilitate Mo ligation. The first two possibilities are unlikely as, in the absence of lysate, MoeA was only able to activate SO at ~5 % of the level observed in the presence of lysate (9). Furthermore, the premature addition of apo-SO to the purified component system lowers the efficiency of activation, and apo-SO binds MPT/Moco quite readily from reactions containing a 10-fold excess of MoeA (14). Therefore, activity in crude extract is likely to be dependent upon the ability of MoeA to interact with some unidentified cellular factor(s) in order to mediate Mo ligation. It was previously demonstrated that only the protein fraction of the extract was required for activity in crude extracts (9). Therefore, the unknown factor(s) is likely to be one or more additional protein(s). MogA would seem to be the most likely candidate for this interaction as both MoeA and MogA are required for in vivo Mo ligation, MogA binds Moco more tightly than MoeA, and MogA enhances MoeA-mediated Mo ligation to MPT in an ATP-dependent manner (9, 14). Furthermore, the known eukaryotic homologues to MoeA and MogA exist as fusion proteins (30). Preliminary chemical crosslinking experiments from our laboratory indicate that MoeA and MogA do appear to, at least transiently, interact (JD Nichols and KV Rajagopalan, unpublished data). It is conceivable that the differential results obtained with the two assays reflects a loss in some variants of the ability to process the proposed MPT-adenylate intermediate in the crude extract assay. This would be in line with previous observations that the function of MogA was required prior to MoeA for SO reconstitution in crude extracts (9). However, in that same study it was also found that it was not necessary that MogA be present concomitantly with MoeA, indicating that interactions with factors other than MogA might be important for activity in the crude extract assay. Consistent with this idea, Magalon et al. reported interactions between MoeA, MogA, and MobA using a bacterial two-hybrid system (31). As MogA is not required for activity with purified components, it was excluded from these assays. Further analysis of the variants’ ability to function in the presence of MogA with purified components will help to shed more light on this.
Table III.
Summary of MoeA variant activity and Moco binding capacitya
| Residue Type | MoeA Variant | Crude Extractb Assay | Purified Componentsc Assay | Moco Bindingd |
|---|---|---|---|---|
| Background | n.a.e | 0.9 ± 0.3 | 16 ± 2.7 | |
| wild-type | 1744 ± 44 | 17.4 ± 3.9 | 100 | |
|
| ||||
| Acidic | D59A | 2.0 ± 0.4 | 31 ± 3.8 | 129 ± 18 |
| D59N | 23 ± 1.7 | 24.1 ± 2.3 | 165 ± 36 | |
| D142N | 1154 ± 127 | 24.6 ± 0.9 | 141 ± 7.0 | |
| E188A | 0.8 ± 0.5 | 19.2 ± 1.9 | 93 ± 7.1 | |
| E188Q | 0.1 ± 0.1 | 19.1 ± 4.1 | 111 ± 36 | |
| D228A | 5.7 ± 2.3 | 15.6 ± 3.4 | 104 ± 13 | |
| D228N | 181 ± 71 | 18.1 ± 1.6 | 121 ± 41 | |
| D259A | 0.4 ± 0.2 | 24.9 ± 1.1 | 70 ± 23.5 | |
|
| ||||
| Neutral | T100A | 696 ± 180 | 6.9 ± 2.2 | 70 ± 36 |
| T100W | 0.7 ± 0.2 | 9.7 ± 4 | 90 ± 18 | |
| S371A | 1835 ± 1116 | 14.1 ± 2.3 | 80 ± 19.5 | |
| S371W | 228 ± 108 | 2.0 ± 0.9 | 46 ± 3.8 | |
|
| ||||
| Basic | R137Q | 1016 ± 424 | 3.0 ± 1.1 | 23 ± 3.5 |
| K275Q | 2040 ± 771 | 8.0 ± 3.2 | 67 ± 5.0 | |
| K279Q | 1000 ± 530 | 1.0 ± 0.5 | 10 ± 2.3 | |
| R350A | 689 ± 424 | 1.4 ± 0.4 | 15 ± 3.1 | |
|
| ||||
| Δ-MoeA | 0.5 ± 0.04 | 3.1 ± 0.02 | 32 ± 6.2 | |
A summary and comparison of results presented in Fig. 3–5 and Tables I and II, organized by acidic, neutral, and basic residues from top to bottom.
Crude extract efficiency product as described for Table I.
θmax/Km from Table II.
Moco binding is given as in Figure 5; the percentage of that obtained with wild-type MoeA.
Not applicable. Activity in the absence of MoeA (in the presence of 50 μM molybdate) was < 1U/mg SO.
Figure 9. Graphical comparison of MoeA variant activity and Moco binding ability.
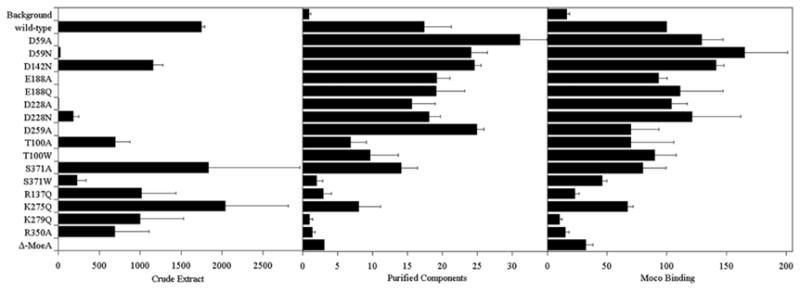
A graphic illustration of the data listed in Table III.
When the MoeA variants were mapped to the MoeA structure according to their activity in the two assays as well as their ability to bind Moco, distinct regions of function could be localized in the MoeA cleft. As seen in Fig. 8, Asp59, Thr100, Glu188, Asp228, and Asp259 (blue residues) are all required for efficient activity in the crude extract system while Arg137, Lys275, Lys279, and Arg350 (yellow) are all necessary for MPT binding and activity in the purified component assay. The S371W variant (green) was affected in both systems, though more severely in the purified component assay, while the D142N mutant (not colored) was relatively unaffected in either. Deletion of domain II abolished any interactions in the crude extract assay, however there was some residual activity with the purified component system indicating that this domain is most important for whatever interactions are occurring in crude extract.
Figure 8. Two different functions map to the MoeA active site cleft.
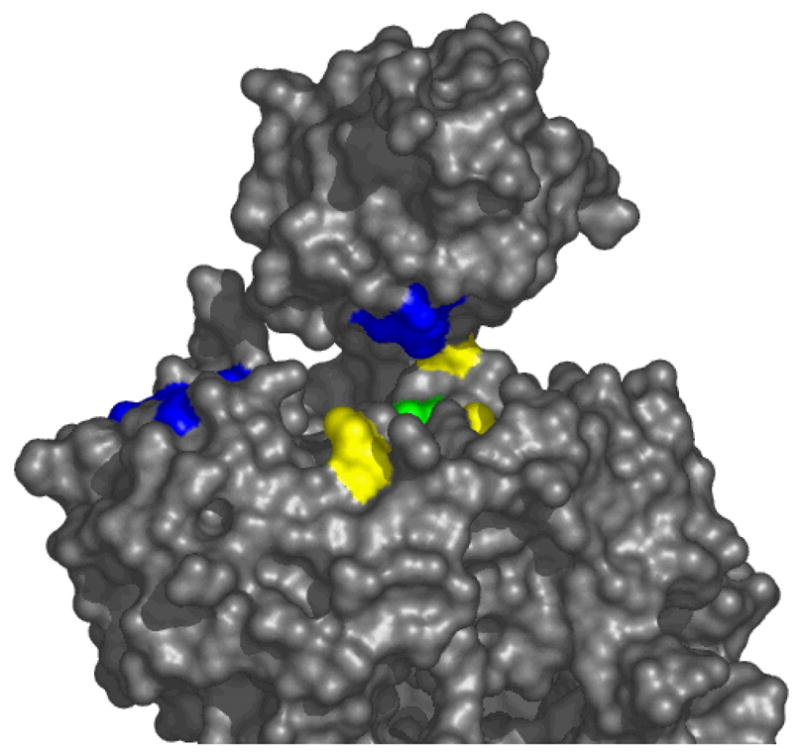
MoeA is shown in a surface representation viewed into the active site cleft. Residues that were attenuated in the crude extract assay are colored blue while those deficient in the purified component system and Moco binding are colored yellow. Ser371 was attenuated in both and is colored green.
Acknowledgments
We would like to thank Susan Stager her help in the purification of thiocarboxylated MoaD protein and Dr. Margot Wuebbens for critically reading this manuscript.
Abbreviations
- Moco
molybdenum cofactor
- MPT
molybdopterin
- SO
sulfite oxidase
- NR
nitrate reductase
- ATP
adenosine triphosphate
- GMP
guanosine monophosphate
Footnotes
This work was supported by National Institutes of Health Grant GM00091 (to KVR) and DK 54835 (to HS).
SUPPORTING INFORMATION AVAILABLE
Structural data and refinement statistics found in Supplementary Tables I through III is available free of charge via the Internet at http://pubs.acs.org.
References
- 1.Hille R. Molybdenum and tungsten in biology. Trends Biochem Sci. 2002;27:360–7. doi: 10.1016/s0968-0004(02)02107-2. [DOI] [PubMed] [Google Scholar]
- 2.Reider C, Eisenreich W, O'Brien J, Richter G, Götze E, Boyle P, Blanchard S, Bacher A, Simon H. Rearrangement reactions in the biosynthesis of molybdopterin--an NMR study with multiply 13C/15N labelled precursors. Eur J Biochem. 1998;255:24–36. doi: 10.1046/j.1432-1327.1998.2550024.x. [DOI] [PubMed] [Google Scholar]
- 3.Wuebbens MM, Rajagopalan KV. Investigation of the early steps of molybdopterin biosynthesis in Escherichia coli through the use of in vivo labeling studies. J Biol Chem. 1995;270:1082–7. doi: 10.1074/jbc.270.3.1082. [DOI] [PubMed] [Google Scholar]
- 4.Leimkuhler S, Rajagopalan KV. A sulfurtransferase is required in the transfer of cysteine sulfur in the in vitro synthesis of molybdopterin from precursor Z in Escherichia coli. J Biol Chem. 2001;276:22024–31. doi: 10.1074/jbc.M102072200. [DOI] [PubMed] [Google Scholar]
- 5.Leimkühler S, Rajagopalan KV. In vitro Incorporation of Nascent Molybdenum Cofactor into Human Sulfite Oxidase. J Biol Chem. 2001;276:1837–1844. doi: 10.1074/jbc.M007304200. [DOI] [PubMed] [Google Scholar]
- 6.Leimkuhler S, Wuebbens MM, Rajagopalan KV. Characterization of Escherichia coli MoeB and its involvement in the activation of molybdopterin synthase for the biosynthesis of the molybdenum cofactor. J Biol Chem. 2001;276:34695–701. doi: 10.1074/jbc.M102787200. [DOI] [PubMed] [Google Scholar]
- 7.Pitterle DM, Johnson JL, Rajagopalan KV. In vitro synthesis of molybdopterin from precursor Z using purified converting factor. Role of protein-bound sulfur in formation of the dithiolene. J Biol Chem. 1993;268:13506–9. [PubMed] [Google Scholar]
- 8.Grunden AM, Shanmugam KT. Molybdate transport and regulation in bacteria. Arch Microbiol. 1997;168:345–54. doi: 10.1007/s002030050508. [DOI] [PubMed] [Google Scholar]
- 9.Nichols J, Rajagopalan KV. Escherichia coli MoeA and MogA. Function in metal incorporation step of molybdenum cofactor biosynthesis. J Biol Chem. 2002;277:24995–5000. doi: 10.1074/jbc.M203238200. [DOI] [PubMed] [Google Scholar]
- 10.Johnson JL, Indermaur LW, Rajagopalan KV. Molybdenum cofactor biosynthesis in Escherichia coli. Requirement of the chlB gene product for the formation of molybdopterin guanine dinucleotide. J Biol Chem. 1991;266:12140–5. [PubMed] [Google Scholar]
- 11.Temple CA, Rajagopalan KV. Mechanism of assembly of the Bis(Molybdopterin guanine dinucleotide)molybdenum cofactor in Rhodobacter sphaeroides dimethyl sulfoxide reductase. J Biol Chem. 2000;275:40202–10. doi: 10.1074/jbc.M007407200. [DOI] [PubMed] [Google Scholar]
- 12.Joshi MS, Johnson JL, Rajagopalan KV. Molybdenum cofactor biosynthesis in Escherichia coli mod and mog mutants. J Bacteriol. 1996;178:4310–2. doi: 10.1128/jb.178.14.4310-4312.1996. [DOI] [PMC free article] [PubMed] [Google Scholar]
- 13.Stewart V, MacGregor CH. Nitrate reductase in Escherichia coli K-12: involvement of chlC, chlE, and chlG loci. J Bacteriol. 1982;151:788–99. doi: 10.1128/jb.151.2.788-799.1982. [DOI] [PMC free article] [PubMed] [Google Scholar]
- 14.Nichols JD, Rajagopalan KV. In vitro molybdenum ligation to molybdopterin using purified components. J Biol Chem. 2005;280:7817–22. doi: 10.1074/jbc.M413783200. [DOI] [PubMed] [Google Scholar]
- 15.Kuper J, Llamas A, Hecht HJ, Mendel RR, Schwarz G. Structure of the molybdopterin-bound Cnx1G domain links molybdenum and copper metabolism. Nature. 2004;430:803–6. doi: 10.1038/nature02681. [DOI] [PubMed] [Google Scholar]
- 16.Llamas A, Mendel RR, Schwarz G. Synthesis of adenylated molybdopterin: an essential step for molybdenum insertion. J Biol Chem. 2004;279:55241–6. doi: 10.1074/jbc.M409862200. [DOI] [PubMed] [Google Scholar]
- 17.Llamas A, Otte T, Multhaup G, Mendel RR, Schwarz G. The Mechanism of nucleotide-assisted molybdenum insertion into molybdopterin. A novel route toward metal cofactor assembly. J Biol Chem. 2006;281:18343–50. doi: 10.1074/jbc.M601415200. [DOI] [PubMed] [Google Scholar]
- 18.Schrag JD, Huang W, Sivaraman J, Smith C, Plamondon J, Larocque R, Matte A, Cygler M. The crystal structure of Escherichia coli MoeA, a protein from the molybdopterin synthesis pathway. J Mol Biol. 2001;310:419–31. doi: 10.1006/jmbi.2001.4771. [DOI] [PubMed] [Google Scholar]
- 19.Xiang S, Nichols J, Rajagopalan KV, Schindelin H. The crystal structure of Escherichia coli MoeA and its relationship to the multifunctional protein gephyrin. Structure. 2001;9:299–310. doi: 10.1016/s0969-2126(01)00588-3. [DOI] [PubMed] [Google Scholar]
- 20.Hasona A, Ray RM, Shanmugam KT. Physiological and genetic analyses leading to identification of a biochemical role for the moeA (molybdate metabolism) gene product in Escherichia coli. J Bacteriol. 1998;180:1466–72. doi: 10.1128/jb.180.6.1466-1472.1998. [DOI] [PMC free article] [PubMed] [Google Scholar]
- 21.Johnson ME, Rajagopalan KV. Involvement of chlA, E, M, and N loci in Escherichia coli molybdopterin biosynthesis. J Bacteriol. 1987;169:117–25. doi: 10.1128/jb.169.1.117-125.1987. [DOI] [PMC free article] [PubMed] [Google Scholar]
- 22.Palmer T, Santini CL, Iobbi-Nivol C, Eaves DJ, Boxer DH, Giordano G. Involvement of the narJ and mob gene products in distinct steps in the biosynthesis of the molybdoenzyme nitrate reductase in Escherichia coli. Mol Microbiol. 1996;20:875–84. doi: 10.1111/j.1365-2958.1996.tb02525.x. [DOI] [PubMed] [Google Scholar]
- 23.Temple CA, Graf TN, Rajagopalan KV. Optimization of expression of human sulfite oxidase and its molybdenum domain. Arch Biochem Biophys. 2000;383:281–7. doi: 10.1006/abbi.2000.2089. [DOI] [PubMed] [Google Scholar]
- 24.Johnson JL, Rajagopalan KV. Structural and metabolic relationship between the molybdenum cofactor and urothione. Proc Natl Acad Sci U S A. 1982;79:6856–60. doi: 10.1073/pnas.79.22.6856. [DOI] [PMC free article] [PubMed] [Google Scholar]
- 25.Bailey S. The CCP4 suite: Programs for protein crystallography. Acta Crystallogr D. 1994;50:760–763. doi: 10.1107/S0907444994003112. [DOI] [PubMed] [Google Scholar]
- 26.Jones TA, Cowan S, Zou JY, Kjeldgaard M. Improved Methods for Building Protein Models in Electron Density Maps and the Location of Errors in these Models. Acta Crystallogr A. 1991;47:110–119. doi: 10.1107/s0108767390010224. [DOI] [PubMed] [Google Scholar]
- 27.Murshudov GN, Vagin AA, Dodson EJ. Refinement of Macromolecular Structures by the Maximum-Likelihood Method. Acta Crystallogr D. 1997;53:240–255. doi: 10.1107/S0907444996012255. [DOI] [PubMed] [Google Scholar]
- 28.Sandu C, Brandsch R. Evidence for MoeA-dependent formation of the molybdenum cofactor from molybdate and molybdopterin in Escherichia coli. Arch Microbiol. 2002;178:465–70. doi: 10.1007/s00203-002-0474-7. [DOI] [PubMed] [Google Scholar]
- 29.Liu MT, Wuebbens MM, Rajagopalan KV, Schindelin H. Crystal structure of the gephyrin-related molybdenum cofactor biosynthesis protein MogA from Escherichia coli. J Biol Chem. 2000;275:1814–22. doi: 10.1074/jbc.275.3.1814. [DOI] [PubMed] [Google Scholar]
- 30.Stallmeyer B, Nerlich A, Schiemann J, Brinkmann H, Mendel RR. Molybdenum co-factor biosynthesis: the Arabidopsis thaliana cDNA cnx1 encodes a multifunctional two-domain protein homologous to a mammalian neuroprotein, the insect protein Cinnamon and three Escherichia coli proteins. Plant J. 1995;8:751–62. doi: 10.1046/j.1365-313x.1995.08050751.x. [DOI] [PubMed] [Google Scholar]
- 31.Magalon A, Frixon C, Pommier J, Giordano G, Blasco F. In vivo interactions between gene products involved in the final stages of molybdenum cofactor biosynthesis in Escherichia coli. J Biol Chem. 2002;277:48199–204. doi: 10.1074/jbc.M205806200. [DOI] [PubMed] [Google Scholar]