

Abstract
The ability to evaluate outcomes of previous decisions is critical to adaptive decision-making. The feedback-related negativity (FRN) is an event-related potential (ERP) modulation that distinguishes losses from wins, but little is known about the effects of outcome probability on these ERP responses. Further, little is known about the frequency characteristics of feedback processing, for example, event-related oscillations and phase synchronizations. Here, we report an EEG experiment designed to address these issues. Subjects engaged in a probabilistic reinforcement learning task in which we manipulated, across blocks, the probability of winning and losing to each of two possible decision options. Behaviorally, all subjects quickly adapted their decision-making to maximize rewards. ERP analyses revealed that the probability of reward modulated neural responses to wins, but not to losses. This was seen both across blocks as well as within blocks, as learning progressed. Frequency decomposition via complex wavelets revealed that EEG responses to losses, compared to wins, were associated with enhanced power and phase coherence in the theta frequency band. As in the ERP analyses, power and phase coherence values following wins but not losses were modulated by reward probability. Some findings between ERP and frequency analyses diverged, suggesting that these analytic approaches provide complementary insights into neural processing. These findings suggest that the neural mechanisms of feedback processing may differ between wins and losses.
Keywords: reward prediction error, ERP, decision-making, EEG oscillations, reinforcement learning
Introduction
To optimize behavior, organisms must evaluate outcomes of their actions, and use these evaluations to guide decision-making. The neural mechanisms of feedback evaluation are receiving increasing attention in cognitive neuroscience. In particular, researchers using event-related potentials (ERPs) have identified a component of the feedback-locked ERP that is sensitive to the valence of the feedback. This feedback-related negativity (FRN) is a relatively negative deflection in the ERP following losses or error feedback compared to wins or positive feedback. The FRN peaks at around 300 ms and is maximal at fronto-central scalp electrode sites (Hajcak et al., 2005; Holroyd et al., 2003; Yasuda et al., 2004). Convergent findings from source modeling, fMRI, and single-unit recording studies suggest that the FRN is generated in the medial frontal cortex, and probably in the anterior cingulate cortex (Amiez et al., 2005; Brown and Braver, 2005; Mars et al., 2005; Miltner et al., 2003; Niki and Watanabe, 1979; Paulus et al., 2004; Ridderinkhof et al., 2004; Shidara and Richmond, 2002; Tsujimoto et al., 2006; van Schie et al., 2004; Williams et al., 2004). Topographically and functionally similar feedback-locked ERP modulations have been called the medial frontal negativity and feedback error-related negativity (Gehring and Willoughby, 2002; Holroyd et al., 2003). These effects also share many similarities with the error-related negativity (ERN), a negative-going mid-frontally distributed potential elicited by erroneous responses on speeded response tasks. These potentials are thought to reflect activation of a reinforcement learning system that rapidly evaluates outcomes of decisions to guide reward-seeking behavior (Holroyd and Coles, 2002; Nieuwenhuis et al., 2004). This system is capable of rapidly determining whether feedback is better or worse than expected, and encodes this difference between expectations and actual outcomes as a reward prediction error. The anterior cingulate cortex might use these prediction errors to improve performance due to its role in cognitive control and action monitoring (Barber and Carter, 2005; Bokura et al., 2001; Botvinick et al., 2004; Kerns et al., 2004).
Given that a reward prediction error is the difference between an expected and received reward, differences in expectations of rewards should modulate the size of prediction error signals. Single unit recording studies in nonhuman primates suggest that this is indeed the case, with more unexpected outcomes yielding larger neural responses in midbrain dopamine neurons (Fiorillo et al., 2003). It is unclear whether the magnitude of the FRN is also modulated by reward expectation, because previous studies have yielded inconsistent findings. In two studies (Holroyd et al., 2003; Yasuda et al., 2004), the magnitude of the FRN was larger when outcomes were unexpected. In another study, no statistically significant modulation was observed (Hajcak et al., 2005), although from visual inspection, it appears that the FRN was larger for unexpected than expected outcomes. Of the two studies that found a significant modulation, Yasuda and colleagues (2004) found that ERPs following both losses and wins were enhanced. In the Holroyd et al. (2003) study, however, it appears from visual inspection that only the win-related ERPs were modulated, although a statistical test of this asymmetry was not reported. We designed an experiment to investigate this issue further by examining not only how reward probability might modulate outcome-locked ERPs, but also how changes in reward expectation that occur during learning might further modulate ERPs.
Because the FRN (and ERPs in general) is measured by averaging single-trial EEG traces, this potential will not reflect oscillatory activity that varies in phase from trial-to-trial (particularly in high frequencies, such as gamma). Such event-related oscillations can be assessed using time-frequency decomposition analyses such as complex wavelet convolutions, from which one can obtain estimates of instantaneous power (i.e., energy at different frequencies) and inter-trial phase coherence (i.e., consistency of oscillation onset across trials). Recent findings using this approach have revealed novel insights into task-related cognitive processes beyond what is evident in averaged ERPs (Fell et al., 2004; Makeig et al., 2002; Salinas and Sejnowski, 2001). Although the frequency characteristics of feedback processing are largely unknown, research into the frequency characteristics of the response-related ERN (Bernat et al., 2005; Luu and Tucker, 2001; Luu et al., 2004; Trujillo and Allen, under review) suggests it reflects enhanced theta (i.e., 4–8 Hz) activity following incorrect compared to correct responses. Based on the idea that the ERN and FRN reflect similar mechanisms of monitoring and controlling behavior (Holroyd and Coles, 2002), we hypothesized that feedback processing would therefore induce increased EEG theta activity for losses compared to wins.
In the present study, we sought to investigate the effects of reward probability on ERP and oscillatory correlates of neural feedback processing. Subjects chose one of two targets on each trial, and received positive or negative feedback (plus or minus 10 cents) following each choice. In blocks of 80–150 trials, we manipulated the probability of winning and losing such that subjects had to learn which of the two targets rewarded more often in order to maximize their winnings. This design allowed us to examine neural responses to winning and losing as a function of the probability of wins and losses, using both conventional ERP and time-frequency analyses.
Materials and Methods
Subjects
Seventeen (6 male) subjects aged 20–30 from the University of Bonn community participated in this experiment. Subjects were paid the amount they earned in the experiment or 10 Euros per hour (whichever was higher), and typically earned around 25 Euros. Informed consent documents were signed prior to the start of the experiment, which was approved by the local ethics committee.
Experiment
On each of 1200 trials during the experiment, subjects saw two small targets on the left and right side of the screen, and had to choose one on each trial, after which they either won or lost €0.10 (see Fig 1a). Visual feedback indicating the subjects’ response (a green box behind the target) was shown for 600 ms, followed by a reward (10 cents) or punishment (−10 cents) that was shown for 1000 ms. A variable, 1500 – 2500 ms inter-trial-interval separated each trial. If subjects did not select a target after 2000 ms, they lost on that trial. Self-paced rest breaks were given every 30 trials, during which time subjects saw how much money they had earned so far. Within each block of trials, the probability of wins and losses associated with each target was surreptitiously manipulated. For example, on some blocks, one target would reward with 75% probability and the other target would reward with 25% probability. We refer to the “25 target” as trials when subjects chose the target that rewarded 25% of the time, and the “75 target” as trials when subjects chose the target that rewarded 75% of the time. In a third condition, both targets rewarded with 50% probability, and we refer to all trials in these blocks as the “50 target.” Probabilities were fixed across trials within blocks, which lasted 80–150 trials (block length was randomly chosen by the computer at the start of each block; see Figure 1b for examples). Block order and length was randomized and interchanged across subjects. Subjects were instructed to choose one of the two targets on each trial, and to try to win as much money as possible. The entire experiment, including time to set up, was approximately 2.5 hours.
Figure 1.
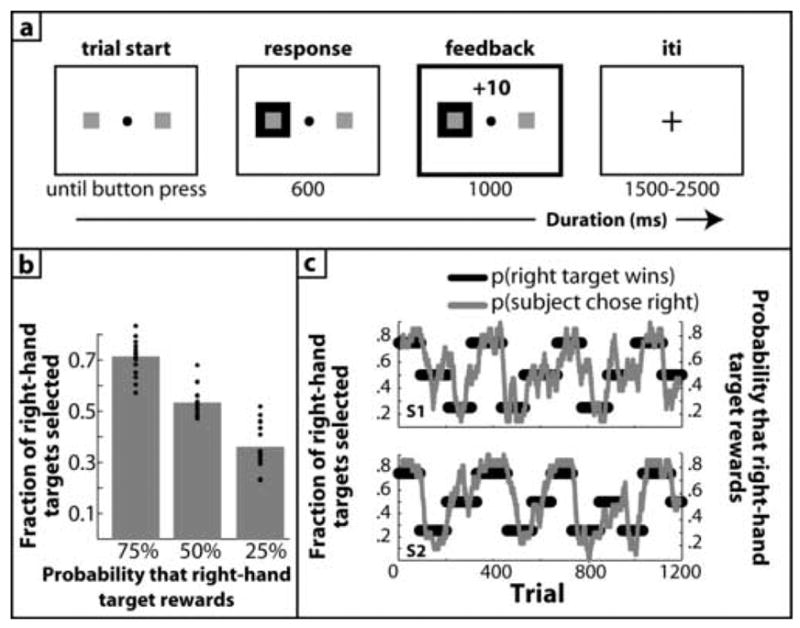
Overview of experiment and behavioral results. (a), visual display and timing of one trial. Time flows from left to right, numbers indicate the duration of each event in ms. All analyses were time-locked to the onset of the feedback stimulus (bolded box). iti=inter-trial-interval. (b), average (gray bars) and single-subject (black dots) proportion of right-hand target selections as a function of probability manipulation. (c), behavioral results from two subjects. The x-axis represents trials during the experiment and the y-axis represents the probability that the right-hand target rewards and the local fraction of right-hand responses selected by the subject. Thick black lines represent the reward probability and thinner gray lines represent the local fraction of right-hand responses (choices smoothed with a 20-trial kernel running average filter).
EEG recording and analyses
EEG data were recorded at 1,000 Hz (with an anti-aliasing low-pass filter set at 300 Hz) from 21 scalp electrodes spread out across the scalp, and 4 ocular (two HEOG and two VEOG) electrodes. All EEG channels were referenced to the left mastoid, and were re-referenced online to the average of the left and right mastoids by the acquisition software. Scalp channels were Fp1, Fp2, F3, F4, C3, C4, P3, P4, O1, O2, F7, F8, T7, T8, P7, P8, Cz, Fz, Pz, F9, and F10. Data were resampled to 250 Hz and bandpass filtered from .1 to 40 Hz off-line for ERP analyses, and were left unfiltered for frequency analyses. Trials containing blink or other artifacts were removed prior to averaging (mean: 11%; standard error: 4%). Data were analyzed with the eeglab toolbox (Delorme and Makeig, 2004) (available at http://sccn.ucsd.edu/eeglab/) in Matlab. In the present study, we separately analyzed ERPs to wins and losses, rather than the difference between losses and wins, because we were interested in testing whether reward probability might have asymmetric effects depending on the feedback valence. Statistical analyses were performed by entering average ERP values from windows of 300–400 (when loss-win difference was maximal) and 400–600 (when the probability effects were maximal) ms post-feedback window into repeated-measures ANOVAs using SPSS 11 software. Greenhouse-Geisser corrections were used, and adjusted degrees of freedom are reported. ERPs were averaged across a time window to minimize potential noise fluctuations in ERP waveforms. To confirm that our findings reflected modulations of the FRN instead of the P300, we conducted additional ANOVAs on the difference between the most positive and most negative peak (i.e., the “peak-to-peak” amplitude) in a 200–600 ms time window (e.g., Yeung and Sanfey, 2004). We included midline electrodes Fz, Cz, and Pz in the ANOVAs.
Frequency analyses
Induced spectral EEG activity was assessed by creating event-related spectral perturbations using a complex sinusoidal wavelet transform procedure as implemented in eeglab (Delorme and Makeig, 2004). Briefly, the procedure involves convolving the time domain signal with a complex sinusoidal wavelet with increasing cycles as frequencies increase (Delorme and Makeig, 2004). The resulting complex signal provides an estimate of instantaneous power and phase for each time point at frequencies of 4 – 48 Hz. This procedure is done on each trial, and then power values are averaged across trials. Power values were normalized with respect to a −200 to 0 ms prestimulus baseline and transformed into decibel scale (10*log10 of the signal). Phase coherence is calculated across trials using circular variance, and phase-coherence values vary from 0 to 1, with 0 indicating completely randomized phases across trials and 1 indicating completely locked phases across trials. We used an EEG epoch window of −500 to +1000 ms from each event to ensure that edge effects would not contaminate our windows of interest, and visual inspection confirmed that edge effects did not extend into our time windows of analyses. Statistical analyses were conducted by entering average power and phase coherence values from 300–400 and 400–600 ms post-feedback in 4–8 (theta band) and 21–29 (lower gamma band) Hz windows for each condition into 2 (frequency band) X 2 (feedback: win or lose) X 3 (probability: 25, 50, 75) repeated measures ANOVAs. For these analyses, we focused on data from electrode Fz because topographic distributions of power and phase exhibited a fronto-central peak that was maximal around Fz in both time windows (see Figures 5 and 6 for examples in the 300–400 ms time window). The Greenhouse-Geisser correction was used to adjust the degrees of freedom. We selected theta and gamma band activity based on previous EEG research, which suggests strong task-related activity in the theta range (Kirk and Mackay, 2003; Klimesch, 1999; Luu et al., 2004) and lower gamma range (Keil et al., 2001), and based on visual inspection of time-frequency plots, which show predominant energy in these ranges (e.g., Figure 5c). We note that 21–29 Hz is sometimes referred to as fast or upper beta (Steriade, 2006) and sometimes as lower gamma (Keil et al., 2001; Shibata et al., 1999); we use the latter term without intention of distinguishing lower gamma from upper beta.
Figure 5.
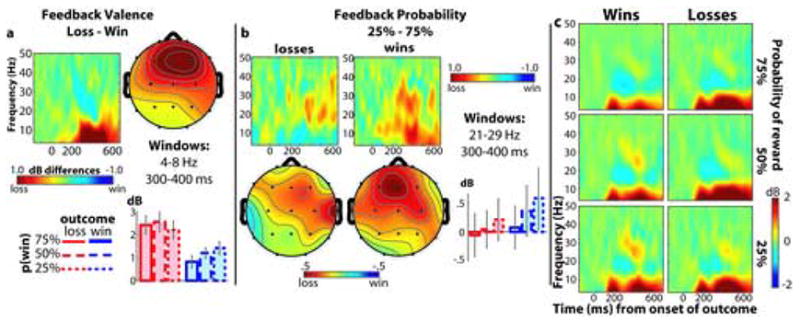
Effects of feedback valence and probability on frequency power. (a), difference in power between losses and wins. The time-frequency map shows the subtraction of power values of losses from wins over time (x-axis; 0 is onset of feedback stimulus) and frequency (y-axis). Red colors indicate more power for losses and blue colors indicate more power for wins. Topographical map and bar graphs show data taken from a 300–400 ms, 4–8 Hz window. (b), effect of reward probability on power values. Time-frequency and topographical distributions are separately plotted for losses (left) and wins (right) from a 300–400 ms, 21–29 Hz window. (c) displays the time-frequency plots separately for all combinations of feedback valence (rows) and reward probability (columns). All data are taken from electrode Fz, where the effects were maximal.
Figure 6.
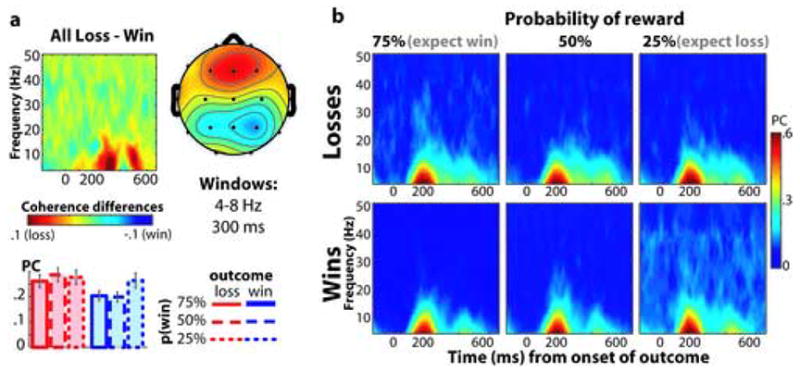
Effects of feedback valence and probability on inter-trial phase coherence. (a), difference in phase coherence values between losses and wins. The time-frequency map shows the subtraction of coherence values of losses from those of wins over time (x-axis; 0 is onset of feedback stimulus) and frequency (y-axis). Red colors indicate enhanced coherence for losses and blue colors indicate enhanced coherence for wins. Topographical map and bar graphs show data taken from a 300–400 ms, 4–8 Hz window. (b) displays the time-frequency plots separately for all combinations of feedback valence (rows) and reward probability (columns). All data are taken from electrode Fz.
Results
Behavior
Although subjects were not told about changes in probabilities of rewards, they quickly adapted their behavior to find the optimal strategy: During blocks when the right-hand target rewarded 25%, 50%, and 75% of the time, subjects selected the right-hand target on 36.1%, 53.4%, and 71.4% of trials (SEM: 2.1%, 1.4%, 1.7%), respectively (Figure 1b). A 3-way ANOVA revealed a main effect of probability (F2,32=97.70, p<.0001), and planned comparisons of the simple effects confirmed that each condition was significantly different from each other (75>50: t16=9.22; 75>25: t16=10.50; 50>25: t16=8.63; all p’s<.001). Response times, however, did not differ according to condition (496, 489, 474 ms for 75, 50, and 25 conditions respectively; F2,32=2.00, p=.15). In Figure 1c we display the trial-by-trial choices and reward probability blocks for two subjects to demonstrate how they adapted their behavior to changes in reward contingency.
ERP (time domain) responses to feedback
Valence effects
We observed a prominent FRN (e.g., loss-win ERPs) in each reward probability condition (see Figure 2). This effect had a similar fronto-central topographical distribution in each condition (left panel of Figure 3), and peaked at around 320 ms. A 3 (target: 25, 50, 75) X 2 (feedback: win, loss) repeated-measures ANOVA on ERP responses from a 300–400 ms post-feedback window revealed a highly significant effect of feedback (F1,16=17.18, p<.001), which was larger at Fz than at Cz or Pz (F1.8,14=15.9, p<.001). These effects were also statistically significant when we analyzed the peak-to-peak amplitude differences (see Methods). In a later time window of 400–600 ms, there was a significant feedback valence effect (F1,16=9.23, p=.003), although it was in the opposite direction (i.e., loss-related ERPs were more positive than were win-related ERPs; see Figures 2 and 3). There was also a valence effect X electrode site interaction (F1.5,24.3=8.88, p=.003). Follow-up analyses revealed that, in this time window, the valence effect was largest at Pz, and was not significant at Fz (F1,16=3.66, p=.075).
Figure 2.
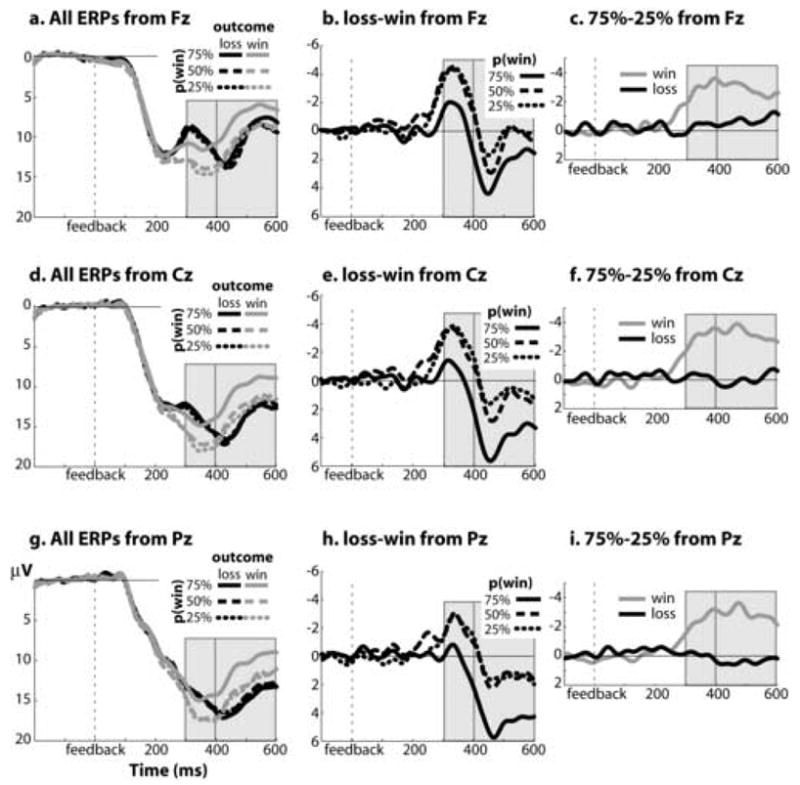
Grand-averaged ERP responses to feedback. Left column depicts all ERPs following losses (black lines) and wins (gray lines) as a function of probability for electrodes Fz (a), Cz (d) and Pz (g). Middle column displays FRN (i.e., the difference wave for losses compared to wins) for each probability condition for electrodes Fz, Cz, and Pz. Right column displays the probability effect (75 target – 25 target) separately for losses and wins. Light gray bars indicate the window used for statistical analyses. Note that b, c, e, f, h, and i have the same y-axis scaling, and a, d, and g have a different y-axis scaling.
Figure 3.
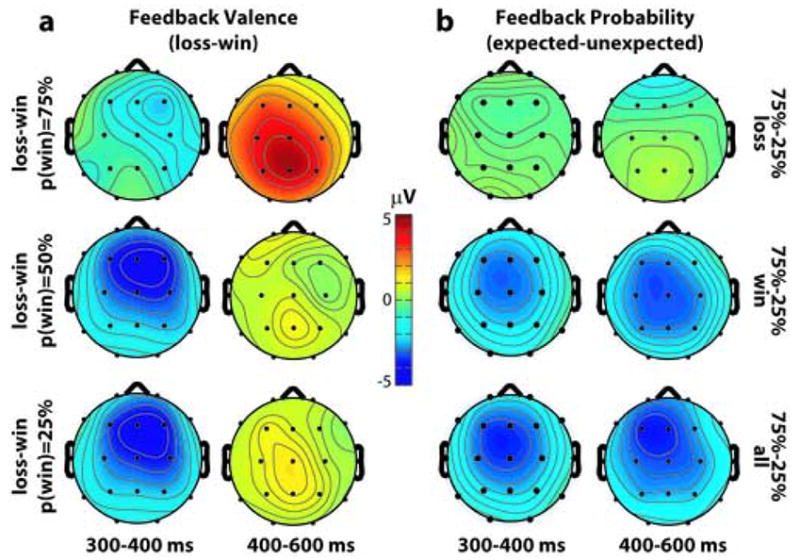
Topographical distribution maps taken from a 300–400 ms post-feedback window. (a), maps of the feedback valence effect (loss - win) as a function of reward probability during the 300–400 ms window (left column) and 400–600 ms window (right column). (b), the probability effect (75% vs. 25% probability of reward) as following losses (top), wins (middle), and losses and wins averaged together (bottom). Topographic differences for 75%–25% are displayed, but all probability differences (e.g., 75%–50%) for wins have nearly identical topographic distributions.
Reward probability effects
From 300–400 ms, there was a significant main effect of probability (F1.6,26.8=7.68, p=.004), although it is qualified by a feedback valence X probability interaction (F1.9,31.5=12.11, p=.001). Specifically, ERPs following losses were not modulated by probability (F1.7,27.9=.29, p=.716), whereas ERPs following wins were significantly affected by probability with a 25>50>75 profile (F1.8,29.2=22.28, p<.001). As seen in Figure 2a, 2d, and 2g, this interaction was driven by the response to 75 target wins. All of these effects were also statistically significant when we analyzed the peak-to-peak amplitude differences. Additional ANOVAs confirmed that the probability X feedback valence interaction extended later in time (400–600 ms window: F1.9,12.1=6.31, p=.005). There were no interactions involving electrode site and probability in either time window (all p’s>.15).
ERP changes during learning
The previous set of analyses focused on changes in ERPs across blocks. In our next set of analyses, we examined how feedback potentials might change within blocks, as learning progressed. To do this, we quantified differences in the ERPs between the first third and the last third of trials in each block, when subjects were learning and had learned, respectively, the changes in optimal response patterns. As seen in Figure 4a–b, ERP responses to rewards, but not to losses, changed with learning. Specifically, ERP amplitudes became less positive as subjects learned that rewards become more likely for the 75 target. Conversely, ERP responses became more positive as subjects learned that rewards become less likely for the 25 target. To quantify this effect, we conducted a 3 [target: 25, 50, 75] X 2 [time: first vs. last third of block] x 3 [electrode: Fz, Cz, Pz] ANOVA on win responses, which revealed a significant target X time interaction (F1.5,23.8=3.84, p=.04). The interaction (see top panel of Figure 4a) is especially striking when comparing ERPs elicited by the 25 target at the last third of the block (i.e., when wins are the most unexpected) and those elicited by the 75 target at the last third of the block (i.e., when wins are the most expected). A direct contrast between these conditions revealed that ERPs were significantly more positive in the 25 target condition as compared with the 75 target condition (14.46 and 10.42 μV, respectively, at Fz; post-hoc t-test: t16=4.74, p<.01). The learning effect was specific for wins: As shown in Figure 4b, responses to losses did not differ as a function of learning (F1.8,30.1=.841, p=.435). Even when comparing losses that presumably were the least and most expected (75 target at last third and 25 target at last third, respectively), ERPs were of nearly identical magnitude (9.38 and 9.14 μV at Fz, t16=0.31). Thus, learning about reward probabilities within each block was associated with changes in ERPs following wins, whereas learning did not modulate ERPs following losses.
Figure 4.
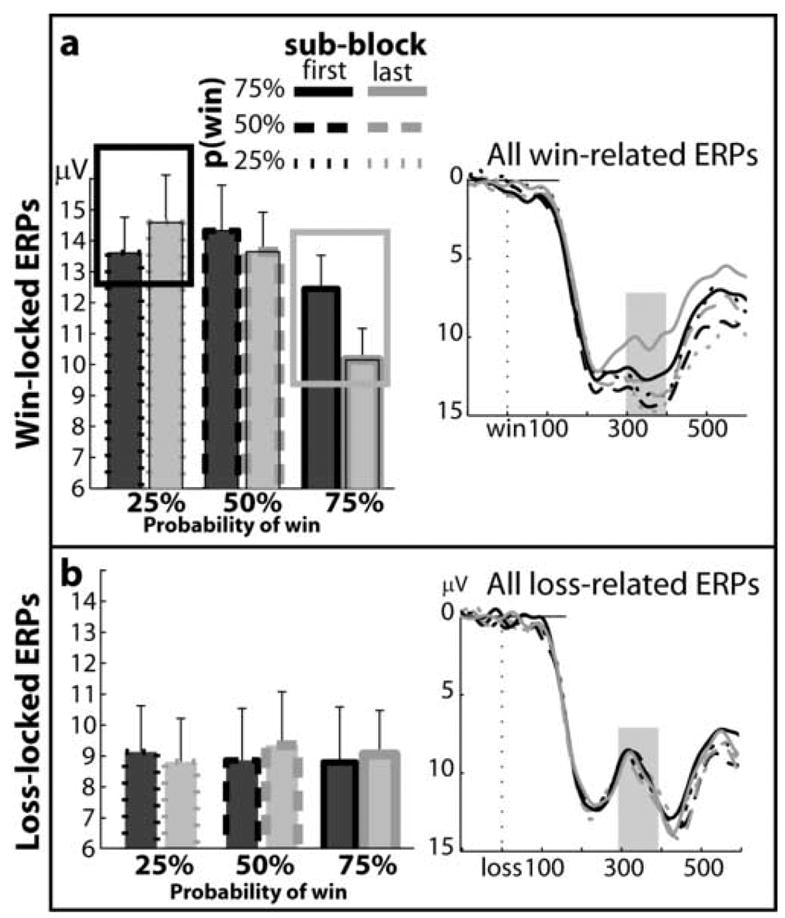
Changes in ERP responses to feedback during learning. ERPs were separated according to the probability condition and epoch (first vs. last third of trials) within blocks for wins (top panel) and losses (bottom panel). On the right are all ERPs, and on the left are bar graphs showing averaged ERP responses from 300–400 ms (light gray bar in ERP plots). The interaction (“learning effect”) is highlighted with boxes. In the 25 target condition, as subjects learn that rewards are infrequent, ERP responses to rewards become more positive (black box). Conversely, in the 75 target condition, as subjects learn that rewards are likely, ERP responses to rewards become less positive (gray box). This pattern of effects was not seen for losses (bottom panel).
Because the overall probability effect peaked later in time (see Figure 2), we additionally conducted ANOVAs on ERPs from a 400–600 ms time window. The learning effects continued to be significant following wins (F1.5,24.7=8.45, p=.003), but not following losses (F1.8,29.3=0.20, p=.79). This effect was not significant when using peak-to-peak amplitude. There were no significant interactions involving electrode site in either time window (all p’s>.11).
Frequency decomposition of EEG
Effects of feedback valence
Figures 5a and 6a display the loss-win spectrograms, topographical maps, and bar graphs for power and phase, respectively. As shown in these Figures, feedback valence modulated power and phase values differently in the two frequency bands. Specifically, for power values, there was a significant frequency band X valence cross-over interaction from 300–400 ms in Fz (F1,16=37.94, p<.001), such that in the theta band, there was more power following losses than wins (F1,16=28.65, p<.001), whereas in the gamma band, there was more power following wins than losses (F1,16=4.91, p=.042) (see bargraphs in Figure 5a–b). ANOVAs from a time window of 400–600 ms revealed that the loss>win effect remained significant (F1,16=36.66, p<.001). For phase coherence values, we found a significant frequency band X valence interaction (F1,16=8.47, p=.010), such that in the theta band there was greater phase coherence following losses compared to wins (F1,16=8.84, p=.009), but in the gamma band there was no effect of feedback valence (F1,16=.44, p=.516). ANOVAs from a time window of 400–600 ms revealed no effects of feedback valence (all p’s>.3). We additionally plotted the time course of power and phase separately for each condition in Figure 7. For illustrative purposes, we calculated a t-test of the difference between theta power following losses versus that following wins at each time point, and time points with a t-value of p<.01 have a bolded x-axis.
Figure 7.
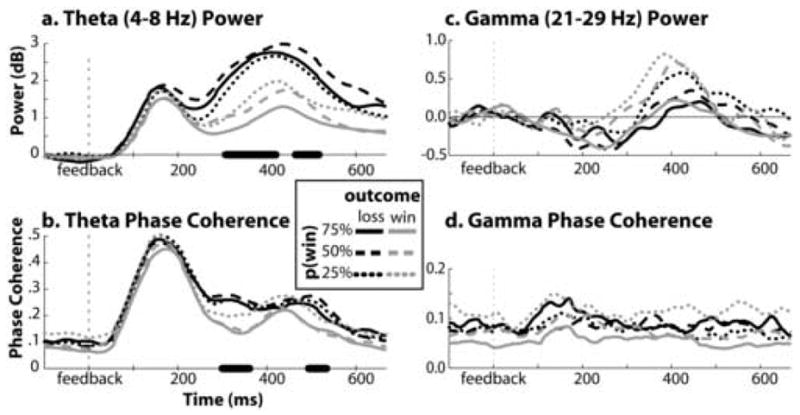
Time course of power (top panel) and phase coherence (bottom) in theta (left) and gamma (right) frequency bands, plotted separately for combinations of feedback valence and probability. A paired-sample t-test between values for losses and wins (averaging over probability condition) at each time point was run, and values that were significant at p<.01 have bolded x-axes. Full ANOVAs of these differences are reported in the text. Data are taken from electrode Fz.
Effects of reward probability
In our next set of analyses, we tested whether feedback probability affected power and phase values. These effects largely paralleled those of the time domain, such that reward probability modulated EEG power following wins but not following losses. Specifically, for power values, there was a significant valence X probability interaction (F1.2,20.3=4.03, p=.050), such that power values following wins increased with decreasing reward probability (F1.5,24.5=6.99, p=.007), but were not significantly altered following losses (F1.5,25.3=.468, p=.587). There were no interactions involving probability and frequency band (p’s>.3), suggesting that reward probability did not differentially affect power in the two frequency bands. ANOVAs from a time window of 400–600 ms revealed the same pattern of results (see Table 1 for statistical values).
Table 1.
Summary of effects
| Effect | Dependent variable | Time window (ms) | F-value | p-value | direction |
|---|---|---|---|---|---|
| Feedback valence | |||||
| ERP | 300–400 | 17.18* | <.001* | win>loss | |
| ERP | 400–600 | 3.66 | .075 | win>loss | |
| Feedback valence: theta | |||||
| Power | 300–400 | 28.65* | <.001* | loss>win | |
| Power | 400–600 | 36.66* | <.001* | loss>win | |
| Phase | 300–400 | 8.84* | .009* | loss>win | |
| Phase | 400–600 | 6.51* | .021* | loss>win | |
| Feedback valence: gamma | |||||
| Power | 300–400 | 4.91* | .042* | win>loss | |
| Power | 400–600 | ||||
| Phase | 300–400 | ||||
| Phase | 400–600 | ||||
| Reward probability: wins | |||||
| ERP | 300–400 | 22.28* | <.001* | 25>50>75 | |
| ERP | 400–600 | 21.77* | <.001* | 25>50>75 | |
| Power | 300–400 | 6.99* | .007* | 25>50>75 | |
| Power | 400–600 | 6.52* | .006* | 25>50>75 | |
| Phase | 300–400 | 22.89* | <.001* | 25>50>75 | |
| Phase | 400–600 | 24.86* | <.001* | 25>50>75 | |
| Reward probability: losses | |||||
| ERP | 300–400 | ||||
| ERP | 400–600 | ||||
| Power | 300–400 | ||||
| Power | 400–600 | 3.53* | .043* | 50>75>25 | |
| Phase | 300–400 | ||||
| Phase | 400–600 | ||||
| Learning: wins | |||||
| ERP | 300–400 | 3.84* | .040*Ω | 253>251; 751>733 | |
| ERP | 400–600 | 8.45* | .003* | 253>251; 751>733 | |
| Power (theta) | 300–400 | ||||
| Power (theta) | 400–600 | ||||
| Phase (theta) | 300–400 | ||||
| Phase (theta) | 400–600 | ||||
| Learning: losses | |||||
| ERP | 300–400 | ||||
| ERP | 400–600 | ||||
| Power (theta) | 300–400 | ||||
| Power (theta) | 400–600 | ||||
| Phase (theta) | 300–400 | 2.06 | .152 | ||
| Phase (theta) | 400–600 | 2.02 | .155 | ||
Notes: indicates statistically significant effects. Subscripts indicate position within block (first third or last third). See text for degrees of freedom.
Results from all ERP analyses in the 300–400 ms window were also significant when using peak-to-peak measurements except this one. Only statistics from Fz are reported. Entries with an F-value less than 2 are omitted.
For phase coherence values, we found a significant valence X probability interaction (F1.7,27.1=14.67, p=.020), such that phase coherence following wins increased with decreasing reward probability (F1.4,23.0=22.89, p>.001), whereas phase coherence following losses was unaffected by reward probability (F1.8,29.8=1.36, p=.270). As with power, there were no interactions involving probability and frequency band interaction (p’s>.5), suggesting that the impact of probability was not different in the two frequency bands. ANOVAs from a time window of 400–600 ms revealed the same pattern of findings (statistical values in Table 1).
Learning effects
Finally, we examined whether there were changes in power or phase as a function of learning. There were no main effects or interactions involving position within block for wins or losses for power or phase values in theta or gamma bands (all F’s<2).
Comparison between time- and frequency-domain effects
To more formally compare information from ERPs and frequency decomposition, we conducted two analyses to correlate the magnitude of the ERPs with the average power and phase coherence values from theta and gamma bands. First, we correlated the average ERP magnitudes from 300–400 ms from Fz with theta and gamma power and phase coherence values from the same time window. As seen in Table 2, there were significant correlations between ERPs and power in the gamma band in all conditions, but no significant correlations between ERPs and theta band activity. However, increased power could simultaneously decrease the magnitude of ERPs in the trough of the wave and increase the magnitude of the peak of the wave, thus causing no change in the average amplitude in a time window. Thus, in a second analysis, we correlated power and phase coherence values with the peak-to-peak amplitude measure (see Methods). In this analysis, a reverse pattern of findings was observed: ERPs were strongly correlated with theta power and phase coherence, but not with gamma activity (Table 3). Interestingly, peak-to-peak measures of ERPs in nearly all conditions were significantly correlated with theta phase coherence, but were strongly correlated with theta power only following losses. Finally, there were no significant correlations among theta and gamma power and phase values in any condition.
Table 2.
Correlation coefficients among average ERP amplitude and frequency-domain effects from 300–400 ms in Fz.
| Loss | Win | |||||
|---|---|---|---|---|---|---|
| 75% | 50% | 25% | 75% | 50% | 25% | |
| Theta power | −0.06 | −0.21 | −0.11 | 0.27 | 0.28 | −0.01 |
| Theta phase | −0.11 | −0.04 | 0.07 | 0.35 | 0.34 | 0.27 |
| Gamma power | 0.65** | 0.50* | 0.72** | 0.62** | 0.55* | 0.72** |
| Gamma phase | 0.32 | −0.03 | 0.09 | −0.29 | −0.15 | −0.04 |
Notes: indicates correlation coefficient is statistically significant at p<.05;
indicates p<.01.
Table 3.
Correlation coefficients among ERP peak-to-peak differences from 200–500 ms and theta and gamma band activity from 300–400 ms average in electrode Fz.
| loss | win | |||||
|---|---|---|---|---|---|---|
| 75 | 50 | 25 | 75 | 50 | 25 | |
| theta power | 0.72** | 0.61** | 0.70** | 0.09 | 0.14 | 0.19 |
| theta phase | 0.76** | 0.82** | 0.84** | 0.61** | 0.68** | 0.36 |
| gamma power | 0.15 | 0.32 | 0.45 | 0.13 | 0.23 | 0.55* |
| gamma phase | 0.12 | 0.23 | 0.27 | −0.24 | −0.29 | −0.32 |
Notes: indicates correlation coefficient is statistically significant at p<.05;
indicates p<.01.
Discussion
In the present study, we examined whether and how expectations of rewards and losses affected ERP and oscillatory correlates of feedback processing. We found that ERPs, theta, and gamma activity following wins, but not losses, were modulated by the feedback probability manipulation. This was seen both across and within (i.e., learning effects) blocks of trials. Additionally, we found enhanced power and cross-trial phase coherence in the theta frequency band (4–8 Hz) for losses compared to wins, but opposite effects in the lower gamma frequency band (21–29 Hz). Together, these findings provide strong evidence for a valence-related asymmetry in EEG correlates of feedback processing.
Win-related, but not loss-related, ERPs were modulated by feedback probability
We observed modulations in the magnitude of the loss-win ERP difference wave according to the probability of reward vs. loss feedback. Closer inspection revealed that this effect was driven by win-related ERPs. Indeed, loss-related ERPs were unaffected by the probability manipulation. This interaction was present regardless of analysis approach (average amplitude values or peak-to-peak amplitude differences) or time window. Within the win conditions, ERPs following 50 and 25 target wins differed only slightly, whereas ERPs following the 75 target wins showed a larger and more sustained effect. This may have been due to subjects overestimating the 25 target condition as being closer to the 50 target condition. This interpretation is also consistent with the asymmetry in behavioral responses: When the right-hand target rewarded 25% of the time, subjects chose that target on 36% of trials (compare with 53% and 71% when the right-hand target rewarded 50% and 75% of the time).
To our knowledge, no previous study has reported asymmetric effects of reward probability on feedback ERPs. However, close examination suggests that a similar effect might have been present in previous studies. For example, from visual inspection, it appears that Holroyd and colleagues (2003; Figure 1) found modulations of win-related, but not loss-related, ERPs, although this asymmetry was not tested. Such an asymmetry can also be seen in two recent studies by Hajcak and colleagues. In the first (Hajcak et al., 2005), it appears that the FRN was larger following unexpected compared to expected outcomes (Figures 2 and 4), although these effects were reported to be nonsignificant. In the second study (Hajcak et al., 2006), in which they manipulated the size (rather than probability) of rewards and losses, differently sized losses (5 vs. 25 cents) yielded indistinguishable ERPs, but larger wins elicited larger ERPs than smaller wins. Here as well the effects were visually observable but not statistically significant. It is possible that there were not enough trials to statistically identify these modulations. Finally, in a study by Yasuda et al. (2004), ERPs following both wins and losses appear to be modulated by the level of expectation.
A more sensitive measure of expectation-related modulations in the ERPs comes from inspection of changes in ERPs that occur as learning progresses (i.e., differences between ERPs during the first and last third of trials in each block). We found that changes in win-related ERPs were consistent with predictions of reinforcement learning theory. Specifically, in reinforcement learning theory, reward prediction errors should increase or decrease as rewards become less or more expected, respectively. Consistent with this prediction, we found that in the 25 target condition, as subjects learned that rewards are relatively infrequent, ERP magnitudes became more positive, whereas in the 75 target condition, as subjects learned that rewards are likely, ERP magnitudes became less positive. This pattern of changes in the magnitude of neural feedback responses is similar to results showing that the magnitude of the FRN decreased over the course of probabilistic learning experiments (Mars et al., 2005; Nieuwenhuis et al., 2002). In the Nieuwenhuis et al. (2002) study, for example, subjects learned to select particular stimuli that were associated with either 20%, 50%, 80%, or 100% probability of reward. Consistent with our findings, they found that FRN magnitudes decreased as a function of reward probability across the experiment. Similar results were obtained by Holroyd and Coles (2002). Given that this modulation was specific to wins in our study, it is possible that the changes in FRN magnitude in the Nieuwenhuis et al. (2002) and Holroyd et al. (2002) studies were driven solely by responses to wins.
One might wonder whether our ERP effects are more related to the P300, a complex of ERP modulations that has been related to stimulus probability, subjective confidence, and target detection (Donchin and Coles, 1988; Johnson, 1993; Kugler et al., 1993; Polich and Kok, 1995; Squires et al., 1976). Although the later temporal peak of the probability effect is consistent with this speculation, several considerations suggest that the probability-related ERP modulations are more closely related to the FRN than to the P300. Specifically, if the effects were P300 modulations, one would make at least two predictions: First, the P300 should be larger following all low-probability events, independent of the valence of the outcome (Yeung and Sanfey, 2004). This might reflect stimulus probability estimations and/or a context-updating process (Donchin and Coles, 1988; Johnson, 1986; Johnson and Donchin, 1980). Second, the effects should have a posterior spatial distribution with a peak around Pz. In contrast to these predictions, the probability manipulation affected only win-related ERPs, and there were no probability effects on responses to losses (see Figure 2), regardless of the time window, measurement approach (average ERP amplitude or peak-to-peak difference), or data domain (time vs. frequency). Further, the probability effects we observed had an anterior topography (see Figure 3). Indeed, the probability effects were numerically smaller at Pz than at electrodes Fz and Cz. Even from 400–600 ms, when the probability effects were largest in time, the effects were smaller at Pz than at Cz (see Figure 3). These observations, combined with previous dissociations of the FRN and P300 (Sato et al., 2005; Yeung and Sanfey, 2004), suggest that our findings are more related to the FRN than the P300.
Oscillations in feedback-locked potentials
Medial frontal regions including the anterior cingulate exhibit large theta oscillations that are present at rest, during sleep, and during cognitive tasks, and are modulated by task demands such as working memory, attention, and action selection (Basar-Eroglu et al., 1992; Basar-Eroglu and Demiralp, 2001; Ishii et al., 1999; Kubota et al., 2001; Onton et al., 2005; Tsujimoto et al., 2006; Wang et al., 2005). Little is known about frequency characteristics of feedback processing, but researchers have investigated the frequency characteristics of response error processing. In these cases, response errors, compared with correct responses, is associated with enhanced theta power (Gevins et al., 1997; Luu et al., 2004; Trujillo and Allen, under review; Yordanova et al., 2004). To the extent that similar mechanisms underlie processing of error responses and error feedback (Holroyd & Coles, 2002), these findings are consistent with our finding of enhanced theta power and phase-locking following losses compared to wins. More directly relevant to our findings, Luu and Tucker (2001) observed an FRN in response to error feedback after band-pass filtering their data in the theta range, suggesting that much of the energy in the FRN comes from theta frequencies.
We also found that power and phase coherence were modulated by the probability of rewards. Consistent with what we observed in the ERPs, following wins, theta power and phase coherence values tracked the probability of rewards, such that the less likely the reward, the larger the power and phase coherence values. Following losses, however, no such modulation was observed. Previous studies have reported that decreased stimulus probability increases theta power at around 300 ms (Spencer and Polich, 1999; Yordanova et al., 2000). However, these previous experiments used tones that did contain any valence or motivational value, and, to our knowledge, an asymmetry between responses to losses and to wins has not been previously reported.
Correspondence between time domain and frequency analyses
Many analyses revealed similar patterns of results across the time and frequency domains. For example, the probability manipulation affected neural responses to wins, but not to losses, in ERPs, theta power, and phase coherence. We also observed some important differences between the time and frequency domain results. Most notably, we observed a cross-over interaction between feedback valence in theta and gamma bands, such that there was more theta power following losses compared to wins, but more gamma power following wins compared to losses. Lower gamma has been associated with thalamocortical and cortico-cortical coupling (Steriade, 2006), suggesting enhanced connectivity during wins compared to losses. On the other hand, the changes in ERPs as a function of learning were not observed in the frequency domain. Thus, time- and frequency-domain analyses provided some overlapping, but some independent, insights into task-induced EEG activity.
When directly correlating ERPs and frequency information, we found differences in how the ERPs related to gamma and theta according to our ERP measurement approach. Specifically, average ERP amplitudes were correlated with gamma power but not with theta activity, whereas peak-to-peak amplitudes were correlated with theta activity but not with gamma. This finding, the lack of correlations between theta and gamma activity, and the cross-over interaction between the loss-win effect in theta and gamma bands together suggest that independent neural processes drive theta and gamma activity in this task.
The present findings raise the question of whether the FRN (and ERPs in general), arise from bursts of increased neural activity or from phase-locking of ongoing oscillations. The oscillatory nature of loss-related ERPs is apparent from visual inspection of the time domain ERPs, both in our study and in other FRN and response-locked error negativity papers. Conceptualizing the loss-related ERP as a theta oscillation also provides a parsimonious interpretation for the fact that there are three to four peaks of the loss-related ERP (around 200, 300, 420, and possibly 550 ms in Figure 2): If the neural response to losses is conceptualized as a phase-locked theta oscillation, these peaks may reflect the same neural process. Finally, the correlations between frequency information and ERP measures suggest that whereas all feedback-related ERPs comprise phase-locking in the theta band and enhanced gamma power, only responses to losses are additionally driven by power in the theta band. One caution, however, is that any signal, even if there are no oscillations present, can be perfectly represented in frequency space, given fine enough sampling between frequencies. Yeung and colleagues provide an example of this applied to EEG data (Yeung et al., 2004). They created an artificial EEG dataset that contained only activity bursts and no oscillations. When the data were transformed into frequency space using complex sinusoidal wavelets, enhanced power in the theta range was observed following “error” compared to “correct” trials. Thus, although we feel that loss-related ERPs may be more easily conceptualized as a theta wave than as a series of phasic neural bursts, our findings do not provide irrefutable evidence either way (see also Mazaheri and Jensen, 2006).
In conclusion, we have provided strong evidence for an asymmetry between EEG responses to losses and wins. These findings additionally suggest that future research might benefit from considering win and loss responses separately, rather than considering their differences as a single measure.
Acknowledgments
We thank Erin McMorris for her help running subjects, and Juergen Fell and Deborah Hannula for their insightful comments and discussions, and two anonymous reviewers for their comments and suggestions. MXC is supported by a NIDA NRSA.
Footnotes
Publisher's Disclaimer: This is a PDF file of an unedited manuscript that has been accepted for publication. As a service to our customers we are providing this early version of the manuscript. The manuscript will undergo copyediting, typesetting, and review of the resulting proof before it is published in its final citable form. Please note that during the production process errors may be discovered which could affect the content, and all legal disclaimers that apply to the journal pertain.
References
- Amiez C, Joseph JP, Procyk E. Anterior cingulate error-related activity is modulated by predicted reward. Eur J Neurosci. 2005;21:3447–3452. doi: 10.1111/j.1460-9568.2005.04170.x. [DOI] [PMC free article] [PubMed] [Google Scholar]
- Barber AD, Carter CS. Cognitive control involved in overcoming prepotent response tendencies and switching between tasks. Cereb Cortex. 2005;15:899–912. doi: 10.1093/cercor/bhh189. [DOI] [PubMed] [Google Scholar]
- Basar-Eroglu C, Basar E, Demiralp T, Schurmann M. P300-response: possible psychophysiological correlates in delta and theta frequency channels. A review. Int J Psychophysiol. 1992;13:161–179. doi: 10.1016/0167-8760(92)90055-g. [DOI] [PubMed] [Google Scholar]
- Basar-Eroglu C, Demiralp T. Event-related theta oscillations: an integrative and comparative approach in the human and animal brain. Int J Psychophysiol. 2001;39:167–195. doi: 10.1016/s0167-8760(00)00140-9. [DOI] [PubMed] [Google Scholar]
- Bernat EM, Williams WJ, Gehring WJ. Decomposing ERP time-frequency energy using PCA. Clin Neurophysiol. 2005;116:1314–1334. doi: 10.1016/j.clinph.2005.01.019. [DOI] [PubMed] [Google Scholar]
- Bokura H, Yamaguchi S, Kobayashi S. Electrophysiological correlates for response inhibition in a Go/NoGo task. Clin Neurophysiol. 2001;112:2224–2232. doi: 10.1016/s1388-2457(01)00691-5. [DOI] [PubMed] [Google Scholar]
- Botvinick MM, Cohen JD, Carter CS. Conflict monitoring and anterior cingulate cortex: an update. Trends Cogn Sci. 2004;8:539–546. doi: 10.1016/j.tics.2004.10.003. [DOI] [PubMed] [Google Scholar]
- Brown JW, Braver TS. Learned predictions of error likelihood in the anterior cingulate cortex. Science. 2005;307:1118–1121. doi: 10.1126/science.1105783. [DOI] [PubMed] [Google Scholar]
- Delorme A, Makeig S. EEGLAB: an open source toolbox for analysis of single-trial EEG dynamics including independent component analysis. J Neurosci Methods. 2004;134:9–21. doi: 10.1016/j.jneumeth.2003.10.009. [DOI] [PubMed] [Google Scholar]
- Donchin E, Coles MG. Is the P300 component a manifestation of context updating? Behavioral and Brain Sciences. 1988;11:357–427. [Google Scholar]
- Fell J, Dietl T, Grunwald T, Kurthen M, Klaver P, Trautner P, Schaller C, Elger CE, Fernandez G. Neural bases of cognitive ERPs: more than phase reset. J Cogn Neurosci. 2004;16:1595–1604. doi: 10.1162/0898929042568514. [DOI] [PubMed] [Google Scholar]
- Fiorillo CD, Tobler PN, Schultz W. Discrete coding of reward probability and uncertainty by dopamine neurons. Science. 2003;299:1898–1902. doi: 10.1126/science.1077349. [DOI] [PubMed] [Google Scholar]
- Gehring WJ, Willoughby AR. The medial frontal cortex and the rapid processing of monetary gains and losses. Science. 2002;295:2279–2282. doi: 10.1126/science.1066893. [DOI] [PubMed] [Google Scholar]
- Gevins A, Smith ME, McEvoy L, Yu D. High-resolution EEG mapping of cortical activation related to working memory: effects of task difficulty, type of processing, and practice. Cereb Cortex. 1997;7:374–385. doi: 10.1093/cercor/7.4.374. [DOI] [PubMed] [Google Scholar]
- Hajcak G, Holroyd CB, Moser JS, Simons RF. Brain potentials associated with expected and unexpected good and bad outcomes. Psychophysiology. 2005;42:161–170. doi: 10.1111/j.1469-8986.2005.00278.x. [DOI] [PubMed] [Google Scholar]
- Hajcak G, Moser JS, Holroyd CB, Simons RF. The feedback-related negativity reflects the binary evaluation of good versus bad outcomes. Biol Psychol. 2006;71:148–154. doi: 10.1016/j.biopsycho.2005.04.001. [DOI] [PubMed] [Google Scholar]
- Holroyd CB, Coles MG. The neural basis of human error processing: reinforcement learning, dopamine, and the error-related negativity. Psychol Rev. 2002;109:679–709. doi: 10.1037/0033-295X.109.4.679. [DOI] [PubMed] [Google Scholar]
- Holroyd CB, Nieuwenhuis S, Yeung N, Cohen JD. Errors in reward prediction are reflected in the event-related brain potential. Neuroreport. 2003;14:2481–2484. doi: 10.1097/00001756-200312190-00037. [DOI] [PubMed] [Google Scholar]
- Ishii R, Shinosaki K, Ukai S, Inouye T, Ishihara T, Yoshimine T, Hirabuki N, Asada H, Kihara T, Robinson SE, Takeda M. Medial prefrontal cortex generates frontal midline theta rhythm. Neuroreport. 1999;10:675–679. doi: 10.1097/00001756-199903170-00003. [DOI] [PubMed] [Google Scholar]
- Johnson R., Jr A triarchic model of P300 amplitude. Psychophysiology. 1986;23:367–384. doi: 10.1111/j.1469-8986.1986.tb00649.x. [DOI] [PubMed] [Google Scholar]
- Johnson R., Jr On the neural generators of the P300 component of the event-related potential. Psychophysiology. 1993;30:90–97. doi: 10.1111/j.1469-8986.1993.tb03208.x. [DOI] [PubMed] [Google Scholar]
- Johnson R, Jr, Donchin E. P300 and stimulus categorization: two plus one is not so different from one plus one. Psychophysiology. 1980;17:167–178. doi: 10.1111/j.1469-8986.1980.tb00131.x. [DOI] [PubMed] [Google Scholar]
- Keil A, Muller MM, Gruber T, Wienbruch C, Elbert T. Human large-scale oscillatory brain activity during an operant shaping procedure. Brain Res Cogn Brain Res. 2001;12:397–407. doi: 10.1016/s0926-6410(01)00094-5. [DOI] [PubMed] [Google Scholar]
- Kerns JG, Cohen JD, MacDonald AW, 3rd, Cho RY, Stenger VA, Carter CS. Anterior cingulate conflict monitoring and adjustments in control. Science. 2004;303:1023–1026. doi: 10.1126/science.1089910. [DOI] [PubMed] [Google Scholar]
- Kirk IJ, Mackay JC. The role of theta-range oscillations in synchronising and integrating activity in distributed mnemonic networks. Cortex. 2003;39:993–1008. doi: 10.1016/s0010-9452(08)70874-8. [DOI] [PubMed] [Google Scholar]
- Klimesch W. EEG alpha and theta oscillations reflect cognitive and memory performance: a review and analysis. Brain Res Brain Res Rev. 1999;29:169–195. doi: 10.1016/s0165-0173(98)00056-3. [DOI] [PubMed] [Google Scholar]
- Kubota Y, Sato W, Toichi M, Murai T, Okada T, Hayashi A, Sengoku A. Frontal midline theta rhythm is correlated with cardiac autonomic activities during the performance of an attention demanding meditation procedure. Brain Res Cogn Brain Res. 2001;11:281–287. doi: 10.1016/s0926-6410(00)00086-0. [DOI] [PubMed] [Google Scholar]
- Kugler CF, Taghavy A, Platt D. The event-related P300 potential analysis of cognitive human brain aging: a review. Gerontology. 1993;39:280–303. doi: 10.1159/000213544. [DOI] [PubMed] [Google Scholar]
- Luu P, Tucker DM. Regulating action: alternating activation of midline frontal and motor cortical networks. Clin Neurophysiol. 2001;112:1295–1306. doi: 10.1016/s1388-2457(01)00559-4. [DOI] [PubMed] [Google Scholar]
- Luu P, Tucker DM, Makeig S. Frontal midline theta and the error-related negativity: neurophysiological mechanisms of action regulation. Clin Neurophysiol. 2004;115:1821–1835. doi: 10.1016/j.clinph.2004.03.031. [DOI] [PubMed] [Google Scholar]
- Makeig S, Westerfield M, Jung TP, Enghoff S, Townsend J, Courchesne E, Sejnowski TJ. Dynamic brain sources of visual evoked responses. Science. 2002;295:690–694. doi: 10.1126/science.1066168. [DOI] [PubMed] [Google Scholar]
- Mars RB, Coles MG, Grol MJ, Holroyd CB, Nieuwenhuis S, Hulstijn W, Toni I. Neural dynamics of error processing in medial frontal cortex. Neuroimage. 2005;28:1007–1013. doi: 10.1016/j.neuroimage.2005.06.041. [DOI] [PubMed] [Google Scholar]
- Mazaheri A, Jensen O. Posterior alpha activity is not phase-reset by visual stimuli. Proc Natl Acad Sci U S A. 2006;103:2948–2952. doi: 10.1073/pnas.0505785103. [DOI] [PMC free article] [PubMed] [Google Scholar]
- Miltner WH, Lemke U, Weiss T, Holroyd C, Scheffers MK, Coles MG. Implementation of error-processing in the human anterior cingulate cortex: a source analysis of the magnetic equivalent of the error-related negativity. Biol Psychol. 2003;64:157–166. doi: 10.1016/s0301-0511(03)00107-8. [DOI] [PubMed] [Google Scholar]
- Nieuwenhuis S, Holroyd CB, Mol N, Coles MG. Reinforcement-related brain potentials from medial frontal cortex: origins and functional significance. Neurosci Biobehav Rev. 2004;28:441–448. doi: 10.1016/j.neubiorev.2004.05.003. [DOI] [PubMed] [Google Scholar]
- Nieuwenhuis S, Ridderinkhof KR, Talsma D, Coles MG, Holroyd CB, Kok A, van der Molen MW. A computational account of altered error processing in older age: dopamine and the error-related negativity. Cogn Affect Behav Neurosci. 2002;2:19–36. doi: 10.3758/cabn.2.1.19. [DOI] [PubMed] [Google Scholar]
- Niki H, Watanabe M. Prefrontal and cingulate unit activity during timing behavior in the monkey. Brain Res. 1979;171:213–224. doi: 10.1016/0006-8993(79)90328-7. [DOI] [PubMed] [Google Scholar]
- Onton J, Delorme A, Makeig S. Frontal midline EEG dynamics during working memory. Neuroimage. 2005;27:341–356. doi: 10.1016/j.neuroimage.2005.04.014. [DOI] [PubMed] [Google Scholar]
- Paulus MP, Feinstein JS, Simmons A, Stein MB. Anterior cingulate activation in high trait anxious subjects is related to altered error processing during decision making. Biol Psychiatry. 2004;55:1179–1187. doi: 10.1016/j.biopsych.2004.02.023. [DOI] [PubMed] [Google Scholar]
- Polich J, Kok A. Cognitive and biological determinants of P300: an integrative review. Biol Psychol. 1995;41:103–146. doi: 10.1016/0301-0511(95)05130-9. [DOI] [PubMed] [Google Scholar]
- Ridderinkhof KR, Ullsperger M, Crone EA, Nieuwenhuis S. The role of the medial frontal cortex in cognitive control. Science. 2004;306:443–447. doi: 10.1126/science.1100301. [DOI] [PubMed] [Google Scholar]
- Salinas E, Sejnowski TJ. Correlated neuronal activity and the flow of neural information. Nat Rev Neurosci. 2001;2:539–550. doi: 10.1038/35086012. [DOI] [PMC free article] [PubMed] [Google Scholar]
- Sato A, Yasuda A, Ohira H, Miyawaki K, Nishikawa M, Kumano H, Kuboki T. Effects of value and reward magnitude on feedback negativity and P300. Neuroreport. 2005;16:407–411. doi: 10.1097/00001756-200503150-00020. [DOI] [PubMed] [Google Scholar]
- Shibata T, Shimoyama I, Ito T, Abla D, Iwasa H, Koseki K, Yamanouchi N, Sato T, Nakajima Y. Event-related dynamics of the gamma-band oscillation in the human brain: information processing during a GO/NOGO hand movement task. Neurosci Res. 1999;33:215–222. doi: 10.1016/s0168-0102(99)00003-6. [DOI] [PubMed] [Google Scholar]
- Shidara M, Richmond BJ. Anterior cingulate: single neuronal signals related to degree of reward expectancy. Science. 2002;296:1709–1711. doi: 10.1126/science.1069504. [DOI] [PubMed] [Google Scholar]
- Spencer KM, Polich J. Poststimulus EEG spectral analysis and P300: attention, task, and probability. Psychophysiology. 1999;36:220–232. [PubMed] [Google Scholar]
- Squires KC, Wickens C, Squires NK, Donchin E. The effect of stimulus sequence on the waveform of the cortical event-related potential. Science. 1976;193:1142–1146. doi: 10.1126/science.959831. [DOI] [PubMed] [Google Scholar]
- Steriade M. Grouping of brain rhythms in corticothalamic systems. Neuroscience. 2006;137:1087–1106. doi: 10.1016/j.neuroscience.2005.10.029. [DOI] [PubMed] [Google Scholar]
- Trujillo LT, Allen J. Theta EEG Dynamics of the Error-Related Negativity. doi: 10.1016/j.clinph.2006.11.009. under review. [DOI] [PubMed] [Google Scholar]
- Tsujimoto T, Shimazu H, Isomura Y. Direct recording of theta oscillations in primate prefrontal and anterior cingulate cortices. J Neurophysiol. 2006;95:2987–3000. doi: 10.1152/jn.00730.2005. [DOI] [PubMed] [Google Scholar]
- van Schie HT, Mars RB, Coles MG, Bekkering H. Modulation of activity in medial frontal and motor cortices during error observation. Nat Neurosci. 2004;7:549–554. doi: 10.1038/nn1239. [DOI] [PubMed] [Google Scholar]
- Wang C, Ulbert I, Schomer DL, Marinkovic K, Halgren E. Responses of human anterior cingulate cortex microdomains to error detection, conflict monitoring, stimulus-response mapping, familiarity, and orienting. J Neurosci. 2005;25:604–613. doi: 10.1523/JNEUROSCI.4151-04.2005. [DOI] [PMC free article] [PubMed] [Google Scholar]
- Williams ZM, Bush G, Rauch SL, Cosgrove GR, Eskandar EN. Human anterior cingulate neurons and the integration of monetary reward with motor responses. Nat Neurosci. 2004;7:1370–1375. doi: 10.1038/nn1354. [DOI] [PubMed] [Google Scholar]
- Yasuda A, Sato A, Miyawaki K, Kumano H, Kuboki T. Error-related negativity reflects detection of negative reward prediction error. Neuroreport. 2004;15:2561–2565. doi: 10.1097/00001756-200411150-00027. [DOI] [PubMed] [Google Scholar]
- Yeung N, Bogacz R, Holroyd CB, Cohen JD. Detection of synchronized oscillations in the electroencephalogram: an evaluation of methods. Psychophysiology. 2004;41:822–832. doi: 10.1111/j.1469-8986.2004.00239.x. [DOI] [PubMed] [Google Scholar]
- Yeung N, Sanfey AG. Independent coding of reward magnitude and valence in the human brain. J Neurosci. 2004;24:6258–6264. doi: 10.1523/JNEUROSCI.4537-03.2004. [DOI] [PMC free article] [PubMed] [Google Scholar]
- Yordanova J, Devrim M, Kolev V, Ademoglu A, Demiralp T. Multiple time-frequency components account for the complex functional reactivity of P300. Neuroreport. 2000;11:1097–1103. doi: 10.1097/00001756-200004070-00038. [DOI] [PubMed] [Google Scholar]
- Yordanova J, Falkenstein M, Hohnsbein J, Kolev V. Parallel systems of error processing in the brain. Neuroimage. 2004;22:590–602. doi: 10.1016/j.neuroimage.2004.01.040. [DOI] [PubMed] [Google Scholar]