

Abstract
Naive T cells become programmed for clonal expansion and contraction during the early hours of antigenic signaling. Recent studies support an ‘autopilot’ model, wherein the commitment to proliferate and the magnitude of the proliferative response are simultaneously determined during a single, brief period of antigen exposure. Here, we have examined whether the proliferation of naive CD4+ T cells must occur on ‘autopilot’, or whether extended periods of antigenic signaling can impact primary proliferative responses to antigen-presenting macrophages (macrophage APC). We found that a single exposure to antigen (18 h) simultaneously committed T cells to (1) up-regulate surface TCR above the level expressed on naive T cells, (2) undergo minimal cell division, and (3) acquire susceptibility to TCR-dependent activation-induced cell death. However, continued antigenic signaling between 18 and 72 h was required to amplify the number of daughter cells derived from the already committed T cells. Thus, a discrete commitment time was followed by a ‘tuning’ period, where extended antigenic signaling determined the volume of the proliferative response. We conclude that T cell commitment to full clonal expansion versus TCR-dependent death susceptibility represent two separate programming events whose timing can be segregated by macrophage APC.
Keywords: TCR, T cell proliferation, T cell commitment, Activation-induced cell death, Macrophage
Introduction
An important, unresolved question is whether the number of daughter cells generated by an antigen-stimulated primary T cell reflects a single, irreversible cell fate decision. TCR and costimulatory signals accumulate over time until a signaling threshold is reached which commits T cells to proliferate [1–3]. The idea that continued antigenic signaling beyond this threshold does not enhance proliferation is termed the ‘autopilot’ response [4]. Several studies have reported that a brief encounter with antigen commits naive CD8+ T cells to a full proliferative response, both in vitro and in vivo [5–7]. Others have suggested an autopilot proliferative response from naive CD4+ T cells. Plate-bound peptide/MHC complexes induced maximal CD4+ proliferation within 15–20 h, although this duration requirement dropped to 6 h when dendritic cells were used as stimulators [8]. Two subsequent studies concurred that early, not prolonged, antigenic stimulation induced CD4+ T cell cycling [9, 10].
Yet it has been suggested that extended stimulation can enhance T cell proliferation [11, 12], and this has been corroborated in some recent studies [10, 13–17]. Under an autopilot model of T cell division, this could be achieved by the continual, asynchronous recruitment of new T cells to the proliferative response [17, 18]; each individual T cell, however, must commit to its full proliferative potential once its TCR, costimulation, and time thresholds have been met. An alternative explanation is that besides recruiting new T cells, longer durations of stimulation cause already committed T cells to undergo more divisions. The studies cited above reported an increase in the average number of T cell divisions as stimulation was prolonged; however, whether this increase was entirely accounted for by the recruitment of new cells to the proliferative response, or whether enhanced division of already committed cells also contributed, has never been directly demonstrated. Therefore, it remains unclear whether the proliferative behavior of individual naive CD4+ T cells is unalterable once they have committed to divide, or whether it can be modified by prolonged interactions with antigen.
‘Net’ proliferation reflects both the summation of daughter cells generated by mitosis during clonal expansion, and the subtraction of T cells killed by activation-induced cell death (AICD). Naive T cells must be primed in order to acquire susceptibility to TCR-dependent, Fas-mediated AICD [19]. As with cell division, the CD8+ T cell contraction phase was reported to occur as a programmed response to early antigenic signaling [20], although a second exposure to antigen can be needed to trigger death signaling pathways [21]. It remains unknown which duration of antigenic stimulation induces susceptibility to AICD, and how this programming relates to the commitment to cell division.
Here, we examined how varying the duration of antigenic stimulation by antigen-presenting macrophages (macrophage APC) affects commitment to both cell division and TCR-dependent death susceptibility in naive CD4+ T cells. Although they are less potent stimulators than dendritic cells, macrophages are involved in the initiation of T cell immune responses against simian immunodeficiency virus [22], Borrelia burgdorferi [23, 24], corneal allografts [25], and DNA vaccines [26, 27]. We observed a clear synchrony in T cell commitment to surface TCR up-regulation [28], minimal T cell division, and the development of TCR-dependent death susceptibility in vitro. While T cells committed to these responses simultaneously, a prolonged period of antigenic signaling caused already committed T cells to divide more extensively. These results identify two sequential commitment steps that impact the extent of T cell clonal expansion and contraction based on the duration of antigenic stimulation by macrophage APC.
Results and discussion
Effective initiation and interruption of antigenic stimulation in vitro
To control the timing of TCR engagement by peptide/MHC complexes on APC, we used IFN-γ-conditioned BALB/c bone marrow-derived macrophages to present OVA peptide (pOVA) in I-Ad to pOVA-specific naive CD4+ DO11.10 TCR-transgenic T cells. Bone marrow-derived macrophages function well as primary, non-transformed, contact-inhibited, non-irradiated, long-lived APC. They adhere strongly to tissue culture-treated plastic, and co-culture with T cells can be terminated by pipetting the T cells away from the macrophages. We tested the efficiency of T cell removal from the macrophage co-cultures. Regardless of the time of co-culture, ~85–95% of T cells could be removed from the macrophages (Fig. 1A, B). It was possible that the few irremovable T cells were the best responders to antigen. However, the same percentage of pOVA-specific DO11.10 T cells were irremovable even when an irrelevant pigeon cytochrome c peptide (pPCC) was used instead of pOVA (Fig. 1A, B). Similar adherence was also observed using non-TCR-transgenic BALB/c T cells, with or without any exogenous peptide added (data not shown). We conclude that the few T cells left behind during our experiments do not represent those with the strongest response to antigen.
Fig. 1.
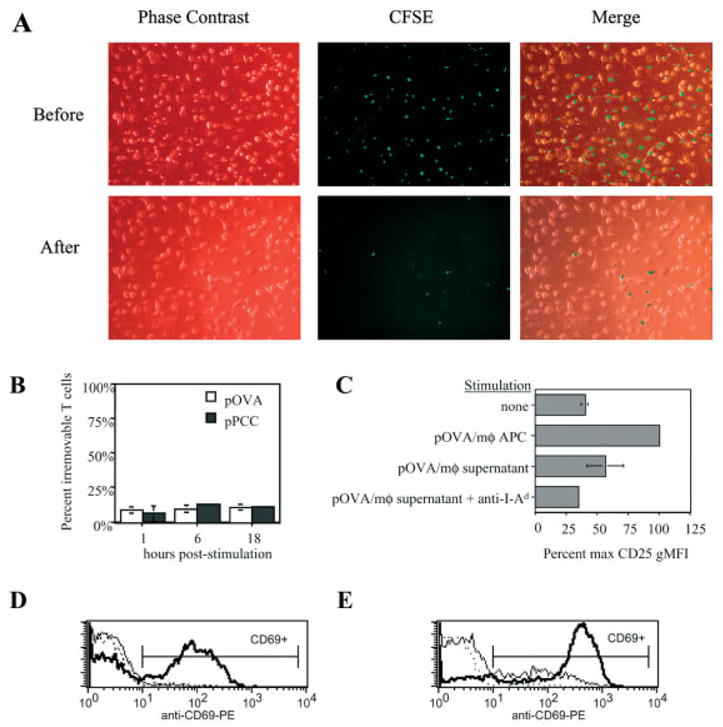
Efficiency of stimulation interruption and blockade of TCR engagement. (A) CFSE-labeled naive CD4+ DO11.10 T cells were co-cultured with macrophages that had been loaded with 50 μg/ml of the irrelevant peptide pPCC. After 1 h at 37°C, the co-culture plate was removed from incubation and fastened to the stage of an inverted fluorescence microscope. Phase-contrast and green fluorescence micrographs were first digitally captured of the T cell-macrophage co-culture (top row, “Before”), and then again following pipette-mediated removal of the T cells (bottom row, “After”). (B) The procedure demonstrated in (A) was applied to 6–10 wells for each experimental group tested during two different experiments. After 1–18 h of co-culture, DO11.10 T cells were pipetted away from macrophages that had been loaded with relevant (pOVA) or irrelevant (pPCC) peptide. The percentage of T cells that were not removed from macrophages via pipetting is referred to as ‘percent irremovable T cells’. (C) Naive DO11.10/RAG2−/− CD4+ T cells were cultured for 24 h either alone (‘none’) or in the presence of several potential sources of stimulation: ‘pOVA/mφ APC’, pOVA (50 μg/ml)-loaded macrophages; ‘pOVA/mφ supernatant’, pipetted supernatant from tissue culture wells containing pOVA (50 μg/ml)-loaded macrophages. Where indicated, anti-I-Ad was added to culture. After culture, T cell surface CD25 expression was measured by FCM. (D, E) Naive CD4+ DO11.10 T cells were co-cultured with pOVA-loaded macrophages (D) or dendritic cells (E) ± anti-I-Ad mAb. Stimulation by both APC types induced T cells to up-regulate CD69 by 24 h of culture (bold line) above unstimulated levels (dotted line), unless anti-I-Ad blocking mAb had been present throughout (thin solid line).
After T cell removal, APC membrane fragments and/or a few intact macrophages might remain with the T cells and provide a low level of persistent T cell stimulation. To test this, we applied the same pipetting procedure (that would be used to remove co-cultured T cells) to tissue culture wells of pOVA-loaded macrophages. The resulting supernatant was then tested for stimulatory capacity by culturing it with previously unstimulated DO11.10/RAG2−/− T cells. We found that a low level of CD25 expression could be induced on T cells cultured with such supernatant, but not when anti-I-Ad blocking mAb was added to culture (Fig. 1C). Even without interrupting ongoing co-cultures, addition of anti-I-Ad blocking mAb blocked T cell activation by macrophages for 24 h (Fig. 1D). In contrast, with dendritic APC, anti-I-Ad blocking mAb partially inhibited, but did not completely block T cell signaling (Fig. 1E). We conclude that the experimental system described herein enables us to accurately control the timing of T cell stimulation by macrophage APC. It is most reliable when anti-I-Ad blocking mAb is used in addition to T cell removal from macrophages in order to block TCR engagement. We used this system to measure T cell responses to defined periods of stimulation in the experiments that follow.
Prolonged antigen presentation and T cell stimulation by macrophage APC
To assess whether antigen presentation was long-lived in this system, we co-cultured DO11.10 T cells with pOVA-loaded macrophages for 6 days. After this period, freshly isolated 5(6)-carboxyfluorescein diacetate succinimidyl ester (CFSE)-labeled DO11.10 T cells were either added to the ongoing co-cultures, or else cultured with peptide-unpulsed macrophages. After 24 h, many CFSE-labeled T cells from the ongoing co-cultures had up-regulated CD69 in response to antigen, whereas the CFSE-labeled T cells in the newly initiated cultures without antigen had not (Fig. 2A).
Fig. 2.
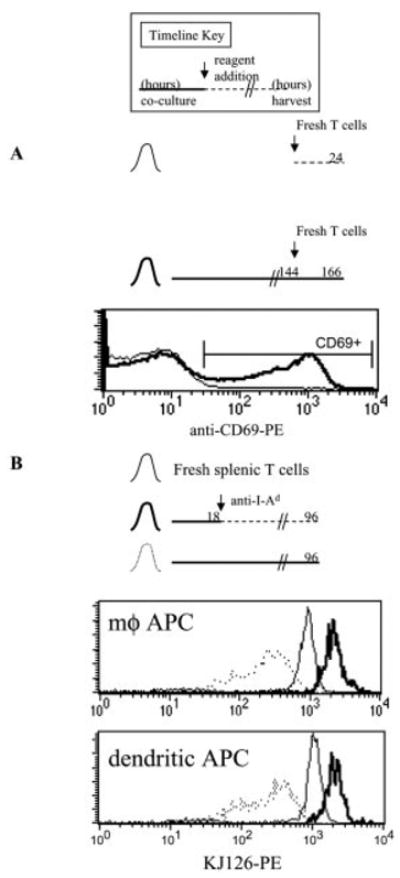
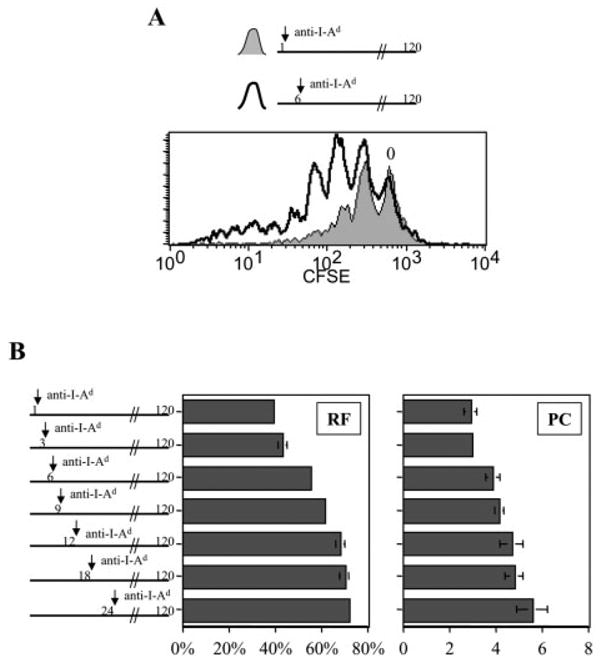
Macrophages can stimulate T cells for at least 7 days in vitro. Timeline key: bold line, hours of co-culture of pOVA-loaded APC with naive CD4+ T cells; dashed line, T cell culture in the absence of pOVA-loaded macrophages; arrow, hour of reagent addition to culture. The total hours of T cell culture before harvest are indicated at the right end of the timeline. (A) Naive DO11.10 CD4+ T cells were co-cultured with pOVA (50 μg/ml)-loaded macrophages for 144 h (6 days). Then new CFSE-labeled DO11.10 T cells were added to the ongoing co-culture (bold histogram). In parallel, some of the new T cells were co-cultured with macrophages that had not been loaded with pOVA, nor previously cultured with T cells (thin histogram). After 24 h, CD69 expression on CFSE-labeled T cells was measured by FCM. (B) Unstimulated naive DO11.10/RAG2−/− CD4+ T cells (thin histogram) were either co-cultured with pOVA (50 μg/ml)-loaded APC for 96 h (dotted histograms), or co-cultured with pOVA (50 μg/ml)-loaded APC for 18 h, followed by continued culture in the presence of anti-I-Ad until 96 h (bold histograms). Surface clonotype TCR (KJ126) expression was measured by FCM.
Surface TCR down-regulation was quickly induced by T cell stimulation ([28] and data not shown), persisting over several days during co-culture with pOVA-loaded macrophages or dendritic cells (Fig. 2B). In contrast, surface TCR up-regulation was observed when T cells were permitted to recover after 1 day of full stimulation by either APC (Fig. 2B). We have previously shown that the prolonged surface TCR down-regulation observed during several days of T cell stimulation results from continual ligation of TCR by peptide/MHC complexes [14]. Therefore, we conclude that these APC can maintain effective antigen presentation for at least 1 week in vitro, and throughout this period T cells continue to be responsive to antigen as monitored by TCR engagement.
Duration of antigenic stimulation required to commit naive CD4+ T cells to up-regulate surface TCR expression
To determine how both antigen dose and the timing of T cell-APC interaction influence T cell commitment to up-regulate surface TCR expression, macrophages loaded with low, medium, or high proliferative doses of pOVA were co-cultured with DO11.10/RAG2−/− T cells. After the co-culture period, T cells were removed from the macrophages and their tissue culture was continued until 96 h post-stimulus. As expected, T cells that remained in contact with APC throughout the experiment displayed an inverse relationship between surface TCR expression level and antigen dose, due to surface TCR down-regulation (Fig. 3, white bars). Six hours of T cell stimulation was insufficient at any pOVA dose to commit T cells to significantly up-regulate surface TCR expression (Fig. 3, striped bars). Twelve hours of stimulation resulted in modest up-regulation at the highest two pOVA doses (Fig. 3, dotted bars).
Fig. 3.
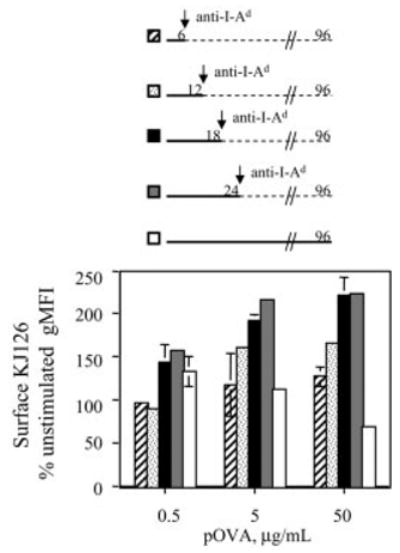
Duration of antigenic stimulation committing naive CD4+ T cells to up-regulate surface TCR expression. DO11.10/RAG2−/− T cells were stimulated by pOVA-loaded macrophages during the period indicated in the timelines. Antigenic stimulation was then interrupted by removing the T cells from the macrophages and immediately re-culturing the T cells in new wells with anti-I-Ad. After 96 h, surface clonotype TCR (KJ126) levels were measured by FCM.
In contrast, 18 h of stimulation committed T cells to up-regulate surface TCR expression at all three pOVA doses (Fig. 3, black bars), and 24 h of stimulation did not significantly increase the degree of up-regulation (Fig. 3, gray bars). Maximum surface TCR up-regulation resulted in a twofold increase in expression above that of unstimulated cells, although low-dose pOVA stimulation only caused a 1.5-fold increase. We conclude that during naive CD4+ T cell activation, T cells commit to up-regulate surface TCR expression, and the new expression level achieved later is influenced by antigen dose, costimulation [29], and duration of stimulation. A duration of 18 h of stimulation by macrophage APC is sufficient to commit T cells to maximal activation-induced surface TCR up-regulation. Therefore, despite early down-regulation by antigen, many TCR are made available for engagement throughout a prolonged period during primary T cell activation in this system.
Duration of antigenic stimulation required to induce T cell division
Previous studies on CD4+ T cells where an increased duration of stimulation enhanced proliferative responses utilized RAG+ TCR-transgenic T cells that could co-express both transgenic and endogenous TCR [10, 13, 14, 16]. Such co-expression is known to result in heterogeneous surface expression of the relevant transgenic TCR, which negatively affects responsiveness to antigen [30, 31]. To determine the duration of antigenic stimulation required to induce naive CD4+ single-TCR-expressing T cells to divide, macrophages were loaded with low, medium, or high doses of pOVA and co-cultured with CFSE-labeled DO11.10/RAG2−/− T cells. After co-culture, T cells were removed from the macrophages and cultured separately until 120 h. The dilution of CFSE into discrete fluorescence peaks enabled us to score the number of cell divisions by FCM.
In co-cultures with macrophages loaded with 50 μg/ml pOVA, T cells stimulated for 3 h did not divide in response to stimulation (Fig. 4A, inset). Six to twelve hours of stimulation began to induce cell division with both medium and high pOVA doses (Fig. 4B, C). Eighteen hours of stimulation was sufficient to produce the first dividing T cells in response to the low-dose pOVA-loaded macrophages, while further enhancing the response to the higher two doses (Fig. 4A, D). Finally, 72 h of stimulation dramatically augmented T cell division under all conditions tested, and in a peptide dose-dependent fashion (Fig. 4A, E). As previously reported [8, 10, 14, 32], endogenous IL-2 was required for these responses; proliferation was inhibited by anti-IL-2/anti-IL-2R blocking mAb, and addition of exogenous IL-2 had no effect (data not shown). Antigenic signaling, not IL-2, was the limiting factor that programmed the proliferative responses in these cultures. Thus, naive CD4+ single-TCR-expressing T cells, like dual-TCR-expressing cells, can tune the extent of cell division based on the duration of antigenic stimulation.
Fig. 4.
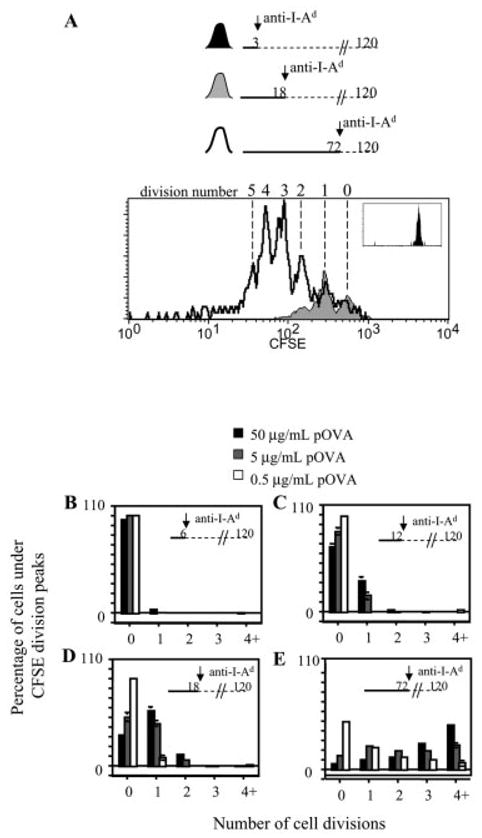
Duration of antigenic stimulation by macrophage APC committing naive CD4+ T cells to cell division. (A) CFSE-labeled DO11.10/RAG2−/− T cells were stimulated by pOVA (50 μg/ml)-loaded macrophages for the periods indicated in the timelines, but cultured for 120 h. FCM analysis showed that proliferating T cells had diluted their CFSE dye and could be scored as to the number of mitoses they had undergone, indicated by the cell division number above the histograms. The undivided peak (division number ‘0’) was identified by the high CFSE label of unstimulated cells (not shown), which was equivalent to that of T cells stimulated for only 3 h (black shaded histogram, inset). (B–E) These graphs summarize the cell division profiles of T cells from the experiment in (A) for three dilutions of pOVA, and for various durations of stimulation. Each bar graph represents the percentage of cells under the specified CFSE division peak.
To better understand how the duration of stimulation affected cell division, we used the number of cells under each CFSE division peak to back-calculate the number of responding T cells from the original, naive population (responder frequency, RF), and the average number of daughter cells produced per responder (proliferative capacity, PC), as previously explained [14, 33, 34]. In response to high-dose pOVA-loaded macrophages, RF rose precipitously between 6 and 18 h of antigenic stimulation, indicating that during this time new cells became recruited into the pool that would eventually divide (Fig. 5A, left). By 18 h, most responders had been recruited, although ~17% more were added through 72 h. Most of these additional responders were recruited between 18 and 24 h. During the first 24 h, when RF was rising, PC remained relatively constant (Fig. 5A, right). Subsequently, between 24 and 72 h, antigenic stimulation caused little change in RF, but PC was markedly increased, indicating an increase in the average number of daughter cells produced per responder (Fig. 5A, right).
Fig. 5.
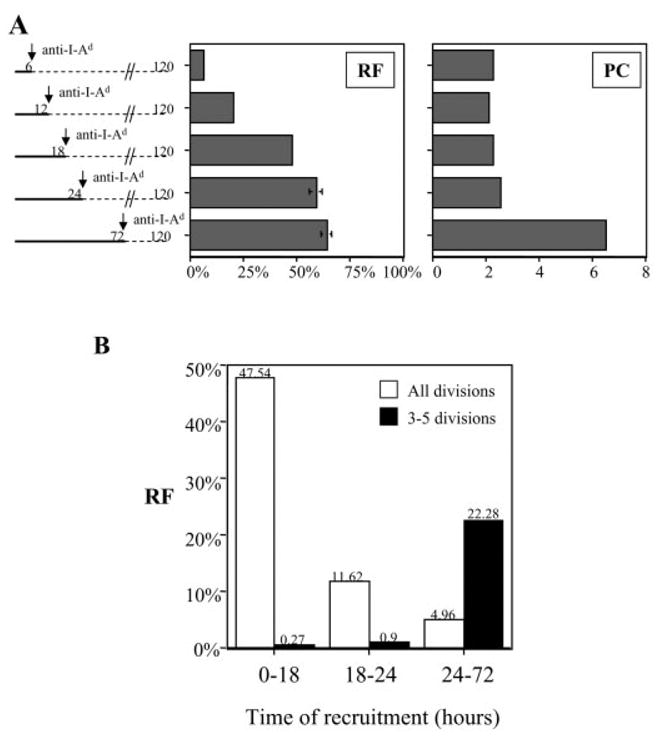
Impact of prolonged duration of antigenic stimulation on RF and PC of naive CD4+ T cells. (A) RF and PC were calculated for the experiment presented in Fig. 4. Data are included here for T cells that were stimulated by pOVA (50 μg/ml)-loaded macrophages for various durations, as indicated on the y axis. (B) (White bars) The RF calculated in (A) are redisplayed to indicate the time frames during which new responders were recruited to divide, irrespective of how many times they divided. The raw data are: 0–18 h, 47.54% (SE 0.43%); 18–24 h, 11.62% (SE 2.84%); 24–72 h, 4.96% (SE 2.62%). (Black bars) The RF that generated daughter cells having divided 3–5 times, and the time frames during which responders were recruited into this highly proliferative pool are displayed. The raw data are: 0–18 h, 0.27% (SE 0.02%); 18–24 h, 0.9% (SE 0.1%); 24–72 h, 22.28% (SE 1.18%). For visual clarity, SE bars are not displayed.
The increase in daughter cells induced by 72 h of stimulation could have two possible sources. First, those T cells which had committed to divide by 18 or 24 h of stimulation may have become induced to divide more times. A tunable proliferative response, not autopilot, would predict this behavior. Alternatively, perhaps the cells committing to divide by 18 or 24 h retained an unaltered, low PC, while the few additional responders that committed to divide between 18 and 72 h exhibited a high PC, thus increasing the average PC for the population. To distinguish between these two possibilities, we focused our analysis on cells that divided three to five times in response to 72 h of stimulation (for primary data, see Fig. 4A). These were daughter cells originating from 23.45% of the original naive starting population (data not shown).
Very few cells were programmed to divide three to five times during 0–18 h or 18–24 h of stimulation, but 22.28% were programmed to do so during 24–72 h (Fig. 5B, black bars). In contrast, only 4.96% of the original population became newly programmed to divide during 24–72 h of stimulation, since most cells had been recruited during 0–18 h and 18–24 h (Fig. 5B, white bars). Therefore, there were not enough late recruits to the division response (4.96%) to account for the proportion of cells (22.28%) that became programmed for extensive division between 24 and 72 h. At a minimum, 16.15% (22.28% – 4.96% – 0.9% – 0.27%, Fig. 5B) of the original population would divide once or twice with 18–24 h of stimulation, but divide three to five times with 72 h of stimulation. Since these percentages are calculated based on assigning all cells to one of two groups, low versus high PC, it is likely that these numbers underestimate the true percentage of cells from all divisions that underwent enhanced proliferation with longer stimulation. We conclude that stimulation occurring between 24 and 72 h of co-culture induced T cells that had already committed to increase the number of daughter cells they would generate.
When dendritic cells were used as APC, we observed a similar effect on T cells with respect to amplifying proliferation. One hour of full antigenic stimulation caused T cells to divide up to four times, whereas 6 h caused up to seven and eight divisions (Fig. 6A). Prolonging the time of full stimulation enhanced not only RF, but also PC (Fig. 6B). Because anti-I-Ad treatment only partially inhibited TCR engagement by dendritic cells (Fig. 1E), we cannot ascertain the precise timing of commitment to division in this case. However, these data show that extending the duration of full antigenic signaling by dendritic APC can augment the number of daughter cells that dividing T cells generate.
Fig. 6.
Prolonged stimulation of naive CD4+ T cells by dendritic cells influences both RF and PC. CFSE-labeled naive CD4+ DO11.10 T cells were co-cultured with pOVA (50 μg/ml)-pulsed dendritic cells for 1–24 h, after which anti-I-Ad blocking mAb was added to culture as indicated. Thereafter, T cells and dendritic cells remained in co-culture under conditions of partially inhibited TCR engagement until harvested for FCM analysis at 120 h. (A) Full antigenic stimulation for 1 h led to less T cell division than full stimulation for 6 h. The CFSE peak representing undivided cells is marked ‘0’. (B) RF and PC were calculated for the different experimental groups labeling the y axis.
Duration of antigenic stimulation required to induce susceptibility to TCR-dependent T cell death
Periods of stimulation in excess of 72 h had a negative effect on T cell proliferation at the high pOVA dose. We stimulated naive CD4+ DO11.10 T cells with high-dose peptide-loaded macrophages for 72 or 120 h, having harvested and counted the number of live T cells daily until 120 h of total culture time. In these cultures, cell division begins by 72 h (data not shown), which coincides with the first time point at which significant T cell proliferation is observed (Fig. 7). T cells stimulated for 72 h proliferated considerably following the removal of antigenic stimulus, but those kept in the presence of antigen throughout the entire 120-h time course did not (Fig. 7). We suspected that death of hyper-stimulated dividing T cells might account for much of the blunted proliferative response, as has been reported by others [35, 36].
Fig. 7.
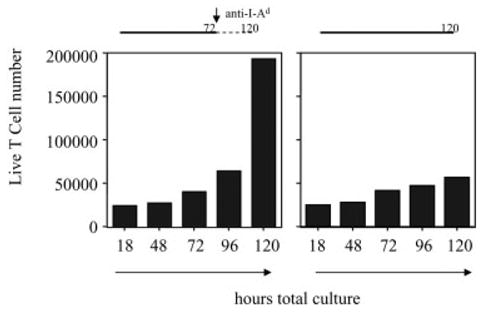
Effect of prolonged antigenic signaling on net accumulation of expanding T cells. Naive CD4+ DO11.10 T cells were stimulated by pOVA (50 μg/ml)-loaded macrophages for 72 or 120 h. At the serial time points indicated on the x axes, live T cells from triplicate wells were counted. The bar graphs display average T cell numbers. SEM bars are too small for visualization on this scale.
AICD of this type is generally dependent on TCR and Fas signaling, and although activated T cells are susceptible to these death pathways, naive T cells are not [19]. To determine the duration of antigenic stimulation that commits naive CD4+ T cells to become susceptible to TCR-dependent Fas-mediated AICD, high-dose pOVA-loaded macrophages were co-cultured with DO11.10/RAG2−/− T cells for 6, 18, or 72 h. After the 6-h and 18-h co-culture periods, T cells were removed from the macrophages and cultured without APC until total 72 h had elapsed. Fas expression was then analyzed by FCM and compared between the activated T cells and unstimulated, freshly harvested T cells. Both unstimulated and 6-h-stimulated T cells expressed similar, low levels of Fas when compared to isotype-control staining. However, 18 h and 72 h of stimulation committed T cells to up-regulate Fas expression (Fig. 8A).
Fig. 8.
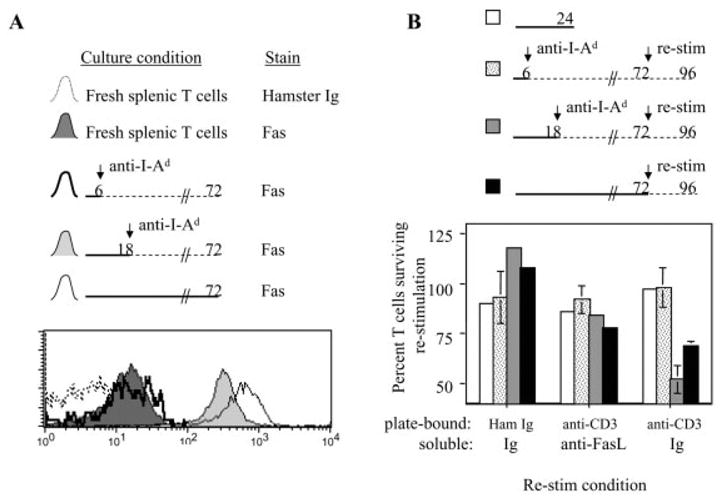
Duration of antigenic stimulation committing naive CD4+ T cells to become susceptible to TCR-dependent death. (A) DO11.10/RAG2−/− T cells were stimulated by pOVA (50 μg/ml)-loaded macrophages for the periods indicated in the timelines. After 72 h of total culture, T cells were harvested and stained with anti-Fas mAb for FCM analysis. Freshly prepared BALB/c splenic T cells were stained in parallel, and the hamster Ig stain for these fresh cells served as the background FCM stain to which the experimental groups were compared. (B) DO11.10/RAG2−/− T cells were initially stimulated by pOVA (50 μg/ml)-loaded macrophages for 6, 18, or 72 h as indicated in the timelines. After 72 h of culture, the T cells were restimulated in tissue culture wells coated with 10 μg/ml hamster γ-globulin or anti-CD3ε. Also added to these cultures was either a mixture of soluble anti-FasL blocking mAb + FasFc (‘anti-FasL’), or control Ig. In parallel, freshly prepared BALB/c splenic T cells (white bars) were added to the coated plates used for the restimulation assays. This was done as a control representing T cells without susceptibility to TCR-dependent death induction. T cells were counted before and after restimulation, and the average percentage change in T cell number is summarized in the bar graphs.
To directly assess the development of TCR-dependent death susceptibility, naive T cells were stimulated for 6, 18, or 72 h as described above, and cultured for a total period of 72 h. After this time, the activated T cells, and freshly isolated unstimulated T cells for comparison, were stimulated for an additional 24 h with plate-bound anti-CD3 mAb (or control Ig) to induce TCR (CD3)-dependent Fas-mediated AICD [36, 37]. In addition to the plate-bound Ig, soluble anti-Fas ligand (anti-FasL) blocking mAb and FasFc (to bind and block FasL) or control reagents were added to culture.
Neither naive cells nor 6-h-stimulated cells were killed in response to these culture conditions, regardless of whether anti-CD3 stimulus was provided or not (Fig. 8B). This is consistent with the idea that naive T cells are not susceptible to TCR-dependent death, and T cells stimulated by macrophage APC for 6 h do not develop susceptibility to such death. However, 18 h of stimulation by macrophage APC was sufficient to induce T cells to develop susceptibility toTCR-dependent death, since ~50% of these cells were killed by plate-bound anti-CD3 mAb (Fig. 8B). Fas blockade provided a significant rescue from death, demonstrating that much of the TCR-dependent death induced in these cultures was mediated by the Fas death pathway. In the absence of plate-bound anti-CD3 mAb, the 18-h-stimulated cells had begun to proliferate by the end of the culture period. The same general trend holds true for T cells stimulated for 72 h, except that, despite higher Fas expression (Fig. 8A), these cells were not more susceptible to death induction than the 18-h-stimulated cells (Fig. 8B). We conclude that 18 h of stimulation by macrophage APC is sufficient to commit naive CD4+ T cells to up-regulate Fas expression and develop TCR-dependent Fas-mediated death susceptibility.
Concluding remarks
We observe two phases of antigenic signaling that impact the programming of the proliferative response of naive CD4+ T cells by macrophage APC in vitro. First, 18–24 h of antigenic signaling commits T cells to replenish and up-regulate surface TCR expression, undergo a minimal amount of cell division, and become susceptible to TCR-dependent AICD. Second, sustained antigenic signaling between 18–72 h enhances T cell proliferation mainly by magnifying the number of daughter cells generated by already committed T cells. After this point, the proliferative ‘programming’ phase of antigenic signaling is complete, as T cells enter the M phase of cell division. TCR signaling during this effector phase of proliferation promotes hyper-stimulation and AICD. It is interesting that the susceptibility to death is built in to the T cell activation program prior to maximization of cell division. This could help to insure that responding T cells can eventually be eliminated regardless of the magnitude of clonal expansion. This is consistent with the findings of Patel et al. [38], who have previously shown that a stimulated class II-restricted T cell hybridoma committed to apoptosis before it committed to IL-2 production. It is also consistent with the concept of T cell ‘fitness’, wherein T cells undergoing suboptimal periods of stimulation are more likely to die rather than to persist [39].
The in vitro co-culture system with macrophages enables careful control of the timing of stimulation during the T cell programming period, and facilitates the calculations underlying the proliferative analyses. However, the relevant time points in this study are likely specific for macrophage APC, and we expect that these time requirements are likely shortened with more potent APC [8]. Perhaps because of their limited potency, macrophage APC enable the distinction of the programming of a minimal proliferative response that includes the acquisition of TCR-dependent death sensitivity, from a more robust proliferative response induced by prolonged antigenic signaling. The salient point is that these two responses represent two separate and sequential cell fate decisions for naive CD4+ T cells, each of which is dependent on the duration of antigenic stimulation, and each of which could possibly be subject to unique regulation. The observation of autopilot responses may reflect the ability of potent APC to synchronize and carry out these separate programming events virtually simultaneously during strong immune responses. With macrophages as APC, these events can be segregated and studied. Dissecting the molecular and signaling pathways that are involved in these T cell fate decisions impacting clonal expansion remains an aim of future work.
Materials and methods
Mice
BALB/c, DO11.10 (BALB/c) [40], and DO11.10/RAG2−/− (BALB/c) mice were bred and maintained in our animal facility until their use at 6–16 weeks of age.
Ig and peptides
Purified Ig used during in vitro culture included: anti-I-Ad (M5/114; American Type Culture Collection), anti-CD3ε mAb (145–2C11; BD Pharmingen), anti-FasL (MFL-3; BD Pharmingen), FasFc (R&D Systems), hamster γ-globulin (Jackson ImmunoResearch). Additional mAb purchased from BD Pharmingen for use in FCM or magnet-activated cell sorting (MACS) included: anti-CD16/CD32 (2.4G2), anti-Thy1.2 (53–2.1), anti-CD25 (7D4), anti-CD11b (M1/70), anti-CD4 (GK1.5), anti-B220 (RA3–6B2), anti-CD44 (IM7), anti-pan NK cell (DX5), anti-CD11c (HL3), anti-CD8 (Ly-2), anti-CD69 (H1.2F3), anti-Fas (Jo2). The DO11.10 clonotype-specific mAb KJ126 was purchased from Caltag Laboratories, as was anti-macrophage (F4/80) mAb. The peptides pOVA (derived from chicken OVA amino acids 323–339) and pPCC (derived from pigeon cytochrome c amino acids 88–104) were synthesized by the Protein Chemistry Laboratory (University of Pennsylvania).
Preparation of naive CD4+ T cells
Whole splenocyte single-cell suspensions were prepared from mice with the aid of Nitex fabric (Tetko, Inc.) followed by erythrocyte lysis via hypotonic shock. Where noted, splenocytes were labeled with 5 μM CFSE (Molecular Probes) to analyze T cell proliferative responses by FCM as previously described [33, 34]. To purify naive CD4+ T cells from DO11.10 mice by MACS purification, splenocytes were coated with rat anti-mouse mAb anti-I-Ad, anti-CD11b, anti-CD11c, anti-B220, anti-pan NK cell, anti-macrophage (F4/80), anti-CD8, and anti-CD44. After secondary staining with magnetic bead-conjugated polyclonal anti-rat IgG (Polysciences), cells were placed in a magnetic field. Cells not attracted to the magnet were used in experiments and were typically ≥95% CD4+ T cells, 70–90% CD62Lhigh. To purify naive CD4+ T cells from DO11.10/RAG2−/− mice by MACS purification, splenocytes were coated with biotinylated anti-I-Ad mAb, followed by magnetic microbead-conjugated streptavidin (Miltenyi). Cells not attracted to the magnet were used in experiments and were typically ≥95% CD4+ T cells.
Stimulation of naive CD4+ T cells
Macrophages were matured in vitro by culturing BALB/c bone marrow in supplemented Dulbecco’s modified Eagle’s medium (DMEM), and were used to stimulate T cells as previously described [14, 41]. Peptide loading occurred over 48 h in the presence of 10–20 ng/ml IFN-γ (R&D Systems) in 96-well plates. After washing the peptide-loaded macrophages, T cells were briefly centrifuged onto them in fresh medium to synchronize conjugation at a T cell/APC ratio of 1:1 or 1:2. For some cultures, stimulation was interrupted at various time points by pipetting the T cells out of the wells, leaving behind the macrophages adhered to the bottom surface. Stimulated T cells were then replated in new wells and their tissue culture continued in the original conditioned medium, plus 20 μg/ml anti-I-Ad blocking mAb where noted. Dendritic cells were matured in vitro by culturing bone marrow cells in 5 ng/ml GM-CSF and 5 ng/ml IL-4 (Peprotech) for 1 week as previously described [42]. After activation with 50 μg/ml LPS (Sigma) and peptide loading with 50 μg/ml pOVA at 37°C for 48 h, dendritic cells were washed twice and co-cultured with T cells.
Fluorescence microscopy
A Nikon Eclipse TE300 inverted fluorescence microscope was used to digitally capture phase-contrast and green fluorescence micrographs of CFSE-labeled DO11.10 T cells co-cultured with macrophages. The phase-contrast images appear red because the cells were alive and in DMEM throughout the procedure, to mimic the conditions used throughout the other experiments in this study. To remove T cells from the macrophage co-cultures, the illumination pillar was tilted away from the plate and stage, and the pipetting procedure used for T cell removal was applied. Fresh medium was added back to the well, the illumination pillar was re-set into place, and new phase-contrast and green fluorescence images were acquired of the same field of view. Merged images were obtained using Adobe Photoshop software.
Flow cytometry
Cells were washed in cold buffer containing PBS, 2% FBS, and 0.01% NaN3, and stained with antibodies by standard means. After washing, two- to four-color FCM was performed on Becton Dickinson Immunocytometry Systems FACScan or FACScalibur cytometers calibrated with Calibrite beads. CellQuest software was used for data acquisition and analysis. Geometric mean fluorescence intensities (gMFI) were obtained corresponding to the level of TCR, CD25, or Fas fluorescence on live T cells as calculated by CellQuest software. Within each experiment, all samples were performed in duplicate or triplicate such that error bars in the figure graphs represent SEM. The level of surface TCR of live cells was expressed as a percentage of that of unstimulated live T cells, while CD25 surface expression was expressed as percentage of the maximum value measured in each experiment. Where indicated, fluorescence measurements were compared between samples prepared on different days. In such cases, the same cytometer acquisition settings were used throughout the time course of experiments, and identical fluorescence acquisition was verified by a broad range of microbead fluorescence standards (RCP-30–5; Spherotech).
Acknowledgments
The authors thank Volker H. Haase for training in fluorescence microscopy, Kendra Speirs and Phil Scott for training in tissue culture growth of macrophages from bone marrow, and Diana Gil, Daniel Kreisel, Madhura Pradhan, Earl H. Rudolph, Shaheen Sutterwala, and Andrew D. Wells for helpful discussions. This work was supported by National Institutes of Health (NIH) grants AI41521 and AI43620 to Laurence A. Turka. Adam G. Schrum was supported by a Sangstat-American Society of Transplantation Basic Science Fellowship grant and by a Ruth L. Kirschstein NRSA from NCI, NIH.
Abbreviations
- AICD
Activation-induced cell death
- Macrophage APC
Antigen-presenting macrophage
- pPCC
Peptide derived from pigeon cytochrome c
- pOVA
Peptide derived from ovalbumin
- PC
Proliferative capacity
- RF
Responder frequency
References
- 1.Germain RN, Stefanova I. The dynamics of T cell receptor signaling: complex orchestration and the key roles of tempo and cooperation. Annu Rev Immunol. 1999;17:467–522. doi: 10.1146/annurev.immunol.17.1.467. [DOI] [PubMed] [Google Scholar]
- 2.Rachmilewitz J, Lanzavecchia A. A temporal and spatial summation model for T cell activation: signal integration and antigen decoding. Trends Immunol. 2002;23:592–595. doi: 10.1016/s1471-4906(02)02342-6. [DOI] [PubMed] [Google Scholar]
- 3.Lanzavecchia A, Sallusto F. Progressive differentiation and selection of the fittest in the immune response. Nat Rev Immunol. 2002;2:982–987. doi: 10.1038/nri959. [DOI] [PubMed] [Google Scholar]
- 4.Bevan MJ, Fink PJ. The CD8 response on autopilot. Nat Immunol. 2001;2:381–382. doi: 10.1038/87676. [DOI] [PubMed] [Google Scholar]
- 5.Wong P, Pamer EG. Cutting edge: antigen-independent CD8 T cell proliferation. J Immunol. 2001;166:5864–5868. doi: 10.4049/jimmunol.166.10.5864. [DOI] [PubMed] [Google Scholar]
- 6.Kaech SM, Ahmed R. Memory CD8+ T cell differentiation: initial antigen encounter triggers a developmental program in naive cells. Nat Immunol. 2001;2:415–422. doi: 10.1038/87720. [DOI] [PMC free article] [PubMed] [Google Scholar]
- 7.van Stipdonk MJ, Lemmens EE, Schoenberger SP. Naive CTLs require a single brief period of antigenic stimulation for clonal expansion and differentiation. Nat Immunol. 2001;2:423–429. doi: 10.1038/87730. [DOI] [PubMed] [Google Scholar]
- 8.Iezzi G, Karjalainen K, Lanzavecchia A. The duration of antigenic stimulation determines the fate of naive and effector T cells. Immunity. 1998;8:89–95. doi: 10.1016/s1074-7613(00)80461-6. [DOI] [PubMed] [Google Scholar]
- 9.Bajenoff M, Wurtz O, Guerder S. Repeated antigen exposure is necessary for the differentiation, but not the initial proliferation, of naive CD4(+) T cells. J Immunol. 2002;168:1723–1729. doi: 10.4049/jimmunol.168.4.1723. [DOI] [PubMed] [Google Scholar]
- 10.Lee WT, Pasos G, Cecchini L, Mittler JN. Continued antigen stimulation is not required during CD4(+) T cell clonal expansion. J Immunol. 2002;168:1682–1689. doi: 10.4049/jimmunol.168.4.1682. [DOI] [PubMed] [Google Scholar]
- 11.Weiss A, Shields R, Newton M, Manger B, Imboden J. Ligand-receptor interactions required for commitment to the activation of the interleukin 2 gene. J Immunol. 1987;138:2169–2176. [PubMed] [Google Scholar]
- 12.Crabtree GR. Contingent genetic regulatory events in T lymphocyte activation. Science. 1989;243:355–361. doi: 10.1126/science.2783497. [DOI] [PubMed] [Google Scholar]
- 13.Lee KH, Holdorf AD, Dustin ML, Chan AC, Allen PM, Shaw AS. T cell receptor signaling precedes immunological synapse formation. Science. 2002;295:1539–1542. doi: 10.1126/science.1067710. [DOI] [PubMed] [Google Scholar]
- 14.Schrum AG, Turka LA. The proliferative capacity of individual naive CD4(+) T cells is amplified by prolonged T cell antigen receptor triggering. J Exp Med. 2002;196:793–803. doi: 10.1084/jem.20020158. [DOI] [PMC free article] [PubMed] [Google Scholar]
- 15.van Stipdonk MJ, Hardenberg G, Bijker MS, Lemmens EE, Droin NM, Green DR, Schoenberger SP. Dynamic programming of CD8+ T lymphocyte responses. Nat Immunol. 2003;4:361–365. doi: 10.1038/ni912. [DOI] [PubMed] [Google Scholar]
- 16.Huppa JB, Gleimer M, Sumen C, Davis MM. Continuous T cell receptor signaling required for synapse maintenance and full effector potential. Nat Immunol. 2003;4:749–755. doi: 10.1038/ni951. [DOI] [PubMed] [Google Scholar]
- 17.Wong P, Pamer EG. Disparate in vitro and in vivo requirements for IL-2 during antigen-independent CD8 T cell expansion. J Immunol. 2004;172:2171–2176. doi: 10.4049/jimmunol.172.4.2171. [DOI] [PubMed] [Google Scholar]
- 18.Chao DL, Davenport MP, Forrest S, Perelson AS. Modelling the impact of antigen kinetics on T cell activation and response. Immunol Cell Biol. 2004;82:55–61. doi: 10.1111/j.1440-1711.2004.01207.x. [DOI] [PubMed] [Google Scholar]
- 19.Lenardo MJ, Boehme S, Chen L, Combadiere B, Fisher G, Freedman M, McFarland H, Pelfrey C, Zheng L. Autocrine feedback death and the regulation of mature T lymphocyte antigen responses. Int Rev Immunol. 1995;13:115–134. doi: 10.3109/08830189509061742. [DOI] [PubMed] [Google Scholar]
- 20.Badovinac VP, Porter BB, Harty JT. Programmed contraction of CD8(+) T cells after infection. Nat Immunol. 2002;3:619–626. doi: 10.1038/ni804. [DOI] [PubMed] [Google Scholar]
- 21.Redmond WL, Hernandez J, Sherman LA. Deletion of naive CD8 T cells requires persistent antigen and is not programmed by an initial signal from the tolerogenic APC. J Immunol. 2003;171:6349–6354. doi: 10.4049/jimmunol.171.12.6349. [DOI] [PubMed] [Google Scholar]
- 22.Otani I, Mori K, Sata T, Terao K, Doi K, Akari H, Yoshikawa Y. Accumulation of MAC387+ macrophages in paracortical areas of lymph nodes in rhesus monkeys acutely infected with simian immunodeficiency virus. Microbes Infect. 1999;1:977–985. doi: 10.1016/s1286-4579(99)80515-2. [DOI] [PubMed] [Google Scholar]
- 23.DuChateau BK, Munson EL, England DM, Lovrich SD, Callister SM, Jensen JR, Schell RF. Macrophages interact with enriched populations of distinct T lymphocyte subsets for the induction of severe destructive Lyme arthritis. J Leukoc Biol. 1999;65:162–170. doi: 10.1002/jlb.65.2.162. [DOI] [PubMed] [Google Scholar]
- 24.Altenschmidt U, Ricciardi-Castagnoli P, Modolell M, Otto H, Wiesmuller KH, Jung G, Simon MM. Bone marrow-derived macrophage lines and immortalized cloned macrophage and dendritic cells support priming of Borrelia burgdorferi-specific T cell responses in vitro and/or in vivo. Immunol Lett. 1996;50:41–49. doi: 10.1016/0165-2478(96)02517-5. [DOI] [PubMed] [Google Scholar]
- 25.Slegers TP, Broersma L, van Rooijen N, Hooymans JM, van Rij G, van der Gaag R. Macrophages play a role in the early phase of corneal allograft rejection in rats. Transplantation. 2004;77:1641–1646. doi: 10.1097/01.tp.0000129410.89410.f2. [DOI] [PubMed] [Google Scholar]
- 26.Chattergoon MA, Robinson TM, Boyer JD, Weiner DB. Specific immune induction following DNA-based immunization through in vivo transfection and activation of macrophages/antigen-presenting cells. J Immunol. 1998;160:5707–5718. [PubMed] [Google Scholar]
- 27.McKay PF, Barouch DH, Santra S, Sumida SM, Jackson SS, Gorgone DA, Lifton MA, Letvin NL. Recruitment of different subsets of antigen-presenting cells selectively modulates DNA vaccine-elicited CD4+ and CD8+ T lymphocyte responses. Eur J Immunol. 2004;34:1011–1020. doi: 10.1002/eji.200324840. [DOI] [PubMed] [Google Scholar]
- 28.Schrum AG, Turka LA, Palmer E. Surface T cell antigen receptor expression and availability for long-term antigenic signaling. Immunol Rev. 2003;196:7–24. doi: 10.1046/j.1600-065x.2003.00083.x. [DOI] [PubMed] [Google Scholar]
- 29.Schrum AG, Wells AD, Turka LA. Enhanced surface TCR replenishment mediated by CD28 leads to greater TCR engagement during primary stimulation. Int Immunol. 2000;12:833–842. doi: 10.1093/intimm/12.6.833. [DOI] [PubMed] [Google Scholar]
- 30.Blichfeldt E, Munthe LA, Rotnes JS, Bogen B. Dual T cell receptor T cells have a decreased sensitivity to physiological ligands due to reduced density of each T cell receptor. Eur J Immunol. 1996;26:2876–2884. doi: 10.1002/eji.1830261211. [DOI] [PubMed] [Google Scholar]
- 31.Legrand N, Freitas AA. CD8(+) T lymphocytes in double alphabeta TCR transgenic mice. II. Competitive fitness of dual alphabeta TCR CD8(+) T lymphocytes in the peripheral pools. J Immunol. 2001;167:6158–6164. doi: 10.4049/jimmunol.167.11.6158. [DOI] [PubMed] [Google Scholar]
- 32.Jelley-Gibbs DM, Lepak NM, Yen M, Swain SL. Two distinct stages in the transition from naive CD4 T cells to effectors, early antigen-dependent and late cytokine-driven expansion and differentiation. J Immunol. 2000;165:5017–5026. doi: 10.4049/jimmunol.165.9.5017. [DOI] [PubMed] [Google Scholar]
- 33.Wells AD, Gudmundsdottir H, Turka LA. Following the fate of individual T cells throughout activation and clonal expansion. Signals from T cell receptor and CD28 differentially regulate the induction and duration of a proliferative response. J Clin Invest. 1997;100:3173–3183. doi: 10.1172/JCI119873. [DOI] [PMC free article] [PubMed] [Google Scholar]
- 34.Gudmundsdottir H, Wells AD, Turka LA. Dynamics and requirements of T cell clonal expansion in vivo at the single-cell level: effector function is linked to proliferative capacity. J Immunol. 1999;162:5212–5223. [PubMed] [Google Scholar]
- 35.Rathmell JC, Thompson CB. The central effectors of cell death in the immune system. Annu Rev Immunol. 1999;17:781–828. doi: 10.1146/annurev.immunol.17.1.781. [DOI] [PubMed] [Google Scholar]
- 36.Lee IH, Li WP, Hisert KB, Ivashkiv LB. Inhibition of interleukin 2 signaling and signal transducer and activator of transcription (STAT)5 activation during T cell receptor-mediated feedback inhibition of T cell expansion. J Exp Med. 1999;190:1263–1274. doi: 10.1084/jem.190.9.1263. [DOI] [PMC free article] [PubMed] [Google Scholar]
- 37.Porter BO, Malek TR. Prostaglandin E2 inhibits T cell activation-induced apoptosis and Fas-mediated cellular cytotoxicity by blockade of Fas-ligand induction. Eur J Immunol. 1999;29:2360–2365. doi: 10.1002/(SICI)1521-4141(199907)29:07<2360::AID-IMMU2360>3.0.CO;2-A. [DOI] [PubMed] [Google Scholar]
- 38.Patel VP, Moran M, Low TA, Miceli MC. A molecular framework for two-step T cell signaling: Lck Src homology 3 mutations discriminate distinctly regulated lipid raft reorganization events. J Immunol. 2001;166:754–764. doi: 10.4049/jimmunol.166.2.754. [DOI] [PubMed] [Google Scholar]
- 39.Gett AV, Sallusto F, Lanzavecchia A, Geginat J. T cell fitness determined by signal strength. Nat Immunol. 2003;4:355–360. doi: 10.1038/ni908. [DOI] [PubMed] [Google Scholar]
- 40.Murphy KM, Heimberger AB, Loh DY. Induction by antigen of intrathymic apoptosis of CD4+CD8+TCRlo thymocytes in vivo. Science. 1990;250:1720–1723. doi: 10.1126/science.2125367. [DOI] [PubMed] [Google Scholar]
- 41.Caamano J, Tato C, Cai G, Villegas EN, Speirs K, Craig L, Alexander J, Hunter CA. Identification of a role for NF-kappa B2 in the regulation of apoptosis and in maintenance of T cell-mediated immunity to Toxoplasma gondii. J Immunol. 2000;165:5720–5728. doi: 10.4049/jimmunol.165.10.5720. [DOI] [PubMed] [Google Scholar]
- 42.Gallucci S, Lolkema M, Matzinger P. Natural adjuvants: endogenous activators of dendritic cells. Nat Med. 1999;5:1249–1255.2. doi: 10.1038/15200. [DOI] [PubMed] [Google Scholar]