Abstract
The T cell receptor (TCR) can recognize a variety of cognate peptide/major histocompatibility complex (pMHC) ligands and translate their affinity into distinct cellular responses. To achieve this, the nonsignaling αβ heterodimer communicates ligand recognition to the CD3 signaling subunits by an unknown mechanism. In thymocytes, we found that both positive- and negative-selecting pMHC ligands expose a cryptic epitope in the CD3 complex upon TCR engagement. This conformational change is induced in vivo and requires the expression of cognate MHC. We conclude that TCR engagement with a cognate pMHC ligand induces a conformational change in the CD3 complex of thymocytes and propose that this marks an initial event during thymic selection that signals the recognition of self-antigen.
T cell development is controlled by CD3 signal transduction, which is initiated when peptide–MHC (pMHC) engages the αβ heterodimer of the TCR (1). A unique feature of the TCR is its ability to scan structurally similar pMHC ligands and transmit distinct biochemical signals depending on the strength of the ligand recognized (2, 3). In developing thymocytes, weak TCR ligands induce positive selection and stronger ligands induce negative selection (4). A great deal of work has focused on how the CD3 complex transduces TCR engagement into specific cellular responses. Current models point to TCR oligomerization (5), synapse formation and membrane reorganization (6–8), recruitment of TCR to membrane rafts (9), and induction of ligand-induced TCR–CD3 conformational change (10, 11) to explain the earliest events of TCR signaling.
Although the conformational change explanation lies closest to the point of origin, it is also the idea least supported by direct experimental evidence. Crystallographic analysis of pMHC–TCR complexes reveals ligand-induced conformational changes in the complementarity determining regions (CDRs) of TCR-variable domains (12–14). However, these structural changes are thought to accommodate pMHC binding and with one exception (15) are not accompanied by any corresponding conformational changes of the TCR constant domains. Furthermore, the crystal structures of TCRs bound to variant pMHC ligands have revealed only minor differences in CDR conformation in comparison with nominal peptide ligands (12, 14). These studies argue that conformational changes occurring in the CDR loops may not be communicated to the distal domains of the TCR–CD3 complex.
Using a biochemical approach, we previously reported that human CD3 undergoes a conformational change when the TCR–CD3 complex is directly bound by certain mAbs but not by others (16). This conformational change uncovered a cryptic epitope on the cytoplasmic tail of CD3ɛ, revealing a polyproline sequence that is a binding site for the SH3.1 domain of the cytosolic adaptor protein, Nck. Whether such a conformational change occurs when cognate pMHC engages TCR has not been directly addressed (17, 18). Here, we found that a conformational change in CD3 was induced by either positive- or negative-selecting pMHCs in vitro and also by endogenous pMHC during thymocyte maturation in vivo. The conformational change within the CD3 complex might be one of the first steps in TCR signaling, indicating that a relevant pMHC ligand has been bound by the αβ heterodimer.
Results and discussion
The TCR–CD3 complex of murine thymocytes undergoes a conformational change when stimulated with antibodies
Engagement of human TCR–CD3 by certain mAbs was previously shown to expose a cryptic polyproline sequence in the cytoplasmic domain of CD3ɛ (“open CD3”), which could be bound by the Nck SH3.1 domain in pull-down (PD) assays (16). To determine whether anti-TCR–CD3 antibodies induce open CD3 in murine thymocytes, C57BL6 thymocytes were stimulated with anti-TCRβ or anti-CD3ɛ mAbs. Postnuclear lysates were subjected to Nck SH3.1 PD and CD3ζ Western blotting to assess the accessibility of the CD3ɛ polyproline motif in mature, fully assembled TCR–CD3 complexes (see Materials and methods, Open CD3 PD and Western blots section). Open CD3 was significantly induced by stimulation with either mAb (Fig. 1 A). PD was blocked by the mAb APA1/1, which is specific for the polyproline region of CD3ɛ (19), but was not blocked by antibodies specific for CD3γ, CD3δ, or CD3ζ (Fig. 1 B). Thus, the open configuration in murine CD3 can be induced by antibody binding to the TCR–CD3 complex.
Figure 1.
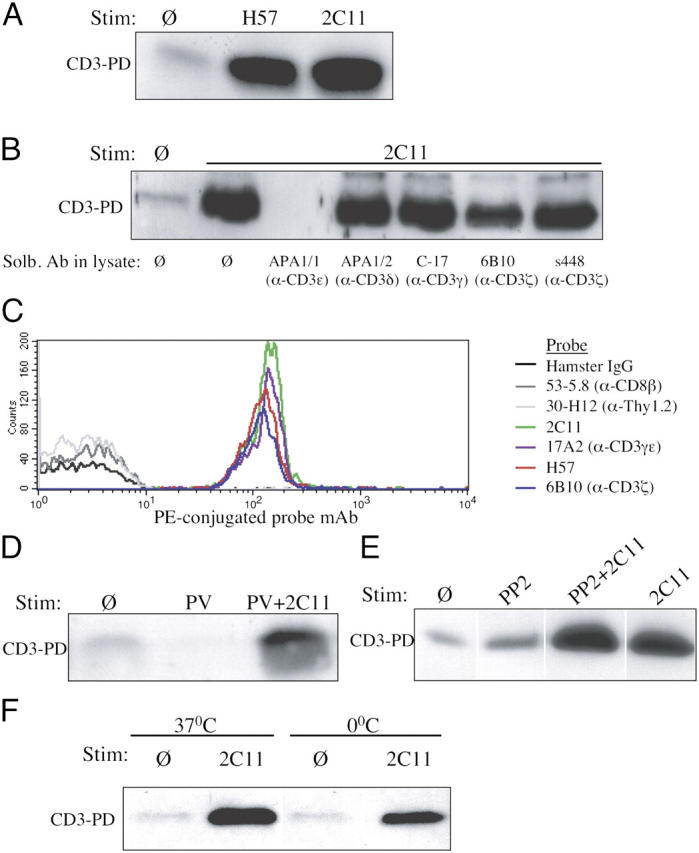
Induction of open CD3 in thymocytes stimulated with anti-TCR–CD3 antibodies. (A) The open CD3 PD assay was performed on lysates from C57BL6 thymocytes that had been incubated in the absence (Ø) or presence of 10 μg/ml anti-TCRβ (H57) or anti-CD3ɛ (2C11) for 5 min at 37°C. (B) The open CD3 PD assay was performed as in A, and after cell lysis, various antibodies (10 μg/ml) specific for distinct CD3 subunits were added to the lysates and were present during the assay. APA1/1, anti-CD3ɛ intracellular polyproline motif; APA1/2, anti-CD3δ cytoplasmic tail; C-17, anti-CD3γ extracellular domain; 6B10, anti-CD3ζ extracellular domain; s448, anti-CD3ζ intracellular domain. (C) The open CD3 recapture assay was performed on lysates from C57BL6 thymocytes that had been incubated with 10 μg/ml anti-TCRβ (H57) for 15 min at 37°C. After the open CD3 complexes had been eluted and recaptured on APA1/1 beads, aliquots of the beads were separately stained with a PE-conjugated mAb probe as indicated and analyzed by flow cytometry. (D) The open CD3 PD assay was performed on lysates from C57BL6 thymocytes that were treated with 50 μM PV or PV and 10 μg/ml anti-CD3ɛ (2C11) for 5 min at 37°C. (E) Open CD3 PD assay of lysates from C57BL6 thymocytes that were preincubated for 45 min with or without 20 μM PP2 and stimulated with 10 μg/ml anti-CD3ɛ (2C11) in the continued presence or absence of PP2 for 30 min at 37°C. (F) The open CD3 PD assay was performed as in A for 30 min at 37 or 0°C.
To determine whether open CD3 complexes were associated with the usual complement of TCR–CD3 subunits, we used a PD recapture strategy. After C57BL6 thymocytes were stimulated and lysed, complexes bound by the Nck SH3.1 sepharose beads were eluted and recaptured on APA1/1(anti-CD3ɛ)–conjugated polystyrene latex beads. The native complexes on the APA1/1 beads were stained with various PE-conjugated mAbs and analyzed by flow cytometry, similarly to a previously published method (20). Latex beads conjugated to control Ig failed to immunoprecipitate TCR–CD3 subunits (unpublished data), and APA1/1 beads failed to capture highly expressed thymocyte proteins such as CD8 and Thy1.2; however, the APA1/1 beads specifically recaptured TCRβ, CD3ɛ, CD3γ, and CD3ζ polypeptides (Fig. 1 C). Thus, both TCR and CD3 components are present in the open CD3 complexes.
It was possible that open CD3 exposure was dependent on signal transduction. However, treatment of thymocytes with pervanadate (PV), a strong phosphatase inhibitor and inducer of tyrosine phosphorylation, did not induce open CD3 (Fig. 1 D). Furthermore, thymocyte stimulation with anti-CD3ɛ in the presence of the src kinase inhibitor PP2 failed to inhibit the induction of open CD3 (Fig. 1 E). Finally, even when antibody stimulations were performed at 0°C, open CD3 was still inducible (Fig. 1 F). We conclude that the induction of open CD3 observed in these experiments is independent of tyrosine phosphorylation, src kinase activity, and other signaling and therefore represents a conformational change induced by the binding of antibody to the murine TCR–CD3 complex.
Thymocyte TCR–CD3 complexes undergo a conformational change when stimulated with agonist pMHC ligands
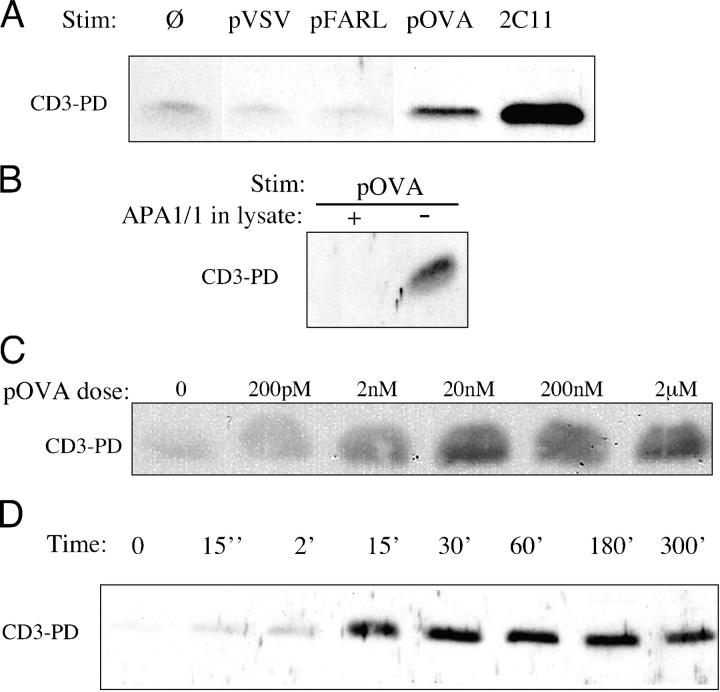
Using the OT-I transgenic mouse model, we asked whether pMHC presented on APCs induces a conformational change in the CD3 complex of thymocytes. In OT-I β2m−/− RAG2−/− mice, thymocyte development is blocked at the CD4+ CD8+ double positive (DP) stage due to lack of class I MHC antigen expression. The open CD3 PD assay was performed after the coculture of OT-I β2m−/− RAG2−/− DP thymocytes with T2-Kb APCs (21) that had been preloaded with various peptides. The peptides pVSV and pFARL, which bind H-2Kb but do not engage the OT-I TCR, failed to induce open CD3 in these cocultures (Fig. 2 A). In contrast, the strong agonist and negative-selecting peptide pOVA induced open CD3 in OT-I β2m−/− RAG2−/− DP thymocytes (Fig. 2 A). Detection of open CD3 could be competitively blocked by the APA1/1 mAb, verifying that the PD was specific for the cytoplasmic tail of CD3ɛ (Fig. 2 B). Induction of open CD3 by pOVA was peptide dose dependent (Fig. 2 C), with weak detection almost immediately after TCR engagement and maximal detection by 30 min that persisted for several hours (Fig. 2 D).
Figure 2.
An agonist pMHC ligand induces open CD3 in murine thymocytes. The open CD3 PD assay was performed on lysates from cocultures of OT-I β2m−/− RAG2−/− DP thymocytes and T2-Kb APCs. (A) Before thymocyte–APC coculture, APCs were incubated in the absence (Ø) or presence (2 μM) of the null peptides, VSV (pVSV) and FARL (pFARL), or the strong agonist OVA (pOVA). After coculture for 30 min at 37°C, cells were lysed, and the lysates were subjected to the open CD3 PD assay. As a positive control for open CD3 induction, one coculture was incubated with anti-CD3ɛ (2C11). (B) APCs loaded with 2 μM pOVA were cocultured with thymocytes for 30 min at 37°C. After thymocyte stimulation and lysis, the open CD3 PD assay was performed in the presence (+) or absence (−) of 10 μg/ml APA1/1, which is a mAb specific for the CD3ɛ polyproline motif. (C) APCs loaded with 200 pM to 2 μM pOVA were cocultured with thymocytes for 30 min at 37°C. The open CD3 assay was performed as described above. (D) After a brief centrifugation, pOVA-loaded APCs were cocultured with thymocytes for up to 300 min at 37°C. For time point 0, thymocytes and nonloaded APCs were mixed, centrifuged, and immediately lysed. The amount of open CD3 recovered after each stimulation is shown.
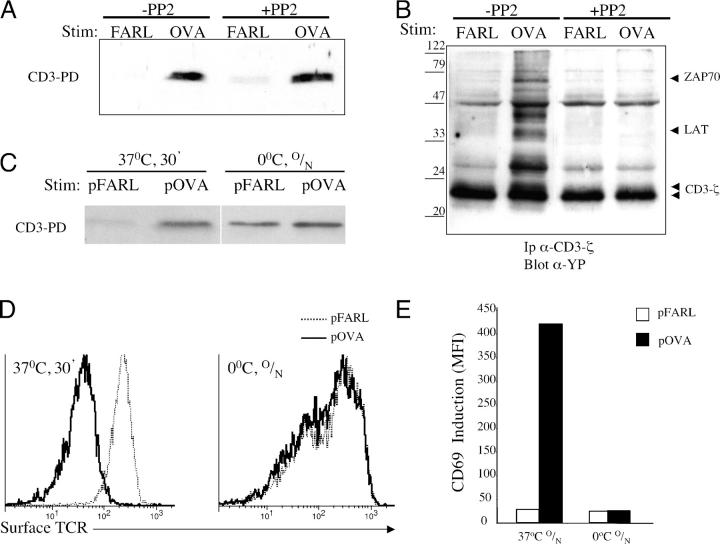
To determine whether the opening of CD3 was dependent on tyrosine phosphorylation, OT-I β2m−/− RAG2−/− DP thymocytes were cocultured with pOVA-loaded APCs in the presence or absence of the src kinase inhibitor PP2. Although PP2 inhibited early tyrosine phosphorylation, it failed to inhibit induction of open CD3 (Fig. 3, A and B). To more generally block cellular enzymatic and signaling activity, cocultures of thymocytes with pOVA-loaded APCs were performed at 0°C. As these experiments relied on the passive accumulation of TCR–MHC binding events, cocultures were maintained overnight. This treatment permitted the induction of open CD3 (Fig. 3 C), despite the lack of surface TCR down-regulation (Fig. 3 D) and CD69 up-regulation (Fig. 3 E). These data argue that the open CD3 induced in thymocytes by pOVA occurs independently of the enzymatic and/or cellular activities typically associated with signal transduction. We conclude that the induction of open CD3 in thymocytes by pMHC ligands is directly dependent on TCR engagement and represents a conformational change in the TCR–CD3 complex.
Figure 3.
Induction of open CD3 in thymocytes by agonist pMHC occurs independently of signal transduction. (A) OT-I β2m−/− RAG2−/− DP thymocytes and T-2Kb APCs loaded with 2 μM pFARL or pOVA were separately preincubated in the presence or absence of 20 μM PP2 for 45 min at 37°C. The cells were then cocultured in the continued presence or absence of PP2 for 15 min at 37°C, after which the open CD3 PD assay was performed. (B) Samples from A were immunoprecipitated with anti-CD3ζ and blotted with anti-phosphotyrosine. (C) APCs loaded with 2 μM pFARL or pOVA were cocultured with OT-I β2m−/− RAG2−/− DP thymocytes either for 30 min at 37°C or overnight (O/N) at 0°C and then subjected to the open CD3 PD assay. (D) Cultures that were incubated as described in C were stained with anti–TCRβ-PE and analyzed by flow cytometry for surface TCR expression. (E) APCs loaded with 2 μM pFARL or pOVA were cocultured overnight (O/N) with OT-I β2m−/− RAG2−/− DP thymocytes at 37 or 0°C. Cells were harvested and stained with anti–CD69-PE and analyzed by flow cytometry.
Both positive- and negative-selecting peptides induce open CD3 in thymocytes in vitro
The peptides pE1, pQ7, and pQ4 are variants of pOVA that bind as well as pOVA to H-2Kb (22), but pE1 and pQ7 induce positive selection, whereas pQ4 and pOVA induce negative selection of OT-I thymocytes in FTOC (23, 24, and unpublished data). We cocultured OT-I β2m−/− RAG2−/− DP thymocytes with APCs that had been preloaded with the various peptides and assessed CD69 up-regulation after 16 h. The biologic potency of these peptides for the OT-I TCR varied over a 50,000-fold range: pE1 < pQ7 < pQ4 < pOVA (Fig. 4 A). The degree of surface TCR down-regulation induced after 30 min of coculture also followed the same hierarchy (Fig. 4 B).
Figure 4.
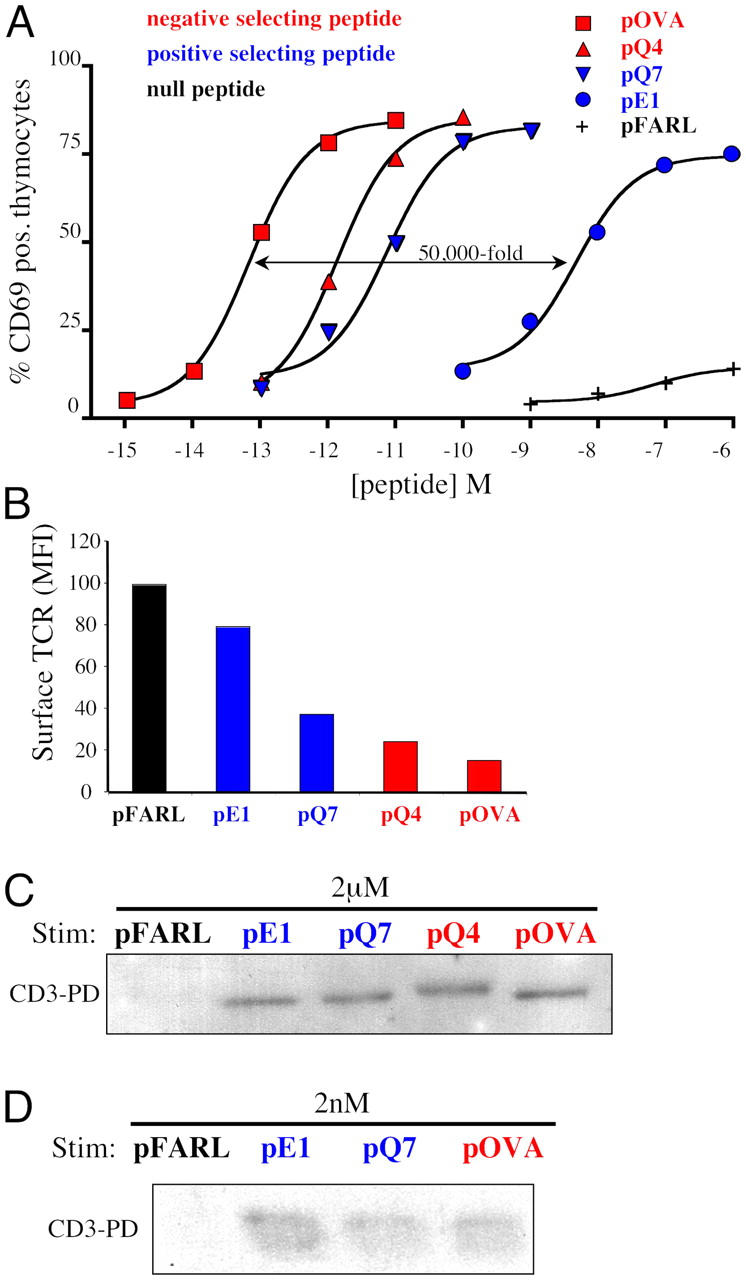
Positive and negative selecting peptides induce open CD3 in thymocytes in vitro. Peptides were scored regarding their effect on thymic selection in FTOC as either null (black), positive selecting (blue), or negative selecting (red). (A) APCs loaded with varying concentrations of pFARL, pE1, pQ7, pQ4, or pOVA were cocultured with OT-I β2m−/− RAG2−/− DP thymocytes for 16 h at 37°C. Cells were then stained with anti–CD69-PE and the percentage of positive thymocytes was measured by flow cytometry. (B) APCs loaded with 2 μM pFARL, pE1, pQ7, pQ4, or pOVA were cocultured with OT-I β2m−/− RAG2−/− DP thymocytes for 30 min at 37°C. Cells were then stained with anti–TCRβ-PE and the mean fluorescence intensity (MFI) of surface TCR expression was measured by flow cytometry. (C) APCs preloaded with 2 μM pFARL, pE1, pQ7, pQ4, or pOVA were cocultured with OT-I β2m−/− RAG2−/− DP thymocytes for 30 min at 37°C. Cells were then lysed and the open CD3 PD assay was performed. (D) APCs loaded with 2 nM pFARL, pE1, pQ7, or pOVA were cocultured with thymocytes for 30 min at 37°C. The open CD3 PD assay was then performed on lysates of cells stimulated as described in C.
When cocultures were subjected to the open CD3 PD assay, only null peptides failed to induce open CD3 (Fig. 4 C). Whether weak or strong, all signaling pMHC ligands induced open CD3 at high peptide concentrations (Fig. 4 C). Based on the differences in signaling potency noted above, we hypothesized that stronger, negative-selecting pMHC ligands might induce the open CD3 conformation at lower peptide concentrations than the weaker, positive-selecting pMHC ligands. Surprisingly, however, lowering the peptide concentration 1,000-fold to barely above the detection limit of the PD assay did not prevent the positive-selecting pMHC ligands from inducing open CD3 (Fig. 4 D). We conclude that either positive- or negative-selecting peptides can induce a conformational change in the TCR–CD3 complex. Therefore, in thymocytes, the open CD3 conformation distinguishes null from signaling pMHCs but is not predictive of signal strength and does not distinguish between ligands capable of mediating positive or negative selection.
Thymic selection induces open CD3 in thymocytes in vivo
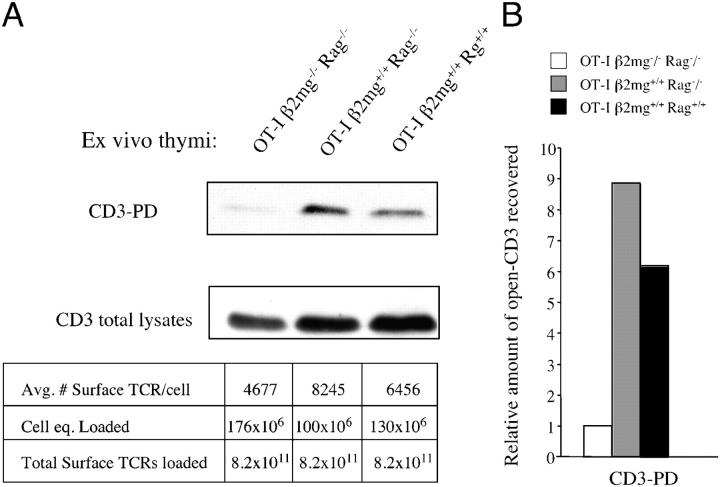
We wished to determine whether the endogenous pMHC ligands that mediate thymocyte selection in vivo induced open CD3. The OT-I transgene was bred onto various thymic selection backgrounds: OT-I β2m−/− RAG2−/− (no TCR engagement, no selection); OT-I β2m+/+ RAG2−/− (positive selection); and OT-I β2m+/+ RAG2+/+ (positive selection). Without any exogenous stimulation, thymocytes were harvested and lysed, and the lysates were subjected to the open CD3 PD assay. Because the level of TCR expression varied somewhat between strains, analysis was facilitated by loading each lane of the gel with an equal number of “surface TCR equivalents” rather than cell equivalents (Fig. 5). OT-I β2m+/+ RAG2−/− and OT-I β2m+/+ RAG2+/+ mice displayed significantly enhanced levels of endogenous open CD3, which was above that of the nonselected thymocytes from OT-I β2m−/− RAG2−/− mice (Fig. 5). It is likely that the open CD3 detected in these experiments originated from thymocytes undergoing (or having undergone) positive selection, because the death of negatively selected thymocytes in vivo removes them from ex vivo assays. This may explain why the detection of open CD3 was less pronounced in OT-I RAG+/+ thymocytes compared with OT-I RAG−/− thymocytes (Fig. 5). We conclude that the expression of endogenous pMHC complexes is associated with the induction of open CD3 in thymocytes in vivo.
Figure 5.
The expression of cognate pMHC ligands induces open CD3 in thymocytes in vivo. (A) Thymocytes were obtained from 7-wk-old OT-I β2m−/− RAG2−/−, OT-I β2m+/+ RAG2−/−, or OT-I β2m+/+ RAG2+/+ mice. Without any exogenous stimulation, thymocytes were lysed and subjected to the open CD3 PD assay. Quantitative flow cytometry was used to estimate the average number of surface TCRs expressed on thymocytes from each genotype. These calculations were used to load each gel lane with equal numbers of surface TCR equivalents, as noted below the blot (average no. surface TCRs/cell × cell equivalents loaded = total surface TCRs loaded). For comparison, a Western blot of CD3ζ was performed on total thymocyte lysates loaded according to the same calculations. (B) Pixels from the bands obtained in A were quantified and the fold-increase in band intensity was calculated relative to the signal obtained from OT-I β2m−/− RAG2−/− thymocytes.
Concluding remarks
A number of studies support the notion that conformational changes accompany TCR–MHC binding. For example, the binding of soluble TCR αβ heterodimers to a spectrum of variant pMHC ligands was recently shown to result in a wide range of heat capacity measurements, an indication of conformational changes and/or structural flexibility (25). However, the observation that pMHC ligands induce an open CD3 conformation was not predicted by most crystallographic studies, because ligand-induced conformational changes in TCR αβ were shown to be restricted to the CDR loops due to an “induced-fit” of the TCR's variable regions at the ligand binding interface (12–14). An exception to this was reported in a recently solved crystal structure (15) of the LC13 TCR complexed with its agonist pMHC ligand, which demonstrated a conformational change in a Cα region where the TCRα chain potentially interacts with CD3ɛ. It is not clear whether this Cα conformational change represents a unique or generalizable phenomenon, because it has not been observed in other TCR–MHC crystals (25, 26). Nevertheless, the idea that the αβ heterodimer moves upon engagement with pMHC ligand and that this movement in turn nudges CD3ɛ represents an interesting model of intersubunit communication that is consistent with our observations.
In thymocytes, the open CD3 conformation distinguishes null from signaling pMHCs but is not predictive of signal strength and does not distinguish between ligands capable of mediating positive or negative selection. Open CD3 could mark the initiation of a molecular clock (27, 28), where short TCR occupancy leads to early signals (e.g., positive selection) and long TCR occupancy leads to late signals (e.g., negative selection). Having started the timer, other signals downstream of open CD3 would be required to complete the kinetic measurement of ligand engagement and determine the cellular response. We propose that the open CD3 conformation marks an early molecular signal from the αβ heterodimer to the CD3 complex that a cognate pMHC ligand has been recognized by the TCR. The precise relationship of this conformational change to the initiation of downstream signaling cascades remains to be determined.
Materials and Methods
DNA constructs and mice
The construct pGEX-4T1-GST-SH3.1 was provided by R. Geha (Harvard Medical School, Boston, MA). OT-I β2m−/− RAG2−/−, OT-I β2m+/+ RAG2−/−, and OT-I β2m+/+ RAG2+/+ mice were bred and maintained on a C57BL6 background.
Antibodies, peptides, and other reagents
Rabbit anti-CD3ζ serum (s448; reference 19) and anti-phosphotyrosine (4G10; Upstate Biotechnology) were used for Western blots. Anti-CD3ɛ (APA1/1) and anti-CD3δ (APA1/2) were described previously (29). Other antibodies included anti-CD3ɛ (2C11), anti-TCRβ (H57), anti-CD3γɛ (17A2), anti-CD8β (53–5.8), anti-Thy1.2 (30-H12), and anti-CD69 (H1.2F3; BD Biosciences); and anti-CD3ζ (6B10) and anti-CD3γ (C-17; Santa Cruz Biotechnology, Inc.). The peptides pFARL (SSIEFARL), pVSV (RGYVYQGL), pE1 (EIINFKEL), pQ7 (SIINFKQL), pQ4 (SIIQFKEL), and pOVA (SIINFKEL) were synthesized as described previously (30).
Thymocyte stimulation
30 × 106 thymocytes were incubated with 10 μg/ml soluble antibody. PV (50 μM) and PP2 (20 μM) treatments were performed as described previously (16). T2-Kb cells (provided by T. Potter, National Jewish Medical and Research Center, Denver, CO; reference 21) were cultured with exogenous peptide for 3 h at 37°C, washed, and cocultured with 50 × 106 OT-I β2m−/− RAG2−/− thymocytes (1:1 ratio). Cells were washed and lysed in 0.3% Brij 58 isotonic buffer; and the postnuclear fractions were subjected to the open CD3 PD assay.
Open CD3 PD and Western blots
The open CD3 PD assay was described previously (16). Samples were subjected to reducing SDS-PAGE (13%) and transferred to PVDF membranes. Mature, fully assembled TCR–CD3 complexes were detected by Western blotting with anti-CD3ζ antiserum s448.
Open CD3 recapture assay
After the open CD3 PD, TCR–CD3 complexes were eluted from the beads by incubation in 10 mM reduced glutathione for 1 h at 30°C. Eluates were incubated with APA1/1 covalently bound to 3.2-μm diameter carboxylate-modified polystyrene latex beads (Interfacial Dynamics). The APA1/1 beads recaptured TCR–CD3 complexes, which were probed with PE-conjugated antibodies specific for various TCR–CD3 subunits, and analyzed by flow cytometry.
Quantitative flow cytometry
Quantitative surface TCR estimates were made using PE-conjugated H57 (1:1 fluorochrome/antibody ratio; BD Biosciences) to stain thymocytes, and microbead fluorescence standards were used for standard curve generation (RCP-30-5; Spherotech).
Acknowledgments
We thank F. Carbone, M. Bevan, and D. Kioussis for OT-I transgenic mice; T. Potter for T2-Kb cells; and R. Geha for the GST-SH3.1 construct.
This work was supported by grants to E. Palmer from the Swiss National Science Foundation, Hoffman-LaRoche, Ltd., and Novartis AG. D. Gil was supported by an EMBO postdoctoral fellowship and by Universidad Complutense (Programa Ramón y Cajal and project PR3/04-12454). A.G. Schrum was supported by a Ruth L. Kirschstein NRSA from National Cancer Institute, National Institutes of Health.
The authors have no conflicting financial interests.
D. Gil and A.G. Schrum contributed equally to this work.
References
- 1.Terhorst, C., M. Exley, R. Franco, C. Hall, J. Kang, B. Mueller, J. Sancho, J. She, and T. Wileman. 1993. Coupling of T-cell activation with T-cell receptor assembly. Year Immunol. 7:1–24. [PubMed] [Google Scholar]
- 2.Davis, M.M., M. Krogsgaard, J.B. Huppa, C. Sumen, M.A. Purbhoo, D.J. Irvine, L.C. Wu, and L. Ehrlich. 2003. Dynamics of cell surface molecules during T cell recognition. Annu. Rev. Biochem. 72:717–742. [DOI] [PubMed] [Google Scholar]
- 3.Werlen, G., B. Hausmann, D. Naeher, and E. Palmer. 2003. Signaling life and death in the thymus: timing is everything. Science. 299:1859–1863. [DOI] [PubMed] [Google Scholar]
- 4.Starr, T.K., S.C. Jameson, and K.A. Hogquist. 2003. Positive and negative selection of T cells. Annu. Rev. Immunol. 21:139–176. [DOI] [PubMed] [Google Scholar]
- 5.Bachmann, M.F., and P.S. Ohashi. 1999. The role of T-cell receptor dimerization in T-cell activation. Immunol. Today. 20:568–576. [DOI] [PubMed] [Google Scholar]
- 6.Shaw, A.S., and M.L. Dustin. 1997. Making the T cell receptor go the distance: a topological view of T cell activation. Immunity. 6:361–369. [DOI] [PubMed] [Google Scholar]
- 7.Bromley, S.K., W.R. Burack, K.G. Johnson, K. Somersalo, T.N. Sims, C. Sumen, M.M. Davis, A.S. Shaw, P.M. Allen, and M.L. Dustin. 2001. The immunological synapse. Annu. Rev. Immunol. 19:375–396. [DOI] [PubMed] [Google Scholar]
- 8.van der Merwe, P.A., and S.J. Davis. 2003. Molecular interactions mediating T cell antigen recognition. Annu. Rev. Immunol. 21:659–684. [DOI] [PubMed] [Google Scholar]
- 9.Dykstra, M., A. Cherukuri, H.W. Sohn, S.J. Tzeng, and S.K. Pierce. 2003. Location is everything: lipid rafts and immune cell signaling. Annu. Rev. Immunol. 21:457–481. [DOI] [PubMed] [Google Scholar]
- 10.Cohn, M. 2003. Tritope model of restrictive recognition by the TCR. Trends Immunol. 24:127–131. [DOI] [PubMed] [Google Scholar]
- 11.Janeway, C.A., Jr. 1995. Ligands for the T-cell receptor: hard times for avidity models. Immunol. Today. 16:223–225. [DOI] [PubMed] [Google Scholar]
- 12.Hennecke, J., and D.C. Wiley. 2001. T cell receptor-MHC interactions up close. Cell. 104:1–4. [DOI] [PubMed] [Google Scholar]
- 13.Reiser, J.B., C. Gregoire, C. Darnault, T. Mosser, A. Guimezanes, A.M. Schmitt-Verhulst, J.C. Fontecilla-Camps, G. Mazza, B. Malissen, and D. Housset. 2002. A T cell receptor CDR3beta loop undergoes conformational changes of unprecedented magnitude upon binding to a peptide/MHC class I complex. Immunity. 16:345–354. [DOI] [PubMed] [Google Scholar]
- 14.Rudolph, M.G., and I.A. Wilson. 2002. The specificity of TCR/pMHC interaction. Curr. Opin. Immunol. 14:52–65. [DOI] [PubMed] [Google Scholar]
- 15.Kjer-Nielsen, L., C.S. Clements, A.W. Purcell, A.G. Brooks, J.C. Whisstock, S.R. Burrows, J. McCluskey, and J. Rossjohn. 2003. A structural basis for the selection of dominant alphabeta T cell receptors in antiviral immunity. Immunity. 18:53–64. [DOI] [PubMed] [Google Scholar]
- 16.Gil, D., W.W. Schamel, M. Montoya, F. Sanchez-Madrid, and B. Alarcon. 2002. Recruitment of Nck by CD3 epsilon reveals a ligand-induced conformational change essential for T cell receptor signaling and synapse formation. Cell. 109:901–912. [DOI] [PubMed] [Google Scholar]
- 17.Davis, M.M. 2002. A new trigger for T cells. Cell. 110:285–287. [DOI] [PubMed] [Google Scholar]
- 18.Zeng, R., J.L. Cannon, R.T. Abraham, M. Way, D.D. Billadeau, J. Bubeck-Wardenberg, and J.K. Burkhardt. 2003. SLP-76 coordinates Nck-dependent Wiskott-Aldrich syndrome protein recruitment with Vav-1/Cdc42-dependent Wiskott-Aldrich syndrome protein activation at the T cell-APC contact site. J. Immunol. 171:1360–1368. [DOI] [PubMed] [Google Scholar]
- 19.San Jose, E., A.G. Sahuquillo, R. Bragado, and B. Alarcon. 1998. Assembly of the TCR/CD3 complex: CD3 epsilon/delta and CD3 epsilon/gamma dimers associate indistinctly with both TCR alpha and TCR beta chains. Evidence for a double TCR heterodimer model. Eur. J. Immunol. 28:12–21. [DOI] [PubMed] [Google Scholar]
- 20.Lund-Johansen, F., K. Davis, J. Bishop, and R. de Waal Malefyt. 2000. Flow cytometric analysis of immunoprecipitates: high-throughput analysis of protein phosphorylation and protein-protein interactions. Cytometry. 39:250–259. [DOI] [PubMed] [Google Scholar]
- 21.Werlen, G., B. Hausmann, and E. Palmer. 2000. A motif in the alphabeta T-cell receptor controls positive selection by modulating ERK activity. Nature. 406:422–426. [DOI] [PubMed] [Google Scholar]
- 22.Ohlen, C., J. Bastin, H.G. Ljunggren, S. Imreh, G. Klein, A.R. Townsend, and K. Karre. 1990. Restoration of H-2b expression and processing of endogenous antigens in the MHC class I pathway by fusion of a lymphoma mutant to L cells of the H-2k haplotype. Eur. J. Immunol. 20:1873–1876. [DOI] [PubMed] [Google Scholar]
- 23.Stefanski, H.E., D. Mayerova, S.C. Jameson, and K.A. Hogquist. 2001. A low affinity TCR ligand restores positive selection of CD8+ T cells in vivo. J. Immunol. 166:6602–6607. [DOI] [PubMed] [Google Scholar]
- 24.Puls, K.L., K.A. Hogquist, N. Reilly, and M.D. Wright. 2002. CD53, a thymocyte selection marker whose induction requires a lower affinity TCR-MHC interaction than CD69, but is up-regulated with slower kinetics. Int. Immunol. 14:249–258. [DOI] [PubMed] [Google Scholar]
- 25.Krogsgaard, M., N. Prado, E.J. Adams, X.L. He, D.C. Chow, D.B. Wilson, K.C. Garcia, and M.M. Davis. 2003. Evidence that structural rearrangements and/or flexibility during TCR binding can contribute to T cell activation. Mol. Cell. 12:1367–1378. [DOI] [PubMed] [Google Scholar]
- 26.Bankovich, A.J., and K.C. Garcia. 2003. Not just any T cell receptor will do. Immunity. 18:7–11. [DOI] [PubMed] [Google Scholar]
- 27.McKeithan, T.W. 1995. Kinetic proofreading in T-cell receptor signal transduction. Proc. Natl. Acad. Sci. USA. 92:5042–5046. [DOI] [PMC free article] [PubMed] [Google Scholar]
- 28.Rabinowitz, J.D., C. Beeson, D.S. Lyons, M.M. Davis, and H.M. McConnell. 1996. Kinetic discrimination in T-cell activation. Proc. Natl. Acad. Sci. USA. 93:1401–1405. [DOI] [PMC free article] [PubMed] [Google Scholar]
- 29.Alarcon, B., S.C. Ley, F. Sanchez-Madrid, R.S. Blumberg, S.T. Ju, M. Fresno, and C. Terhorst. 1991. The CD3-gamma and CD3-delta subunits of the T cell antigen receptor can be expressed within distinct functional TCR/CD3 complexes. EMBO J. 10:903–912. [DOI] [PMC free article] [PubMed] [Google Scholar]
- 30.Stotz, S.H., L. Bolliger, F.R. Carbone, and E. Palmer. 1999. T cell receptor (TCR) antagonism without a negative signal: evidence from T cell hybridomas expressing two independent TCRs. J. Exp. Med. 189:253–264. [DOI] [PMC free article] [PubMed] [Google Scholar]


