

Abstract
Stapes vibrations were measured in deeply anesthetized adult and neonatal (ages: 14 to 20 days) Mongolian gerbils. In adult gerbils, the velocity magnitude of stapes responses to tones was approximately constant over the entire frequency range of measurements, 1 to 40 kHz. Response phases referred to pressure near the tympanic membrane varied approximately linearly as a function of increasing stimulus frequency, with a slope corresponding to a group delay of 30 μs. In neonatal gerbils, the sensitivity of stapes responses to tones was lower than in adults, especially at mid-frequencies (e.g., by about 15 dB at 10–20 kHz in gerbils aged 14 days). The input impedance of the adult gerbil cochlea, calculated from stapes vibrations and published measurements of pressure in scala vestibuli near the oval window [E. Olson, J. Acoust. Soc. Am. 103, 3445–3463 (1998)], is principally dissipative at frequencies lower than 10 kHz.
Conclusions
(a) middle-ear vibrations in adult gerbils do not limit the input to the cochlea up to at least 40 kHz, i.e., within 0.5 oct of the high-frequency cutoff of the behavioral audiogram; and (b) the results in both adult and neonatal gerbils are inconsistent with the hypothesis that mass reactance controls high-frequency ossicular vibrations and support the idea that the middle ear functions as a transmission line.
I. INTRODUCTION
The Mongolian gerbil is widely used as a model for studying the mammalian auditory system, including its development and aging. Therefore, it would be useful to understand the role of the middle ear in shaping the input to the cochlea in both adults and neonates of this species. However, the few studies that have measured ossicular vibrations in the middle ear of gerbils have often yielded inconsistent findings. For example: one study reported that the magnitude of stapes velocity in adult gerbils decayed at a rate of 6 dB/oct at frequencies higher than 1 kHz (Rosowski et al., 1999), another found a relatively sharp peak of umbo sensitivity at about 4 kHz (Cohen et al., 1993) and two others reported that the magnitude of ossicular velocity was relatively flat up to frequencies as high as 46 kHz (Olson and Cooper, 2000; Xue et al., 1995). Similarly, one investigation in neonatal gerbils concluded that middle ear transmission improves by 25 dB between ages 14 and 16 days after birth (DAB) (Woolf and Ryan, 1988) while another reported that umbo vibrations for stimuli higher than 4 kHz did not change between 15 and 42 DAB (Cohen et al., 1993).
In an effort to resolve the aforementioned discrepancies and to complement ongoing studies of basilar-membrane mechanics and its development at the hook region of the cochlea (Overstreet and Ruggero, 1998, 1999), the magnitude and phase characteristics of stapes vibrations were measured in adult and neonatal gerbils. Results in adults indicate that, contrary to an often-stated hypothesis, the inertial reactance of the middle ear does not restrict the input to the cochlea at least up to 40 kHz, i.e., a frequency within 0.5 oct of the cutoff of the gerbil behavioral audiogram. Results from neonates imply that middle-ear transmission improves considerably after 14 days of age, a period when the mass of the middle-ear ossicles increases substantially (Cohen et al., 1992). The simultaneity of these developmental changes also clashes with the idea that ossicular vibrations are mass controlled at high frequencies. The ossicular vibration data in both neonatal and adult gerbils are consistent with the hypothesis that the mammalian middle ear functions as a transmission line (Olson and Cooper, 2000; Onchi, 1949, 1961; Puria and Allen, 1998; Wilson and Bruns, 1983; Zwislocki, 1962).
II. METHODS
A. Animal preparation
All experiments were conducted in accordance with guidelines of Northwestern University’s Animal Care and Use Committee. Subjects were anesthetized adult and neonate Mongolian gerbils (Meriones unguiculatus). Breeding pairs were obtained from Tumblebrook Farms and a colony was developed. The ages of adult gerbils were between 90 and 160 DAB. Neonate gerbils were 14, 16, 18, and 20 day DAB (determined with a precision of ±8 h), day zero being the day of birth. To help insure equal maturation rates, all litters were culled to six pups and only neonates weighing within one standard deviation of the norm for a given age (Woolf and Ryan, 1985) were used. The norm is that the weights of the gerbils in grams roughly equal their age at least up to ~30 DAB (e.g., 14-DAB gerbils weigh about 14 g).
After sedation with a 0.01-ml subcutaneous injection of ketamine HC1 (100 mg/ml), gerbils were anesthetized with an initial intraperitoneal injection of sodium pentobarbital (48 mg/kg), later supplemented as needed to maintain deep anesthesia. During the course of the experiment the animals were kept hydrated by 0.10-cc intraperitoneal injections of Pedialyte (Abbott; each liter of this solution contains 45 mEq Na, 20 mEq K, 35 mEq Cl, 30 mEq citrate and 25 g dextrose), administered at ~90-min intervals. The gerbils were placed upon a vibration-isolation table (Technical Manufacturing Corporation, model No. 63–561) within a sound-insulated chamber (Industrial Acoustics Company). Rectal temperature was monitored and maintained at 39 °C by means of a servo-controlled battery-powered electrical heating pad wrapped around the animal. All gerbils were tracheotomized to maintain a patent airway but only animals older than 18 DAB were intubated. Intubation was not performed in younger animals because it was difficult to keep the requisite small-diameter trachea tubes free of fluid in the face of strong capillary forces. Instead, a clear air passage was maintained in neonates by lining the surgical opening to the trachea with cotton wicks.
The gerbil’s head was firmly affixed to a custom-made holder which was heated to maintain normal cochlear temperature, counteracting the effects of deep anesthesia and the widely opened bulla (Brown et al., 1983; Shore and Nuttall, 1985). The left pinna was removed to allow the insertion into the ear canal of a speculum containing the probe tube of a Knowles EK3103 miniature microphone. After opening the ventral aspect of the bulla, a ball silver-wire electrode was placed on the bone near the round window to record compound action potentials (CAPs) evoked by tone pips. The CAP thresholds as a function of stimulus frequency served as an “audiogram” to assess cochlear sensitivity, which often decreased with the passage of time. However, acute changes in cochlear sensitivity were not due to changes in stapes-vibration sensitivity, which was robust and remained nearly constant even post-mortem.
B. Sound system and its calibration
Acoustic stimuli were generated via a modified Radio Shack tweeter (Chan et al., 1993) coupled to the ear speculum. The tweeter was driven with electrical sinusoids (1–40 kHz) digitally synthesized with a Tucker-Davis system under computer control. The sensitivity and phases of stapes vibrations in each gerbil ear were referenced to pressure in the ear canal using a “hybrid calibration” combining an “in situ probe-tube calibration” measured in that ear with an average “artificial-cavity calibration.” The in situ calibrations (thin solid lines in Fig. 1) were obtained with a miniature microphone fitted with a thin, small-diameter probe tube, whose tip was placed was placed within 2.5 mm of the tympanic membrane. The probe microphone had been previously calibrated against a 1/8-in. Brüel & Kjaer microphone in a closed artificial cavity simulating the external ear canal of the gerbil. The “artificial-cavity” calibration was an average of three separate measurements.
FIG. 1.
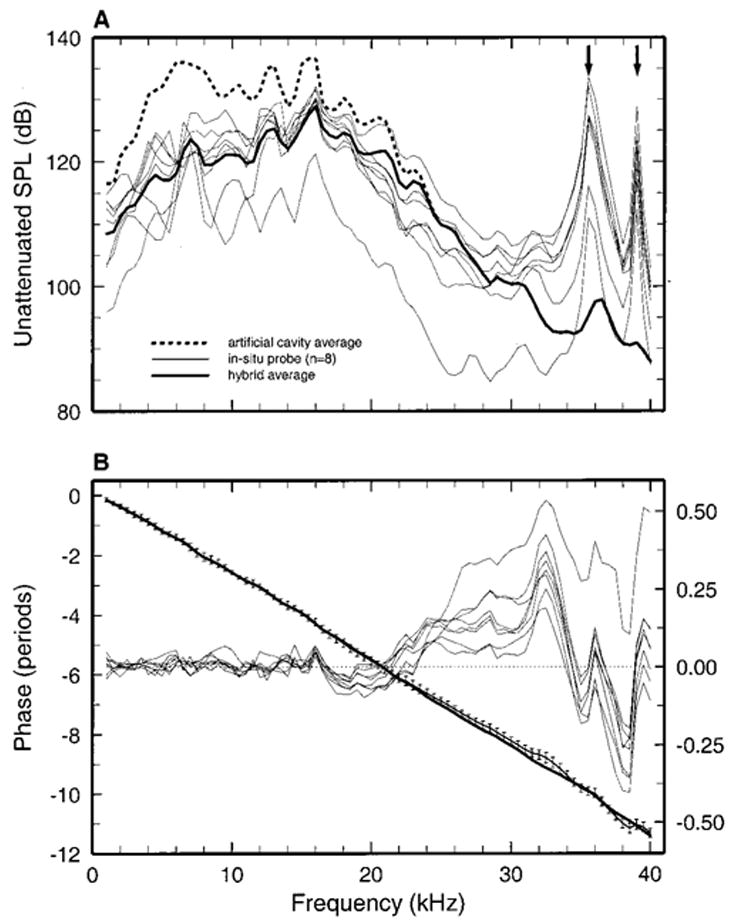
Stimulus calibration. (a) The SPL produced by a constant and un-attenuated voltage input to the earphone. The thin solid lines indicate in situ probe calibrations in the external ear canals of eight adult gerbils. The thick dashed line represents measurements in a small artificial cavity using a 1/8-in. condenser microphone. The thick solid line is the average of eight hybrid magnitude calibrations (see Sec. II), which were identical to the in situ calibrations at frequencies <16.5 kHz and identical to the artificial-cavity calibration (dashed line) at frequencies >25 kHz. (b) Vibration phases expressed relative to the voltage input to the tweeter. The standard deviations of the mean in situ calibration are indicated by brackets. The thick solid line is the average of the eight hybrid phase calibrations (see Sec. II). The thin solid lines indicate the phase differences between the in situ calibration and the hybrid calibrations in eight ears.
At stimulus frequencies 16.5 kHz and lower, the magnitudes of the hybrid pressure calibrations were identical to those measured in situ; at frequencies higher than 25 kHz, they were identical to the magnitudes in the average artificial-cavity calibration; between 16.5 kHz and 25 kHz, the magnitudes were weighted averages of the in situ and artificial-cavity calibrations, with the weight of the latter increasing smoothly from nil at 16.5 kHz to 100% at 25 kHz. [The use of artificial-cavity calibrations in auditory investigations involving high-frequency stimuli was recently advocated by Pearce et al. 2001.] The phases of the hybrid calibration were obtained by adding pure delays of 162–165 μs to “minimum” phases computed (using the function RCEPS.M of MATLAB) from the magnitudes of the hybrid calibration, supplemented with a low-frequency terminal slope of 0 to +6 dB/oct, a slope of −6 dB/oct between 40 and 51 kHz, and a terminal high-frequency slope of −1000 dB/oct.
Figure 1 shows the magnitudes [panel (a)] and phases [panel (b)] of in situ probe-tube calibrations measured in eight gerbil ears (thin solid lines), the average artificial-cavity calibration (dashed lines), and the average of eight hybrid calibrations (thick solid lines). The latter served as references for the stapes vibration data in adults (Fig. 2). All in situ calibrations contained sharp magnitude peaks at the same frequencies [arrows in Fig. 1, panel (a)], probably because the probe tip was routinely placed in approximately the same location in each ear. As shown by panel (b), the phase differences between the in situ and hybrid calibrations were small at frequencies <16 kHz.
FIG. 2.
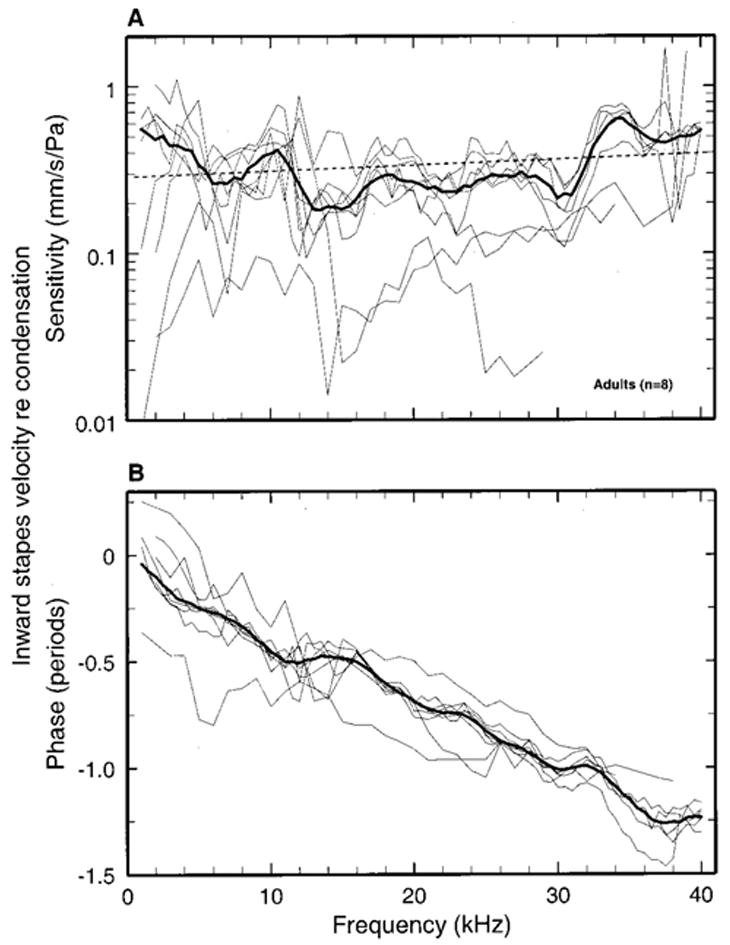
Stapes velocity response to tones in adult gerbils. The magnitude [panel (a)] and phases [panel (b)] of stapes velocity sensitivity (mm/s/Pa) are plotted as a function of frequency for eight gerbils (thin lines). Central tendencies are indicated by medians (thick lines), which have been subjected to three-point smoothing to reduce jaggedness caused by unequal numbers of samples averaged at odd and even multiples of 500 Hz.
C. Stimulus protocol
CAP thresholds were measured using an automated procedure which, for each stimulus frequency, determined the sound pressure level (SPL, expressed in decibels referenced to 20 μPa) required to achieve a predetermined CAP magnitude (typically, 7 μV). Stimuli were 5-ms tone pips with onset phases randomized to cancel out cochlear microphonics and ramped with a 0.75 ms rise/fall time to efficiently synchronize the neural spikes without losing frequency resolution due to spectral spread.
Stimuli for the measurement of stapes vibrations were 5-ms tones presented every 50 ms with rise/fall times of 0.75 ms. Stapes velocity responses to 256–4096 stimulus repetitions were time averaged for each stimulus condition, depending upon the signal-to-noise ratio. Only averaged responses greater than 6 dB above the average noise floor were used.
D. Laser-velocimetry data collection and analysis
Stapes velocity was determined by means of a Dantec laser vibrometer consisting of a 20-mW He–Ne laser, a headstage, and a Doppler-frequency tracker (Ruggero and Rich, 1991). The laser light was targeted on a reflective glass microbead via an Olympus compound microscope equipped with a 20× ultra-long working-distance objective (Mitutoyo 20SL, N.A. 0.42). The bead (diameter: 20–30 μm) was placed on the head of the stapes near the incudo-stapedial joint. The angle between the laser beam and the axis of stapes vibration was less than 30 degrees. The electrical output signal of the vibrometer headstage was converted into a voltage proportional to target velocity by the Doppler-frequency tracker, whose output was digitized (16-bit resolution, sampling rate of 166 kHz) and stored on magnetic media in a computer. MATLAB programs were used to compute the discrete Fourier transforms of the time-averaged response waveforms. The velocity-response magnitudes and phases were imported into a spreadsheet (EXCEL) for further processing.
III. RESULTS
A. Specifying the pressure input to the middle ear
Specification of the acoustic stimulus at high frequencies is difficult because malleus vibrations result from a weighted spatial average of the local pressures and acoustic loads distributed across the surface of the tympanic membrane (Stinson and Khanna, 1989); “…above about 10 kHz… it is not possible to define the acoustical input to the ear from sound pressure level measured at any single location” (Khanna and Stinson, 1985) (see also Stinson, 1985; Stinson and Shaw, 1982). Indeed, we found that referencing stapes vibrations to pressure calibrations measured in situ with a probe-tube introduced conspicuous valleys and peaks in velocity magnitude versus frequency curves at frequencies higher than 30 kHz, which closely mirrored the peaks and valleys, respectively, of the in situ calibrations [arrows in Fig. 1, panel (a)]. Since these irregularities (absent when vibrations were referenced to the constant voltage input to the earphone) appeared to be local and largely spurious features without counterpart in the effective pressure driving ossicular vibrations, stapes vibrations in the present study are referenced to hybrid pressure calibrations combining individual in situ calibrations (for frequencies <16 kHz) with a single average calibration measured in an artificial cavity (for frequencies >25 kHz) (see Sec. II).
B. Stapes vibrations in adult gerbils
Figure 2 shows the magnitudes and phases of stapes responses to tones measured in eight adult gerbils. Individual measurements (thin lines) and population medians (thick lines) are plotted as a function of stimulus frequency, with a resolution of 500 or 1000 Hz. Panel (a) of Fig. 2 shows that, to a first approximation, sensitivity did not vary systematically as a function of frequency, with a mean magnitude of 0.34 mm/s/Pa in the 1–40 kHz range. [A straight-line fit to the median data points expressed in logarithmic coordinates (not shown) had a slope of +0.52 dB/oct.] The range of response magnitudes across ears was wide but, overall, variability was moderate, with interquartile ranges [brackets in Fig. 5, panel (a)] rarely exceeding 4 dB.
FIG. 5.

Stapes velocity responses to tones in adult and neonatal gerbils. The median sensitivity magnitudes [panel (a)] and phases [panel (b)] of stapes velocity (from Figs. 2–4) are plotted as a function of frequency for adult gerbils as well as neonates aged 14, 16, 18, and 20 days. The curves for 14-DAB gerbils have been truncated at 26 kHz because stapes responses could be measured in only two animals. Interquartile ranges are indicated on the curves for adults (up brackets).
Panel (b) of Fig. 2 plots the phases of the velocity responses in the inward direction, referenced to condensation in the external ear canal near the tympanic membrane, as a function of stimulus frequency. At 1 kHz, stapes vibrations were nearly in phase with condensation, on average. At higher frequencies there was a steady, approximately linear, phase roll-off, so that stapes vibration lagged condensation by about 1.2 periods at 40 kHz. The median phase lags (thick line) were clustered around a straight line (not shown) with slope equivalent to a delay of 30 μs (95% confidence limits: 31.1 and 29.3 μs).
C. Stapes vibrations in neonate gerbils
Figures 3 and 4 show individual data and population medians for the magnitudes and phases, respectively, of stapes responses to tones measured in neonatal gerbils, grouped according to age (14, 16, 18, or 20 DAB). Stapes vibrations in 14-DAB gerbils were very variable and insensitive and could rarely be measured at frequencies higher than 26 kHz. Response variability became progressively smaller as a function of increasing age. This is especially evident in the phases of Fig. 4. Interquartile ranges in neonates 18–20 DAB (not shown) were comparable to those for adults (brackets in Fig. 5).
FIG. 3.
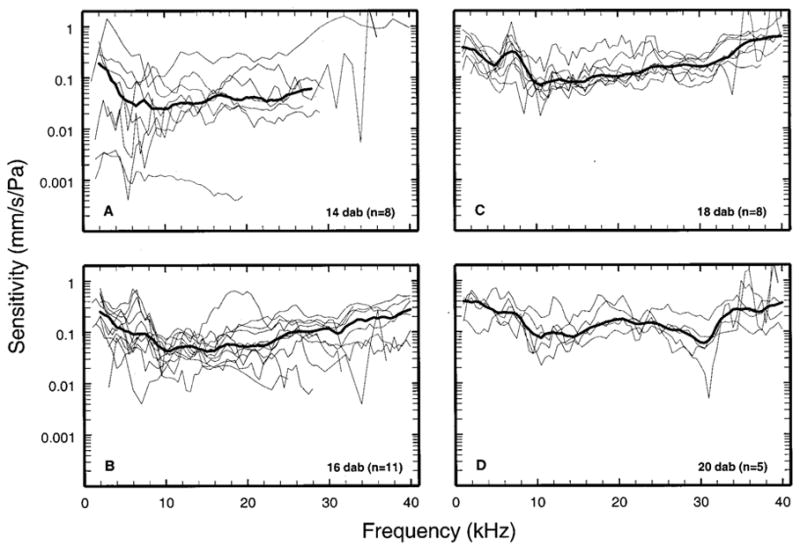
The magnitude sensitivity of stapes responses to tones in neonatal gerbils. Each panel depicts responses from individual ears (thin lines) and population medians (thick lines). The median curves have been subjected to three-point smoothing to reduce jaggedness caused by unequal numbers of samples averaged at odd and even multiples of 500 Hz.
FIG. 4.
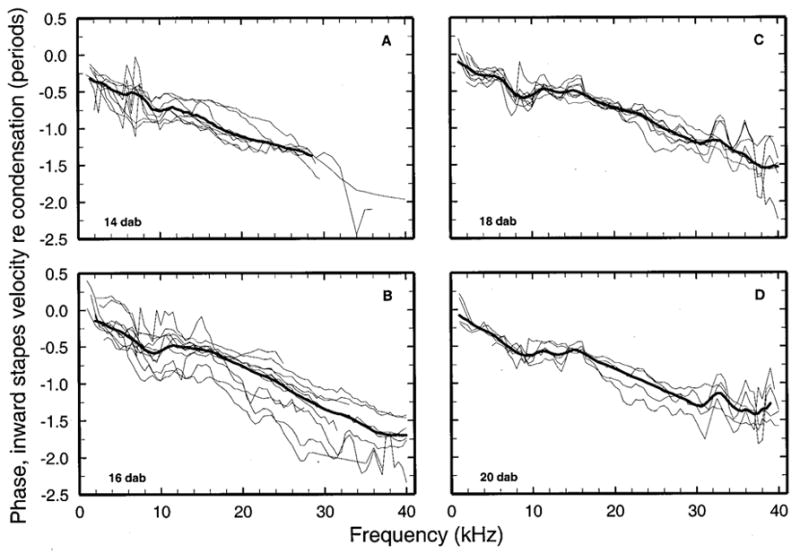
The phases of stapes responses to tones in neonatal gerbils. The phases of peak inward velocity of the stapes footplate are expressed relative to peak condensation in the external ear canal, near the eardrum. Each panel depicts responses from individual ears (thin lines) and population medians (thick lines). The median curves have been subjected to three-point smoothing to reduce jaggedness caused by unequal numbers of samples averaged at odd and even multiples of 500 Hz.
Figure 5 allows for comparison of the magnitude [panel (a)] and phases [panel (b)] of stapes vibrations as a function of age. Response magnitudes were larger in 16-DAB gerbils than in 14-DAB gerbils and still larger in 18- and 20-DAB gerbils. In gerbils aged 18 and 20 DAB, magnitudes approached adult values near 1 and 40 kHz but were less sensitive than in adults at 10–20 kHz. In that frequency range, adult sensitivity was some 12–20 dB larger than in neonates aged 14 or 16 days. Responses in neonates aged 14 days lagged adult responses at all frequencies. Response phases in neonates aged 16–20 days were similar to those of adults near 1 kHz but increasingly diverged at higher frequencies, with average slopes corresponding to group delays of 43, 35, and 32 μs for gerbils aged 16, 18, and 20 days, respectively (versus 30 μs for adults).
D. The input impedance of the adult gerbil cochlea
Using the data on stapes vibration in adult gerbils (Fig. 2) in conjunction with measurements of pressure in the perilymph of scala vestibuli (SV) near the oval window (Olson, 1998) and of the area of the stapes footplate [0.8 mm2 (Cohen et al., 1992)], we estimated the acoustic input impedance of the cochlea [SV pressure re: stapes volume velocity (Zwislocki, 1962)]. The magnitudes of the cochlear input impedance for the adult gerbil are shown in panel (a) of Fig. 6 as a function of stimulus frequency (open circles). In spite of irregularities, which probably reflect measurement errors in one or two laboratories (our own and Olson’s), the input impedance is relatively invariant over a wide frequency range, amounting to 1.3 × 10⁶ dyne.s.cm−5 (i.e., 1.3 cgs acoustic megohms or 130 MKS acoustic gigohms), on average.
FIG. 6.
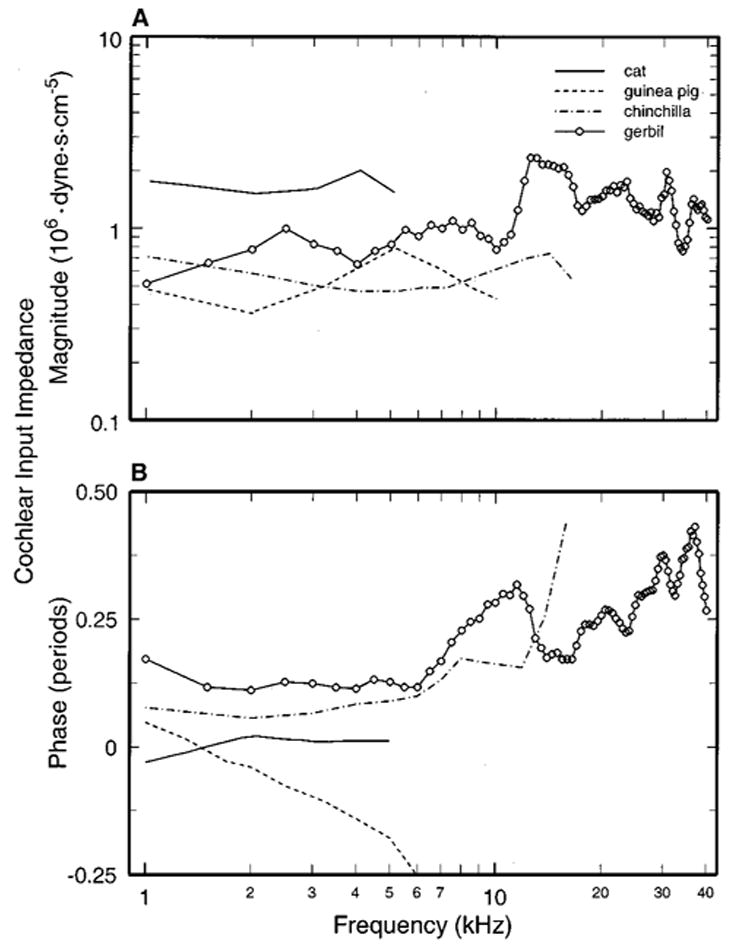
The acoustic input impedance of the cochlea in gerbil and other species. The input impedance of the adult gerbil cochlea (open circles) was calculated using the present (point) measurements of stapes velocity, the area of the stapes footplate (Cohen et al., 1992) and pressure in scala vestibuli (Fig. 6 of Olson, 1998). For comparison, the magnitude and phases of cochlear impedance are also shown for cat (Lynch et al., 1982), chinchilla (Ruggero et al., 1990), and guinea pig. For guinea pig, magnitudes are from (Dancer and Franke, 1980) and phases from (Rosowski, 1994), calculated from stapes velocity data of (Nuttall, 1974) and SV pressure of (Décory, 1989).
Panel (a) of Fig. 6 also shows the magnitude of the cochlear input impedance for cat (Lynch et al., 1982), guinea pig (Dancer and Franke, 1980), and chinchilla (Ruggero et al., 1990). For guinea pig, input impedance magnitude was computed from averages of SV pressure (Dancer and Franke, 1980), stapes velocity (Dancer et al., 1980), and stapes footplate area (Fernández, 1952) measured in different groups of subjects. For chinchilla, impedance magnitude was also computed using data from different subjects: stapes velocity (Ruggero et al., 1990), SV pressure (Décory et al., 1990), and stapes footplate area (Vrettakos et al., 1988). For cat the estimate of impedance is presumably more reliable than for the other three species because it was derived from measurements of stapes vibration and SV pressure in the same individual ears (Lynch et al., 1982). Nevertheless, the magnitude data for all four species are similar in showing relative independence from stimulus frequency, suggesting that cochlear input impedance is resistive. However, in a system with pure resistive impedance, impedance phases should be zero, whereas panel (b) of Fig. 6 shows that the impedance phases for the adult gerbil are about +45 degrees between 1 and 7 kHz and reach +135 degrees at the highest frequencies.
IV. DISCUSSION
A. Comparison of the present measurements of stapes vibrations with other ossicular-vibration data for adult gerbils
Figure 7 brings together all published measurements of the responses to tones of the stapes or malleus in adult gerbils. Panel (a) of Fig. 7 shows the response magnitudes, expressed as velocity amplitude divided by stimulus pressure, as a function of frequency. The present measurements of stapes vibration in gerbil (thick continuous lines) and those of Rosowski et al. [open circles (Rosowski et al., 1999)] are similar in magnitude at 1 kHz but at higher frequencies they diverge rapidly. The magnitudes described by Rosowski et al. decayed at a rate of about 6 dB/oct between 1 and 10 kHz, whereas in the present study and another documented in an abstract (Olson and Cooper, 2000) the stapes velocity magnitudes were roughly flat in the frequency ranges 1–40 kHz and 8–40 kHz, respectively.
FIG. 7.
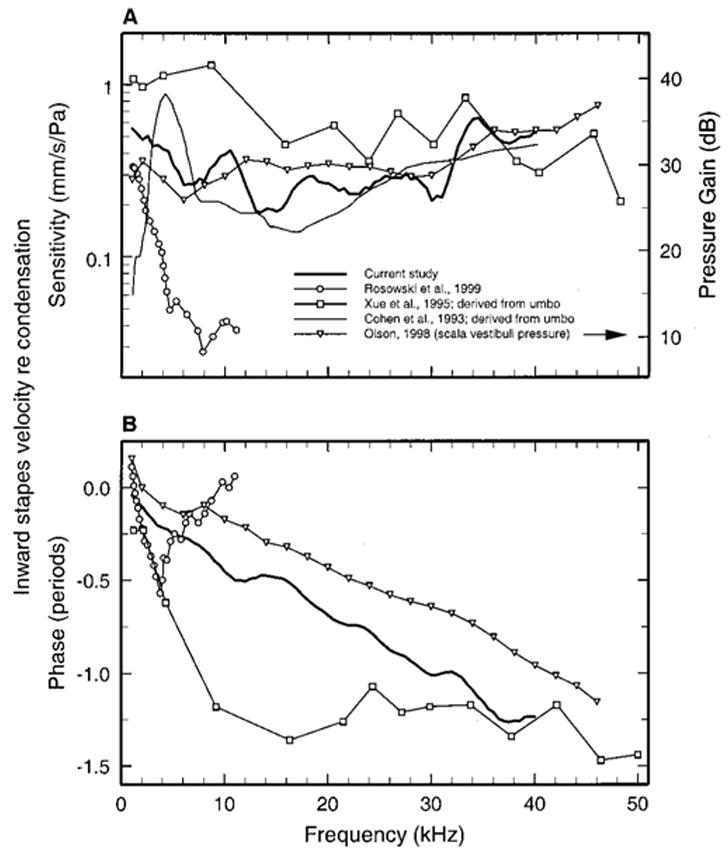
Comparison of gerbil middle-ear responses to sound measured in several studies. A: sensitivity (re: stimulus pressure) of stapes velocity [present study and Rosowski et al. (1999)], umbo velocity (Cohen et al., 1993; Xue et al., 1995), and scala vestibuli pressure plotted as a function of frequency (Olson, 1998). The magnitude of the umbo data has been reduced according to the ossicular anatomical lever ratio, 3.5 (Rosowski et al., 1999), to make it (approximately) commensurate with the stapes data. The scala vestibuli (SV) pressure gain (re: stimulus pressure) is indicated in the right ordinate (Olson, 1998). (b) Phases re: stimulus pressure of SV pressure (Olson, 1998), umbo velocity (Xue et al., 1995), and stapes velocity [current study and Rosowski et al. (1999)].
Figure 7 also depicts curves for recordings from the tympanic-membrane umbo, near the tip of the malleus (Cohen et al., 1993; Xue et al., 1995). In order to make the malleus magnitude data approximately comparable with stapes data, the former have been divided by a factor, 3.5, corresponding to the anatomical lever ratio of the gerbil middle ear (Rosowski et al., 1999), on the assumption that this lever ratio translates into a constant reduction of velocity amplitude. Admittedly, this assumption probably does not hold at high frequencies (Rosowski et al., 1999; Ruggero et al., 1990). These derived stapes-vibration magnitudes differ from the present results in several respects but concur with them in indicating that transmission in the middle ear of adult gerbils does not decay substantially at high frequencies, at least up to 40–48 kHz, i.e., within 0.5 oct of the upper range of hearing in this species [57 kHz (Fay, 1988)].
Panel (b) of Fig. 7 gathers together all published response phases for stapes and malleus measured in the middle ears of adult gerbils. The present phases differ substantially in many respects from the stapes data of Rosowski et al. 1999 and the malleus data of Xue et al. 1995 but are consistent with stapes responses (not shown) reported in an abstract (Olson and Cooper, 2000).
The present results corroborate the results of some previous studies of the gerbil middle ear but not others: (a) with but one exception (Rosowski et al., 1999), studies of ossicular response magnitudes in gerbil show that they do not decay substantially as a function of increasing frequency up to at least 40 kHz; (b) the present study and another (Olson and Cooper, 2000) [in contrast with those of Rosowski et al. 1999 and Xue et al. 1995] found phase lags that increase more or less linearly with frequency. We do not know why there are large discrepancies among the results of several comparable investigations but we surmise that calibration errors played an important role in all studies, including the present one.1
B. Does mass reactance control middle-ear transmission of high-frequency signals?
Nearly three decades ago, Johnstone and Sellick (Johnstone and Sellick, 1972) marshalled convincing evidence against the then prevailing view (e.g., Dallos, 1973; Møller, 1963, 1965; Mundie, 1963; Zwislocki, 1962, 1963) that mass is the principal determinant of ossicular vibrations at high frequencies (see also Manley and Johnstone, 1974). Nevertheless, several subsequent discussions of middle-ear function have reiterated the mass-reactance hypothesis (e.g., Doan et al., 1996; Hemilä et al., 1995, 2001; Nummela, 1997; Relkin, 1988; Relkin and Saunders, 1980; Shaw, 1981). We argue here that this hypothesis is not supported by the newer middle-ear data (see also Rosowski, 1994).
If inertial reactance were the dominant factor limiting the high-frequency performance of the middle ear, ossicular vibrations should exhibit high-frequency velocity magnitudes with a slope of −6 dB/oct in the case of a first-order resonant system (Dallos, 1973). To investigate this question we constructed Table I, which shows that masslike behavior is not found in five of the six species in which ossicular responses have been measured at frequencies within 1 oct of the 60-dB high-frequency cutoffs of the behavioral audiograms. The one exception is a study of human temporal bones (Aibara et al., 2001), which found a high-frequency slope of −7 dB.
TABLE I.
High-frequency slopes of magnitude-vs-frequency curves for ossicular responses to tones measured at frequencies approaching within one octave the 60-dB cut-off of audiometric thresholds. Roll-off slopes of the magnitude of ossicular vibration velocity at high frequencies compared to the limits of high-frequency hearing, i.e., frequency cutoff for 60-dB thresholds [from Hemilä et al. 1995, after Fay (1988), except for the hamster taken from Heffner et al. 2001].
| Species | 60-dB cutoff of high-frequency hearing (kHz) | Ossicle | Frequency range for estimation of magnitude slope (kHz) | Slope of velocity-magnitude roll-off (dB/oct) | Phase lagre:condensation at highest frequency tested (degrees) | Reference for slopes |
|---|---|---|---|---|---|---|
| Mongolian gerbil | 57 | stapes | 1–40 | ~0 | ~430 | present work |
| stapes | 8–40 | ~0 | not available | Olson and Cooper (2000) | ||
| malleus | 30–40 | ~0 | not measured | Cohen et al. 1993 | ||
| malleus | 30–40 | ~0 | ~500 | Xue et al. 1995 | ||
| Cat | 78 | malleus | 1–50 | −2.7 | not measured | Cooper and Rhode (1992) |
| Guinea pig | 49 | malleus (free field) | 25–50 | −24 to −34 | >470a | Manley and Johnstone (1974) |
| incus | 20–50 | −14 | not measured | Wison and Johnstone (1975) | ||
| stapes | 0.4 –30 | −1 | not measured | Johnstone and Taylor (1971) | ||
| stapes, incus | 1–50 | −2.2 | not measured | Cooper and Rhode (1992) | ||
| Hamster | 46.5 | malleus (free field) | 10–35 | −1.8 | not measured | Relkin and Saunders (1980) |
| Human | 19 | stapes | 1–10 | −7 | ~270 | Aibara et al. 2001 |
| Rat | 78 | malleus (free field) | 20–40 | −9.7 | not measured | Doan et al. 1996 |
Manley and Johnstone measured a 470-degree phase lag of the tip of the incus relative to the tip of the malleus at about 50 kHz (Manley and Johnstone, 1974); the phase lag of the incus with reference to pressure should be larger.
If inertial reactance were the dominant factor limiting the high-frequency performance of the middle ear, ossicular velocity should exhibit a high-frequency phase plateau of −90 degrees, again for the case of a first-order system (Dallos, 1973). Such a plateau appeared consistent with the phase data of some early studies (e.g., Guinan and Peake, 1967) but the few more recent measurements of ossicular responses all indicate phase lags that accumulate well past −90 degrees and, most importantly, do not reach any obvious plateau (e.g., column 6 of Table I).
If mass controlled ossicular vibrations at high frequencies, the acoustic input impedance in the external ear canal near the tympanic membrane should be reactive at those frequencies. In fact, the input impedance of the middle ear is principally resistive except at low frequencies [e.g., in gerbil (Ravicz et al., 1992) and in cat (Lynch et al., 1994)]. Finally, it is noteworthy that loading the stapes (Johnstone and Taylor, 1971) or the tympanic membrane (Lynch, 1981) with additional masses causes only minimal changes in ossicular vibration.
To summarize, there is scant evidence favoring, and substantial evidence against, the hypothesis that the high-frequency responses of middle-ear ossicles are determined by mass reactance.
C. Does middle-ear transmission limit the upper frequency range of hearing?
It is often stated that high-frequency hearing is limited by the vibrations of the middle ear (Dallos, 1973; Hemilä et al., 1995, 2001; Møller, 1963; Nummela, 1997; Zwislocki, 1975). One way to test this hypothesis is to ascertain whether middle-ear transmission exhibits a steep terminal slope at a frequency matching that of the cut-off of the behavioral audiogram in the same species [Table I, second column, from Fay (1988) and Heffner et al. 2001]. As Table I indicates, measurements adequate to answer this question exist only for guinea pig. For this species, good matches between ossicular and behavioral high-frequency cutoffs has been observed in two studies (Manley and Johnstone, 1974; Wilson and Johnstone, 1975) but not in another (Cooper and Rhode, 1992). Thus, the resolution of this issue must await further measurements at frequencies bracketing those of the cutoffs of the behavioral audiograms.
D. The middle ear as a transmission line
The literature contains several proposals, both implicit and explicit, that the middle ear should be modeled as a transmission line, with distributed mass and stiffness (Olson and Cooper, 2000; Onchi, 1949, 1961; Puria and Allen, 1998; Wilson and Bruns, 1983; Zwislocki, 1962; see also Rabbitt, 1990), rather than as a lumped-parameter system. “In an ideal transmission line, terminated by the correct source and load impedance, a signal is transmitted without loss even at high frequencies, but with a delay” (Wilson and Bruns, 1983). The magnitudes and phases of the present stapes-vibration data and of the pressure data of Olson (1998) are consistent with the middle-ear model proposed by Puria and Allen (1998), which incorporates the transmission-line hypothesis. Especially striking are the nearly linear increases of phase lag of stapes vibration [Fig. 2, panel (b)] and scala vestibuli pressure [Fig. 7, panel (b)] as a function of increasing stimulus frequency, equivalent to group delays of 30 and 25 μs, respectively. Although linear increases of phase lag were not previously noticed in reports of ossicular vibrations, they can be gleaned in published data. For example, a delay of 36 μs can be computed from the phase lags of malleus vibration in cat (Decraemer et al., 1990) which (probably not coincidentally) is identical to the delay derived by Puria and Allen (1998) from their own measurements of input impedance in the cat middle ear using a transmission-line model of the tympanic membrane. Similarly, a delay of ~70 μs between 3 and 22 kHz may be computed from published phase lags of stapes vibration in chinchilla (Ruggero et al., 1990).
E. Middle-ear transmission in neonatal gerbils
Middle-ear transmission in gerbils increases during the third postnatal week but is not fully mature by 20 days after birth. At 14 days after birth, stapes responses were less sensitive than in adults, e.g., by about 15 dB in the range 10 to 20 kHz (Fig. 5). Stapes responses grew larger with age but appeared to remain somewhat immature at 20 days after birth. No other stapes-vibration data for neonatal gerbils are available for comparison with the present measurements.
For stimuli 4–40 kHz, no significant sensitivity changes were found in umbo vibration in neonatal gerbils (Cohen et al., 1993). At face value, these results indicate that the sound collection apparatus at the tympanic membrane of the gerbil is relatively mature at an early age, antedating the full development of signal transmission via the incus and stapes.
One study estimated the development of middle-ear function in gerbils by comparing the sensitivity of cochlear microphonics under normal acoustic stimulation and with the stapes artificially driven by a piezoelectric device (Woolf and Ryan, 1988). That study’s conclusions—that middle-ear transmission improves by some 25 dB between 14 and 16 DAB and that its maturation is essentially complete by 18 DAB—contrasts both with the present stapes data and with the umbo data of Cohen et al. 1993.
F. Middle-ear transmission in neonatal hamsters, mice, and rats
Stapes vibrations have not been measured in neonates of any mammalian species other than the gerbil but results reminiscent of the present findings were obtained from the umbo of the tympanic membrane in golden hamsters (Mesocricetus auratus), mice, and rats. In golden hamsters, umbo vibrations of 20 and 25 kHz increase by 10 dB between 16 and 20 DAB and remain 10 dB less sensitive than in adults at 20 DAB (Relkin and Saunders, 1980). Between ages 10 and 60 DAB, the sensitivity of umbo responses to 32- or 34-kHz tones grow by 8 dB in mice (Doan et al., 1994) and 15 dB in rats (Doan et al., 1996).
G. Interpretation of the development of middle-ear transmission
Anatomical development data, which might help to explain our physiological findings of the maturing gerbil middle ear, are still meager. In the gerbil, the middle-ear ossicles are well ossified by 16 DAB (Finck et al., 1972) and the area, depth, and appearance of the tympanic membrane reach mature values at 22–25 DAB, with most changes being completed by 20 DAB (Cohen et al., 1992). Somewhat paradoxically, however, there is a large increase in ossicular mass between 16 and 42 DAB (Cohen et al., 1992). [Bulla volume also increases significantly beyond 20 DAB and therefore may partly account for some of the data of Cohen et al. 1993, which were obtained with a closed bulla, but this change should not have influenced other measurements of stapes vibrations, such as our own, obtained with the bulla widely opened.] In neonatal rats the improvement of middle-ear sensitivity (Doan et al., 1996) is also positively correlated with the growth in ossicular mass (the malleus and incus reach mature values of mass at 34 and 26 days) (Zimmer et al., 1994).
On first consideration, it seems difficult to understand how an increase in ossicular mass could improve middle-ear transmission [since, by itself, inertial reactance should reduce transmission in proportion to the square of the stimulus frequency (Hemilä et al., 1995)]. Two possibilities come to mind to resolve the apparent paradox. One is that the increase of ossicular mass with age has only minimal consequences on the ossicular moment of inertia, which is partly determined by the axis of rotation of the incudo-malleal complex. Another possibility is hinted at by the hypothesis that the tympanic membrane and the ossicular chain behave as a cascade of transmission lines (Puria and Allen, 1998; Wilson and Bruns, 1983). Taking this hypothesis as a point of departure, we speculate that in the adult gerbil middle ear the reactance of each shunt stiffness (at the malleus/incus and incus/stapes joints) is matched by the inertial reactance of each ossicle and that at the completion of ossification the ossicles of 16-DAB gerbils (Finck et al., 1972) are as stiff as they ever will be. We propose that the subsequent large increase in mass reactance cancels out the preexisting stiffness reactance, thus extending the bandwidth of middle-ear transmission to adult values.
H. Summing up
Textbook treatments of the mammalian middle ear typically start out by comparing its performance to that of an ideal impedance-matching transformer but qualify this analogy by stating that a band-pass filter such as a simple resonant system is a more realistic model. Such a model is partly justified by some recent measurements in the middle ears of gerbils (Rosowski et al., 1999) and humans (Aibara et al., 2001). However, other studies [e.g., the present report and Olson and Cooper (2000)] contradict the resonant-system analogy and provide renewed justification for viewing the mammalian middle ear as a wideband transformer, perhaps implemented as a transmission line. It remains to be seen whether one of these contrasting views of middle-ear transmission eventually proves correct for the gerbil and perhaps other species.
Acknowledgments
We thank Mary Ann Cheatham, Nigel Cooper, and one anonymous referee for their thorough reviews of previous versions of the manuscript, Andrei Temchin for much help with data processing and preparation of the final versions of the figures, and Jon Siegel for his assistance in the modification of the Radio Shack tweeter. We were supported by Grant No. R01-DC-00419 from the National Institute on Deafness and Other Communication Disorders (NIH).
Footnotes
The substance of this article was part of a doctoral dissertation by the first author and was presented at a meeting of the Association for Research in Otolaryngology.
Some of the results in the present article differ from the corresponding ones in the Ph.D. dissertation on which it is based (Overstreet, 2000); a different method for the pressure calibration has been adopted here and some computational errors in the dissertation have been corrected.
References
- Aibara R, Welsh JT, Puria S, Goode RL. Human middle-ear sound transfer function and cochlear input impedance. Hear Res. 2001;152:100–109. doi: 10.1016/s0378-5955(00)00240-9. [DOI] [PubMed] [Google Scholar]
- Brown MC, Smith DI, Nuttall AL. The temperature dependency of neural and hair cell responses evoked by high frequencies. J Acoust Soc Am. 1983;73:1662–1670. doi: 10.1121/1.389387. [DOI] [PubMed] [Google Scholar]
- Chan JC, Musicant AD, Hind JE. An insert earphone system for delivery of spectrally shaped signals for physiological studies. J Acoust Soc Am. 1993;93:1496–1501. doi: 10.1121/1.406807. [DOI] [PubMed] [Google Scholar]
- Cohen YE, Bacon CK, Saunders JC. Middle ear development. III: Morphometric changes in the conducting apparatus of the Mongolian gerbil. Hear Res. 1992;62:187–193. doi: 10.1016/0378-5955(92)90185-p. [DOI] [PubMed] [Google Scholar]
- Cohen YE, Doan DE, Rubin DM, Saunders JC. Middle-ear development. V: Development of umbo sensitivity in the gerbil. Am J Otolaryngol. 1993;14:191–198. doi: 10.1016/0196-0709(93)90029-7. [DOI] [PubMed] [Google Scholar]
- Cooper NP, Rhode WS. Basilar membrane mechanics in the hook region of cat and guinea-pig cochleae: sharp tuning and nonlinearity in the absence of baseline position shifts. Hear Res. 1992;63:163–190. doi: 10.1016/0378-5955(92)90083-y. [DOI] [PubMed] [Google Scholar]
- Dallos P. The Auditory Periphery—Biophysics and Physiology. Academic; New York: 1973. [Google Scholar]
- Dancer A, Franke R. Intracochlear sound pressure measurements in guinea pigs. Hear Res. 1980;2:191–205. doi: 10.1016/0378-5955(80)90057-x. [DOI] [PubMed] [Google Scholar]
- Dancer A, Franke R, Buck K, Smigielski P, Stimpfling A. Etude par interferometric laser des deplacements du tympan du cobaye sous l’action de sons purs et de bruits impulsifs. Acustica. 1980;46:178–188. [Google Scholar]
- Decraemer WF, Khanna SM, Funnell WR. Heterodyne interferometer measurements of the frequency response of the manubrium tip in cat. Hear Res. 1990;47:205–217. doi: 10.1016/0378-5955(90)90152-f. [DOI] [PubMed] [Google Scholar]
- Décory L. Origine des differences interspecifiques de susceptibilité an bruit. doctoral dissertation; Université de Bordeaux: 1989. [Google Scholar]
- Décory L, Franke RB, Dancer AL. Intracochlear pressure measurements in the cat, the chinchilla, and the guinea pig. In: Dallos P, Geisler CD, Matthews JW, Ruggero MA, Steele CR, editors. The Mechanics and Biophysics of Hearing. Springer-Verlag; Berlin: 1990. pp. 270–277. [Google Scholar]
- Doan DE, Cohen YE, Saunders JC. Middle-ear development. IV. Umbo motion in neonatal mice. J Comp Physiol [A] 1994;174:103–110. doi: 10.1007/BF00192011. [DOI] [PubMed] [Google Scholar]
- Doan DE, Igic PG, Saunders JC. Middle-ear development. VII: Umbo velocity in the neonatal rat. J Acoust Soc Am. 1996;99:1566–1572. doi: 10.1121/1.415235. [DOI] [PubMed] [Google Scholar]
- Fay RR. Hearing in Vertebrates: A Psychophysics Handbook. Hill-Fay; Winnetka, IL: 1988. [Google Scholar]
- Fernández C. Dimensions of the cochlea (guinea pig) J Acoust Soc Am. 1952;24:519–523. [Google Scholar]
- Finck A, Schneck CD, Hartman AF. Development of cochlear function in the neonate Mongolian gerbil (Meriones unguiculatus) J Comp Physiol Psychol. 1972;78:375–380. doi: 10.1037/h0032373. [DOI] [PubMed] [Google Scholar]
- Guinan JJ, Jr, Peake WT. Middle-ear characteristics of anesthetized cats. J Acoust Soc Am. 1967;41:1237–1261. doi: 10.1121/1.1910465. [DOI] [PubMed] [Google Scholar]
- Heffner RS, Koay G, Heffner HE. Audiograms of five species of rodents: implications for the evolution of hearing and the perception of pitch. Hear Res. 2001;157:138–152. doi: 10.1016/s0378-5955(01)00298-2. [DOI] [PubMed] [Google Scholar]
- Hemilä S, Nummela S, Reuter T. What middle ear parameters tell about impedance matching and high frequency hearing. Hear Res. 1995;85:31–44. doi: 10.1016/0378-5955(95)00031-x. [DOI] [PubMed] [Google Scholar]
- Hemilä S, Nummela S, Reuter T. Modeling whale audiograms: effects of bone mass on high-frequency hearing. Hear Res. 2001;151:221–226. doi: 10.1016/s0378-5955(00)00232-x. [DOI] [PubMed] [Google Scholar]
- Johnstone BM, Sellick PM. The peripheral auditory apparatus. Q Rev Biophys. 1972;5:1–57. doi: 10.1017/s0033583500000032. [DOI] [PubMed] [Google Scholar]
- Johnstone BM, Taylor KJ. Physiology of the middle ear transmission system. J Otolaryngol Soc Austral. 1971;3:226–228. [PubMed] [Google Scholar]
- Khanna SM, Stinson MR. Specification of the acoustical input to the ear at high frequencies. J Acoust Soc Am. 1985;77:577–589. doi: 10.1121/1.391876. [DOI] [PubMed] [Google Scholar]
- Lynch TJ., III . Signal processing by the cat middle ear: Admittance and transmission, measurements and models. doctoral dissertation; Massachusetts Institute of Technology: 1981. [Google Scholar]
- Lynch TJ, III, Nedzelnitsky V, Peake WT. Input impedance of the cochlea in cat. J Acoust Soc Am. 1982;72:108–130. doi: 10.1121/1.387995. [DOI] [PubMed] [Google Scholar]
- Lynch TJ, III, Peake WT, Rosowski JJ. Measurements of the acoustic input impedance of cat ears: 10 Hz to 20 kHz. J Acoust Soc Am. 1994;96:2184 –2209. doi: 10.1121/1.410160. [DOI] [PubMed] [Google Scholar]
- Manley GA, Johnstone BM. Middle-ear function in the guinea pig. J Acoust Soc Am. 1974;56:571–576. doi: 10.1121/1.1903292. [DOI] [PubMed] [Google Scholar]
- Møller AR. Transfer function of the middle ear. J Acoust Soc Am. 1963;35:1526–1534. [Google Scholar]
- Møller AR. An experimental study of the acoustic impedance of the middle ear and its transmission properties. Acta Oto-Laryngol. 1965;60:129–149. doi: 10.3109/00016486509126996. [DOI] [PubMed] [Google Scholar]
- Mundie JR. The impedance of the ear—a variable quantity. In: Fletcher JL, editor. Middle Ear Function Seminar—Report #576. U.S. Army Medical Research Lab; Fort Knox, KY: 1963. pp. 63–85. [PubMed] [Google Scholar]
- Nummela S. Scaling and modeling of the mammalian ear. Comments Theor Biol. 1997;4:387–412. [Google Scholar]
- Nuttall AL. Measurements of the guinea-pig middle-ear transfer characteristic. J Acoust Soc Am. 1974;56:1231–1238. doi: 10.1121/1.1903413. [DOI] [PubMed] [Google Scholar]
- Olson ES. Observing middle and inner ear mechanics with novel intracochlear pressure sensors. J Acoust Soc Am. 1998;103:3445–3463. doi: 10.1121/1.423083. [DOI] [PubMed] [Google Scholar]
- Olson ES, Cooper NP. Stapes motion and scala vestibuli pressure in gerbil. Assoc Res Otolaryngol Mid-Winter Meet Abst. 2000;23:114 (A). [Google Scholar]
- Onchi Y. A study of the mechanism of the middle ear. J Acoust Soc Am. 1949;21:404 –410. [Google Scholar]
- Onchi Y. Mechanism of the middle ear. J Acoust Soc Am. 1961;33:794 –805. [Google Scholar]
- Overstreet EH. The development of basilar membrane mechanics in the mammalian cochlea. doctoral dissertation; University of Minnesota: 2000. [Google Scholar]
- Overstreet EH, Ruggero MA. Basilar membrane mechanics at the hook region of the Mongolian gerbil cochlea. Assoc Res Otolaryngol Mid-Winter Meet Abst. 1998;21:181 (A). [Google Scholar]
- Overstreet EH, Ruggero MA. The development of basilar membrane mechanics at the hook region of the Mongolian gerbil cochlea. Assoc Res Otolaryngol Mid-Winter Meet Abst. 1999;22:135 (A). [Google Scholar]
- Pearce M, Richter CP, Cheatham MA. A reconsideration of sound calibration in the mouse. J Neurosci Methods. 2001;106:57–67. doi: 10.1016/s0165-0270(01)00329-6. [DOI] [PubMed] [Google Scholar]
- Puria S, Allen JB. Measurements and model of the cat middle ear: evidence of tympanic membrane acoustic delay. J Acoust Soc Am. 1998;104:3463–3481. doi: 10.1121/1.423930. [DOI] [PubMed] [Google Scholar]
- Rabbitt RD. A hierarchy of examples illustrating the acoustic coupling of the eardrum. J Acoust Soc Am. 1990;87:2566–2582. doi: 10.1121/1.399050. [DOI] [PubMed] [Google Scholar]
- Ravicz ME, Rosowski JJ, Voigt HF. Sound-power collection by the auditory periphery of the Mongolian gerbil Meriones unguiculatus. I: Middle-ear input impedance. J Acoust Soc Am. 1992;92:157–177. doi: 10.1121/1.404280. [DOI] [PubMed] [Google Scholar]
- Relkin EM. Introduction to the analysis of middle-ear function. In: Jahn AF, Santos-Sacchi J, editors. Physiology of the Ear. Raven; New York: 1988. pp. 103–123. [Google Scholar]
- Relkin EM, Saunders JC. Displacement of the malleus in neonatal golden hamsters. Acta Oto-Laryngol. 1980;90:6–15. doi: 10.3109/00016488009131692. [DOI] [PubMed] [Google Scholar]
- Rosowski JJ. Outer and middle ears. In: Fay RR, Popper AN, editors. Comparative Hearing: Mammals. Springer-Verlag; New York: 1994. pp. 172–247. [Google Scholar]
- Rosowski JJ, Ravicz ME, Teoh SW, Flandermeyer D. Measurements of middle-ear function in the Mongolian gerbil, a specialized mammalian ear. Audiol Neuro-Otol. 1999;4:129–136. doi: 10.1159/000013831. [DOI] [PubMed] [Google Scholar]
- Ruggero MA, Rich NC. Application of a commercially-manufactured Doppler-shift laser velocimeter to the measurement of basilar-membrane vibration. Hear Res. 1991;51:215–230. doi: 10.1016/0378-5955(91)90038-b. [DOI] [PMC free article] [PubMed] [Google Scholar]
- Ruggero MA, Rich NC, Robles L, Shivapuja BG. Middle-ear response in the chinchilla and its relationship to mechanics at the base of the cochlea. J Acoust Soc Am. 1990;87:1612–1629. doi: 10.1121/1.399409. [DOI] [PMC free article] [PubMed] [Google Scholar]
- Shaw EAG. Eardrum representation in middle-ear acoustical network. J Acoust Soc Am. 1981;62(Suppl 1):S12 (A). [Google Scholar]
- Shore SE, Nuttall AL. The effects of cochlear hypothermia on compound action potential tuning. J Acoust Soc Am. 1985;77:590–598. doi: 10.1121/1.391877. [DOI] [PubMed] [Google Scholar]
- Stinson MR. The spatial distribution of sound pressure within scaled replicas of the human ear canal. J Acoust Soc Am. 1985;78:1596–1602. doi: 10.1121/1.392797. [DOI] [PubMed] [Google Scholar]
- Stinson MR, Khanna SM. Sound propagation in the ear canal and coupling to the eardrum, with measurements on model systems. J Acoust Soc Am. 1989;85:2481–2491. doi: 10.1121/1.397743. [DOI] [PubMed] [Google Scholar]
- Stinson MR, Shaw EAG. Wave effects and pressure distribution in the ear canal near the tympanic membrane. J Acoust Soc Am. 1982;71(Suppl 1):S88 (A). [Google Scholar]
- Vrettakos PA, Dear SP, Saunders JC. Middle ear structure in the chinchilla: a quantitative study. Am J Otolaryngol. 1988;9:58–67. doi: 10.1016/s0196-0709(88)80009-7. [DOI] [PubMed] [Google Scholar]
- Wilson JP, Bruns V. Middle-ear mechanics in the CF-bat Rhinolophus ferrumequinum. Hear Res. 1983;10:1–13. doi: 10.1016/0378-5955(83)90015-1. [DOI] [PubMed] [Google Scholar]
- Wilson JP, Johnstone JR. Basilar membrane and middle-ear vibration in guinea pig measured by capacitive probe. J Acoust Soc Am. 1975;57:705–723. doi: 10.1121/1.380472. [DOI] [PubMed] [Google Scholar]
- Woolf NK, Ryan AF. Ontogeny of neural discharge patterns in the ventral cochlear nucleus of the mongolian gerbil. Brain Res. 1985;349:131–147. doi: 10.1016/0165-3806(85)90138-5. [DOI] [PubMed] [Google Scholar]
- Woolf NK, Ryan AF. Contributions of the middle ear to the development of function in the cochlea. Hear Res. 1988;35:131–142. doi: 10.1016/0378-5955(88)90112-8. [DOI] [PubMed] [Google Scholar]
- Xue S, Mountain DC, Hubbard AE. Electrically evoked basilar membrane motion. J Acoust Soc Am. 1995;97:3030–3041. doi: 10.1121/1.413103. [DOI] [PubMed] [Google Scholar]
- Zimmer WM, Rosin DF, Saunders JC. Middle-ear development. VI: Structural maturation of the rat conducting apparatus. Anat Rec. 1994;239:475–484. doi: 10.1002/ar.1092390413. [DOI] [PubMed] [Google Scholar]
- Zwislocki JJ. Analysis of the middle-ear function. Part I. Input impedance. J Acoust Soc Am. 1962;34:1514 –1523. [Google Scholar]
- Zwislocki JJ. Analysis of middle ear function. II. Guinea pig ear. J Acoust Soc Am. 1963;35:1034 –1040. [Google Scholar]
- Zwislocki JJ. The role of the external and middle ear in sound transmission. In: Tower DB, Eagles EL, editors. The Nervous System, Vol. 3: Human Communication and its Disorders. Raven; New York: 1975. pp. 45–55. [Google Scholar]