Abstract
In vivo neuroimaging methods permit longitudinal quantitative examination of the dynamic course of neurodegenerative conditions in humans and animal models and enable assessment of therapeutic efforts in mitigating disease effects on brain systems. The study of conditions affecting white matter, such as multiple sclerosis, demyelinating conditions, and drug and alcohol dependence, can be accomplished with diffusion tensor imaging (DTI), a technique uniquely capable of probing the microstructural integrity of white matter fibers in the living brain. We used a 3T clinical MR scanner equipped with an insert gradient coil that yields an order of magnitude increase in performance over the whole-body hardware to acquire in vivo DTI images of rat brain. The resolution allowed for fiber tracking evaluation of fractional anisotropy (FA) and apparent diffusion coefficients in the genu and splenium of the corpus callosum. A comparison of short (46 min) and long (92 min) acquisition time DTI protocols indicated low but adequate signal-to-noise ratio (SNR=6.2) of the shorter protocol to conduct quantitative fiber tracking enhanced by multiple acquisitions. As observed in human studies, FA in the rat splenium was higher than in the genu. Advantages of this technology include the use of similar user interface, pulse sequences, and field strength for preclinical animal and clinical human research, enhancing translational capabilities. An additional benefit of scanning at lower field strength, such as 3T, is the reduction of artifacts due to main field inhomogeneity relative to higher field animal systems.
Introduction
Disruption of brain white matter tracts and their constituents characterizes a number of neurodegenerative diseases and neuropsychiatric conditions, including multiple sclerosis (Ge, et al., 2005), stroke (Lansberg, et al., 2000), Alzheimer's disease (Medina, et al., 2006), closed head injury (Salmond, et al., 2006), HIV infection (Pfefferbaum, et al., 2006d), and drug (Lim, et al., 2002b) and alcohol (Pfefferbaum, et al., 2006c) dependence, and is characteristic of normal aging (Salat, et al., 2005; Sullivan, et al., 2001). Although conventional MR imaging is valuable for viewing and quantifying bulk volume and macrostructural spatial characteristics of tissue, MR diffusion tensor imaging (DTI) is better able to detect microstructural changes, particularly in white matter. For example, DTI revealed evidence for microstructural abnormalities in the corpus callosum (the large fiber commissure connecting the two cerebral hemispheres) of alcoholic women and healthy elderly men and women not evident on MRI (Pfefferbaum & Sullivan, 2002; Sullivan, et al., 2001). Further, DTI metrics of orientational diffusion (anisotropy) contrasted with free bulk diffusion (mean diffusivity) have enabled characterization of the progression of stroke and its resolution over time (Lansberg, et al., 2001).
Considering DTI's broad clinical and research utility, refinement of DTI protocols for use with animal models of conditions affecting white matter could aid in explicating the nature of the damage and constituents of tissue sustaining damage visible with in vivo DTI. In the case of substance dependence, for example, in vivo imaging methods permit longitudinal study of the dynamic course of addiction and control of factors, such as age of onset, nutrition, substance consumption rate and amount, not possible in human study. As a safe, noninvasive method, DTI can be used to track normal development, aging, progression of disease and recovery with therapeutic intervention or abstinence from neurotoxic agents.
To date, the mainstay of diffusion imaging studies of the rodent brain have used high-field animal scanners (4.7-11.7T) (Guilfoyle, et al., 2003; Harsan, et al., 2006; Hoehn-Berlage, et al., 1999; Nair, et al., 2005; Tyszka, et al., 2006; Verma, et al., 2005; Zhang, et al., 2002). Additionally, because adequate signal-to-noise ratio (SNR) requires prolonged scan times, many of these experiments have been conducted on in vitro brain tissue. Only a few studies report in vivo results (mice: (Guilfoyle, et al., 2003; Harsan, et al., 2006; Nair, et al., 2005); rats: (Boretius, et al., 2004; Hoehn-Berlage, et al., 1999; Lee, et al., 2006; Lin, et al., 2005; Numano, et al., ; Xue, et al., 1999)). Most reports have displayed color orientation maps rather than fiber tracking, with exceptions being Xue et al. (Xue, et al., 1999), who demonstrated fiber reconstruction at 4.7T with 0.22 × 0.31 × 0.50-mm3 resolution in 2 h, and Lee et al. (Lee, et al., 2006), who reported quantitative fiber tracking at 1.5T in which 0.63 × 0.63 × 0.50-mm3 resolution required 110 min of scanning.
Here, we report on the development of an echo-planar (EP) DTI protocol with a nominal 0.5-mm isotropic resolution in 46 min on a 3T human MRI system equipped with a high-strength insert gradient coil for study of rat brain in vivo. To obtain DTI data in a relatively short time but with SNR adequate for quantitative fiber tracking, we compared DTI results acquired with a 46 min protocol with those acquired with a 92-min protocol. Although even the 46-min protocol is long by clinical standards and current insert gradients are limited for use with small animals, this scan time is at the low end of the time range of published rodent studies and is an improvement over other protocols, particularly for the isotropic resolution achieved.
Materials and Methods
Subjects
Six healthy male adult Wistar rats (Harlen, Indiana) were examined. Two, 3-months old rats (weight = 438 g and 475 g) received both the short (46 min) and the long (92 min) DTI protocols; and four 8-months old rats (weight = 521 to 730 g) received the short DTI protocol only. Approval was granted from SRI and Stanford University review boards to conduct in vivo animal MR imaging studies.
Anesthesia and animal holder
As previously described (Adalsteinsson, et al., 2004; Pfefferbaum, et al., 2004), the animals were held in an MR-invisible structure, which provided support for the radiofrequency (RF) coil and a nose cone for the delivery of isoflurane anesthesia (2-3.5%) and oxygen (∼1.5 l/min). Rectal temperature and oxygen saturation from the hind limb were monitored throughout the experiment. Heating was provided by pre-warmed bags of saline solution placed under the animal tray.
MRI acquisition
The experiments were conducted on a clinical 3T GE Signa human MR scanner equipped with a high-strength insert gradient coil (Figure 1; peak strength = 600 mT/m; peak slew rate = 3200 T/m/s) (Chronik, et al., 2000a; Chronik, et al., 2000b). The gradient system was operated at a maximum amplitude of 500 mT/m with a slew rate of 1800 mT/m/ms to minimize vibration and acoustic problems. A custom-made rat brain quadrature head coil (Ø = 44 mm) was used for both RF excitation and signal reception. The insert gradient coil was designed to be driven by the body coil gradient amplifiers, and thus does not need a separate power supply or amplification. A hardware switch (with appropriate safety precautions) enables the switching of amplifier output between the two gradient systems.
Figure 1.
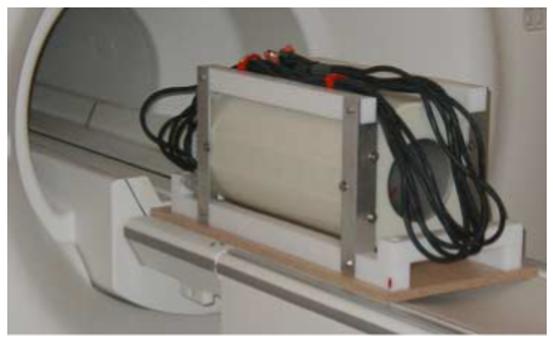
High-strength insert gradient coil on the patient table of a clinical 3T human scanner.
A gradient recalled echo (GRE) localizer scan (echo time (TE)/repetition time (TR) = 2.1/24.6 ms, flip angle = 30°, field of view (FOV) = 80×80 mm2, 256×128 matrix, three 5-mm slices per plane, scan time = 47 s) was used to position the animals in the scanner and for graphical prescription of the fast spin-echo (FSE). Dual echo, FSE images were acquired in the coronal plane, transaxial to the magnet system bore (TE1/TE2/TR = 11.3/56.7/7000 ms, FOV= 60×60 mm2, 256×256 matrix, echo train length of 8, 70 contiguous slices, 0.5-mm thick, scan time = 15:03 min). The FSE had higher-resolution and higher contrast than the localizer and was used for determining the location of the corpus callosum necessary for the prescription of the DTI.
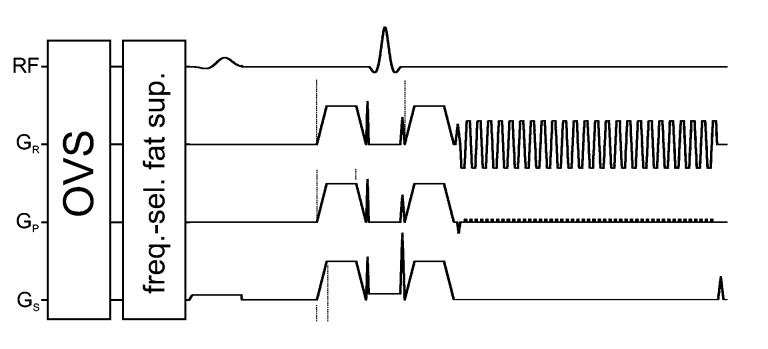
The RF and gradient scheme of the implemented DTI pulse sequence (FOV = 32×32 mm2, TE/TR = 32.8/2000 ms) is shown in Figure 2. Multi-slice data were acquired in coronal orientation (magnet transaxial) at an isotropic resolution of 0.5 mm with and without diffusion weighting. A partial k-space acquisition scheme (nread = 64, nphase = 48) was applied to reduce TE. Frequency encoding direction was left to right. Data were acquired with a readout bandwidth of ±200 kHz (Gread =147 mT/m) and an echo spacing of 0.544 ms for a total readout duration of only 26.1 ms. Symmetric diffusion weighting gradients were applied with an amplitude of 340 mT/m, duration of 4 ms, spacing of 9 ms, and ramp duration of 1 ms to achieve a b-value=1009 s/mm2 in 6 noncollinear directions (+x+y, +y+z, +x+z, −x+y, −y+z, +x−z); the same 6 directions with opposite polarity were acquired to compensate for the cross-terms caused by both imaging and crusher gradients (Neeman, et al., 1991). Six directions are the minimal needed to define the tensor, and we chose to enhance single-shot SNRs with multiple averages of the same direction rather than using more directions with fewer averages. Crusher gradients to dephase transverse magnetization resulting from imperfect refocusing pulses were applied in all 3 directions immediately before and after the 180° pulse (Figure 2). Frequency-selective lipid suppression and outer-volume suppression (OVS) modules preceded the imaging sequence. Saturation bands were placed at the left, right and bottom of the FOV (Figure 3a). Twenty-six slices with 16 averages per acquisition were collected with the positive and negative polarity gradient scheme (7:36 min) and repeated 6 or 12 times for a total DTI acquisition time of 46 or 92 min, thus limiting in vivo scanning session to less than 2 hours.
Figure 2.
RF and gradient scheme of the implemented echo planar DTI pulse sequence.
Figure 3.
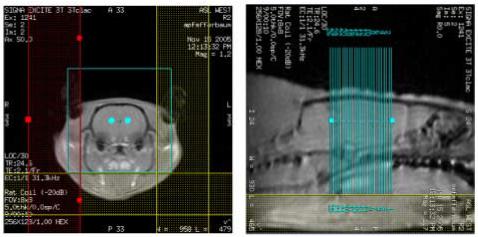
Representative coronal (a) and sagittal (b) localizer images showing the position of the OVS bands and the slice locations.
Two GRE data sets (TR = 1000 ms, FOV = 64×64 mm2, 256×128 matrix; acquisition time for each set = 4:24 min) acquired with echo times of 8 and 10 ms from the same slices (Figure 3b) as the DTI data were used to calculate B0 field maps.
DTI Analysis
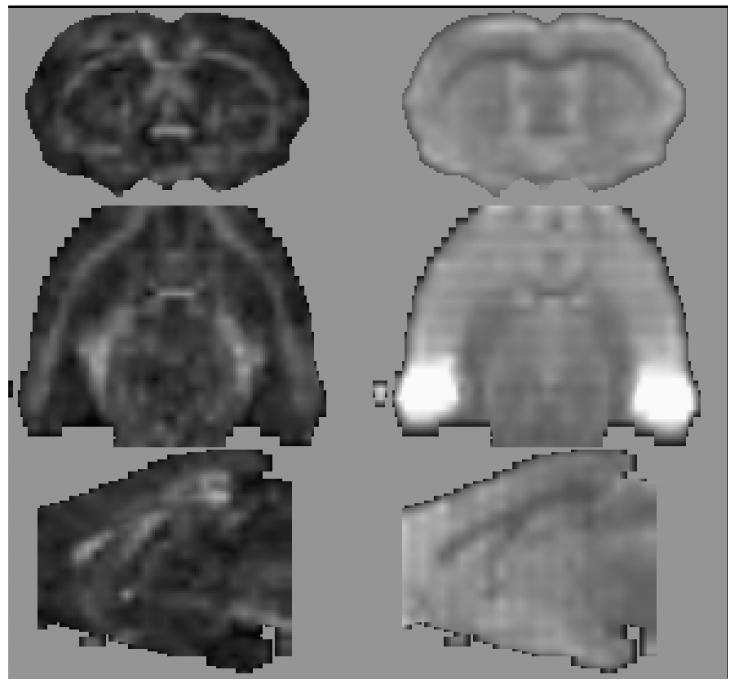
DTI quantification was preceded by eddy-current correction on a slice-by-slice basis using within-slice registration, which takes advantage of the symmetry of the opposing polarity acquisition (Bodammer, et al., 2004). The reversing diffusion gradient polarity scheme also eliminates the need to account for the cross terms between imaging and diffusion gradients by averaging the opposite polarity data (Neeman, et al., 1991), reducing the data to six non-collinear diffusion weighted images per slice. Using the field maps, B0-field inhomogeneity-induced geometric distortion in the eddy-current corrected images was attenuated with PRELUDE (Phase Region Expanding Labeller for Unwrapping Discrete Estimates; (Jenkinson, 2003) and FUGUE (FMRIB's Utility for Geometrically Unwarping EPIs; http://www.fmrib.ox.ac.uk/fsl/fugue/). The basis images were interpolated by a factor of 4 in all 3 dimensions with a windowed sinc in-plane and linear through-plane function and smoothed with a 3×3×3 box-car average to enhance structural visibility for ROI identification. Figure 4 presents coronal, axial, and sagittal FA (left) and non-diffusion-weighted EP images (right) at the anterior commissure level.
Figure 4.
FA (left) and non-diffusion-weighted EP images (right) re-sliced in 3 planes (46-min scan).
Fiber Tracking
The native DTI data were used for fiber tracking. Corpus callosum genu and splenium targets were manually identified (by A.P.) on a midsagittal FA image, three pixels wide. Sources were parallel planes, 10 pixels lateral to either side of the corpus callosum. The fiber tracking routines developed by Mori and Xu (Mori, et al., 1999; Xu, et al., 2002) and distributed by G. Gerig at University of North Carolina (Zhai, et al., 2003) [www.ia.unc.edu/dev/download/fibertracking] were used and produced pictorial fiber bundle representations. Quantification of the mean FA and ADC of the fibers— “quantitative fiber tracking”— were similar to those we have previously used in vivo in the human brain (Pfefferbaum, et al., 2006b; Sullivan, et al., 2006).
For each animal an interactive program presented a sagittal FA image on which the corpus callosum genu and splenium were outlined (Figure 5). The operator manually moved a cursor across a coronal projection image with the sagittal location identified to select the sagittal image with the clearest anatomical boundaries. The genu and splenium were outlined with a cursor, which created an ROI that was approximately twice as long along the corpus callosum as it was wide.
Figure 5.
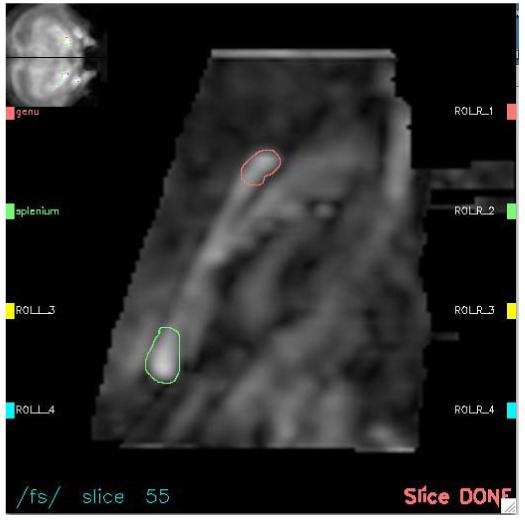
ROI identification procedure. Interactive computer interface display of an enlarged midsagittal FA image (center) with its slice location on a coronal projection (upper left hand corner). The genu (top, red) and splenium (bottom, green) have been manually delineated .
Results
Quantification of FA and ADC in the genu and splenium of the corpus callosum of the rat was achieved using fiber tracking and ROI analysis. The SNR was determined by dividing the mean image intensity from a corpus callosum genu region-of-interest drawn on the averaged, native, non-diffusion weighted, echo-planar images by a Rician-corrected noise estimate from a structure-free region of the image for each 46-min acquisition from the first two rats. The SNR for echo-planar acquisition in the genu of the corpus callosum (a primary target structure) was 6.2±0.22.
Fiber Tracking
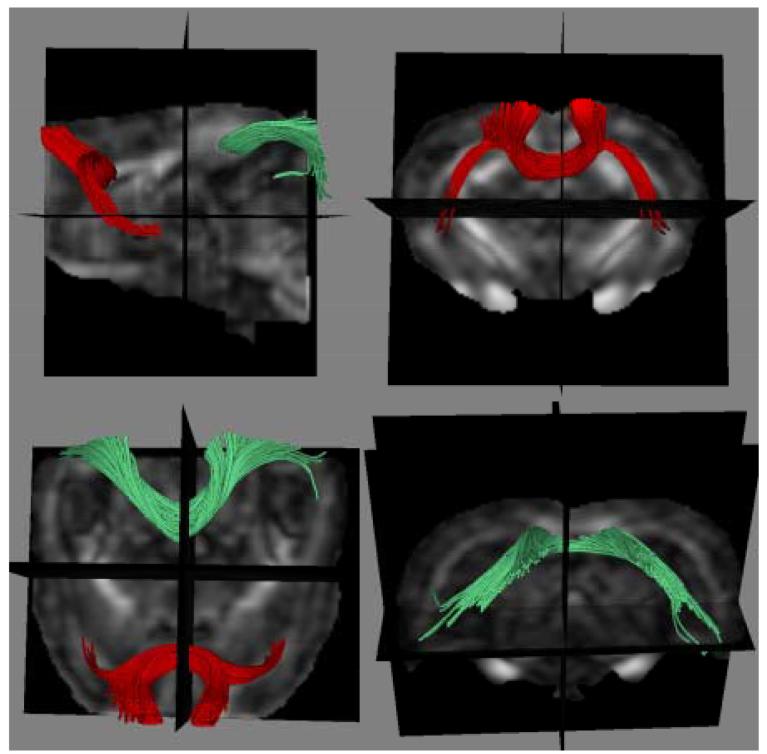
Fiber tracking produced pictorial fiber bundle representations similar to those seen in humans (Mori, et al., 2002; Pfefferbaum, et al., 2006b; Sullivan, et al., 2006). Figure 6 shows fibers forming frontal cortex forceps and lateral bundles through the genu and posterior forceps through the splenium.
Figure 6.
Fiber bundles through the splenium (green) and genu (red) of the corpus callosum overlaid onto FA images (46-min scan).
Quantification and Variance of Diffusion Parameters
The mean±standard deviation FA and ADC of the genu and splenium from fiber tracking and ROIs, the area of each ROI and coefficients of variation (CV; measurement variance) are presented in Table 1.
Table 1.
FA (percent) and ADC (10-6 mm2/s) for each rat
| Fiber Tracking |
Region of Interest |
||||||||
|---|---|---|---|---|---|---|---|---|---|
| Genu |
Splenium |
Genu |
Splenium |
||||||
| Rat | Age (mo) | FA | ADC | FA | ADC | FA | ADC | FA | ADC |
| 1240_1 (46min) | 3 | 34.75 | 744.60 | 41.24 | 675.90 | 39.60 | 762.96 | 40.92 | 723.97 |
| 1240_2 (46min) | 34.86 | 755.34 | 39.17 | 676.76 | 38.52 | 763.29 | 40.16 | 728.99 | |
| 1240_3 (92min) | 34.47 | 750.12 | 39.83 | 675.52 | 39.02 | 763.05 | 40.47 | 726.61 | |
| 1241_1 (46min) | 3 | 35.57 | 740.73 | 40.92 | 693.71 | 44.27 | 769.88 | 40.19 | 759.14 |
| 1241_2 (46min) | 34.45 | 736.50 | 40.29 | 686.16 | 40.02 | 782.68 | 39.29 | 720.66 | |
| 1241_3 (92min) | 34.34 | 739.86 | 40.35 | 687.31 | 42.03 | 776.34 | 39.62 | 740.17 | |
| V02 | 8 | 37.17 | 779.23 | 53.58 | 641.91 | 43.74 | 776.73 | 50.48 | 642.26 |
| V04 | 8 | 38.65 | 744.56 | 52.21 | 591.03 | 40.16 | 770.33 | 54.41 | 596.08 |
| V06 | 8 | 38.88 | 784.43 | 44.65 | 702.59 | 46.11 | 800.05 | 41.93 | 765.47 |
| V08 | 8 | 37.89 | 829.43 | 40.89 | 711.34 | 40.56 | 759.54 | 44.66 | 734.67 |
| Summary statistics for the first, 46 min. DTI run for rats 1240 and 1241 combined with rats V02, V04, V06, and V08. | |||||||||
| Mean= | 37.15 | 770.50 | 45.58 | 669.40 | 42.41 | 773.25 | 45.43 | 703.6 | |
| SD= | 1.67 | 34.56 | 5.85 | 45.59 | 2.66 | 14.45 | 5.78 | 68.72 | |
| CV= | 4.51% | 4.49% | 12.84% | 6.81% | 6.27% | 1.87% | 12.71% | 9.77% | |
N.B.: For rats 1240 and 1241, _1 and _2 refer to the first and the second half of the 92-min DTI protoc _3 refers to the full 92-min data, which are not independent and not included in the summary statistics.
Between rat comparisons
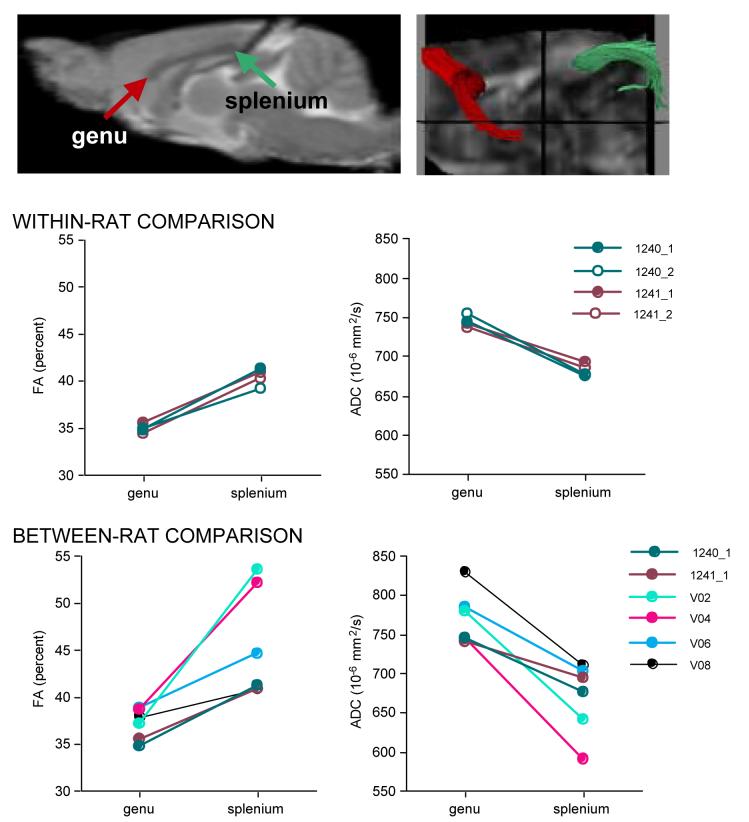
All six rats were scanned with the 46-min acquisition protocol (Figure 7). Only data from the first 46-min run of the two rats with multiple runs were used. For fiber tracking, within-subjects paired t-tests indicated that FA was lower (t(5)=3.907, p=0.0113) and ADC higher (t(5)=5.938, p=0.0019) in the genu than the splenium (Figure 7). The CVs were lower in the genu (∼4.5% for FA and ADC) than splenium (12.8% for FA and 6.8% for ADC). The pattern of results for the DTI metrics in the ROI analysis was similar to those for fiber tracking analysis but generally the differences were not significant (genu vs. splenium FA t(5)=1.056, p=0.3392; ADC t(5)=2.527, p=0.0527) (Table 1).
Figure 7.
Left top: Sagittal FSE image with arrows pointing to the genu and splenium of the corpus callosum. Right top: splenium (green) and genu (red) of the corpus callosum. Left middle: FA from each 46-min acquisition from two rats. Right middle: ADC from each 46-min acquisition from two rats. Left bottom: FA from 46-min acquisition from all six rats. Right bottom: ADC from 46-min acquisition from all six rats. FA and ADC values were calculated using fiber tracking.
Differences in diffusion parameters calculated from the 46 or 92 min acquisitions for the two young rats were minimal (Table 1).
ROIs vs. quantitative fiber tracking
Based on an average of the six rats at the 46-min acquisition time, FA in the genu was lower for the quantitative fiber tracking than ROI approach (t(5) = 5.25, p = 0.0056). The fiber tracking vs. ROI difference was not significant for genu ADC or splenium FA, but splenium ADC was higher in the ROI than fiber tracking approach (Table 1).
Within-rat comparisons: 46-min acquisitions
Table 1 includes FA and ADC values quantified from two separate acquisitions within the same scanning session, that is, without removing the rat from the scanner between acquisitions, in the two rats with the double acquisition. FA identified fibers in the genu ranged from 34.4% to 35.6% and ADC values ranged from 736.5 to 755.3 ×10⁻⁶ mm2/s; for the splenium FA ranged from 39.2% to 41.2% and ADC ranged from 675.8 to 693.7 ×10⁻⁶ mm2/s (Table 1).
As an estimate of within-subject measurement variance, we calculated the mean and standard deviation of FA and ADC measured across fibers within each fiber bundle of each rat and also across voxels within each ROI of each rat. For the fiber tracking analysis, the mean and standard deviation across all fibers (155 to 343 fibers for the genu and 125 to 216 fibers for the splenium) comprising a bundle were computed for each bundle in each animal. These variance data for each rat are presented in Table 2. The fiber track analysis indicated that for the 46-min acquisition the genu FA standard deviation ranged from 2.68 to 4.19, and the splenium FA standard deviation ranged from 5.30 to 10.02. The ROI analysis revealed that the genu FA standard deviation ranged from 9.33 to 13.37, and the splenium FA standard deviation ranged from 10.29 to 13.37. To determine the potential contribution of partial voluming of non-corpus callosum tissue, each ROI was eroded by one pixel in-plane on each of the three slices on which the ROIs were identified. As expected, the resulting FA standard deviations were lower than without erosion and ranged from 6.81 to 11.44 in the genu ROI and from 7.48 to 12.40 in the splenium ROI, suggesting that the within ROI variance is substantially influenced by the ROI definition.
Table 2.
Standard deviation of FA (percent) and ADC (10-6 mm2/s) across fibers in a bundle and across voxels in an ROI within each rat
| Fiber Tracking |
Region of Interest |
|||||||
|---|---|---|---|---|---|---|---|---|
| Genu |
Splenium |
Genu |
Splenium |
|||||
| Rat | FA S.D. | ADC S.D. | FA S.D. | ADC S.D. | FA S.D. | ADC S.D. | FA S.D. | ADC S.D. |
| 1240_1 (46min) | 3.27 | 7.64 | 5.73 | 14.89 | 9.33 | 51.18 | 11.41 | 48.26 |
| 1240_2 (46min) | 3.51 | 8.31 | 5.77 | 9.40 | 9.56 | 46.83 | 10.11 | 47.11 |
| 1240_3 (92min) | 3.36 | 7.13 | 5.90 | 10.30 | 9.29 | 48.04 | 10.61 | 45.57 |
| 1241_1 (46min) | 4.19 | 19.16 | 5.57 | 16.45 | 11.72 | 34.67 | 13.28 | 70.56 |
| 1241_2 (46min) | 4.69 | 20.16 | 6.33 | 16.74 | 11.31 | 44.27 | 11.46 | 57.43 |
| 1241_3 (92min) | 4.23 | 19.34 | 5.72 | 15.39 | 11.20 | 38.36 | 11.63 | 62.93 |
| V02 | 3.16 | 27.83 | 10.02 | 55.47 | 9.94 | 59.67 | 13.37 | 87.45 |
| V04 | 2.68 | 18.66 | 8.85 | 31.63 | 12.11 | 35.19 | 11.85 | 62.47 |
| V06 | 3.09 | 27.16 | 5.30 | 25.19 | 12.41 | 34.85 | 10.29 | 49.59 |
| V08 | 3.33 | 63.61 | 5.94 | 17.95 | 13.37 | 42.24 | 10.81 | 29.90 |
N.B.: For rats 1240 and 1241, the underscore and number refer to the first and the second half of the 92-min DTI protocol, and the third refers to the full 92-min data.
Discussion
This study demonstrates the feasibility of acquiring DTI data sufficiently robust to permit quantitative fiber tracking, as demonstrated in two regions of the corpus callosum, in the rat brain in vivo on a 3T clinical scanner. Advantages of employing insert gradients on 3T clinical scanners include the use of an identical prescription interface to human studies, and similar pulse sequences and field strength for preclinical animal and clinical human research, thus enhancing the translational nature of such research. Specifically, for a fixed b-value, insert gradients permit shorter echo time (hence, increasing the SNR) and reduced duration echo-planar readout compared with the product whole-body gradients. Although yet higher field strength improves SNR, the present data acquired at 3T had sufficient SNR (in as short a duration as 46 min with an isotropic 0.5-mm resolution) to yield robust fiber tracking and its quantification based on FA and ADC.
The 0.5-mm resolution at 46 min represented a reasonable scan time trade-off for in vivo animal studies. The parameters yielded an SNR of ∼6.2, which was low but adequately robust for quantification of fiber tracking. The course of fibers is not orthogonal to acquisition planes, and isotropic acquisition is the optimal approach. We sacrificed in-plane resolution for slice thickness because thicker slices with higher in-plane resolution may have made more attractive FA images but limited fiber tracking. A further consideration involved the trade-off between the number of diffusion directions to use and the number of shots obtainable in an acceptable, in vivo scan session. We used six directions, the minimum needed to define the tensor, thus enhancing single-shot SNRs with multiple averages of the same direction rather than using more directions with fewer averages.
An across-subject ROI FA standard deviation of ∼6 is consistent with human DTI clinical reports in disease states, with tractrography producing less variance, as is the case with the rat data herein, and more sensitive disease detection (Kanaan, et al., 2006). Further, considering the group standard deviations for each DTI measure, we estimate that we would have 80 to 95% power with samples of only 10 to 12 subjects to detect differences with 2-tailed tests ranging from 5% of the mean genu FA to 15% of the mean splenium FA and ADC.
High-field ( ≥ 4.7 T) animal MR scanners provide higher SNR permitting the acquisition of higher resolution DTI data for a given scan time relative to lower field systems. At the same time, however, off-resonance effects also increase with field strength leading to severe image distortions in EPI-DTI on high-field systems. Whereas spin-echo based DTI sequences are less prone to susceptibility artifacts, as multi-shot techniques they are inherently more susceptible to motion artifacts, which can reduce the effective resolution. All of these trade-offs have to be taken into account when choosing a DTI acquisition protocol and field strength for acquisition. Our proposed method adds another alternative.
In agreement with other rodent (Harsan, et al., 2006) and human (Huisman, et al., 2006; Nakayama, et al., 2006; Persson, et al., 2006; Pfefferbaum & Sullivan, 2005) studies, FA values observed herein were higher in the splenium than the genu, suggesting across-species consistency in white matter microstructural quality. The FA values for the corpus callosum reported here from both ROI and fiber tracking analyses fall within the range of published values in rodents from ROI analysis (range: 32 to 75%) (Guilfoyle, et al., 2003; Harsan, et al., 2006; Nair, et al., 2005; Tyszka, et al., 2006; Verma, et al., 2005). The few studies in humans that have compared diffusion parameters calculated from fiber tracking and ROI analysis reveal that FA values obtained using the former method tend to be lower (Dubois, et al., 2006; Thomas, et al., 2005). Indeed, the only previous rodent study to date calculating FA and ADC using fiber tracking, achieved on a 1.5T scanner, reports lower FA values than most published results (e.g., FA= 30% for the corpus callosum in one of their acquisitions) (Lee, et al., 2006). Although the fiber tracking process follows areas of maximum FA to generate a tract, FA in an identified tract is also determined by the minimum FA set in the lower limit parameter. Thus, it can be the case that fiber tracking FA can be lower than FA in a brain region with little partial voluming, and indeed we have reported such a difference in our human studies (Pfefferbaum, et al., 2006d).
Our ADC values from both fiber tracking and ROI analysis fall within the range of reported ADC values for the corpus callosum in rodents (range: 620 to 740 × 10-6mm2/s) (Harsan, et al., 2006; Nair, et al., 2005; Tyszka, et al., 2006). However, whereas rodent FA values fall more closely within the range of human infant FA values, ADC values from these rats were lower than in human infants (range: 930 to 1830 × 10-6mm2/s) (Arzoumanian, et al., 2003; Dubois, et al., 2006; Partridge, et al., 2004; Thomas, et al., 2005). In fact, rodent ADC values for the corpus callosum corresponded better with adult human ADC values (range: 380 to 850 × 10-6 mm2/s) (Huisman, et al., 2006; Lim, et al., 2002a; Zhai, et al., 2003).
Small animal imaging has become an invaluable tool for modeling brain damage incurred from a variety of causes, from spontaneously-occurring to genetically-linked neurodegenerative diseases to environmental insults from trauma and neurotoxins. DTI protocols have been particularly useful for developing longitudinal animal models of human conditions that follow a dynamic course, such as stroke, because of the microstructural alteration of white matter that can occur below the detection of conventional MR imaging of macrostructure (c.f., Adami, et al., 2002; Lansberg, et al., 2000). In parallel to findings in human alcoholism, a recent postmortem study of a rat model of the combined effects of chronic, voluntary alcohol consumption coupled with severe thiamine deficiency revealed thinning of myelin with electron microscopy (He, et al., 2006) that was not visible with structural MRI (Pfefferbaum, et al., 2006a) but may have been detected with DTI (c.f., Pfefferbaum & Sullivan, 2002).
Finally, there are many research-dedicated human 3T systems in universities and medical schools. Often these are stand-alone systems, frequently acquired for human cognitive neuroscience studies. These systems can also be used for animal imaging with the advantage of product pulse sequence availability. With addition of insert gradients, the system's performance can be enhanced without the need to purchase a separate animal magnet system. The high strength of the insert gradients allows for thinner slices and much faster read-out, the latter being of particular value in echo-planar DTI acquisition, where B0 inhomogeneity distortion is a major problem.
Acknowledgements
This project was supported by the National Institute on Alcohol Abuse and Alcoholism (AA05965, AA12388, AA13521—Integrative Neuroscience Initiative on Alcoholism — INIA). E.A. receives support from the R.J. Shillman Career Development Award. B.K.R. receives salary support as the Barnett-Ivey-Heart and Stroke Foundation of Ontario Endowed Chair. A partial report of these data was presented at the annual meeting of the International Society for Magnetic Resonance in Medicine, Seattle, WA, May 2006.
Footnotes
Publisher's Disclaimer: This is a PDF file of an unedited manuscript that has been accepted for publication. As a service to our customers we are providing this early version of the manuscript. The manuscript will undergo copyediting, typesetting, and review of the resulting proof before it is published in its final citable form. Please note that during the production process errors may be discovered which could affect the content, and all legal disclaimers that apply to the journal pertain.
References
- Adalsteinsson E, Hurd RE, Mayer D, Sailasuta N, Sullivan EV, Pfefferbaum A. In vivo 2D J-resolved magnetic resonance spectroscopy of rat brain with a 3T clinical human scanner. Neuroimage. 2004;22:381–386. doi: 10.1016/j.neuroimage.2003.12.046. [DOI] [PubMed] [Google Scholar]
- Adami A, Thijs V, Tong DC, Beaulieu C, Moseley ME, Yenari MA. Use of diffusion weighted MRI to predict the occurrence and severity of hemorrhagic transformation in a rabbit model of embolic stroke. Brain Research. 2002;944:32–39. doi: 10.1016/s0006-8993(02)02704-x. [DOI] [PubMed] [Google Scholar]
- Arzoumanian Y, Mirmiran M, Barnes PD, Woolley K, Ariagno RL, Moseley ME, Fleisher BE, Atlas SW. Diffusion tensor brain imaging findings at term-equivalent age may predict neurologic abnormalities in low birth weight preterm infants. AJNR Am J Neuroradiol. 2003;24:1646–1653. [PMC free article] [PubMed] [Google Scholar]
- Bodammer N, Kaufmann J, Kanowski M, Tempelmann C. Eddy current correction in diffusion-weighted imaging using pairs of images acquired with opposite diffusion gradient polarity. Magn Reson Med. 2004;51:188–193. doi: 10.1002/mrm.10690. [DOI] [PubMed] [Google Scholar]
- Boretius S, Natt O, Watanabe T, Tammer R, Ehrenreich L, Frahm J, Michaelis T. In vivo diffusion tensor mapping of the brain of squirrel monkey, rat, and mouse using single-shot STEAM MRI. Magma. 2004;17:339–347. doi: 10.1007/s10334-004-0069-1. [DOI] [PubMed] [Google Scholar]
- Chronik B, Alejski A, Rutt BK. Design and fabrication of a three-axis multilayer gradient coil for magnetic resonance microscopy of mice. Magma. 2000a;10:131–146. doi: 10.1007/BF02601848. [DOI] [PubMed] [Google Scholar]
- Chronik BA, Alejski A, Rutt BK. Design and fabrication of a three-axis edge ROU head and neck gradient coil. Magn Reson Med. 2000b;44:955–963. doi: 10.1002/1522-2594(200012)44:6<955::aid-mrm18>3.0.co;2-1. [DOI] [PubMed] [Google Scholar]
- Dubois J, Hertz-Pannier L, Dehaene-Lambertz G, Cointepas Y, Le Bihan D. Assessment of the early organization and maturation of infants' cerebral white matter fiber bundles: a feasibility study using quantitative diffusion tensor imaging and tractography. Neuroimage. 2006;30:1121–1132. doi: 10.1016/j.neuroimage.2005.11.022. [DOI] [PubMed] [Google Scholar]
- Ge Y, Law M, Grossman RI. Applications of diffusion tensor MR imaging in multiple sclerosis. Ann N Y Acad Sci. 2005;1064:202–219. doi: 10.1196/annals.1340.039. [DOI] [PubMed] [Google Scholar]
- Guilfoyle DN, Helpern JA, Lim KO. Diffusion tensor imaging in fixed brain tissue at 7.0 T. NMR Biomed. 2003;16:77–81. doi: 10.1002/nbm.814. [DOI] [PubMed] [Google Scholar]
- Harsan LA, Poulet P, Guignard B, Steibel J, Parizel N, de Sousa PL, Boehm N, Grucker D, Ghandour MS. Brain dysmyelination and recovery assessment by noninvasive in vivo diffusion tensor magnetic resonance imaging. J Neurosci Res. 2006;83:392–402. doi: 10.1002/jnr.20742. [DOI] [PubMed] [Google Scholar]
- He X, Sullivan EV, Stankovic RK, Harper C, Pfefferbaum A. Interaction of thiamine deficiency and voluntary alcohol consumption disrupts rat corpus callosum ultrastructure. Neuropsychopharmacology. 2006 doi: 10.1038/sj.npp.1301332. [DOI] [PubMed] [Google Scholar]
- Hoehn-Berlage M, Eis M, Schmitz B. Regional and directional anisotropy of apparent diffusion coefficient in rat brain. NMR Biomed. 1999;12:45–50. doi: 10.1002/(sici)1099-1492(199902)12:1<45::aid-nbm545>3.0.co;2-6. [DOI] [PubMed] [Google Scholar]
- Huisman TA, Loenneker T, Barta G, Bellemann ME, Hennig J, Fischer JE, Il'yasov KA. Quantitative diffusion tensor MR imaging of the brain: field strength related variance of apparent diffusion coefficient (ADC) and fractional anisotropy (FA) scalars. Eur Radiol. 2006;16:1651–1658. doi: 10.1007/s00330-006-0175-8. [DOI] [PubMed] [Google Scholar]
- Jenkinson M. A fast, automated, N-dimensional phase unwrapping algorithm. Journal of Magnetic Resonance in Medicine. 2003;49:193–197. doi: 10.1002/mrm.10354. [DOI] [PubMed] [Google Scholar]
- Kanaan RA, Shergill SS, Barker GJ, Catani M, Ng VW, Howard R, McGuire PK, Jones DK. Tract-specific anisotropy measurements in diffusion tensor imaging. Psychiatry Res. 2006;146:73–82. doi: 10.1016/j.pscychresns.2005.11.002. [DOI] [PubMed] [Google Scholar]
- Lansberg MG, Norbash AM, Marks MP, Tong DC, Moseley ME, Albers GW. Advantages of adding diffusion-weighted magnetic resonance imaging to conventional magnetic resonance imaging for evaluating acute stroke. Arch Neurol. 2000;57:1311–1316. doi: 10.1001/archneur.57.9.1311. [DOI] [PubMed] [Google Scholar]
- Lansberg MG, O'Brien MW, Tong DC, Moseley ME, Albers GW. Evolution of cerebral infarct volume assessed by diffusion-weighted magnetic resonance imaging. Arch Neurol. 2001;58:613–617. doi: 10.1001/archneur.58.4.613. [DOI] [PubMed] [Google Scholar]
- Lee FK, Fang MR, Antonio GE, Yeung DK, Chan ET, Zhang LH, Yew DT, Ahuja AT. Diffusion tensor imaging (DTI) of rodent brains in vivo using a 1.5T clinical MR scanner. J Magn Reson Imaging. 2006;23:747–751. doi: 10.1002/jmri.20553. [DOI] [PubMed] [Google Scholar]
- Lim KO, Choi SJ, Pomara N, Wolkin A, Rotrosen JP. Reduced frontal white matter integrity in cocaine dependence: a controlled diffusion tensor imaging study. Biol Psychiatry. 2002a;51:890–895. doi: 10.1016/s0006-3223(01)01355-5. [DOI] [PubMed] [Google Scholar]
- Lim KO, Choi SJ, Pomara N, Wolkin A, Rotrosen JP. Reduced frontal white matter integrity in cocaine dependence: a controlled diffusion tensor imaging study. Biological Psychiatry. 2002b;51:890–895. doi: 10.1016/s0006-3223(01)01355-5. [DOI] [PubMed] [Google Scholar]
- Lin CY, Sun SW, Hong CY, Chang C. Unsupervised identification of white matter tracts in a mouse brain using a directional correlation-based region growing (DCRG) algorithm. Neuroimage. 2005;28:380–388. doi: 10.1016/j.neuroimage.2005.06.009. [DOI] [PubMed] [Google Scholar]
- Medina D, DeToledo-Morrell L, Urresta F, Gabrieli JD, Moseley M, Fleischman D, Bennett DA, Leurgans S, Turner DA, Stebbins GT. White matter changes in mild cognitive impairment and AD: A diffusion tensor imaging study. Neurobiol Aging. 2006;27:663–672. doi: 10.1016/j.neurobiolaging.2005.03.026. [DOI] [PubMed] [Google Scholar]
- Mori S, Kaufmann WE, Davatzikos C, Stieltjes B, Amodei L, Fredericksen K, Pearlson GD, Melhem ER, Solaiyappan M, Raymond GV, Moser HW, van Zijl PC. Imaging cortical association tracts in the human brain using diffusion-tensor-based axonal tracking. Magnetic Resonance in Medicine. 2002;47:215–223. doi: 10.1002/mrm.10074. [DOI] [PubMed] [Google Scholar]
- Mori S, Xue R, Crain B, Solaiyappan M, Chacko VP, van Zijl PCM. 3D reconstruction of axonal fibers from diffusion tensor imaging using fiber assignment by continuous tracking (abs) Proceedings of the Seventh International Society for Magnetic Resonance in Medicine. 1999;320 [Google Scholar]
- Nair G, Tanahashi Y, Low HP, Billings-Gagliardi S, Schwartz WJ, Duong TQ. Myelination and long diffusion times alter diffusion-tensor-imaging contrast in myelin-deficient shiverer mice. Neuroimage. 2005;28:165–174. doi: 10.1016/j.neuroimage.2005.05.049. [DOI] [PMC free article] [PubMed] [Google Scholar]
- Nakayama N, Okumura A, Shinoda J, Yasokawa YT, Miwa K, Yoshimura SI, Iwama T. Evidence for white matter disruption in traumatic brain injury without macroscopic lesions. J Neurol Neurosurg Psychiatry. 2006;77:850–855. doi: 10.1136/jnnp.2005.077875. [DOI] [PMC free article] [PubMed] [Google Scholar]
- Neeman M, Freyer JP, Sillerud LO. A simple method for obtaining cross-term-free images for diffusion anisotropy studies in NMR microimaging. Magn Reson Med. 1991;21:138–143. doi: 10.1002/mrm.1910210117. [DOI] [PubMed] [Google Scholar]
- Numano T, Homma K, Iwasaki N, Hyodo K, Nitta N, Hirose T. In vivo isotropic 3D diffusion tensor mapping of the rat brain using diffusion-weighted 3D MP-RAGE MRI. Magn Reson Imaging. 2006;24:287–293. doi: 10.1016/j.mri.2005.12.011. [DOI] [PubMed] [Google Scholar]
- Partridge SC, Mukherjee P, Henry RG, Miller SP, Berman JI, Jin H, Lu Y, Glenn OA, Ferriero DM, Barkovich AJ, Vigneron DB. Diffusion tensor imaging: serial quantitation of white matter tract maturity in premature newborns. Neuroimage. 2004;22:1302–1314. doi: 10.1016/j.neuroimage.2004.02.038. [DOI] [PubMed] [Google Scholar]
- Persson J, Lind J, Larsson A, Ingvar M, Cruts M, Van Broeckhoven C, Adolfsson R, Nilsson LG, Nyberg L. Altered brain white matter integrity in healthy carriers of the APOE epsilon4 allele: a risk for AD? Neurology. 2006;66:1029–1033. doi: 10.1212/01.wnl.0000204180.25361.48. [DOI] [PubMed] [Google Scholar]
- Pfefferbaum A, Adalsteinsson E, Bell RL, Sullivan EV. Development and resolution of brain lesions caused by pyrithiamine and dietary Induced thiamine deficiency and alcohol exposure in the alcohol-preferring (P) Rat: A longitudinal MR imaging and spectroscopy study. Neuropsychopharmacology. 2006a doi: 10.1038/sj.npp.1301107. Epub, May 24, 2006. [DOI] [PubMed] [Google Scholar]
- Pfefferbaum A, Adalsteinsson E, Sullivan EV. In vivo structural imaging of the rat brain with a 3T clinical human scanner. Journal of Magnetic Resonance Imaging. 2004;20:779–785. doi: 10.1002/jmri.20181. [DOI] [PubMed] [Google Scholar]
- Pfefferbaum A, Adalsteinsson E, Sullivan EV. Dysmorphology and microstructural degradation of the corpus callosum: Interaction of age and alcoholism. Neurobiol Aging. 2006b;27:994–1009. doi: 10.1016/j.neurobiolaging.2005.05.007. [DOI] [PubMed] [Google Scholar]
- Pfefferbaum A, Adalsteinsson E, Sullivan EV. Supratentorial profile of white matter microstructural integrity in recovering alcoholic men and women. Biological Psychiatry. 2006c;59:364–372. doi: 10.1016/j.biopsych.2005.06.025. [DOI] [PubMed] [Google Scholar]
- Pfefferbaum A, Rosenbloom MJ, Adalsteinsson E, Sullivan EV. Diffusion tensor imaging with quantitative fiber tracking in HIV infection and alcoholism comorbidity: Synergistic white matter damage. Brain. 2006d doi: 10.1093/brain/awl242. in press, doi: 10.1093/brain/awl1242. [DOI] [PubMed] [Google Scholar]
- Pfefferbaum A, Sullivan EV. Microstructural but not macrostructural disruption of white matter in women with chronic alcoholism. Neuroimage. 2002;15:708–718. doi: 10.1006/nimg.2001.1018. [DOI] [PubMed] [Google Scholar]
- Pfefferbaum A, Sullivan EV. Disruption of brain white matter microstructure by excessive intracellular and extracellular fluid in alcoholism: evidence from diffusion tensor imaging. Neuropsychopharmacology. 2005;30:423–432. doi: 10.1038/sj.npp.1300623. [DOI] [PubMed] [Google Scholar]
- Salat DH, Tuch DS, Greve DN, van der Kouwe AJW, Hevelone ND, Zaleta AK, Rosen BR, Fischl B, Corkin S, Rosas HD, Dale AM. Age-related alterations in white matter microstructure measured by diffusion tensor imaging. Neurobiology of Aging. 2005;26:1215–1227. doi: 10.1016/j.neurobiolaging.2004.09.017. [DOI] [PubMed] [Google Scholar]
- Salmond CH, Menon DK, Chatfield DA, Williams GB, Pena A, Sahakian BJ, Pickard JD. Diffusion tensor imaging in chronic head injury survivors: correlations with learning and memory indices. Neuroimage. 2006;29:117–124. doi: 10.1016/j.neuroimage.2005.07.012. [DOI] [PubMed] [Google Scholar]
- Sullivan EV, Adalsteinsson E, Hedehus M, Ju C, Moseley M, Lim KO, Pfefferbaum A. Equivalent disruption of regional white matter microstructure in aging healthy men and women. Neuroreport. 2001;12:99–104. doi: 10.1097/00001756-200101220-00027. [DOI] [PubMed] [Google Scholar]
- Sullivan EV, Adalsteinsson E, Pfefferbaum A. Selective age-related degradation of anterior callosal fiber bundles quantified in vivo with fiber tracking. Cerebral Cortex. 2006;16:1030–1039. doi: 10.1093/cercor/bhj045. [DOI] [PubMed] [Google Scholar]
- Thomas B, Eyssen M, Peeters R, Molenaers G, Van Hecke P, De Cock P, Sunaert S. Quantitative diffusion tensor imaging in cerebral palsy due to periventricular white matter injury. Brain. 2005;128:2562–2577. doi: 10.1093/brain/awh600. [DOI] [PubMed] [Google Scholar]
- Tyszka JM, Readhead C, Bearer EL, Pautler RG, Jacobs RE. Statistical diffusion tensor histology reveals regional dysmyelination effects in the shiverer mouse mutant. Neuroimage. 2006;29:1058–1065. doi: 10.1016/j.neuroimage.2005.08.037. [DOI] [PMC free article] [PubMed] [Google Scholar]
- Verma R, Mori S, Shen D, Yarowsky P, Zhang J, Davatzikos C. Spatiotemporal maturation patterns of murine brain quantified by diffusion tensor MRI and deformation-based morphometry. Proc Natl Acad Sci U S A. 2005;102:6978–6983. doi: 10.1073/pnas.0407828102. [DOI] [PMC free article] [PubMed] [Google Scholar]
- Xu D, Mori S, Solaiyappan M, van Zijl PC, Davatzikos C. A framework for callosal fiber distribution analysis. Neuroimage. 2002;17:1131–1143. doi: 10.1006/nimg.2002.1285. [DOI] [PubMed] [Google Scholar]
- Xue R, van Zijl PC, Crain BJ, Solaiyappan M, Mori S. In vivo three-dimensional reconstruction of rat brain axonal projections by diffusion tensor imaging. Magnetic Resonance in Medicine. 1999;42:1123–1127. doi: 10.1002/(sici)1522-2594(199912)42:6<1123::aid-mrm17>3.0.co;2-h. [DOI] [PubMed] [Google Scholar]
- Zhai G, Lin W, Wilber KP, Gerig G, Gilmore JH. Comparisons of regional white matter diffusion in healthy neonates and adults performed with a 3.0-T head-only MR imaging unit. Radiology. 2003;229:673–681. doi: 10.1148/radiol.2293021462. [DOI] [PubMed] [Google Scholar]
- Zhang J, van Zijl PC, Mori S. Three-dimensional diffusion tensor magnetic resonance microimaging of adult mouse brain and hippocampus. Neuroimage. 2002;15:892–901. doi: 10.1006/nimg.2001.1012. [DOI] [PubMed] [Google Scholar]


