

Abstract
Background
The Sleeping Beauty (SB) transposon system is a non-viral vector system that can integrate precise sequences into chromosomes. We evaluated the SB transposon system as a tool for gene therapy of mucopolysaccharidosis (MPS) types I and VII.
Methods
We constructed SB transposon plasmids for high-level expression of human β-glucuronidase (hGUSB) or α-l-iduronidase (hIDUA). Plasmids were delivered with and without SB transposase to mouse liver by rapid, high-volume tail-vein injection. We studied the duration of expressed therapeutic enzyme activity, transgene presence by PCR, lysosomal pathology by toluidine blue staining and cell-mediated immune response histologically and by immunohistochemical staining.
Results
Transgene frequency, distribution of transgene and enzyme expression in liver and the level of transgenic enzyme required for amelioration of lysosomal pathology were estimated in MPS I and VII mice. Without immunomodulation, initial GUSB and IDUA activities in plasma reached >100-fold of wild-type (WT) levels but fell to background within 4 weeks post-injection. In immunomodulated transposon-treated MPS I mice plasma IDUA persisted for over 3 months at up to 100-fold WT activity in one-third of MPS I mice, which was sufficient to reverse lysosomal pathology in the liver and, partially, in distant organs. Histological and immunohistochemical examination of liver sections in IDUA transposon-treated WT mice revealed inflammation 10 days post-injection consisting predominantly of mononuclear cells, some of which were CD4- or CD8-positive.
Conclusions
Our results demonstrate the feasibility of achieving prolonged expression of lysosomal enzymes in the liver and reversing MPS disease in adult mice with a single dose of therapeutic SB transposons.
Keywords: α-l-iduronidase, β-glucuronidase, immune response, inherited disease, animal model
Introduction
Mucopolysaccharidoses (MPS) are monogenic diseases caused by deficiency of one of several lysosomal hydrolases that participate in degradation of glycosaminoglycans. Lysosomal enzymes are ubiquitously expressed; deficiency of any one of these enzymes results in intralysosomal accumulation of substrate thereby causing development of progressive systemic and central nervous system disease [1]. Enzyme replacement therapy, infusion of a highly purified recombinant enzyme, has proven to be clinically successful for selected lysosomal storage disorders [2] but it is costly and weekly infusions of the therapeutic enzyme are required [3]. Bone marrow transplantation at an early age can prevent many aspects of the disease. However, even using an HLA-matched identical sibling donor this therapy is associated with 10–20% mortality and complications related to graft-versus-host disease [4,5]. Because 5–20% of the fully processed lysosomal enzymes are released from the cytoplasm and taken up by other cells via endocytosis [6], delivery of genes for MPS to a small fraction of cells may provide sufficient enzyme to treat the entire body due to this ‘cross-correction’ [7]. Gene therapy of MPS diseases has been pursued primarily using viral vectors [8,9]. However, the relative ease and lower cost of large-scale production and storage, better amenability to pharmaceutical formulation, and lower toxicity may make non-viral vector systems superior to viral vectors for gene therapy [10].
The Sleeping Beauty (SB) transposon system [11] is a non-viral vector system that can integrate precise sequences into chromosomes. The SB system consists of (i) a transposon containing a gene of interest and (ii) a source of transposase enzyme. During SB-mediated transposition the transposase excises the transposon from a plasmid and inserts it into a chromosome. The integrating ability of SB transposons combines the advantages of plasmid-based vectors with the ability to provide long-term expression of the therapeutic gene [12]. The SB system has been used to successfully treat mice with several genetic disorders including hemophilia [13-15] and fumarylacetoacetate hydrolase deficiency [16]. These diseases are excellent models for gene therapy because a therapeutic benefit can be achieved by inserting a therapeutic gene into relatively few cells in liver [8,9]. Phenotypic correction of MPS similarly requires a relatively low level of therapeutic gene product [8] and therefore is a good candidate for treatment with the SB transposon system.
In this paper, we explore the potential to treat MPS with SB transposons by focusing on murine MPS types VII and I. Murine MPS VII, caused by profound deficiency of β-glucuronidase (GUSB; EC3.2.1.31), is characterized by a phenotype analogous to the human disease [17], a definitive histochemical stain and a sensitive enzyme assay facilitating analysis of gene expression [18]. MPS I mice [19-21], deficient in α-L-iduronidase (IDUA; EC 3.2.1.76), are a model for one of the most common MPS diseases in humans [22-26]. Here we show that the SB system can mediate prolonged expression of lysosomal enzymes to treat MPS disease.
Materials and methods
Plasmids
A transposon for human β-glucuronidase gene (hGUSB) delivery, pT/GUS, was constructed as follows: an EcoRI fragment containing the hGUSB cDNA from pHUG13 (ATCC# 95 658) was inserted between two EcoRI sites in pCAGGS [27]. The resulting cassette consisted of the cytomegalovirus (CMV) immediate-early enhancer plus the chicken β-actin promoter fused to rabbit β-globin intron 1, the GUSB cDNA and rabbit β-globin polyadenylation signal. The entire cassette was excised at the SspI and HindIII sites and inserted between the EcoRV and HindIII sites of pT/BH [28]. Plasmid pSB (pCMVSB10) for transposase expression has been described [11].
A plasmid for co-delivery of both the SB transposase expression cassette and the SB transposon carrying the human α-L-iduronidase gene (hIDUA), pT2/IDUA//UbSB11, was constructed as follows: the full-length hIDUA cDNA was excised from pL1SN [29] and inserted between the EcoRI sites of pmCAGGS, a truncated form of CAGGS containing a shortened intron [14]. The resulting hIDUA expression cassette was excised at the SspI and HindIII sites and inserted between the EcoRV and HindIII sites of pT2/BH [30]. A 180-bp spacer sequence, amplified by polymerase chain reaction (PCR) from the 3′UTR of the human β-globin gene, was inserted into the XhoI site between the transposon and the transposase expression cassette. A PCR-generated ubiquitin C (Ub) promoter spanning bp 11–350 of the human Ub promoter (pUB6/V5-His, Invitrogen, Grand Island, NY, USA) was inserted as a SalI-XhoI fragment into the XhoI site of pT2/BH. A XhoI-SalI fragment containing SB11 [28] and the SV40 poly(A) sequence was inserted into the XhoI at the 3′-end of the Ub promoter. The control plasmid lacked the Ub-SB11 expression cassette. Plasmid pT2/CAGGSGUSB//CMV-SB11 for co-delivery of the SB11 expression cassette and the hGUSB transposon was constructed as follows: a XhoI-SalI fragment containing SB11was inserted into the XhoI site on the pT2/GUS plasmid (pT2/BH-backbone analog of pT/GUS) and the CMV promoter excised from XhoI sites of pCMV-SB11 was then inserted into the XhoI site on the 5′-end of the SB11 fragment.
Mice, injections, blood and tissue collection
Homozygous MPS VII offspring were generated from heterozygous breeding pairs of B6.C-H-2bml/ByBir-gusmps/+ mice (Jackson Laboratories, Bar Harbor, ME, USA). Adult MPS VII mice 6–14 weeks of age were used for injections. MPS I mice (kindly provided by Dr. E. F. Neufeld) were generated from homozygous breeding pairs. Adult and adolescent MPS I mice were used, with some animals injected as early as 4 weeks of age. Wild-type (WT) C57BL/6J 6-week-old mice were purchased from Jackson Laboratories. In each experiment, groups were age- and sex-matched. All mice were maintained under AAALAC-accredited specific pathogen-free conditions. Appropriate amounts of plasmid DNA (see ‘Results’ section for specific amounts) were prepared in Ringer's solution and injected through the tail vein of experimental animals using a hydrodynamics-based procedure as previously described [31,32]. For immunomodulation, mice received either cyclophosphamide [33] or gadolinium chloride (GdCl3) [34] injections. Cyclophosphamide was injected intrperitonally (i.p.) at a dose of 150 mg/kg 24 h before transposon administration and every 2 weeks thereafter ( [33] and Dr. J. R. Ohlfest, personal communication). GdCl3 was injected intravenously (i.v.) at 10 mg/kg, at 30 h and 6 h prior to plasmid injection [34]. Blood was collected by retro-orbital phlebotomy. Mice were euthanized by CO2 inhalation, perfused with saline, and then selected organs were resected and preserved for analyses. Plasma and tissues were stored at −80 °C.
Lysosomal enzyme quantification
IDUA and GUSB activities were measured in tissue homogenates and plasma using 4-methylumbelliferyl-β-d-glucuronide (Sigma) and 4-methylumbelliferyl-α-L-iduronide (Glycosynth, UK), respectively, in fluorometric assays as described [21,35]. Enzymatic activity is expressed as nmol 4-methylumbelliferone released per mg tissue protein per hour (nmol/mg/h) or per ml plasma per hour (nmol/ml/h).
PCR analysis
DNA was isolated from about 50 mg liver specimens by phenol/chloroform extraction [36]. DNA copy number was determined by real-time quantitative PCR using an iCycler instrument (Bio-Rad). Reaction mixtures of 25 μl contained 0.5 μg DNA, 2X IQ™SYBR Green Supermix (Bio-Rad Laboratories, Hercules, CA, USA) and 200 nM of each of forward and reverse primer. PCR conditions were: 95 °C for 2 min followed by 40 cycles of 95 °C for 40 s, 58 °C for 30 s and 72° for 1 min. Mouse glyceraldehyde-3-phosphate dehydrogenase (GAPDH) sequence serves as an internal control of genomic DNA content and was amplified in a separate reaction. The GAPDH standard curve consisted of serial dilutions of mouse genomic DNA. A standard curve for SB transgene was prepared from genomic DNA extracted from a Rosa 26-SB11 transgenic mouse previously shown to contain a single copy of the SB gene [37], serially diluted with DNA from a naïve WT mouse. The standard curve for the IDUA gene was anchored by our detection limit of one copy per 1000 cells, which is congruent with 1 copy/cell 7 days after delivery of the plasmid. The standard curve for the plasmid ‘excision products’ (EP) [38] was obtained by serial dilutions of genomic DNA prepared from livers of mice 24 h after injection with 25 μg of the mock excision plasmid (mockEP). The estimated plasmid copy number of approximately 1000 per cell is based on the quantitative (q)PCR curve that detected down to 0.05 copy/cell. The mockEP was pT2/BH plasmid in which the transposon was deleted between two flanking BamHI sites. All reactions were run in triplicate with the exception of those for GAPDH, which were run in duplicate. The IDUA PCR primers were FP: 5′-ACGTGCTGGTTGTTGTGCTG-3′ from the intron of mCAGGS and RP: 5′CATGGAGACGTTGTCAAAGTCG-3′ from the IDUA cDNA. SB11 primers: 5′-GAA GAA GCC ACT GCT CCA AAA-3′ and 5′-GATCTTTGTCCCCATGTGCTC-3′, GAPDH primers: 5′-TGTCTCCTGCGACTTCAACAGC-3′ and 5′-TGTAGGCCATGAGGTCCACCAC-3′. Primers to amplify the EP were: FP: 5′-CTGGAACAACACTCAACCCT-3′ from the transposon plasmid and RP: 5′-CCCAAGGTTTGAACTAGCTC-3′ from the spacer sequence. Conventional PCR was carried out in 50-μl reaction mixtures containing 100 ng DNA, 5% glycerol, 5% dimethyl sulfoxide (DMSO), 10 pmol each forward and reverse primers, 0.2 mM of each dNTP, 1× PCR buffer A (Invitrogen, Carlsbad, WI, USA), and 5U Taq DNA polymerase (Promega, Madison, WI, USA). PCR conditions were: 95 °C for 5 min, 30 cycles of 95 °C for 40 s, 58 °C for 30 s and 72° for 1 min with a final extension of 7 min at 72 °C. The IDUA PCR primers were as above and yielded a 648-bp product. The murine β-glucuronidase housekeeping gene served as an internal control; its primers were FP: 5′-CTTCGACTGGCCGCTGCT-3′ and RP: 5′-GGCCACAGACCACATCAC-3′ yielding a product of 358 bp. SB primers were FP: 5′-GTACCACGTTCATCTGTAC-3′ and RP: 5′-TCCTGACTGATGTCTTGAG-3′ yielding a product of 539 bp. PCR excision analysis was done in two rounds of amplification with 30 cycles in the first round and 40 cycles in the second round, yielding a 472-bp product. The nested set of cis-construct primers were: FP1: 5′-TGACGTTGGAGTCCACGTTC-3′ and RP1: 5′-GCTGTTGCCAATGTGCA-3′, FP2: 5′-CTGGAACAACACTCAACCCT-3′ and RP 2: 5′-CCCAAGGTTTGAACTAGCTC-3′.
Histology and immunohistochemistry
Histochemical localization of GUSB was performed using AS-BI-naphthol-β-d-glucuronic acid (Sigma, St Louis, MO, USA), as described [18]. Typical staining time was 4 h. For detection of storage vacuoles, tissues were fixed using 2% glutaraldehyde in 0.1 M phosphate buffer (pH 7.4) for 2 h at 4 °C, washed in buffer, postfixed in 1% OsO4 in the same buffer, washed again, dehydrated in a graded series of ethanol followed by propylene oxide and embedded in epoxy resin. Sections were cut at 1 μm and stained with toluidine blue. For evaluation of inflammatory cell infiltrates, 4-μm serial sections were prepared from snap-frozen liver samples embedded in OCT. One section was stained with hematoxylin and eosin (H&E) and two other serial sections were stained for CD4 and CD8 antigens as follows. Sections were fixed in 10% neutral buffered formalin for 10 min at room temperature (RT), treated with glucose oxidase at 37 °C for 1 h (to block endogenous peroxidase), followed by an avidin/biotin block (Dako Corporation, Carpinteria, CA, USA) for 15 min and protein block (Dako serum-free protein block) for 10 min at RT to reduce nonspecific staining. Monoclonal rat anti-mouse CD4 and CD8 primary antibodies (BD Pharmingen, San Diego, CA, USA) were diluted at 1 : 50 and 1 : 10 (respectively) and incubated at RT for 1 h. Binding of primary antibodies was detected using biotinylated rabbit anti-rat secondary antibody (Vector Laboratories, Burlingame, CA, USA) diluted at 1 : 300 and incubated for 20 min at RT followed by streptavidin-horseradish peroxidase (Dako) and diaminobenzidine (Dako). Sections were counterstained with Mayer's hematoxylin (Dako). The primary antibody was substituted with Negative Control SuperSensitive rat serum (BioGenex, San Ramon, CA, USA) for the negative control sections. H&E and IHC sections were evaluated by a pathologist who was blinded to the treatment of mice.
Quantitative image analysis of hGUSB transgene expression and lysosomal storage in MPS VII mouse liver
Stained tissue samples were photographed at 100× magnification using a digital camera (Nikon, Melville, NY, USA). Images were contrast-enhanced so as to clearly delineate image details using Photoshop 6.0 image processing software (Adobe Systems, San Jose, CA, USA). In toluidine blue stained slides, white-colored storage vacuoles were selected by digitally sampling the pixel hue values of a representative vacuole area in the image, followed by auto-selection of contiguous and non-contiguous areas of identical pixel hue values. The initial selection of lysosomal inclusion areas was further refined by manual exclusion of incorrectly selected sample features of similar pixel hue such as vein cross-sections, as well as areas generally exhibiting identical pixel hues to the desired areas, i.e., having particularly bright background light or high contrast occurring as a result of the use of a conventional digital camera with somewhat narrow imaging dynamic range for slide photography. The outlines of the selected areas were then duplicated on a separate image layer and filled in with black color. This separate layer, containing only the selected inclusion areas rendered in black on a white background, was then exported as a bitmap image. The bitmap image of selected areas was analyzed using ImageJ 1.27 [39], and the initial pixel area of the entire image was noted. This measurement remained the same for all images processed and was used to represent 100% of the image area for each sample. The ImageJ software was configured to quantify the pixel area of all individual black objects found in the image, returning a value for each object as a total number of pixels. The total area of all selections in the sample image was calculated as a percentage of the entire image area. In histochemically stained slides, the area of the deeply stained red cells was expressed as a percentage of the whole tissue area, and the identical procedure as described above was used to determine percentage area of GUSB activity.
Results
We constructed transposon vectors to express high levels of hGUSB and hIDUA (Figure 1A) from the CAGGS promoter [14,27]. The expression of each enzyme was tested in primary fibroblast cultures derived from GUSB- or IDUA-deficient mice (not shown), as well as in vivo, by measuring IDUA or GUSB enzyme levels in liver (not shown) and plasma of MPS I or MPS VII deficient mice, respectively, on day 1 or 2 following plasmid injection (Figures 2A and 3). SB transposase expression was confirmed both by Western blotting in HeLa cell lysates 2 days post-transfection (Figure 1C) and by function in the liver using a modified excision assay [38] (data not shown). Because our goal was to determine the efficacy of transposition as a way of providing long-term expression of the transposon cargo, plasmids with control vectors did not contain the SB transposase gene.
Figure 1.
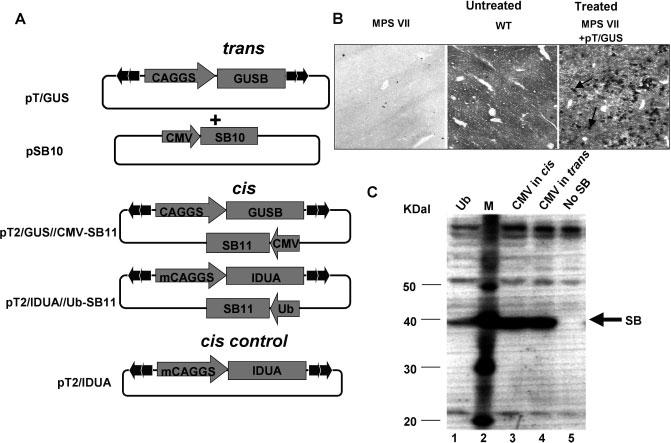
hGUSB and hIDUA transposon vectors. (A) The inverted terminal repeats (ITRs) of the transposon are indicated by arrowheads; pT/GUS contains the complete hGUSB cDNA inserted between two EcoRI sites of the CAGGS polylinker [27]; pSB10 serves as a source for SB transposase in trans [11]. The cis-constructs pT2/IDUA//Ub-SB11 and pT2/GUS//CMV-SB11 contain T2 transposon ITRs and an SB11 expression cassette inserted outside of the transposon; m(mini)CAGGS is a CAGGS version with a shortened intron [14]. (B) Histochemical staining for GUSB in mouse liver frozen sections. Untreated MPS VII (left), WT (middle) and transposon-treated MPS VII mice 2 days after injection of 25 μg pT/GUS (right). Deeply red-stained foci seen in the right panel (indicated by arrows) are GUSB-expressing cells. (C) Western blot demonstrating expression of SB transposase protein using different constructs containing either a strong (CMV) or an intermediate-strength (Ub) promoter. Lane 1, pT2/IDUA//Ub-SB11; lane 2, MagicMark™ XP Western Protein Standard; lane 3, pT2/GUS//CMV-SB11; lane 4, pSB10; lane 5, pT/GUS (no SB)
Figure 2.
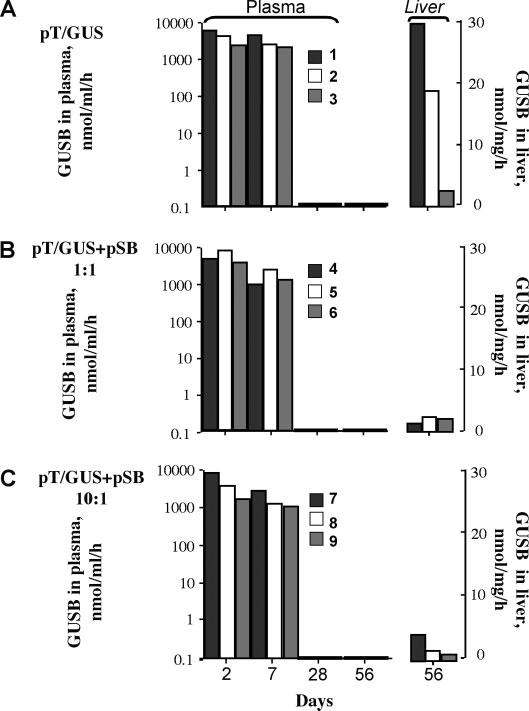
Duration of GUSB expression in SB transposon-treated MPS VII mice. GUSB activity in three treatment groups was assayed in plasma at 2, 7, 28 and 56 days and in the liver at 56 days (8 weeks) post-injection: (A) mice 1–3, transposon pT/GUS alone; (B) mice 4–6, transposon pT/GUS plus pSB10 transposase at equimolar ratio of injected plasmids; (C) mice 7–9, 10 : 1 transposon/transposase plasmid molar ratio. The legend shows mouse numbers
Figure 3.
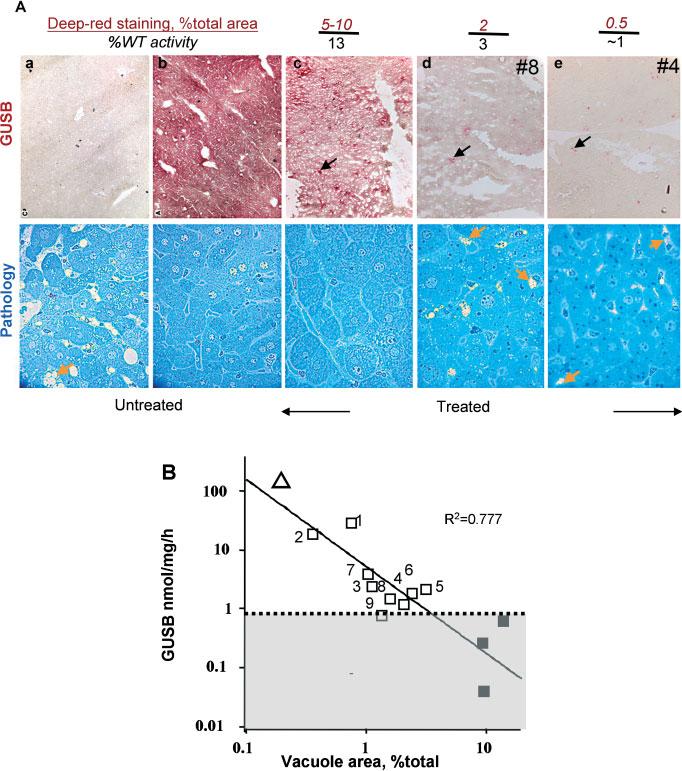
GUSB expression in the liver and hepatic lysosomal pathology 8 weeks after pT/GUS delivery. (A) Top panel: histochemical staining for GUSB in liver sections. The percentage of deep-red stained GUSB-expressing cells was determined by image analysis as described in the ‘Materials and methods’ section. %WT activity was calculated as the percentage of GUSB activity determined by the fluorometric enzyme assay in liver homogenates of the treated mice compared to the WT mean determined in this experiment (measurements are ±0.5% WT). Examples of deeply stained GUSB-positive cells are indicated by black arrows. Bottom panel: lysosomal distention revealed by toluidine blue staining of corresponding livers. Examples of storage vacuoles are indicated by yellow arrows, which show typical lysosomal pathology. (a) untreated MPS VII; (b) WT; (c) MPSVII mouse #2 (treated with pT/GUS; GUSB activity in the liver 18.6 nmol/mg/h); (d, e) representative liver sections from mice #8 and #4, with GUSB activities in liver homogenates of approximately 3% and 1% WT, respectively. (B) Correlation between GUSB activity in liver homogenates and the degree of lysosomal pathology in the corresponding liver. Vacuole area was quantified as described in the ‘Materials and methods’ section. Mouse ID numbers on the plot correspond to those in Figure 2; untreated WT (unfilled large triangle) and MPS VII sham-treated mice (filled squares). All others (unfilled squares) are MPSVII mice treated with pT/GUS transposon with or without pSB10. Shaded area below the dotted line shows background activity due to fluorescence ‘noise’. The solid line is the best fit from linear regression analysis
SB transposon delivery of hGUSB to MPS VII mice
We injected MPS VII mice with 25 μg of pT/GUS and examined the liver 2 days later to obtain an estimate of transfection efficiency. Histochemical staining (Figure 1B) showed deep-red foci in livers of treated mice that constituted about 15–30% of liver tissue. All other cells showed diffuse staining of varying intensity, suggesting that the deeply stained foci were transfected cells producing enzyme that could be taken up by untransduced liver cells.
Our first long-term study with the complete SB system that included both the transposon and the transposase is shown in Figure 2. We co-injected MPS VII mice with pT/GUS and pSB10 at molar ratios of 1 : 1 (Figure 2B, mice 4–6) or 10 : 1 (Figure 2C, mice 7–9) transposon to transposase plasmid. Each mouse received 25 μg of pT/GUS and either 12.5 or 1.25 μg of pSB to make a 1 : 1 or 10 : 1 transposon-to-transposase molar ratio, respectively. Total injected DNA was made equal with a stuffer plasmid, pBluescript, which was added to a final amount of 37.5 μg total plasmids per injection and was also injected into sham-treated MPS VII mice. Two different ratios were evaluated because high transposition rates require an optimal ratio of transposase to transposon that depends on the relative promoter strength in any given cell type [28,40]. Mice 1–3 (Figure 2A) were injected with pT/GUS transposon alone and served as no-transposition controls. Effective gene delivery to mouse liver results in a transient spike of gene expression from unintegrated plasmids, whether the gene is in a transposon or not. At 2 days post-injection plasma GUSB activities in mice were 4000 ± 2100 nmol/ml/h. At 7 days post-injection, plasma GUSB activities were slightly reduced but by 28 days were undetectable in all mice (Figure 2). In the mice treated with pT/GUS alone (mice 1–3), liver activities were 21%, 13% and 2% WT (WT = 145 ± 7 nmol/mg/h), respectively. At 8 weeks post-injection mouse livers were examined for GUSB activity and reduction of lysosomal pathology (Figure 3). Histochemical staining of liver sections revealed a dramatic reduction in the number of positively stained cells compared to the livers observed 2 days post-injection. In mouse #2, 5–10% of liver cells expressing GUSB (deeply stained foci) yielded an overall GUSB activity of 18.6 nmol/mg/h in liver homogenate, about 13% WT activity. All of the liver cells from this mouse appeared to have some GUSB, indicating that the 5–10% of cells that expressed GUSB were sufficient to cross-correct all of the cells in these liver sections. Light microscopy of toluidine blue stained liver sections to evaluate lysosomal pathology showed that the examined specimens of mouse #2 were indistinguishable from those of WT mice (Figure 3A). Remarkably, storage vacuoles were not just prevented from forming, but were actually eliminated. Lysosomal distention becomes apparent generally by 3 weeks of age in untreated MPS VII mice [18]; mouse #2 was 215 days of age when euthanized. The remaining seven treated mice, with residual GUSB levels of about 1–3% WT levels, exhibited approximately 0.2–2% GUSB-expressing cells. However, toluidine blue staining showed reduction in the number of hepatocellular vacuoles (Figure 3A) and the size of the vacuoles in Kupffer cells (not shown). There was an inverse relationship between GUSB expression and lysosomal pathology (Figure 3B). We were surprised that after 8 weeks animals treated with only a transposon carrying hGUSB outperformed those that were treated with the complete SB system, although the size of the treatment groups (n = 3) was too small to draw definitive conclusions. Nevertheless, these experiments testing plasmid-based delivery of hGUSB to MPS VII mice allowed us to obtain an estimate of the distribution of transgene and enzyme expression in liver as well as the level of transgenic hGUSB required for amelioration of lysosomal pathology in the liver. Owing to difficulties in generating MPS VII mice, we evaluated another mouse model of MPS.
Correction of IDUA deficiency in MPS I mice
For more detailed studies of transposon therapy for MPS we used MPS I mice for two reasons: (i) MPS I is much more common in humans than MPS VII [1] and (ii) MPS I knockout mice can be bred by homozygous mating, thus allowing for larger treatment groups in one experiment. We also updated the SB transposon system (T2) and used SB11 transposase to increase the frequency of transposition [28,30]. To ensure simultaneous delivery of transposon and transposase into cells, we engineered cis-vectors in which both the transposon and a transposase expression cassette were on the same plasmid (Figure 1A). To minimize transposase overexpression inhibition [28,40] SB11 was regulated by an intermediate-strength Ub promoter (Figure 1C). Each mouse was injected with a total of 25 μg of either pT2/IDUA//Ub-SB11 or pT2/IDUA plasmid containing a comparable number of molecules, 2.5 × 10¹²; no ‘stuffer’ plasmid was added.
In all MPS I mice treated without immunomodulation, plasma IDUA levels dropped more than 100-fold over the first 2 weeks after reaching as high as >100-fold WT activities on day 1 post-injection (Figures 4A and 4B). IDUA activity was below the detection limit in the livers of these mice after 3 months with or without transposase. Since expression of clotting factor IX and human alpha-1 antitrypsin genes [13,40] as well as luciferase [41] persisted for months when delivered in SB transposons to the liver, the loss of GUSB and IDUA expression suggested that an immune response was interfering with their continued presence in the treated animals.
Figure 4.
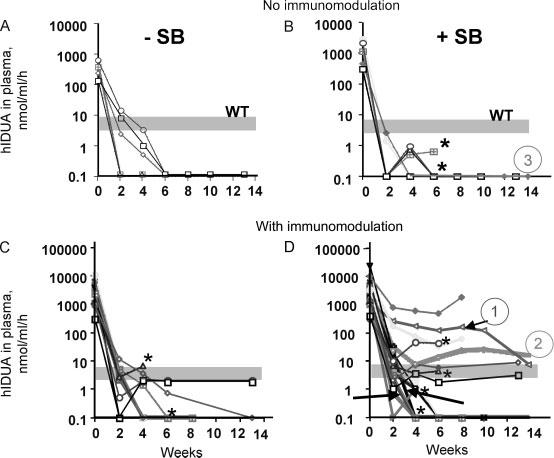
Duration of IDUA expression in treated MPS I mice. MPS I mice were hydrodynamically injected with either pT2/IDUA, which lacks an SB transposase gene (A, C), or with pT2/IDUA//Ub-SB11 (B, D). Blood was collected by retro-orbital phlebotomy on day 1 and every 2 weeks post-injection for quantifying IDUA activity in plasma. Mice in (A) and (B) were not immunomodulated. Mice in (B) show the pooled results from two experiments, 13 and 14 weeks in duration. (C) Results of two experiments, 8 and 13 weeks in duration, in which all mice were immunosuppressed with cyclophosphamide. (D) Pooled results from three experiments, 8, 13 and 14 weeks. The wide, shaded grey bar shows the range of IDUA activity in WT plasma. The arrows in (D) indicate three mice that were administered GdCl3 pretreatment. Asterisks indicate mice that died. Mice that were analyzed in more detail are indicated by circled numbers with the same colors as the lines on the graph. Mouse 1 (red) and mouse 2 (green, thick green line) in (D) were immunomodulated with GdCl3 and cyclophosphamide, respectively. Mouse 3 (pink) in (B) was not immunomodulated. In summary, out of a total of 22 mice in (D), 17 were immunosuppressed with cyclophosphamide and 5 mice (30% of surviving 18 mice) exhibited long-term expression. Two of these mice died 4 weeks post-injection, and two mice died 6 weeks post-injection following retro-orbital bleeding. Three mice in (D) (arrows) were pretreated with GdCl3; one of these mice exhibited long-term expression, all survived throughout the duration of the experiment
Immunomodulation leads to prolonged IDUA expression and correction of pathology
We treated mice with either immunosuppressant cyclophosphamide [33] or GdCl3 that transiently depletes macrophages [34] to modulate the immune response in recipient animals. We followed plasma IDUA levels of hydrodynamically injected MPS I mice in three experiments with durations of 8, 13 and 14 weeks (Figure 4). Several mice (indicated by asterisks) died during retro-orbital blood collection over the course of these experiments. The composite data from all three experiments show a clear trend of increased long-term IDUA expression in immunomodulated mice treated with the full SB transposon system comprising transposon plus transposase. None of the mice treated without SB transposase achieved WT levels of IDUA expression after 6 weeks. At 6 weeks post-injection 3 of 11 mice injected with the IDUA transposon without the transposase gene exhibited residual activities of about 40% WT and 2 of 11 continued to express low levels of IDUA until sacrificed at 13 weeks (Figure 4C). In contrast, 6 of 18 MPS I animals treated with IDUA transposon with SB transposase expressed WT or greater levels of IDUA up to 8 weeks post-injection (Figure 4D). Thus, prolonged, high-level IDUA expression was attained in some immunomodulated mice only when the full SB transposon system was provided.
We conducted detailed examinations of two of the SB-transposase-treated, immuno-modulated MPS I mice (mice 1 and 2 in Figure 4D) that maintained high levels of IDUA expression for 14 weeks and of mouse 3 (Figure 4B), which was not immunomodulated and lost IDUA expression within 4 weeks post-injection. Although in the GdCl3-pretreated mouse 1 IDUA activity was equal to WT at the endpoint blood collection, this level was reduced approximately 20-fold compared to the levels measured in this mouse between 2 and 10 weeks post-treatment, suggesting the emergence of an immune response or abrupt termination of transgene expression. Toluidine blue staining (Figure 5) showed correction of lysosomal distention that was complete and near-complete at 14 weeks in examined liver and spleen specimens of mice 1 and 2, respectively. There was partial correction in the kidney and, to a lesser extent, in the lung (not shown). In the organs of mouse 3, the absence of detectable IDUA activity was paralleled by extreme lysosomal distention.
Figure 5.
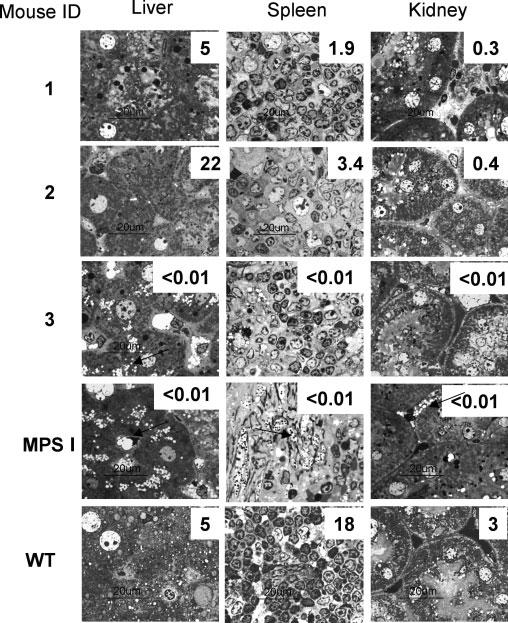
Correction of lysosomal pathology in parenchymal organs of MPS I mice 14 weeks after IDUA gene delivery. Light microscopy of representative toluidine blue stained sections at 1000× magnification. Arrows point to examples of lysosomal pathology represented by cytoplasmic vacuolation. ID numbers indicate mice discussed in the text. Plasma IDUA levels for individual mice are shown in Figures 4B and 4D. Numbers superimposed on tissue sections indicate IDUA residual activity in nmol/mg/h in the homogenate prepared from the indicated organ. Magnification bars = 20 μm
Conventional PCR (Figure 6A, left panel) showed the presence of the hIDUA gene sequences in mouse 2, which was consistent with stable IDUA expression at 14 weeks post-injection. PCR signals from the SB transgene, as well as the excision product (EP is the plasmid left behind following excision of the IDUA transposon), were also present in this mouse. EP, a measure of overall transposition, was initially assayed by two rounds of PCR amplification to ensure detection of any products; this resulted in an overamplified band for mouse 2 (see right panel and PCR in Figure 6B for a more accurate indication). In comparison, mouse 1 exhibited a fainter IDUA band; SB and EP were below minimal detection. No PCR products were detected in mouse 3 which lost IDUA expression by 4 weeks post-injection. Copy numbers estimated by real-time qPCR (Figure 6B) were: for SB, 1.3 ± 0.1 and 7.2 ± 0.1 plasmids per 100 cells in mice 1 and 2, respectively, and for IDUA, 0.34 ± 0.1 and 7.2 ± 3.5 copies per 100 cells, respectively. The SB and IDUA genes were delivered on the same plasmid, thus we expected the two sets of data to be close. Nevertheless, because the absolute numbers for qPCR are dependent on a number of amplification parameters, some variation is expected, which we see. Importantly, the relative differences in copy number between mice 1 and 2 are nearly the same, which validates the two sets of measurements. EP was reproducibly detected only in mouse 2 at a frequency of 2 ± 0.6 copies per 100 cells. In mouse 3 the values for all the three amplified target sequences were in the range of WT mouse DNA controls, i.e., hIDUA < 0.01, SB < 0.1 and EP < 1 copy per 100 cells (Figure 6B). Thus, IDUA activity paralleled the presence of the gene and products of the input transposon-containing plasmid.
Figure 6.
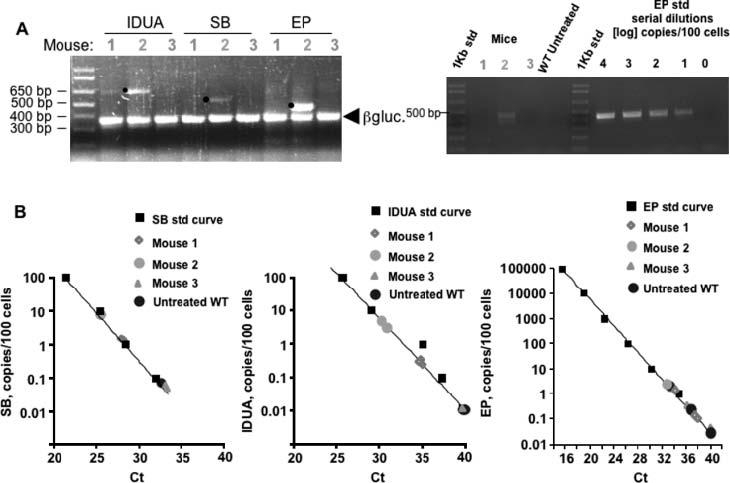
Transgene maintenance in treated MPS I mice. (A) Left, conventional PCR for the hIDUA and SB transgenes and plasmid excision product (EP) from transposition using 100 ng total liver DNA isolated from mouse 1 (immunomodulated with GdCl3), mouse 2 (immunosuppressed with cyclophosphamide) and mouse 3 (not immunomodulated) shown in Figure 4. All of these mice were treated with pT2/IDUA//Ub-SB11 transposon in cis and sacrificed 14 weeks post-injection. Mouse 1 maintained stable IDUA activity between 2 and 10 weeks post-injection, but at 14 weeks IDUA activity declined approximately 20-fold. Mouse 2 maintained stable IDUA levels throughout the duration of the experiment while mouse 3 lost IDUA activity in plasma by 4 weeks post-injection. Plasma IDUA levels for individual mice are shown in (B) and (D). Note that EP was amplified in two rounds of PCR, the photo showing the product of secondary amplification using nested primers as described in the ‘Materials and methods’ section. Murine genomic β-glucuronidase was co-amplified as an internal control. Bullets indicate products of expected sizes for each set of PCR primers. Right, EP DNA from mice 1, 2 and 3 and serial dilution curve made with genomic DNA isolated from mouse liver 24 h after rapid high-volume tail-vein injection of 25 μg of the mock EP plasmid at the end-point of real-time PCR (40 cycles), resolved by 1% agarose gel electrophoresis. (B) qPCR quantification of SB and IDUA genes and EP plasmids. Standard curves were obtained using cells that contained either one copy of IDUA or SB gene or 1000 EP plasmids per cell. The log concentrations of the samples are plotted against the threshold cycle number (Ct). Linear regression analysis is shown as a solid line. Experimental Ct values for mice 1, 2 and 3, as well as the standard curve, were obtained in the same PCR run. All reactions were run in triplicate
Assessment of inflammatory response in the liver
The data in Figure 4 suggested the presence of an aggressive immune response against IDUA-expressing cells. Hence, we examined the livers of immunocompetent C57BL/6 mice treated with either pT2/IDUA//UbSB11 or phosphate-buffered saline (PBS) (sham-treated) for histological evidence of inflammation (Figure 7A). Evaluation of H&E sections revealed a few small inflammatory cell aggregates in the livers of mice at 10 and 14 days, but not at 7 days post-injection or in PBS-treated mice. Inflammatory cell aggregates consisted of mononuclear cells, presumably lymphocytes, admixed with fewer neutrophils (Figure 7B). Loss of hepatocytes and/or the presence of single hepatocytes with apoptotic morphology (pyknotic nucleus, rounded cytoplasmic margins) were frequently observed within inflammatory cell aggregates. Inflammatory cell aggregates were not seen in the livers of mice treated with PBS. A small proportion of inflammatory cells with mononuclear morphology were positive for CD4 antigen and occasional cells were positive for CD8 antigen, confirming the presence of T-lymphocytes within inflammatory cell aggregates and strongly suggesting that a cell-mediated immune response may be involved in the loss of transgene-expressing hepatocytes in immunocompetent mice.
Figure 7.
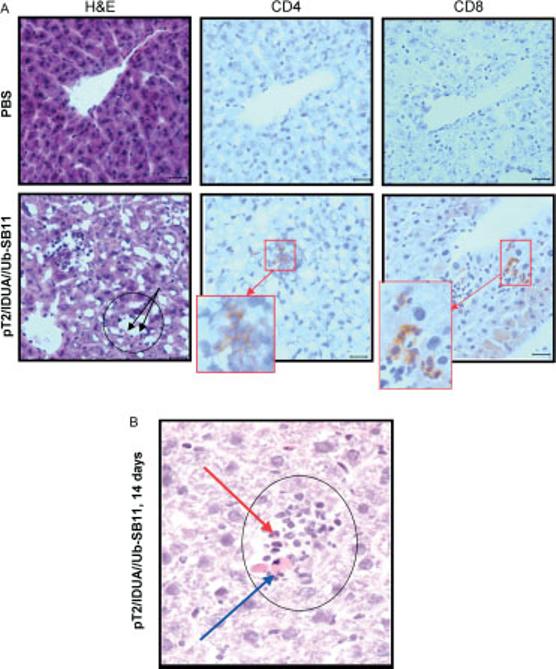
Inflammatory infiltrates in hIDUA transposon-treated mice. pT2/hIDUA//Ub-SB11 (25 μg, bottom panels) was hydrodynamically injected into WT C57BL/6 mice with PBS-administered animals serving as controls (top panels). Serial 4-μm sections from each liver were analyzed for the presence of inflammation and loss of hepatocytes (H&E stain), and for the presence of CD4+ and CD8+ lymphocytes (IHC). Black circles indicate inflammatory cell aggregates. Blue arrow points to apoptotic hepatocytes; red arrow indicates a neutrophil in the H&E section. Magnification bars = 25 μm. (A) Representative examples of liver sections 10 days post-injection. CD4- or CD8-positive lymphocytes (brownish-red cells) in the IHC sections counterstained with hematoxylin are outlined and shown at higher magnification (inserts in red boxes). (B) A representative example of an inflammatory infiltrate (14 days post-injection)
Discussion
Gene therapy of lysosomal storage diseases, including MPS, requires sustained expression of the therapeutic gene. Non-viral vector systems have been questioned ‘as a stand-alone therapy’ for these disorders, in part due to the transient nature of plasmid-based expression of the therapeutic gene [42]. The Sleeping Beauty (SB) transposon system combines the ability to integrate genes into chromosomes for prolonged expression with the advantages of plasmid-based vectors. Ease of formulation, quality control, storage and shipment are characteristics that will be important for treating significant populations of patients.
Expression of hIDUA from a plasmid-based vector in MPS I mouse for 14 days has been recently reported [43]. This is not customarily considered ‘long-term’, because transient activity persists over this period. However, our goal was prolonged IDUA expression. In the same mouse model, our study demonstrates for the first time a high level of expression lasting up to more than 3 months (Figure 4D). In adult immunomodulated MPS I mice, delivery of the SB transposon and transposase-encoding plasmid to the liver by rapid tail-vein injection resulted in persistent expression of human IDUA enzyme in one-third of the treated animals. Notably, in all but one mouse, the sustained IDUA activities in plasma were high, ranging between WT and 100-fold WT levels. In contrast, in the absence of transposase, only about 20% of the immunosuppressed mice exhibited maintained expression, and these levels did not exceed 40% WT. Our assay for the excision product (EP, Figure 6) demonstrated that transposition activity mobilized IDUA transposons in mouse liver. The transgene copy number in cyclophosphamide-immunosuppressed mice (e.g., mouse 2, Figures 4D and 6) was up to 7 per 100 cells, resulting in the treated liver expressing hIDUA at WT activity level. In mouse 1 that exhibited reduced IDUA activity at 14 weeks post-injection (Figures 4D and 6), only about 1% of cells contained transgenes at the time of analysis. Neither transgenes nor transgene products were detected without immunomodulation (mouse 3, Figures 4B and 6).
Our studies with MPS VII mice allowed us to determine the efficiency of gene transfer to hepatocytes by hydrodynamic injection, which was up to 15–30% (Figure 3A), similar to the results of Yant et al. [13] and Wilber et al. [45]. Eight weeks post-injection, about 5–10% of transfected liver cells in one treated mouse (Figure 2B) were still able to provide enzymatic cross-correction to the whole liver, yielding GUSB activity in total liver homogenates equal to about 13% WT activity and complete or close to complete correction of lysosomal pathology. In other mice, approximately 2% and 0.5% transfected cells yielded GUSB activity in the liver about 3% and 1% WT, respectively, which resulted in partial correction of liver pathology. In adult MPS I mice, prolonged IDUA expression at WT levels reduced storage in parenchymal organs with complete and near-complete correction of storage in liver and spleen, respectively.
Recent advances in preclinical gene therapy of MPS I have been impressive. In adult MPS I mice, Zheng et al. [20] and Jordan et al. [26] demonstrated significant biochemical and histological improvements, as well as normalization of ventricular function after transplantation with retrovirally transduced syngeneic bone marrow. Using either adeno-associated virus [21] or lentiviral vector [23] to deliver therapeutic IDUA genes to newborn mice, persistent high-level IDUA expression over several months was observed in the liver, heart, lung and brain with subsequent curative impact on several of the most important parameters of the disease, including reduced storage vacuoles in a number of tissues, reduced glycosaminoglycan excretion, prevention of craniofacial abnormalities and behavioral abnormalities. Using a single injection of retroviral vector in neonates Liu et al. [24] demonstrated sustained supra-normal IDUA expression in the liver throughout an 8-month experiment which resulted in prevention of major clinical manifestations of MPS I including cardiac and bone disease, hearing loss and vision abnormalities. The latter study demonstrated the effectiveness of targeting hepatocytes. Stable serum IDUA activities at about 10-fold WT were partially curative, but with 100-fold WT levels, profound correction of MPS I disease was achieved. Our most important finding is that in adult mice we can achieve sustained expression in the liver at levels comparable to those shown in studies that used viral vectors. Our results using a transposon-mediated approach show that with immunomodulation the sustained transgenic IDUA activity in adult mice can reach as high as 100-fold WT level. However, we were unable to prevent immune responses completely in all mice. This is the most likely explanation for the wide variation of transgenic IDUA activities that we observed in mice treated with the complete transposon system (Figure 4D). With a better protocol for immunomodulation, we expect to attain predictably high IDUA expression levels in all mice.
The surprising finding that animals treated with just a transposon carrying hGUSB outperformed those that were treated with the complete SB system (Figure 2) was the first suggestion that some biological response was suppressing prolonged expression of newly synthesized hGUSB. Although the number of animals that maintained GUSB activity 8 weeks post-injection (n = 2) was too small to be significant, we speculate that liver cells exhibiting prolonged high hGUSB expression levels due to transgene integration elicited a strong immune response and were eliminated, while the lower expression levels from unintegrated plasmid were insufficient to induce an equally efficient immune response.
Cell-mediated immune responses can be expected, particularly when the hydrodynamic approach results in overexpression of the transgenic protein regulated by a strong promoter. Although this technique delivers DNA primarily to the liver and expression levels in other organs are low (1–0.1% those in the liver [31,46], and Dr. Andy Wilber, University of Minnesota, personal communication), equally high levels of transgenic IDUA or GUSB enzyme, exceeding WT levels in these organs by over 10-fold, persist in the spleen, for almost a week post-injection (not shown). This could expose antigen-presenting cells both in the liver and in the spleen to massive amounts of transgenic enzyme.
Transgene-specific host immune responses following somatic gene transfer, both humoral and cell-mediated, have been described (e.g., [47-49]). Our study affirms that this serious issue needs to be addressed even in the case of naked DNA delivery. Without immunomodulation, liver cells that harbored the transgene disappeared for the most part by 4–6 weeks post-injection, with or without SB transposase. This loss was supported by observation of a low number of small inflammatory cell infiltrates composed of predominantly mononuclear cells and a few neutrophils surrounding either morphologically apoptotic/necrotic hepatocytes or round holes, ‘hepatocyte dropouts’ in the livers of plasmid-injected mice, but not in PBS-injected mice. The onset of infiltrates appeared to be time-dependent. Only some of the mononuclear cells in the infiltrates were CD4- and CD8-positive lymphocytes. Other types of mononuclear cells within these inflammatory foci have yet to be characterized. The presence of neutrophils may be due to their attraction to the sites of cellular necrosis.
Elucidating the mechanisms by which transgenic cells are eliminated will be needed to develop approaches that will allow their retention. With validation that the SB transposon system can provide long-term correction of MPS diseases without the use of viral vectors, we now must develop methods for counteracting immune and other protective responses of the host. In this context the prospects for non-viral gene therapy of MPS diseases are quite encouraging.
Acknowledgements
We thank Aric Frantz and Anne Undersander for IHC staining of frozen liver sections, Patrycja J. Lech for instruction on real-time PCR, Drs. Aron M. Geurts for sharing plasmid constructs pCMVSB11 and pmCAGGS, John R. Ohlfest for Western blotting, and Irina Nesmelova and Andy Wilber for helpful discussions. This project was supported by grants from the National Institutes of Health (NIH, PO1-HD32652), the Arnold and Mabel Beckman Foundation, the National MPS USA Society Fellowship grant (ELA), and the Viking Children's Fund (ELA).
References
- 1.Neufeld EF, Muenzer J. The mucopolysaccharidoses. In: Scriver CR, Beaudet AL, Sly WS, et al., editors. The Metabolic and Molecular Bases of Inherited Disease. 8th edn III. McGraw-Hill; New York: 2001. pp. 3427–3436. [Google Scholar]
- 2.Sly WS. Enzyme replacement therapy: from concept to clinical practice. Acta Paediatr Suppl. 2002;91:71–78. doi: 10.1111/j.1651-2227.2002.tb03115.x. [DOI] [PubMed] [Google Scholar]
- 3.Wraith JE. Limitations of enzyme replacement therapy: current and future. J Inherit Metab Dis. 2006;29:442–447. doi: 10.1007/s10545-006-0239-6. [DOI] [PubMed] [Google Scholar]
- 4.Whitley CB, Belani KG, Chang PN, et al. Long-term outcome of Hurler syndrome following bone marrow transplantation. Am J Med Genet. 1993;46:209–218. doi: 10.1002/ajmg.1320460222. [DOI] [PubMed] [Google Scholar]
- 5.Krivit W, Aubourg P, Shapiro E, Peters C. Bone marrow transplantation for globoid cell leukodystrophy, adrenoleukodystrophy, metachromatic leukodystrophy, and Hurler syndrome. Curr Opin Hematol. 1999;6:377–382. doi: 10.1097/00062752-199911000-00004. [DOI] [PubMed] [Google Scholar]
- 6.Kornfeld S. Trafficking of lysosomal enzymes. FASEB J. 1987;1:462–468. doi: 10.1096/fasebj.1.6.3315809. [DOI] [PubMed] [Google Scholar]
- 7.Neufeld EF, Fratantoni JC. Inborn errors of mucopolysaccharide metabolism. Science. 1970;169:141–146. doi: 10.1126/science.169.3941.141. [DOI] [PubMed] [Google Scholar]
- 8.Sands MS, Davidson BL. Gene therapy for lysosomal storage diseases. Mol Ther. 2006;13:839–849. doi: 10.1016/j.ymthe.2006.01.006. [DOI] [PubMed] [Google Scholar]
- 9.Hodges BL, Cheng SH. Cell and gene-based therapies for the lysosomal storage diseases. Curr Gene Ther. 2006;6:227–241. doi: 10.2174/156652306776359522. [DOI] [PubMed] [Google Scholar]
- 10.Essner JJ, McIvor RS, Hackett PB. Awakening gene therapy with Sleeping Beauty transposons. Curr Opin Pharmacol. 2005;5:513–519. doi: 10.1016/j.coph.2005.04.015. [DOI] [PubMed] [Google Scholar]
- 11.Ivics Z, Hackett PB, Plasterk RH, Izsvak Z. Molecular reconstruction of Sleeping Beauty, a Tc1-like transposon from fish, and its transposition in human cells. Cell. 1997;91:501–510. doi: 10.1016/s0092-8674(00)80436-5. [DOI] [PubMed] [Google Scholar]
- 12.Hackett PB, Ekker SC, Largaespada DA, McIvor RS. Sleeping Beauty transposon-mediated gene therapy for prolonged expression. Adv Genet. 2005;54:189–232. doi: 10.1016/S0065-2660(05)54009-4. [DOI] [PubMed] [Google Scholar]
- 13.Yant SR, Meuse L, Chiu W, Ivics Z, Izsvak Z, Kay MA. Somatic integration and long-term transgene expression in normal and haemophilic mice using a DNA transposon system. Nat Genet. 2000;25:35–41. doi: 10.1038/75568. [DOI] [PubMed] [Google Scholar]
- 14.Ohlfest JR, Frandsen JL, Fritz S, et al. Phenotypic correction and long-term expression of factor VIII in hemophilic mice by immunotolerization and nonviral gene transfer using the Sleeping Beauty transposon system. Blood. 2005;105:2691–2698. doi: 10.1182/blood-2004-09-3496. [DOI] [PubMed] [Google Scholar]
- 15.Liu L, Mah C, Fletcher BS. Sustained FVIII expression and phenotypic correction of hemophilia A in neonatal mice using an endothelial-targeted Sleeping Beauty transposon. Mol Ther. 2006;13:1006–1015. doi: 10.1016/j.ymthe.2005.11.021. [DOI] [PubMed] [Google Scholar]
- 16.Montini E, Held PK, Noll M, et al. In vivo correction of murine tyrosinemia type I by DNA-mediated transposition. Mol Ther. 2002;6:759–769. doi: 10.1006/mthe.2002.0812. [DOI] [PubMed] [Google Scholar]
- 17.Birkenmeier EH, Davisson MT, Beamer WG, et al. Murine mucopolysaccharidosis type VII. Characterization of a mouse with beta-glucuronidase deficiency. J Clin Invest. 1989;83:1258–1266. doi: 10.1172/JCI114010. [DOI] [PMC free article] [PubMed] [Google Scholar]
- 18.Wolfe JH, Sands MS. Murine mucopolysaccharidosis type VII: a model system for somatic gene therapy for the central nervous system. In: Lowenstein PR, Enquist LW, editors. Protocols for Gene Transfer in Neuroscience: Towards Gene Therapy of Neurological Disorders. John Wiley; Chichester: 1996. pp. 263–274. [Google Scholar]
- 19.Clarke LA, Russell CS, Pownall S, et al. Murine mucopolysaccharidosis type I: targeted disruption of the murine alpha-l-iduronidase gene. Hum Mol Genet. 1997;6:503–511. doi: 10.1093/hmg/6.4.503. [DOI] [PubMed] [Google Scholar]
- 20.Zheng Y, Rozengurt N, Ryazantsev S, Kohn DB, Satake N, Neufeld EF. Treatment of the mouse model of mucopolysaccharidosis I with retrovirally transduced bone marrow. Mol Genet Metab. 2003;79:233–244. doi: 10.1016/s1096-7192(03)00116-1. [DOI] [PubMed] [Google Scholar]
- 21.Hartung SD, Frandsen JL, Pan D, et al. Correction of metabolic, craniofacial, and neurologic abnormalities in MPS I mice treated at birth with adeno-associated virus vector transducing the human alpha-L-iduronidase gene. Mol Ther. 2004;9:866–875. doi: 10.1016/j.ymthe.2004.03.011. [DOI] [PubMed] [Google Scholar]
- 22.Di Domenico C, Villani GR, Di Napoli D, et al. Gene therapy for a mucopolysaccharidosis type I murine model with lentiviral-IDUA vector. Hum Gene Ther. 2005;16:81–90. doi: 10.1089/hum.2005.16.81. [DOI] [PubMed] [Google Scholar]
- 23.Kobayashi H, Carbonaro D, Pepper K, et al. Neonatal gene therapy of MPS I mice by intravenous injection of a lentiviral vector. Mol Ther. 2005;11:776–789. doi: 10.1016/j.ymthe.2004.10.006. [DOI] [PubMed] [Google Scholar]
- 24.Liu Y, Xu L, Hennig AK, et al. Liver-directed neonatal gene therapy prevents cardiac, bone, ear, and eye disease in mucopolysaccharidosis I mice. Mol Ther. 2005;11:35–47. doi: 10.1016/j.ymthe.2004.08.027. [DOI] [PubMed] [Google Scholar]
- 25.Watson G, Bastacky J, Belichenko P, et al. Intrathecal administration of AAV vectors for the treatment of lysosomal storage in the brains of MPS I mice. Gene Ther. 2006;13:917–925. doi: 10.1038/sj.gt.3302735. [DOI] [PubMed] [Google Scholar]
- 26.Jordan MC, Zheng Y, Ryazantsev S, Rozengurt N, Roos KP, Neufeld EF. Cardiac manifestations in the mouse model of mucopolysaccharidosis I. Mol Genet Metab. 2005;86:233–243. doi: 10.1016/j.ymgme.2005.05.003. [DOI] [PMC free article] [PubMed] [Google Scholar]
- 27.Akagi Y, Isaka Y, Akagi A, et al. Transcriptional activation of a hybrid promoter composed of cytomegalovirus enhancer and beta-actin/beta-globin gene in glomerular epithelial cells in vivo. Kidney Int. 1997;51:1265–1269. doi: 10.1038/ki.1997.172. [DOI] [PubMed] [Google Scholar]
- 28.Geurts AM, Yang Y, Clark KJ, et al. Gene transfer into genomes of human cells by the sleeping beauty transposon system. Mol Ther. 2003;8:108–117. doi: 10.1016/s1525-0016(03)00099-6. [DOI] [PubMed] [Google Scholar]
- 29.Pan D, Aronovich E, McIvor RS, Whitley CB. Retroviral vector design studies toward hematopoietic stem cell gene therapy for mucopolysaccharidosis type I. Gene Ther. 2000;7:1875–1883. doi: 10.1038/sj.gt.3301298. [DOI] [PubMed] [Google Scholar]
- 30.Cui Z, Geurts AM, Liu G, Kaufman CD, Hackett PB. Structure-function analysis of the inverted terminal repeats of the Sleeping Beauty transposon. J Mol Biol. 2002;318:1221–1235. doi: 10.1016/s0022-2836(02)00237-1. [DOI] [PubMed] [Google Scholar]
- 31.Liu F, Song Y, Liu D. Hydrodynamics-based transfection in animals by systemic administration of plasmid DNA. Gene Ther. 1999;6:1258–1266. doi: 10.1038/sj.gt.3300947. [DOI] [PubMed] [Google Scholar]
- 32.Zhang G, Budker V, Wolff JA. High levels of foreign gene expression in hepatocytes after tail vein injections of naked plasmid DNA. Hum Gene Ther. 1999;10:1735–1737. doi: 10.1089/10430349950017734. [DOI] [PubMed] [Google Scholar]
- 33.Joos K, Yang Y, Wilson JM. Cyclophosphamide diminishes inflammation and prolongs transgene expression following delivery of adenoviral vectors to mouse liver and lung. Hum Gene Ther. 1996;20:1555–1566. doi: 10.1089/hum.1996.7.13-1555. [DOI] [PubMed] [Google Scholar]
- 34.van Til NP, Markusic DM, van der Rijt R, et al. Kupffer cells and not liver sinusoidal endothelial cells prevent lentiviral transduction of hepatocytes. Mol Ther. 2005;11:26–34. doi: 10.1016/j.ymthe.2004.09.012. [DOI] [PubMed] [Google Scholar]
- 35.Glaser JH, Sly WS. Beta-glucuronidase deficiency mucopolysaccharidosis: methods for enzymatic diagnosis. J Lab Clin Med. 1973;82:969–977. [PubMed] [Google Scholar]
- 36. Available: www.molecularcloning.com.
- 37.Dupuy AJ, Akagi K, Largaespada DA, Copeland NG, Jenkins NA. Mammalian mutagenesis using a highly mobile somatic Sleeping Beauty transposon system. Nature. 2005;436:221–226. doi: 10.1038/nature03691. [DOI] [PubMed] [Google Scholar]
- 38.Liu G, Aronovich EL, Cui Z, Whitley CB, Hackett PB. Excision of Sleeping Beauty transposons: parameters and applications to gene therapy. J Gene Med. 2004;6:574–583. doi: 10.1002/jgm.486. [DOI] [PMC free article] [PubMed] [Google Scholar]
- 39. Available: http://rsb.info.nih.gov/ij/.
- 40.Mikkelsen JG, Yant SR, Meuse L, Huang Z, Xu H, Kay MA. Helper-independent Sleeping Beauty transposon-transposase vectors for efficient nonviral gene delivery and persistent gene expression in vivo. Mol Ther. 2003;8:654–665. doi: 10.1016/s1525-0016(03)00216-8. [DOI] [PubMed] [Google Scholar]
- 41.Ohlfest JR, Lobitz PD, Perkinson SG, Largaespada DA. Integration and long-term expression in xenografted human glioblastoma cells using a plasmid-based transposon system. Mol Ther. 2004;10:260–268. doi: 10.1016/j.ymthe.2004.05.005. [DOI] [PubMed] [Google Scholar]
- 42.Przybylska M, Wu IH, Zhao H, et al. Partial correction of the alpha-galactosidase A deficiency and reduction of glycolipid storage in Fabry mice using synthetic vectors. J Gene Med. 2004;6:85–92. doi: 10.1002/jgm.468. [DOI] [PubMed] [Google Scholar]
- 43.Camassola M, Braga LM, Delgado-Canedo A, et al. Nonviral in vivo gene transfer in the mucopolysaccharidosis I murine model. J Inherit Metab Dis. 2005;28:1035–1043. doi: 10.1007/s10545-005-0070-5. [DOI] [PubMed] [Google Scholar]
- 44.•Geurts AM, Hackett CS, Bell JB, et al. Structure-based prediction of insertion-site preferences of transposons into chromosomes. Nucleic Acids Res. 2006;34:2803–2811. doi: 10.1093/nar/gkl301. [DOI] [PMC free article] [PubMed] [Google Scholar]
- 45.Wilber A, Frandsen JL, Wangensteen KJ, Ekker SC, Wang X, McIvor RS. Dynamic gene expression after systemic delivery of plasmid DNA as determined by in vivo bioluminescent imaging. Hum Gene Ther. 2005;16:1325–1332. doi: 10.1089/hum.2005.16.1325. [DOI] [PubMed] [Google Scholar]
- 46.Herweijer H, Wolff JA. Progress and prospects: naked DNA gene transfer and therapy. Gene Ther. 2003;10:453–458. doi: 10.1038/sj.gt.3301983. [DOI] [PubMed] [Google Scholar]
- 47.Shull R, Lu X, Dube I, et al. Humoral immune response limits gene therapy in canine MPS I. Blood. 1996;88:377–379. [PubMed] [Google Scholar]
- 48.Lutzko C, Kruth S, Abrams-Ogg AC, et al. Genetically corrected autologous stem cells engraft, but host immune responses limit their utility in canine alpha-L-iduronidase deficiency. Blood. 1999;93:1895–1905. [PubMed] [Google Scholar]
- 49.Franco LM, Sun B, Yang X, et al. Evasion of immune responses to introduced human acid alpha-glucosidase by liver-restricted expression in glycogen storage disease type II. Mol Ther. 2005;12:876–884. doi: 10.1016/j.ymthe.2005.04.024. [DOI] [PubMed] [Google Scholar]