

Abstract
Autosomal dominant polycystic kidney disease (ADPKD) is a common genetic disease of the kidney, characterized by cystic enlargement of renal tubules, aberrant epithelial proliferation, and ion and fluid secretion into the lumen. Previous studies have shown abnormalities in polarization of membrane proteins, including mislocalization of the NaK-ATPase to the apical plasma membranes of cystic epithelia. Apically located NaK-ATPase has previously been shown to be fully functional in vivo and in membrane-grown ADPKD epithelial cells in vitro, where basal-to-apical 22Na transport was inhibited by application of ouabain to the apical membrane compartment. Studies were conducted with polymerase chain reaction-generated specific riboprobes and polyclonal peptide antibodies against human sequences of α1, α3, β1, and β2 subunits of NaK-ATPase. High levels of expression of α1 and β1 messenger RNA were detected in ADPKD and age-matched normal adult kidneys in vivo, whereas β2 messenger RNA was detected only in ADPKD kidneys. Western blot analysis and immunocytochemical studies showed that, in normal adult kidneys, peptide subunit-specific antibodies against α1 and β1 localized to the basolateral membranes of normal renal tubules, predominantly thick ascending limbs of Henle’s loop. In ADPKD kidneys, α1 and β2 subunits were localized to the apical epithelial cell membranes, whereas β1 was distributed throughout the cytoplasm and predominantly in the endoplasmic reticulum, but was not seen associated with cystic epithelial cell membranes or in cell membrane fractions. Polarizing, renal-derived epithelial Madin Darby canine kidney cells, stably expressing normal or N-terminally truncated chicken β1 subunits, showed selective accumulation in the basolateral Madin Darby canine kidney cell surface, whereas c-myc epitope-tagged chicken β2 or human β2 subunits accumulated selectively in the apical cell surface. Similarly, human ADPKD epithelial cell lines, which endogenously expressed α1 and β2 NaK-ATPase subunits, showed colocalization at the apical cell surface and coassociation by immunoprecipitation analysis. These results are consistent with a model in which the additional transcription and translation of the β2 subunit of NaK-ATPase may result in the apical mislocalization of NaK-ATPase in ADPKD cystic epithelia.
Autosomal dominant polycystic kidney disease (ADPKD) is the most common lethal genetic disease inherited as a dominant trait in humans, with a prevalence of 1:1000 recently shown to be associated with mutations in the PKD1 or PKD2 genes in 85% and 10% of cases, respectively. 1-4 ADPKD is characterized by massive cystic enlargement of renal tubules as a result of increased epithelial cell proliferation, aberrant fluid secretion, mispolarization of several membrane proteins, and extracellular matrix abnormalities. 5-8 Despite the recent cloning of the complete complementary DNAs (cDNAs) for PKD1 and PKD2, the function of the predicted encoded proteins remains obscure. 9,10 However, studies showing similarities between the expression and plasma membrane distribution of several proteins in ADPKD and fetal epithelia have suggested a potential role for the PKD1 protein (polycystin 1) in the regulation of renal development, epithelial polarization and differentiation, and matrix adhesion. 11-13 This is further supported by recent studies showing expression of high levels of PKD1–encoded messenger RNA (mRNA) and protein in the ureteric bud structures of the developing kidney. 14,15
The kidney is an organ that functions to reabsorb essential fluid and ions, and this is facilitated by the strictly polarized distribution of numerous transporters, enzymes, and antigens distributed along the 10 distinct segments of the nephron in an epithelial cell type-specific fashion. The polarization of membrane proteins is a critical component in the differentiation of renal tubule epithelial cells and is largely established in the human metanephric kidney before birth.
NaK-ATPase is an important, complex membrane protein of all cells including polarized renal epithelial cells. It exchanges sodium for potassium and functions as the ubiquitous electrogenic sodium pump in all animal cells and is responsible for the active transport of sodium ions out of cells. NaK-ATPase is very highly expressed in renal tubule epithelia, where it is restricted to the basolateral plasma membranes. This segregated distribution is associated with vectorial (apical-to-basal) transport of sodium and is a critical feature in the generation of sodium ion gradients, which in turn regulate other Na-coupled ion movements as well as osmotic fluid reabsorption. A major and pathophysiologically significant abnormality in ADPKD cystic epithelia is the mispolarization of a fully functional NaK-ATPase to the apical membranes of cyst epithelia. This in turn is associated with basal-to-apical sodium ion transport leading to luminal fluid accumulation. 8,12,16 Some but not all other membrane and membrane-associated proteins show aberrant polarization in ADPKD cystic epithelia, including the epidermal growth factor receptor (EGFR), calpactin, ankyrin, fodrin, and E-cadherin. 5,6
In its mature form, NaK-ATPase is a heterodimeric, complex, integral membrane protein composed of two α and two β subunits. NaK-ATPase α subunits are multimembrane-spanning, nonglycosylated proteins of 98 to 100 kd, and they contain the catalytically significant phosphorylation, ATP, and ouabain-binding sites. NaK-ATPase β subunits, by contrast, span the membrane only once, are variably glycosylated on their exterior aspect, accordingly range in molecular mass from 35 kd to 55 kd, and are absolutely required for the functioning of the assembled NaK-ATPase complex. At least three different isoforms of NaK-ATPase α subunits (α1, α2, α3) and three of NaK-ATPase β subunits (β1, β2, β3) have been cloned from a variety of species, organs, and developmental stages. 17-21 Although the functional implications of these different isoforms remain obscure, the α1 and β1 subunits are the most ubiquitous and are characteristic of normal kidneys, whereas α3 expression is characteristic in brain, and α2 and α3 are frequently expressed in fetal tissues. 22,23 Of particular interest, the NaK-ATPase β2 (β-adhesion molecule on glia) subunit is not only tissue restricted and developmentally regulated with high levels in human fetal liver and rat brain but it also functions as a neural adhesion molecule on glia and promotes neurite outgrowth, suggesting a role in normal differentiation of neurons in vivo. 24-27
The specific mechanisms underlying the sorting and polarized delivery of NaK-ATPase in renal epithelia are not fully understood. Early studies suggested direct targeting of NaK-ATPase to basolateral membranes of a polarized renal epithelial cell line, Madin Darby canine kidney (MDCK) cells, whereas others implicated indirect targeting followed by stabilization with the insoluble components of the membrane cytoskeleton, ankyrin, and fodrin. 28,29 More recent studies implicate both specific basolateral sorting signals in targeting of NaK-ATPase, the lipid environment in the trans-Golgi network, and complex formation with ankyrin, fodrin, and E-cadherin at the membrane. 30-32
In the kidney epithelial cell line LLC-PK1, the N-terminal region has been implicated in sorting of HK-ATPase or NaK-ATPase, 33 but interactions between the β subunits and a region in the C terminal of NaK-ATPase are also necessary for targeting. 34,35 Further studies show that proteins or protein complexes may contain multiple sorting determinants (eg, 36).
The current studies have been undertaken to examine the mechanisms underlying the important mispolarization of NaK-ATPase in ADPKD epithelia. Our previous studies suggested that NaK-ATPase is specifically mistargeted to the apical plasma membranes of cystic epithelia in human ADPKD, that it is fully catalytically active and binds 125I-labeled ouabain, and that the mispolarization leads to basal-to-apical net transport of Na+ ions in membrane-grown ADPKD epithelia in vitro. 8,12 In this study we examine NaK-ATPase isoform expression and distribution in vivo and in vitro and suggest that revertant or persistent expression of the fetal kidney β2 isoform is a potentially important mechanism for the apical mispolarization in ADPKD.
Materials and Methods
ADPKD kidneys and age-matched normal human kidneys were procured under sterile conditions, flushed with neutral salts solution (Collins or University of Wisconsin Solution), clamped, and stored in salts solution over ice for a maximum of 24 hours before primary culture. Parallel samples were frozen immediately in liquid nitrogen and stored at −80°C until use. ADPKD kidneys were designated as either end stage or early stage. End-stage kidneys (n = 12) contained no normal renal tubules, were greatly enlarged with multiple cysts, and were procured surgically during nephrectomies caused by the loss of renal function. Early-stage ADPKD kidneys (n = 6) contained both normal and cystic tubules, functioned without requirement for dialysis or transplant, and were procured from pretransplant cadavers. Normal kidneys (n = 18) were age-matched to the ADPKD samples (28–55 years) and were procured from transplant-prepared cadavers without warm ischemia. Additional samples of fetal kidneys (16–19-week gestation), collected in a similar manner, were used for control studies. All tissue samples were divided into three portions and used for microdissection and tissue culture and protein or RNA extraction, or they were fixed for pathology, immunostaining, or in situ hybridization, using 4% paraformaldehyde in diethyl pyrocarbonate–treated phosphate-buffered saline (PBS) at 4°C for 4 hours.
Cell Culture
Primary monolayer cultures of renal tubule segment-specific and ADPKD cyst epithelia were derived from normal adult proximal tubules, thick ascending limb of Henle, and collecting tubules and from ADPKD cyst-lining epithelia as previously described. 37-39 Cells were grown in segment-selective media in 25 cm 2 flasks coated with type I (rat tail) collagen (Collaborative Research, Lexington, MA), dissociated with collagenase (Life Technologies, Inc., Grand Island, NY), and seeded at confluent density on translucent permeable membrane supports (Transwel-COL, Costar, Cambridge, MA). For immunocytochemistry, confluent cell cultures on membranes were washed with PBS at 4°C for 3 minutes, fixed for 5 minutes in 4% paraformaldehyde in PBS, pH 7.4 at 4°C, and washed three times for 3 minutes each in cold PBS before immunostaining.
Cells and Transfections
MDCK cells were obtained from the American Type Culture Collection (Gaithersburg, MD), and a subclone, A4, was used to generate MDCK stable cell lines. Standard growth medium consisted of high-glucose Dulbecco’s modified essential medium supplemented with 10% fetal bovine serum and 50 μg/ml gentamicin.
For use in transfection, cDNAs were cloned into expression plasmid pCB6. cDNAs encoding chicken NaK-ATPase α1 and β2 subunits have been described. 40,41 The chicken β2 subunit cDNA was modified to encode a c-myc epitope 11 at the β2 subunit C terminus, which is in the βsubunit ectodomain. DNA encoding the human NaK-ATPase β2 subunit was cloned from a human retinal cDNA library in λ gt10, kindly provided by Jeremy Nathans (The Johns Hopkins University School of Medicine, Baltimore, MD). A probe for the human β2 subunit cDNA clones was generated by polymerase chain reaction (PCR), using primers based on the nucleotide sequence encoding the human β2 subunit. 33 This probe was used to isolate a full-length clone (∼1.5 kb) from the library. Identity of the clone was confirmed by nucleotide sequencing. The 5′ end of the clone began 80 bp upstream from the reported nucleotide sequence of human β2 subunit cDNA (GenBank accession number M81181) and ended in the 3′ untranslated region.
MDCK cells were transfected in 60-mm tissue culture dishes. Lipofectin (Life Technologies) was used to introduce the plasmids into the MDCK cells. Clones of cells resistant to G418 (400 μg/ml) were isolated and screened for expression of exogenous NaK-ATPase β subunits. For screening, the cells were plated on cover slips at high density and induced for 48 h in 10 mmol/L butyrate. Induced cells were then screened for expression of the exogenous β subunit by immunofluorescence microscopy.
Immunocytochemistry
For light microscopy, paraffin-embedded tissue sections on glass slides were first dewaxed and rehydrated through a graded series of ethanols. Cells and tissues were then incubated in 0.3% H2O2 in methanol to block endogenous peroxidase activity, followed by incubation with 10% normal goat serum in PBS for 20 minutes at room temperature in a humidified atmosphere. Cells and sections were incubated for 45 minutes at room temperature in a humidified chamber with the following primary antibodies: polyclonal anti-NaK-ATPase α subunit raised in rabbits against the whole molecule purified from dog, by courtesy of WJ Nelson; and antichicken NaK-ATPase α subunit monoclonal antibodies (mAbs) (α5; 2F, F12 available through the Development Studies Hybridoma Bank, Iowa City, IA); or polyclonal anti-α1 (#1300), α3 (#1301), β1 (#1303), and β2 (#1305) raised in rabbits against isozyme-specific peptides and affinity purified on a peptide column (Immuno Dynamics, La Jolla, CA). All anti-α1 antibodies recognized a single 98-kd band and showed identical staining patterns in immunocytochemistry of kidney tissues. Primary antibodies were diluted in PBS containing 2% bovine serum albumin (BSA) (1:100–1:500), washed three times in PBS-Tween 20 (0.02%), incubated for 45 minutes with biotinylated goat anti-rabbit immunoglobulin G (IgG; Vector Laboratories, Burlingame, CA), washed twice for 5 minutes each in PBS-Tween and once for 5 minutes in PBS, incubated for 45 minutes with avidin-biotin peroxidase (Vectastain Elite, Vector Laboratories), and washed for 5 minutes in PBS, followed by two washes of 5 minutes each in Tris-buffered saline. Color development was carried out for 10 to 45 minutes, using aminoethylcarbazole as substrate. Sections and cells were mounted in Aquamount (Polysciences, Niles, IL) and viewed under a Nikon FXA-Microphot equipped with Nomarski optics.
For electron microscopy and enzyme and immunocytochemistry, tissue sections and cells grown on membranes were fixed with 2% paraformaldehyde or 1% glutaraldehyde in PBS and incubated either for immunoperoxidase localization of antigens or in reaction media for localization of NaK-ATPase enzymatic reaction products after postcoupling with lead. 42 Pre-embedding immunoperoxidase reactions were carried out by 1) incubation for 45 minutes at room temperature in 1:50 to 1:500 dilutions of α1, β1, and β2 peptide antibodies in PBS with BSA; 2) washing in three changes of PBS for 5 minutes each at 4°C followed by 45 minutes at room temperature in peroxidase-conjugated anti-rabbit IgG; 3) two washes of 5 minutes each at 4°C in PBS and one wash in Tris-buffered saline; and 4) incubation in diaminobenzidine to allow visualization of the electron-dense peroxidase reaction product. Tissue sections and cells on membranes were then dehydrated and embedded in Araldite (Taab) resin, ultrathin sections were cut on an ultramicrotome (Sorvall), and sections were viewed, with and without uranyl acetate counterstain, using a JEOL electron microscope.
Immunofluorescence Microscopy
For immunofluorescence microscopy, cells were first fixed in a 2% formaldehyde solution in PBS. Antibodies were diluted to 5 μg/ml in a Hanks’ balanced salt solution containing 2% horse serum and 20 mM Tris-Cl, pH 7.5. For basolateral labeling of polarized MDCK cells, 0.25% saponin was added to permeabilize the surface membrane. Apical membrane labeling was performed in the absence of saponin. Three primary antibodies were used: mAb 9E10 to the c-myc epitope 43 that was engineered to be a C-terminal epitope on the chicken NaK-ATPase β2 subunit, mAb b24 to the chicken NaK-ATPase β1 subunit, 44 and the polyclonal antipeptide antibody (#1305) to the human NaK-ATPase β2 subunit. All three antibodies recognized extracellular epitopes on their target β subunits. Primary antibody solution was applied to fixed cells for one hour at room temperature. Cells were rinsed and then incubated in an fluorescein isothiocyanate-labeled secondary antibody (goat anti-mouse IgG or goat anti-rabbit IgG; Kirkegaard and Perry, Gaithersburg, MD). Cells were viewed and photographed with a Zeiss Axioskop epifluorescence microscope and Kodak Tmax 400 film. An additional set of MDCK cells stably transfected with β2, as well as ADPKD epithelial cells, was subjected to double labeling with anti-α1 mAb and anti-β2 peptide antibody, and then the labeled MDCK cells were visualized by goat-anti-rabbit-fluorescein isothiocyanate and anti-mouse Texas red.
Western Immunoblot Analysis and Immunoprecipitation
Membrane extracts were prepared from ADPKD and normal kidneys by the method of Jorgensen. 45 After washing in ice-cold PBS, pH 7.4, the kidneys were finely minced in ice-cold homogenization buffer (300 mmol/L sucrose, 25 mmol/L Hepes, made to pH 7.0 with 1 mol/L Tris) containing the protease inhibitors 1 mmol/L 4-(2-aminoethyl)-benzenesulfonyl fluoride (Boehringer Mannheim, Indianapolis, IN), 1 mmol/L benzamidine (Sigma Chemical Co., St Louis, MO), 10 μg/ml leupeptin (Boehringer), 1 μg/ml pepstatin A (Boehringer), 1 μg/ml aprotinin (Boehringer), and 1 μg/ml chymostatin (Boehringer) and then homogenization was carried out in the cold, using a Potter apparatus. The homogenate was centrifuged at 1000 × g for 20 min at 4°C to remove nuclei and cell debris. The supernatant was further centrifuged at 80,000 × g for 30 min at 4°C. The pellet (whole-cell membranes) was suspended in the ice-cold homogenization buffer, and protein concentrations were determined with the bicinchoninic protein assay (Pierce, Rockford, IL), using BSA as standard. In some experiments, the pellet was then resuspended in ice-cold detergent extraction buffer (20 mmol/L Tris-HCl, 120 mmol/L NaCl, 2 mmol/L ethylenediaminetetraacetic acid (EDTA), 2 ethylene glycol bis(β-aminoethyl ether)-N,N,N′,N′,-tetraacetic acid, 0.1 mmol/L dithiothreitol, pH 7.4) containing the protease inhibitors described above, incubated for 15 min on ice with one of the following detergents: 1% octylglucoside (Pierce), 0.5% 3-[(3-cholamidopropyl)dimethylammonio]-1-propanesulfonate (CHAPS; Pierce), 1% Nonidet P-40 (NP-40) (Boehringer), 1% deoxycholate (Boehringer), 0.5% digitonin (Boehringer), or 0.5% Triton X-100 (Boehringer), and then centrifuged at 100,000 × g for 1 hour at 4°C. Protein concentrations were determined on the supernatant, which contained the solubilized membrane proteins. The extracts were used immediately or flash-frozen in liquid nitrogen and stored at −80°C until further use.
Cell lysates from primary monolayer cultures were also used. After aspiration of the culture media, monolayers were washed for 5 minutes with PBS (pH 7.4) at room temperature, scraped, and centrifuged at 8000 × g for 90 seconds. The cell pellet was then flash-frozen in liquid nitrogen and stored at −80°C until use. Whole-cell extracts were prepared from frozen cell pellets resolubilized in ice-cold lysis buffer (250 mmol/L sucrose, 1 mmol/L EDTA, 20 mmol/L imidazole, pH 7.2) containing the protease inhibitors described above. After 30 minutes incubation on ice, the suspension was briefly sonicated (Branson sonifier 250) and then centrifuged at 14,000 × g for 30 seconds at 4°C. The supernatant (200 μl) was transferred into tubes containing 5 μl of 10% sodium dodecyl sulfate (SDS) and heated at 95°C for 90 seconds. After protein concentration determination, the samples were stored at −80°C until use.
For SDS-polyacrylamide gel electrophoresis (PAGE), all extracts were solubilized by heating either at 95°C for 2 minutes or at 60°C for 12 minutes in sample buffer (1.5% SDS, 10 mmol/L Tris/HCl, pH 6.8, 0.6% dithiothreitol, 6% (v/v) glycerol). Proteins (20 μg/lane) were separated by electrophoresis through 0.1 × 9 × 6-cm 12% acrylamide slabs and transferred to nitrocellulose. The membranes were briefly stained with Ponceau Red (Sigma) to check the efficiency of transfer. Destained membranes were blocked for 30 minutes at room temperature in blotting buffer (50 mmol/L NaPO4, 150 mmol/L NaCl, 0.05% Tween 20, pH 7.4) containing 5% nonfat dry milk, followed by incubation with the primary antisera and affinity purified antibodies (anti-α1, anti-β1, or anti-β2 diluted to 1:1000, 1:5000 or 1:10,000) in the blotting buffer containing 2% BSA at 4°C for 18 hours. In addition, a polyclonal antibody against a full-length human β2 fusion protein (26; generously supplied by P. Martin-Vassallo) was used. The membranes were then washed in several changes of blotting buffer, incubated for 1 hour with peroxidase-labeled goat anti-rabbit IgG (Kirkegaard & Perry), washed again, and visualized after 1 minute of incubation with enhanced chemiluminescence (Amersham, Arlington Heights, IL) at room temperature.
For immunoprecipitation, protein A/G PLUS Agarose (30 μl) was added to 100 μg cell protein lysate in the presence of NaK-ATPase mAb α5 or 2F and was incubated for 1 hour at room temperature before centrifugation at 8000 rpm for 2 minutes. After three washes with radioimmunoprecipitation assay buffer containing protease inhibitors (as above), the pellet was resuspended in 2× electrophoresis sample buffer, boiled, and centrifuged at 8000 rpm for three minutes, and the supernatant was subjected to SDS-PAGE.
The specificity of the antibodies was demonstrated by comparison with preimmune sera, by competition after preadsorption with the appropriate peptide, and by affinity purification. Additional controls were performed by omitting primary antibodies.
Reverse Transcription-PCR Analysis
Total RNA was isolated from cells or tissues 46 and stored in 70% ethanol, 0.3 M sodium acetate at −80°C until needed. An aliquot of RNA (0.2–1.0 μg) was solubilized in 1 mmol/L Tris, pH 7.5, EDTA on ice, and the solution was adjusted to 1× in reverse transcriptase buffer (50 mmol/L Tris-Cl, pH8, 3.75 mmol/L KCl, 3 mmol/L MgCl2; Bethesda Research Laboratories, Bethesda, MD), 10 mmol/L dithiothreitol, 0.5 mmol/L each of dATP, dCTP, dGTP, and dTTP, and 10,000 to 50,000 U/ml Maloney murine leukemia virus (M-MLV) SuperScript reverse transcriptase (Bethesda Research Labs), 100 μg/ml random hexamer, 0.67 U/100 μl Inhibit-Ace (5 Prime-3 Prime, Inc.). The RNA and reaction components without enzyme were heated to 65°C for 3 minutes and placed at 37°C for 5 minutes. Enzyme was added and incubated at 37°C for 2 hours and purified by ultrafiltration through Centricon 100 filters three times with 2-ml washes of 10 mmol/L Tris, pH 7.5, to a final volume of 50 μl. PCR was performed by using 1 to 10 μl of purified sample with conditions appropriate for each primer pair (primer concentration 100–1000 nmol/L). The following specific 18-nucleotide primers were designed for NaK-ATPase α1, α3, β1, and β2 isoforms and were positioned towards the 5′ end of the coding region, because the N-terminal regions of the proteins are the most divergent 28 :
1) α1 sense,5′-GAT TAC AAC GGC TGA TAG-3′;
2) α1 antisense, 5′-TTG GAC GTG ATA AGT ATG-3′;
3) α3 sense,5′-GAA AAG AAG GTG ATG TTC-3′;
4) α3 antisense, 5′-GAC AAG AAA GAT GAC AAG-3′;
5) β1 sense,5′-TTC ATC TGG AAC TCA GAG-3′;
6) β1 antisense, 5′-TCA AGC TTG AAT CTG CAG-3′;
7) β2 sense,5′-AGA CTG AGA ACC TTG ATG-3′;
8) β2 antisense, 5′-ATG CGA CAT TCT ACA TTC-3′.
These primer pairs delineate PCR products of 411 (α1), 701 (α3), 419 (β1), and 527 (β2), bp respectively. Thermostable DNA polymerase was Ampli-TAQ (Cetus P-E) 19–25 U/ml in 20, mmol/L Tris (pH 8.3), and 35 mmol/L KCL, 10 μg/ml gelatin, 1.25 to 2.5 mmol/L MgCl2, and 200 μmol/L each of dATP, dGTP, dCTP, and dTTP. Annealings were carried out at 35°C to 55°C for 1 minute, extension was at 72°C for 1 minute, and denaturation was at 94°C for 45 seconds, carried out for 30–35 cycles. Products were analyzed by 1.4 to 4.0% agarose gel with ethidium bromide staining and were subcloned into PBSIIKS-(Stratagene, La Jolla, CA). Human α1, α3, β1, and β2 probes were sequenced to confirm insert orientation and identity before use in subsequent RNase protection and in situ hybridization experiments.
RNase Protection Assay
CsCl gradient-purified plasmid DNA containing T3 and T7 phage promoter sites flanking the cDNA insert was digested with a restriction endonuclease selected to yield an antisense riboprobe of 100 to 400 bp. After enzyme digestion and DNA purification, 0.5 μg of the plasmid template were transcribed in vitro with either T3 or T7 RNA polymerase (2.5 U/μl) in 40 mmol/L Tris-Cl (pH 8.0), 25 mmol/L NaCl, 8 mmol/L MgCl2, 2 mmol/L spermidine-(HCl3), 10 mmol/L dithiothreitol, 400 μmol/L ATP, 400 μmol/L CTP, 400 μmol/L GTP, 12.5 μmol/L α[32P]UTP (400 Ci/mmol), 2 U/μl placental RNase inhibitor (Boehringer) in a reaction volume of 20 μl for 30 minutes at 37°C followed by a 15-minutes at 37°C incubation with 0.5 U/μl RNase-free DNase (Boehringer). The riboprobes were purified with phenol/CHCl3/isoamyl-OH extraction and precipitated three times in 75% EtOH, 0.5 mol/L NH4OAC. For hybridizations, 10 to 30 μg of total RNA (or control transfer RNA) were resuspended in 40 mmol/L Pipes (pH 6.4), 400 mmol/L NaCl, 1 mmol/L EDTA, 80% formamide in the presence of 2 × 10 5 cpm of antisense probe and 2 × 10 5 cpm of internal control 18S riboprobe (Ambion) in 30 μl for 16 hours in a 45°C bath. Then 350 μl of 10 mmol/L Tris-Cl (pH 7.5), 300 mmol/L NaCl, 5 mmol/L EDTA containing 40 μg/ml RNase A (Boehringer), and 0.2 μg/ml RNase T1 (Boehringer) were added to the hybridization mixture and RNA digestion was performed at 30°C min followed by proteinase-K digestion in 0.5% SDS, phenol/CHCl3/isoamyl-OH extraction, and ethanol precipitation. The assay products were fractionated using a 6% urea-polyacrylamide gel electrophoresis system, and dried gels were examined by autoradiography with an intensifying screen for 12 to 72 h.
In Situ Hybridization
Tissue sections mounted on silanized Probe-On Plus slides (Fisher, Springfield, NJ) were deparaffinized, dehydrated, treated with proteinase K (1 μg/ml, 30 minutes at 37°C), 0.1 mol/L triethanolamine, 0.25% acetic anhydride, dehydrated, prehybridized for 3 hours at 42°C, and then hybridized with digoxigenin-substituted probe overnight. Stringency washes were carried out in decreasing concentrations of standard saline citrate (optimized for each probe) and incubated in anti-digoxigenin coupled to alkaline phosphatase for 4 hours at room temperature. Color development was carried out with NBT/Xphos (Boehringer), and sections were viewed under a Nikon FXA-Mikrophot with Nomarski optics. Endogenous alkaline phosphatase was inhibited by levamisole (1 mmol/L).
Results
Mispolarization of NaK-ATPase in ADPKD Epithelia in Vivoand in Vitro
Immunocytochemistry with polyclonal antibodies against the NaK-ATPase α subunit detects clear basolateral distribution of reaction product in tissue sections of normal human renal epithelia (Figure 1A) ▶ ). As has been described in other species, there is distinct heterogeneity of intensity of staining that corresponds with differential activities of NaK-ATPase in different segments of the nephron. The most intense staining was seen in thick ascending limbs of Henle’s loop, whereas proximal tubules and collecting ducts showed lesser intensities of staining and thin limbs of Henle and glomeruli were negative. In cystic tubules from ADPKD kidneys, however, virtually all immunodetectable staining for NaK-ATPase α subunit is seen on the apical plasma membranes lining expanded, fluid-filled lumens (Figure 1, B and C) ▶ . This is the case, even in the early stages of cystic expansion, although at this stage some intracellular staining and staining of secreted products in the lumen are also occasionally detected (Figure 1B) ▶ . Identical patterns of distribution were seen in normal and ADPKD kidneys with all polyclonal and monoclonal anti-α1 antibodies described in the Materials and Methods section above.
Figure 1.

Light micrographs of immunocytochemical localization of NaK-ATPase using polyclonal antibody against purified α-subunit protein in human kidney sections. a: Normal adult human kidney showing basolateral staining in renal tubules (original magnification, ×50). b: Early stage ADPKD kidney showing apical plasma membrane localization in expanded microcysts. Some cells also show intracellular staining (original magnification, ×120). c: Endstage ADPKD cysts showing apical plasma membrane localization (original magnification, ×50).
Our previous studies have also shown the same patterns of distribution in vivo and in vitro, using enzyme cytochemical techniques at the light and electron microscope levels, consistent with enzymatically active NaK-ATPase on the basolateral membranes of a normal human renal tubules and on the apical plasma membranes of ADPKD cystic epithelia.8,12. In addition, 22NaCl tracer studies in membrane-grown cultures have also shown apical-to-basal transepithelial flux, inhibitable by basally applied ouabain, in normal renal epithelial monolayers; but net basal-to-apical flux, inhibitable by apically applied ouabain, in ADPKD epithelial monolayers. 8,12 These results attest to the functional significance of apically mispolarized NaK-ATPase in ADPKD epithelia, in which apical mislocalization is associated with the reversal of net direction of Na+ ion transport.
Transcriptional Regulation of NaK-ATPase Isoforms
Since NaK-ATPase is a heterodimer of α and β forms, a PCR-based strategy was devised to identify NaK-ATPase isoforms in normal and ADPKD kidney tissues. 11,47 Specific primers were designed that would amplify α1, α3, β1, and β2 isoforms of NaK-ATPase. NaK-ATPases α1 and β1 were amplified from both normal and ADPKD kidney RNA by reverse transcription; β2 was amplified from ADPKD RNA, whereas α3 was not detected from either source. All PCR fragments were then isolated, sequenced to confirm their identity, and cloned into pBluescript; 32P-labeled riboprobes were made, and RNase protection analysis was carried out (Figure 2) ▶ . Tissue RNAs (10 μg per lane) from age-matched normal and ADPKD kidneys were examined for the expression of α1-(411 bp), β1-(419 bp), and β2-(527 bp) protected fragments and compared with that of constitutively expressed 18S ribosomal RNA (76 bp) (Figure 2A) ▶ . As predicted from previous Northern analysis,63 the α1 isoform of NaK-ATPase was highly expressed in all normal and ADPKD kidneys (Figure 2B ▶ , lanes 3–8), but the highest expression was seen in early-stage ADPKD kidneys, which is the most active stage of the disease for epithelial proliferation, fluid secretion, and cystic expansion (Figure 2B ▶ , lanes 5–6). The pattern of β1 expression was identical to that of α1 (Figure 2B ▶ , lanes 11–16). A different pattern of β2 mRNA expression was seen, however, in that it was detected only in ADPKD kidneys, not in age-matched normal kidney tissue (Figure 2C ▶ , cf. lanes 4–6 with lanes 2 and 3).
Figure 2.

RNase protection analysis of human NaK-ATPase α1, β1, and β2 subunits in normal adult human kidneys (NHK), early-stage ADPKD (EPKD), and end stage ADPKD (ESPKD) kidneys. a: Riboprobe design. 32P-labeled riboprobes were synthesized from subcloned PCR products with specific primers for NaK-ATPase isoforms specified in Figures 5 and 6 ▶ ▶ and for an 18S ribosomal RNA fragment, used as internal control to verify equal loading in lanes. b: NaK-ATPase α1 and β1 expression in ADPKD and age-matched normal human kidneys. Lane M, size markers. Lanes 1 and 9: tRNA controls, showing no protectomers. Lane 2: unprotected, full-length α1 probe (496 bp). Lane 10: full-length β1 probe (411 bp). Protected fragments for α1 (496 bp) and β1 (419 bp) are seen in all samples. c: NaK-ATPase β2 subunit expression in ADPKD and age-matched control kidneys. Lane M: size markers. Lane 1: unprotected, full-length β2 probe (612 bp). Lane 8: tRNA control. Protected fragments are seen for β2 (527 bp) in ADPKD but are absent from normal human kidney.
The same set of antisense riboprobes were used for in situ hybridization studies, except that, for this application, they were digoxigenin substituted before analysis with an alkaline phosphatase–antidigoxigenin-coupled antibody technique. Tissue distribution of NaK-ATPase isoform mRNA is shown in Figure 3 ▶ . All reaction products, when present, were restricted to epithelial cells. In normal kidneys, α1 and β1 isoforms were localized to the medullary thick ascending limb epithelia (Figure 3, A and C) ▶ , whereas β2 was not seen in normal kidney tubule epithelia (Figure 3E) ▶ . By contrast, in ADPKD kidneys, not only were the α1 and β1 isoforms localized to cyst-lining epithelia (Figure 3, B and D) ▶ , but intense staining for β2 was also seen and was also restricted to cystic epithelia (Figure 3F) ▶ .
Figure 3.
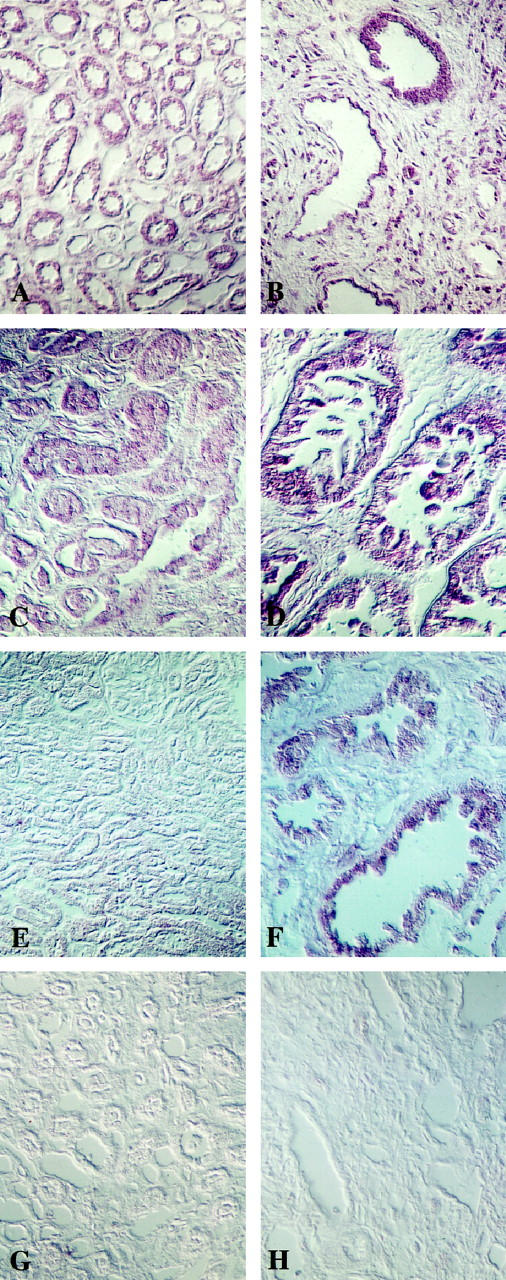
In situ hybridization analysis of NaK-ATPase isoform expression in normal adult and ADPKD kidneys, using digoxigenin-labeled antisense riboprobes. A: Normal human kidney α1 mRNA in tubule epithelia of medullary thick ascending limbs of Henle’s loop (original magnification, ×50). B: End stage ADPKD kidney showing α1 mRNA in cystic epithelia (original magnification ×50). C: Normal kidney β1 mRNA in medullary thick-ascending-limb epithelia (original magnification, ×100). D: Early-stage ADPKD kidney showing β1 mRNA in cystic epithelia (original magnification, ×100). E: Normal kidney showing absence of β2 mRNA (original magnification, ×50). F: End stage ADPKD kidney showing β2 mRNA in cystic epithelia (original magnification, ×50). G: Normal kidney incubated with control sense probe (original magnification, ×50). H: End-gate ADPKD kidney incubated with control sense probe (original magnification, ×50.
NaK-ATPase Isoenzyme Expression and Distribution
To relate these findings to protein expression, specific peptide antibodies were designed against the human NaK-ATPase α1, α3, β1, and β2 isozymes, which corresponded precisely to the regions of the isoforms used for specific riboprobe design. A schematic representation of the positioning of these peptides used for antibody generation is given in Figure 4 ▶ . In each case, the sequence of choice was close or relatively close to the N terminal, because these were the regions of the N terminal of maximal sequence divergence between isoforms and therefore those most suitable for the generation of specific and discriminatory probes.
Figure 4.

Schematic representation of NaK-ATPase showing topology of peptide sequences selected for generation of rabbit polyclonal antibodies.
Polyclonal antisera were raised against each peptide, and their specificity and purity were determined by Western blot analysis of membrane preparations. Human NaK-ATPase α1 peptide antiserum recognized a single band at 97 kd in total membrane preparations of normal adult kidneys (Figure 5) ▶ and showed immunostaining patterns identical to those seen with polyclonal antiserum raised against dog and mAbs raised against chicken (Figure 5B) ▶ . The human β1 and β2 peptide antisera recognized more than one band, but peptide competitions, comparisons with preimmune sera, and affinity purification determined that β1 antibody was specific for a protein of 43 kd (Figure 6) ▶ and that the β2 antibody was specific for a protein of 50 kd in normal adult and ADPKD epithelia (Figure 7) ▶ . The additional presence of higher-molecular-weight immunoreactive bands suggests that glycosylated forms of β subunits exist in kidney as in many other tissues. It is interesting that there seemed to be a decrease in the higher glycosylated forms in ADPKD samples and that, in human fetal kidneys, where the NaK-β2 subunit is highly expressed, higher-molecular-weight immunoreactive bands suggest that this protein is differentially glycosylated during development (Figure 7B) ▶ . During these studies it was noted that the mode of membrane extraction was important; whereas SDS or Nonidet P-40 extractions were sufficient for blotting α1 and β2 in membranes, CHAPS or octylglucoside membrane extraction was necessary for blotting of β1. Also, the narrow band width noted was consistent with a minigel system and has been shown previously, possibly reflecting the recognition of certain glycosylated forms (48; A McDonough, personal communication). Immunoprecipitation results suggest a core protein of 45 kd, which was present in ADPKD but not normal adult kidney epithelia (Figure 7D) ▶ .
Figure 5.

Western analysis using human NaK-ATPase α1 in normal and ADPKD kidneys. A: Anti-human α1 peptide antibody. Lanes 1–3: Normal adult kidney membranes. Lanes 4–6: ADPKD membranes. B: Comparison of polyclonal anti-α1 peptide antibodies with mouse monoclonal antibodies α5 and F12 in normal adult kidney extracts.
Figure 6.

Characterization of NaK-ATPase β1-subunit antibody. A: Comparison of anti-β1 antiserum (lanes 1 and 2), preimmune serum (lanes 3 and 4), and affinity purified β1 antibody (lanes 5 and 6) in normal human kidney membrane preparations prepared with 1% octylglucoside (lanes 1, 3, 5) or 0.5% CHAPS (lanes 2, 4, 6). Note specific band at 43 kD. B: Immunoprecipitation of normal human kidney (lanes 1, 2, and 3) and ADPKD epithelial whole-cell extracts with β1 subunit antibody followed by Western immunoblot with β1 subunit antibody 1:5000. Note immunoprecipitated band at 43 kD.
Figure 7.

Characterization of NaK-ATPase β2-subunit antibody. A: Comparison of anti-β2 antiserum (lane 1), preimmune serum (lane 2), and affinity-purified β2 antibody (lane 3) in human fetal kidney membrane preparations prepared with 1% Nonidet P-40. Note specific band at 50 kD. B: Comparison of human anti-b2 peptide antibody and SPET antibody used for Western analysis of human fetal collecting tubule (HFCT) and ADPKD epithelial cell extracts. Note the differences in glycosylation patterns. In ADPKD, the predominant band is 50 kD, whereas in fetal kidneys, higher-molecular-weight bands of phosphorylated forms are seen. C: Immunoprecipitation of ADPKD epithelial whole-cell extracts with β2 subunit antibody followed by Western immunoblot with β2 subunit antibody 1:5000. Note immunoprecipitated band at 50 kD. D: Immunoprecipitation of NaK-ATPase βB subunits in normal adult versus ADPKD kidneys. Only ADPKD contains an immunoprecipitated β2 subunit core protein at 45 kD. Only the IgG can be seen in the NHK lane.
Comparisons between normal adult and ADPKD plasma membranes showed little quantitative difference in the expression of α1 protein, although there was occasional detection of a lower-molecular-weight band in endstage ADPKD kidneys (Figure 5) ▶ . By contrast, expression of β1 (43 kd), which was consistent in normal human kidney membrane preparations extracted with octylglucoside or CHAPS, was absent from plasma membrane preparations of endstage ADPKD kidneys and reduced in membrane preparations from early-stage ADPKD kidneys (Figure 8) ▶ . The reverse situation was seen for β2, whose expression (50 kd) was consistently detected in membrane fractions from both endstage and early ADPKD kidneys, but was absent from normal adult kidneys (Figure 9) ▶ . Similar patterns of expression were seen in cell cultures derived from normal and ADPKD epithelia in that normal renal tubule epithelia expressed membrane α1 and β1 isozymes in their plasma membranes, whereas ADPKD epithelia expressed plasma membranes α1 and β2.
Figure 8.

Western analysis of β1 subunit content in membrane preparations from normal adult (lanes 1–4), early-stage ADPKD (lanes 5 and 6), and end-stage ADPKD (lanes 7 and 8). Note the presence of the specific 43-kD band in normal kidney membranes, but little or none in ADPKD kidney membranes.
Figure 9.

Western analysis of β2 subunit in normal (lanes 1–3), early-stage ADPKD (lanes 4 and 5), and end-stage ADPKD (lanes 6–8) kidney membrane preparations. Specific (50 kD) bands were seen in membranes prepared from ADPKD kidneys only.
Immunocytochemical analysis using the peptide antibodies further clarified these findings. NaK-ATPase α1 peptide antibodies showed basolateral membrane localization in normal renal thick-ascending-limb epithelia but apical membrane localization in ADPKD cyst epithelia (Figure 10, A and B) ▶ , which is an identical finding to our previous studies with polyclonal antibodies derived against the whole protein (8; Figure 1 ▶ ). NaK-ATPase β1 and β2 immunostaining patterns, however, showed distinctive and different distribution patterns. As predicted, the NaK-ATPase β1 antibody staining colocalized precisely with α1 subunit staining on basolateral plasma membranes of normal human adult renal epithelia (Figure 10C) ▶ . In ADPKD cyst-lining epithelia, however, although staining was intense and widely distributed throughout different cysts, the reaction product was diffusely distributed throughout the cell cytoplasm and apparently not associated with plasma membranes (Figure 10D) ▶ . This result was in agreement with the RNase protection and Western immunoblot data, which had suggested that the β1 subunit was highly expressed in ADPKD, but not in plasma membrane extracts. NaK-ATPase β2 immunostaining also correlated with RNase protection and Western immunoblot analysis. Little if any β2 immunoreaction above background was detectable in normal human renal tubule epithelia (Figure 10E) ▶ . By contrast, some clearly membrane-associated reaction product was seen in cyst-lining epithelia in ADPKD kidneys, and this membrane reactivity was at the apical surface (Figure 10F) ▶ .
Figure 10.

Immunocytochemical localization of NaK-ATPase isotype-specific peptide antibodies in ADPKD and normal age-matched, adult human kidneys. A: Normal human kidney α1 subunit protein localized to the basolateral membrane domains of cortical thick ascending limbs of Henle’s loop. B: ADPKD kidney showing α1 in apical membranes of cystic epithelia. C: Normal kidney β1 subunit protein localized to the basolateral membranes of cortical thick ascending limb epithelia. D: ADPKD kidney showing β1 protein diffusely distributed throughout the cytoplasm of cystic epithelia. E: Normal kidney showing absence of β2 subunit protein localization. F: ADPKD kidney showing β2 subunit localization restricted to cystic epithelia and associated with plasma membranes, much at the apical membrane. G: Normal kidney incubated with preimmune serum. H: ADPKD kidney incubated with preimmune serum. Scale bar, 50 μm.
These results therefore suggest that mispolarization of the NaK-ATPase heterodimers is associated with inappropriate trafficking and/or lack of appropriate assembly of the β1 subunit, as well as inappropriate expression of the β2 subunit. Electron microscope immunocytochemistry confirmed the retention of the β1 subunit within the cell cytoplasm of ADPKD cyst epithelia (Figure 11A) ▶ and showed that the majority of the reaction product was confined to linear profiles of the endoplasmic reticulum (Figure 11B) ▶ . This was contrasted with the localization of α1 and β2 to the apical membrane and submembranous vesicles (Figure 11, C and D) ▶ .
Figure 11.

Electron immunocytochemical localization of NaK-ATPase subunits in ADPKD cyst-lining epithelial cells. A: NaK-ATPase β1 subunit immunostaining in cytoplasmic (original magnification, ×12,000). B: Higher-power image showing immunostaining associated with rough endoplasmic reticulum (original magnification, ×22,000). C: NaK-ATPase β2 subunit immunoreaction at apical plasma membrane and submembranous vesicles (original magnification, ×8500). D: NaK-ATPase α1 subunit immunoreaction at apical plasma membrane (original magnification, ×8500). E: Lack of immunoreaction product after incubation with preimmune serum (original magnification, ×8500).
Effects of Transfection of β2 Isoform into MDCK Cells
As discussed above, the formation of cysts in polycystic kidney disease correlates with misexpression of the β2 subunit of the NaK-ATPase and its appearance in the apical surface of cyst cells. To determine whether the NaK-ATPase β2 subunit shows any propensity for apical targeting, we expressed both chicken and human NaK-ATPase β2 subunits in the kidney-derived, polarizing, epithelial MDCK cells. Stable MDCK cell lines were generated, expressing 1) chicken β1 subunits, 2) chicken β1 subunits lacking their N-terminal cytosolic domain, 49 3) c-myc epitope-tagged chicken β2 subunits, and 4) human β2 subunits. Cells of each line were plated at high density on coverslips, treated with butyrate to induce higher expression of the exogenous β subunit, and examined by immunofluorescence microscopy (Figure 12) ▶ . Both the normal and the N-terminally truncated chicken β1 subunits accumulated selectively in the basolateral surface of the polarized cells (Figure 12A) ▶ . However, both the epitope-tagged chicken β2 subunit and the human β2 subunit accumulated selectively in the apical membrane (Figure 12, B and D) ▶ , and no accumulation at the basolateral surface could be found in permeabilized cells (Figure 12C) ▶ .
Figure 12.

Distribution of chicken and human NaK-ATPase β1 and β2 subunits expressed in MDCK cells. Immunofluorescence microscopy of polarized MDCK cells grown on coverslips. A: Chicken β1-subunits lacking their N-terminal cytosolic domain, detected in saponin-permeabilized cells. Note chicken wire pattern of labeling, indicative of basolateral distribution. Full-length β1 subunits show the same basolateral distribution. B: Human β2 subunits expressed on the apical surface of polarized MDCK cells. C: Chicken β2 subunits, detected in the endoplasmic reticulum but not on the basolateral surfaces of saponin-permeabilized cells. D: Chicken β2 subunits expressed on the apical surface. Scale bar, 10 μm.
Association of NaK-ATPase β2 with α1 in Human ADPKD Epithelial Cell Lines
We then turned our attention to human kidney-derived epithelial cell lines. Many human renal epithelial cell lines derived from normal collecting tubules, and thick ascending limb epithelia show high-level expression and basolateral polarization of NaK-ATPase α1 (Figure 13, A ▶ ; lanes 1 and 2, and B) and β1 subunits, but express little if any β2 subunit (Figure 13C ▶ , lanes 1 and 2). By contrast, primary and immortalized cell lines derived from human ADPKD epithelia express α1 and β2 subunit proteins (Figure 13, A and C ▶ , lanes 3 and 4), both of which are apically located (Figures 11C and 13D) ▶ ▶ . In addition to colocalization in membrane fractions by Western blot and by immunocytochemistry, physical association between α1 and β2 subunits was demonstrated by immunoprecipitation analysis (Figure 13E) ▶ . Also, double immunofluorescence analysis of a1 and b2 subunits in showed complete overlapping of images in a punctate and fusiform distribution consistent with apical membrane localization in ADPKD epithelia (Figure 13F) ▶ .
Figure 13.
NaK-ATPase α1 and β2 subunit expression in human normal and ADPKD renal epithelial cell lines. A and C: Immunoblot analysis of extracts from normal (lanes 1 and 2) and ADPKD (lanes 3 and 4) cells showing α1 in both normal and ADPKD epithelia (A) and β2 in ADPKD epithelia (C). B and D: Immunocytochemistry of NaK-ATPase α1 subunit in normal (B) and ADPKD (D) confluent epithelial monolayers, showing a typical chicken-wire, basolateral pattern of staining in normal renal thick-ascending-limb epithelia (B); and punctate, apical staining in ADPKD epithelia (D). E: Immunoprecipitation of NaK-ATPase α1 subunit (α5 mAb) from whole-cell extracts of ADPKD epithelia, monitored by Western immunoblot analysis with human β2 subunit antibody, 1:5000. Lane 1: α1 subunit immunoprecipitate blotted with α1 antibody. Lanes 2–4: α1 immunoprecipitates blotted with β2 antibody. Lanes 2 and 3: ADPKD. Lanes 4 and 5, normal adult kidney epithelia. F: Indirect immunofluorescence of double-labeled ADPKD epithelial cells. Anti-α1 peptide coupled to Texas red; anti-β2 peptide immunoreactivity coupled to FITC, and merged image showing colocalization.
A Model for NaK-ATPase Mispolarization in ADPKD Epithelia
The results obtained suggest that the additional expression and synthesis of NaK-ATPase β2 subunit are associated with the complex formation with α1, which then exists the endoplasmic reticulum, is processed through the Golgi, and is sorted, inappropriately, to the apical membrane (Figure 14) ▶ . It is interesting that β1 subunit protein, although synthesized, does not appear to exit the endoplasmic reticulum or assemble with α1 and, presumably, gets degraded. This model implies that the α1β2 heterodimers are preferentially produced in comparison with α1β1 heterodimers in cystic epithelial cells. The cellular and molecular basis for this preference could involve 1) selective β subunit folding, 2) selective αβ2 subunit assembly, 3) selective β subunit retention in the endoplasmic reticulum, and/or 4) differential interaction with the protein-targeting machinery.
Figure 14.

Model for apical mislocalization of NaK-ATPase heterodimers in human ADPKD epithelia, proposing that α1β2 heterodimers assemble in the endoplasmic reticulum, traverse the Golgi, and are sorted to the apical plasma membrane, whereas β1 is retarded in the endoplasmic reticulum.
Discussion
Our previous results, as well as those in this report, show that specific membrane proteins are missorted and targeted to inappropriate membranes in ADPKD, leading to mispolarization of epithelia with pathophysiological consequences for proliferation and ion and fluid secretion. Apical mispolarization of NaK-ATPase has also been confirmed by other laboratories, in human autosomal recessive polycystic kidney disease50; several genetic models of autosomal recessive polycystic kidney disease, including the cpk, pcy, and other genetic models of polycystic kidney disease and glucocorticoid-induced polycystic kidney disease in mice, 51-53 as well as in zebrafish pronephric cystic mutants. 54 Of great interest for the putative role of polycystin-1 in focal adhesion multiprotein complexes, tension knockout mice also show renal cyst formation and apically mislocalized NaK-ATPase. 55 It is apparent, however, that some genetic and drug-induced renal cystic disease in rats is not accompanied by apical mislocalization of NaK-ATPase, and removal of cysts or placing of ADPKD cells in culture or collagen gels may not be conducive to maintenance of the NaK-ATPase polarity in tissues in vivo. 16,56 However, it has been shown that growth of human ADPKD cyst-lining epithelia on collagen-coated membrane supports can express uniformly apical NaK-ATPase in vitro as they do in vivo. 8,12 A wide survey of membrane protein distribution has determined that this polarity defect is highly selective, because some membrane proteins, such as alkaline phosphatase, aminopeptidase N, aquaporin 2, and α6β1 integrin, retain their normal polarized (apical or basal distribution), whereas others are mistargeted to apical or basolateral membranes. 6,12,15 Of equal importance, we have implicated inappropriate fetal gene expression as an important mechanism in ADPKD cyst generation relevant to the failure to acquire proper polarization of membrane transport proteins. 11,12
Normal nephrogenesis results in a differentiated epithelial cell phenotype, an essential feature of which is the appropriate polarization of membrane proteins such as the NaK-ATPase and EGF receptor. It is of considerable interest that, at stages when polycystin-1 expression in the fetal kidney is high, NaK-ATPase and EGFR are also seen at the apical plasma membranes of renal epithelial cells, whereas, when polycystin-1 expression is low in adult kidneys, basolateral localization is seen. 5,12,15 Most importantly, the β2 subunit of NaK-ATPase is also expressed in fetal kidneys. 6,12,47
Our initial studies of human ADPKD epithelia identified a mistargeting and reversal of polarized membrane distribution of NaK-ATPase 8 and subsequently of EGFRs 5 to the apical epithelial cell membranes of ADPKD epithelia in vivo and in vitro. These modifications were shown to have potentially detrimental physiological consequences for normal renal function and growth, including reversal of Na+ ion and fluid vectorial transport from an absorptive to a secretory mode and the establishment of an autocrine loop for EGF-driven proliferation. 7,8,52,57
NaK-ATPase plays a major and essential role in the establishment of the electrochemical and osmotic ion gradients that direct vectorial transport of ions and fluid, resulting in the reabsorption of fluid and essential nutrients. In normal adult kidneys, the vectorial transport of Na+ ions from the renal-tubule lumen (apical cell surface) to the blood space (basal cell surface) is associated with the segregation of NaK-ATPase complexes to the basolateral membrane domains. These complexes are α1β1 heterodimers in normal adult kidneys, the α subunit being responsible for the catalytic functions of the complex, whereas the β subunit is essential for active complex assembly and trafficking to the plasma membrane. The studies reported here, using specific polyclonal peptide antibodies made against human subunit sequences, confirm the presence of α1 and β1 subunits of NaK-ATPase in the basolateral membrane domains of renal-tubule epithelia. In normal human kidneys, there was no detectable β2 subunit protein in these basolateral membrane NaK-ATPase complexes. This was in sharp contrast to ADPKD kidneys, in which cystic epithelia showed expression of not only α1 and β1 mRNA but also β2 subunit mRNA. It is of interest that this combination of subunit expression has been reported previously, but in the secretory, not absorptive epithelium of the choroid plexus, where the NaK-ATPase is apically located. 48
Immunocytochemical and Western analysis showed a similar complement of α1, β1, and β2 protein products, but β1 could not be detected in membrane fractions and was localized to the cytoplasm by light and electron immunocytochemistry, predominantly to the endoplasmic reticulum. By contrast, both α1 and β2 were detected in the membrane fractions of ADPKD kidneys and, by immunocytochemistry, was localized to the apical plasma membranes of ADPKD epithelia in vivo and in vitro. It is interesting that the differences in patterns of glycosylation of β subunits between normal adult and ADPKD kidneys might be related to alterations with impact on processing and possibly trafficking, but further studies are needed to elucidate such a relationship.
In vitro, the targeting of both human and chicken β2 subunits to the apical surface of MDCK cells was an unequivocally robust observation. The β1 and β2 subunits share only about 40% amino acid sequence identity, even within a species. However, there is likely a much higher conservation of tertiary structure, and it is known that each of these β subunits is capable of assembly with each of the three known NaK ATPase α-subunits. 58-61 Determining what aspect of molecular structure is responsible for the divergent sites of accumulation of NaK-ATPase β1 and β2 subunits in polarized epithelial cells will require rigorous analysis.
Although the findings reported here do not prove a causal relationship between β2 subunit expression and apical targeting of NaK-ATPase molecules in polycystic kidney cysts, the results do suggest a possible link between the genetic defect in polycystic kidney disease and the reversal of cell polarity that involves altered genetic expression. Work is in progress to examine whether the mutant ADPKD gene product may cause a loss of repression of fetal gene transcription, including the β2 subunit of NaK-ATPase, and to determine the molecular basis of the abnormal apical targeting of α1β2 complexes in ADPKD cystic epithelia.
Acknowledgments
Human kidneys were procured by the National Disease Research Interchange (Philadelphia, PA), the International Institute for the Advancement of Science (Philadelphia, PA), by coordination of the Polycystic Kidney Research Foundation, and by the generosity of ADPKD patients. Dr. L. Zhen, David Hreniuk, Lillian, Kang, and Christine Hatem are gratefully acknowledged for their technical assistance.
Footnotes
Address reprint requests to Dr. Patricia D. Wilson, Department of Medicine, Division of Nephrology, Box 1243, Mount Sinai School of Medicine, 1 Gustave L. Levy Place, New York, NY 10029. E-mail: pat wilson@SMTPlink.MSSM.edu.
Supported by National Institutes of Health grants R01 DK44833 (to P. W.) and R01 NS23241 (to D. F.). S. R. is a Robert Wood Johnson Foundation University Scholar.
References
- 1.Dalgaard OZ: Polycystic Disease of the Kidneys. 1963:pp 1223-1258 Brown, Boston: Little
- 2.Gabow PA, Ikle DW, Holmes JH: Polycystic kidney disease: progressive analysis of nonazotemic patients and family members. Ann Intern Med 1984, 101:238-247 [DOI] [PubMed] [Google Scholar]
- 3.Mochizuki TG, Wu T, Hayashi S, Xenophontos L, Veldhuisen B, Saris J, Reynolds D, Cai Y, Gabow P, Pierides A, Kimberling W, Breuning MH, Deltas CC, Peters DJM, Somlo S: PKD2, a gene for polycystic kidney disease that encodes an integral membrane protein. Science 1996, 272:1339-1342 [DOI] [PubMed] [Google Scholar]
- 4.The European Polycystic Kidney Disease Consortium: The polycystic kidney disease 1 gene encodes for a 14 kb transcript and lies within a duplicated region on chromosome 16. Cell 1994, 77:882–894 [DOI] [PubMed]
- 5.Du J, Wilson PD: Abnormal polarized location of EGF receptors and autocrine stimulation of cyst epithelial growth in human ADPKD. Am J Physiol 1995, 269:C487-C495 [DOI] [PubMed] [Google Scholar]
- 6.Wilson PD: Pathogenesis of polycystic kidney disease: altered cellular function. Watson ML Torres VE eds. In Polycystic Kidney Disease. 1996, :pp 125-163 UK: Oxford Medical Publications, Oxford [Google Scholar]
- 7.Wilson PD, Du J, Norman JT: Autocrine, endocrine and paracrine regulation of growth abnormalities in autosomal dominant kidney disease. Eur J Cell Biol 1993, 61:131-138 [PubMed] [Google Scholar]
- 8.Wilson PD, Sherwood AC, Palla K, Du J, Watson R, Norman JT: Reversed polarity of Na+-K+-ATPase: mislocation to apical plasma membrane. Am J Physiol 1991, 260:F420–F430. [DOI] [PubMed]
- 9.Hughes J, Ward CJ, Peral B, Aspinwall R, Clark K, San Millan JL, Gamble V, Harris PC: The polycystic kidney disease 1 (PKD1) gene encodes a novel protein with multiple cell recognition domains. Nat Genet 1995, 10:151-160 [DOI] [PubMed] [Google Scholar]
- 10.The International Polycystic Kidney Disease Consortium. Polycystic kidney disease: the complete structure of the PKD-1 gene and its protein. Cell 1995, 81:289–298 [DOI] [PubMed]
- 11.Wilson PD, Burrow CR: Autosomal dominant polycystic kidney disease: cellular and molecular mechanisms of cyst formation. Adv Nephrol 1992, 21:125-142 [PubMed] [Google Scholar]
- 12.Wilson PD, Falkenstein D: The pathology of human renal cystic disease. In Tubulo-interstitial and cystic disease of the kidney. Curr Top Pathol 1995, 88:1-50 [DOI] [PubMed] [Google Scholar]
- 13.Wilson PD, Hreniuk D, Gabow PA: Abnormal extracellular matrix and excessive growth of human adult polycystic kidney disease epithelia. J Cell Physiol 1992, 150:360-369 [DOI] [PubMed] [Google Scholar]
- 14.Ward CJ, Turley H, Ong AC, Comley M, Biddolph S, Chetty R, Ratcliffe PJ, Gatter K, Harris PC: Polycystin, the polycystic kidney disease 1 protein, is expressed by epithelial cells in fetal, adult and polycystic kidney. Proc Natl Acad Sci USA 1996, 93:1524-1528 [DOI] [PMC free article] [PubMed] [Google Scholar]
- 15.Wilson PD: Epithelial cell polarity and disease. Am J Physiol 1997, 272:F1-F9 [DOI] [PubMed] [Google Scholar]
- 16.Mangoo-Karim R, Uchic ME, Grant M, Shumate WA, Calvet JP, Park CH, Grantham JJ: Renal epithelial fluid secretion and cyst growth: the role of cyclic AMP. FASEB J 1989, 3:2629-2632 [DOI] [PubMed] [Google Scholar]
- 17.Good PJ, Richter K, Dawid IB: A nervous system-specific isotype of the beta subunit of Na(+), K(+)-ATPase expressed during early development of Xenopus laevis. Proc Natl Acad Sci USA 1990, 87:9088-9092 [DOI] [PMC free article] [PubMed] [Google Scholar]
- 18.Kawakami K, Nojima H, Ohta T, Nagano K: Molecular cloning and sequence analysis of human NaK-ATPase beta-subunit. Nucleic Acids Res 1986, 14:2833-2844 [DOI] [PMC free article] [PubMed] [Google Scholar]
- 19.Kawakami K, Ohta T, Nojima H, Nagano K: Primary structure of the alpha-subunit of human Na,K-ATPase deduced from cDNA sequence. J Biochem (Tokyo) 1986, 100:389-397 [DOI] [PubMed] [Google Scholar]
- 20.Ovchinnikov Y, Monastyrskaya GS, Broude NE, Ushkaryov Y, Melkov AM, Smirnov Y, Malyshev IV, Allikmets RL, Kostina MB, Dulubova IB: Family of human Na+, K+-ATPase genes: structure of the gene for the catalytic subunit (alpha III-form) and its relationship with structural features of the protein. FEBS Lett 1988, 233:87-94 [DOI] [PubMed] [Google Scholar]
- 21.Shull MM, Lingrel JB: Multiple genes encode the human Na+,K+-ATPase catalytic subunit. Proc Natl Acad Sci USA 1987, 84:4039-4043 [DOI] [PMC free article] [PubMed] [Google Scholar]
- 22.Emanuel JR, Garetz S, Stone L, Levenson R: Differential expression of Na+,K+-ATPase alpha- and beta-subunit mRNAs in rat tissues and cell lines. Proc Natl Acad Sci USA 1987, 84:9030-9034 [DOI] [PMC free article] [PubMed] [Google Scholar]
- 23.Shyjan AW, Cena V, Klein DC, Levenson R: Differential expression and enzymatic properties of the Na+,K(+)-ATPase alpha 3 isoenzyme in rat pineal glands. Proc Natl Acad Sci USA 1990, 87:1178-1182 [DOI] [PMC free article] [PubMed] [Google Scholar]
- 24.Gloor S, Antonicek H, Sweadner KJ, Pagliusi S, Frank R, Moos M, Schachner M: The adhesion molecule on glia (AMOG) is a homologue of the beta subunit of the Na,K-ATPase. J Cell Biol 1990, 110:165-174 [DOI] [PMC free article] [PubMed] [Google Scholar]
- 25.Magyar JP, Bartch U, Wang ZQ, Howells N, Aguzzi A, Wagner EF, Schachner M: Degeneration of neural cells in the central nervous system of mice deficient in the gene for the adhesion molecule on glia, the β2 subunit of murine Na,K-ATPase. J Cell Biol 1994, 127:835-845 [DOI] [PMC free article] [PubMed] [Google Scholar]
- 26.Martin-Vasallo P, Dackowski W, Emanuel JR, Levenson R: Identification of a putative isoform of the Na,K-ATPase beta subunit: primary structure and tissue-specific expression. J Biol Chem 1989, 264:4613-4618 [PubMed] [Google Scholar]
- 27.Muller HG, Gloor S, Schachner M: Functional characterization of beta isoforms of murine Na,K-ATPase: The adhesion molecule on glia (AMOG/beta 2), but not beta 1, promotes neurite outgrowth. J Biol Chem 1993, 268:26260-26267 [PubMed] [Google Scholar]
- 28.Caplan MJ, Anderson HC, Palade GE, Jamieson JD: Intracellular sorting and polarized cell surface delivery of (Na+,K+)ATPase, an endogenous component of MDCK cell basolateral plasma membranes. Cell 1986, 46:623-631 [DOI] [PubMed] [Google Scholar]
- 29.Hammerton RW, Krzeminski KA, Mays RW, Ryan TA, Wollner DA, Nelson WJ: Mechanism for regulating cell surface distribution of Na+,K(+)-ATPase in polarized epithelial cells. Science 1991, 254:847-850 [DOI] [PubMed] [Google Scholar]
- 30.Gundersen D, Orlowski J, Rodriguez-Boulan E: Apical polarity of Na,K-ATPase in retinal pigment epithelium is linked to a reversal of the ankyrin-fodrin submembrane cytoskeleton. J Cell Biol 1991, 112:863-872 [DOI] [PMC free article] [PubMed] [Google Scholar]
- 31.Mays RW, Siemers KA, Fritz BA, Lowe AW, Van Meer G, Nelson WJ: Hierarchy of mechanisms involved in generating Na/K-ATPase polarity in MDCK epithelial cells. J Cell Biol 1995, 130:1105-1115 [DOI] [PMC free article] [PubMed] [Google Scholar]
- 32.Zurzolo C, Rodriguez-Boulan E: Delivery of Na+,K+-ATPase in polarized epithelial cells. J Cell Biol 1993, 260:550-552 [DOI] [PubMed] [Google Scholar]
- 33.Gottardi CJ, Caplan MJ: An ion-transporting ATPase encodes multiple apical localization signals. J Cell Biol 1993, 121:283-293 [DOI] [PMC free article] [PubMed] [Google Scholar]
- 34.Fambrough DM, Lemas MV, Hamrick M, Emerick M, Renaud KJ, Inman EM, Hwang B, Takeyasu K: Analysis of subunit assembly of the Na-K-ATPase. Am J Physiol 1994, 266:C579-C589 [DOI] [PubMed] [Google Scholar]
- 35.Jaunin P, Jaisser F, Beggah AT, Takeyasu K, Mangeat P, Rossier BC, Horisberger JD, Geering K: Role of the transmembrane and extracytoplasmic domain of β subunits in subunit assembly, intracellular transport, and functional expression of Na,K-pumps. J Cell Biol 1993, 123:1751-1759 [DOI] [PMC free article] [PubMed] [Google Scholar]
- 36.Matter K, Hunziker W, Mellman I: Basolateral sorting of LDL receptor in MDCK cells: the cytoplasmic domain contains two tyrosine-dependent targeting determinants. Cell 1992, 71:741-753 [DOI] [PubMed] [Google Scholar]
- 37.Wilson PD: Monolayer cultures of microdissected renal tubule epithelial segments. J Tissue Cult Methods 1991, 13:137-142 [Google Scholar]
- 38.Wilson PD, Dillingham MA, Breckon R, Anderson RJ: Defined human renal tubular epithelia in culture: growth, characterization and hormonal response. Am J Physiol 1985, 248:436-443 [DOI] [PubMed] [Google Scholar]
- 39.Wilson PD, Schrier RW, Breckon RD, Anderson RJ: A new method for studying human polycystic kidney disease epithelia in culture. Kidney Int 1986, 30:371-378 [DOI] [PubMed] [Google Scholar]
- 40.Lemas MV, Fambrough DM: Sequence analysis of DNA encoding an avian Na(+),K(+)-ATPase beta 2-subunit. Biochim Biophys Acta 1993, 1149:339-342 [DOI] [PubMed] [Google Scholar]
- 41.Takeyasu K, Tamkun MM, Siegel NR, Fambrough DM: Expression of hybrid (Na+ + K+)-ATPase molecules after transfection of mouse Ltk-cells with DNA encoding the beta-subunit of an avian brain sodium pump. J Biol Chem 1987, 262:10733-10740 [PubMed] [Google Scholar]
- 42.Ernst SA, Palacios J, Siegel GJ: Immunocytochemical localization of Na+,K+-ATPase catalytic polypeptide in mouse choroid plexus. J Histochem Cytochem 1986, 34:189-195 [DOI] [PubMed] [Google Scholar]
- 43.Evans GI, Lewis GK, Ramsay G: Isolation of monoclonal antibodies specific for human c-myc proto-oncogene product. Mol Cell Biol 1985, 5:3610-3616 [DOI] [PMC free article] [PubMed] [Google Scholar]
- 44.Fambrough DM, Bayne EK: Multiple forms of (Na+K+)-ATPase in the chicken. J Biol Chem 1983, 258:3926-3935 [PubMed] [Google Scholar]
- 45.Jorgensen PL: Purification of Na+,K+-ATPase: enzyme sources, preparative problems, and preparation from mammalian kidney. Methods Enzymol 1988, 156:29-43 [DOI] [PubMed] [Google Scholar]
- 46.Chomczynski P, Sacchi N: Single-step method of RNA isolation by acid guanidinium thiocyanate-phenol-chloroform extraction. Anal Biochem 1987, 162:156-159 [DOI] [PubMed] [Google Scholar]
- 47.Burrow CR, Devuyst O, Li X, Gatti L, Wilson PD: Expression of the β2 subunit and apical localization of the Na+-K+-ATPase in the metanephric kidney. Am J Physiol 1999, 277:F391-F403 [DOI] [PubMed] [Google Scholar]
- 48.Zlokovic BV, Mackie JB, Wang L, McComb JG, McDonough A: Differential expression of Na,K-ATPase alpha and beta subunit isoforms at the blood-brain barrier and the choroid plexus. J Biol Chem 1993, 268:8019-8025 [PubMed] [Google Scholar]
- 49.Renaud KJ, Inman EM, Fambrough DM: Cytoplasmic and transmembrane domain deletions of Na,K-ATPase beta-subunit: effects on subunit assembly and intracellular transport. J Biol Chem 1991, 266:20491-20497 [PubMed] [Google Scholar]
- 50.Avner ED: Epithelial polarity and differentiation in polycystic kidney disease. J Cell Sci 1993, (Suppl) 17:217–222 [DOI] [PubMed]
- 51.Ogborn MR, Sareen S, Tomobe K, Takahashi H, Crocker JF: Renal tubule Na,K-ATPase polarity in different animal models of polycystic kidney disease. J Histochem Cytochem 1995, 43:785-790 [DOI] [PubMed] [Google Scholar]
- 52.Avner ED, Sweeney W, Nelson WJ: Abnormal sodium pump distribution during renal tubulogenesis in congenital murine polycystic kidney disease. Proc Natl Acad Sci USA 1992, 89:7447-7451 [DOI] [PMC free article] [PubMed] [Google Scholar]
- 53.Ogborn MR, Sareen S: Renal tubule Na,K-ATPase polarity in glucocorticoid-induced polycystic kidney disease. J Histochem Cytochem 1993, 41:555-558 [DOI] [PubMed] [Google Scholar]
- 54.Drummond IA, Majumdar A, Hentschek H, Elger M, Solnica-Krezel L, Schier AF, Neuhauss SC, Stemple DL, Zwartkruis F, Rangini Z, Driever W, Fishman MC: Development 1998, 125:4655–4667 [DOI] [PubMed]
- 55.Lo SH, Yu Q, Degenstein L, Chen LB, Fuchs E: Progressive kidney degeneration in mice lacking tensin. J Cell Biol 1997, 136:1349-1361 [DOI] [PMC free article] [PubMed] [Google Scholar]
- 56.Brill SR, Ross KE, Davidow CJ, Ye M, Grantham JJ, Caplan MJ: Immunolocalization of ion transport proteins in human autosomal dominant polycystic kidney epithelial cells. Proc Natl Acad Sci USA 1996, 93:10206-10211 [DOI] [PMC free article] [PubMed] [Google Scholar]
- 57.Grantham JJ, Geiser JL, Evan A: Cyst formation and growth in autosomal dominant polycystic kidney disease. Kidney Int 1987, 31:1145-1152 [DOI] [PubMed] [Google Scholar]
- 58.Blanco G, Koster JC, Sanchez G, Mercer RW: Kinetic properties of the α2β1 and α2β2 isozymes of the NaK-ATPase. Biochemistry 1995, 34:319-325 [DOI] [PubMed] [Google Scholar]
- 59.Blanco G, Sanchez G, Mercer RW: Comparison of the enzymatic properties of the Na,K-ATPase α3β1 and α3β2 isozymes. Biochemistry 1995, 34:9897-9903 [DOI] [PubMed] [Google Scholar]
- 60.Lemas MV, Yu HY, Takeyasu K, Kone B, Fambrough DM: Assembly of Na,K-ATPase α-subunit isoforms with Na,K-ATPase β-subunit isoforms and H,K-ATPase β-subunit. J Biol Chem 1994, 269:18651-18655 [PubMed] [Google Scholar]
- 61.Schmalzing G, Kroner S, Schachner M, Gloor S: The adhesion molecule on glia (AMOG/beta 2) and alpha 1 subunits assemble to functional sodium pumps in Xenopus oocytes. J Biol Chem 1992, 267:20212-20216 [PubMed] [Google Scholar]