

Summary
While the role of the cerebellum in motor coordination is widely accepted, the notion that it is involved in emotion has only recently gained popularity. To date, functional neuroimaging has not been used in combination with lesion studies to elucidate the role of the cerebellum in the processing of emotional material. We examined six participants with cerebellar stroke and nine age and education matched healthy volunteers. In addition to a complete neuropsychological, neurologic, and psychiatric examination, participants underwent [15O]water positron emission tomography (PET) while responding to emotion-evoking visual stimuli. Cerebellar lesions were associated with reduced pleasant experience in response to happiness-evoking stimuli. Stroke patients reported an unpleasant experience to frightening stimuli similar to healthy controls, yet showed significantly lower activity in the right ventral lateral and left dorsolateral prefrontal cortex, amygdala, thalamus, and retrosplenial cingulate gyrus. Frightening stimuli led to increased activity in the ventral medial prefrontal, anterior cingulate, pulvinar, and insular cortex. This suggests that alternate neural circuitry became responsible for maintaining the evolutionarily critical fear response after cerebellar damage.
Keywords: social cognition, fear, happiness, PET, stroke, lesion
Introduction
The cerebellum is typically recognized for its role in the coordination of motor behavior (Bastian, Mugnaini, & Thach, 1999), but an increasing number of empirical studies have recognized its involvement in cognitive and emotional functions as well (Andreasen et al., 1999a; Andreasen et al., 1999b; Schmahmann, 2004; Wiser et al., 1998). For instance, recent studies report that patients with cerebellar damage show impairments in executive function (Appollonio, Grafman, Schwartz, Massaquoi, & Hallett, 1993), language (Chen & Desmond, 2005; Fiez, Petersen, Cheney, & Raichle, 1992), sensory processing (Parsons & Fox, 1997) and emotion regulation (“the cerebellar cognitive-affective syndrome” ) (Parvizi, Anderson, Martin, Damasio, & Damasio, 2001; Schmahmann & Sherman, 1998). In schizophrenia, a psychiatric illness where cerebellar pathology has been considered relevant (Andreasen et al., 1992), our group has observed that the cerebellum shows reduced activity during appreciation of hedonic features (Paradiso et al., 2003a). Little is known, however, regarding the mechanisms by which cerebellar damage leads to impaired emotion regulation.
The anatomical connections of the cerebellum with regions involved in emotion regulation and in perception of socially salient emotional material are revealing. The cerebellum is bidirectionally linked with regions subserving perception of socially salient material, including the posterior parietal cortex and pre-frontal regions (Dum & Strick, 2003; Kelly & Strick, 2003; Middleton & Strick, 2001; Rolls, 2004; Schmahmann, 1991). The cerebellum is particularly well-suited to regulate emotion, as connections with limbic regions, including the amygdala, the hippocampus, and the septal nuclei have been posited (Anand, Malhotra, Singh, & Dua, 1959; Annoni, Ptak, Caldara-Schnetzer, Khateb, & Pollermann, 2003; Harper & Heath, 1973; Schmahmann, 2004; Snider & Maiti, 1976). In addition, reciprocal connections link the cerebellum with brainstem areas containing neurotransmitters involved in mood regulation, including serotonin, norepinepherine, and dopamine (Dempesy et al., 1983; Marcinkiewicz, Morcos, & Chretien, 1989).
Two lines of research have shown cerebellum/emotion associations in humans: lesion studies and functional neuroimaging studies. Lesions of the posterior lobe and vermis of the cerebellum are associated with blunted affect as well as impairment in a variety of cognitive domains including those of executive function, spatial cognition, and language (Schmahmann & Sherman, 1998). Functional neuroimaging studies designed to visually induce emotion (Paradiso et al., 1997; Paradiso, Robinson, Boles Ponto, Watkins, & Hichwa, 2003b; Reiman et al., 1997) or requiring the recognition on an emotion in the face (George et al., 1993) have found increases in cerebellar activity. A study that examined the neural correlates of perceived humor found a positive correlation between ratings of humor and cerebellar activity (Goel & Dolan, 2001).
Lesion studies alone cannot provide a full appreciation of the underlying neural mechanisms that constitute the basis for disruption of emotion regulation after cerebellar damage. Because imaging studies examining the cerebellar function of healthy individuals during emotional tasks are essentially correlational in nature, they cannot draw inferences on the extent to which the cerebellum is required for emotional processing. Hence, determining whether the cerebellum is necessary for the regulation of neural systems subserving emotion is better determined through examination of the functional consequences induced by disrupted cerebellar circuitry (i.e., after damage to cerebellar structures). Therefore, we set out to investigate the role of the cerebellum in emotion by combining the use of positron emission tomography (PET) and emotion-inducing probes in patients with cerebellar stroke. To our knowledge, this is the first experiment to use functional neuroimaging to study emotion responses in patients with lesions of the cerebellum.
Previous research in schizophrenia guided our hypotheses in this study. Specifically, we have implicated cerebellar involvement in the pathophysiology of schizophrenia (Andreasen et al., 1999a; Andreasen et al., 1996a; Andreasen, Paradiso, & O’Leary, 1998) and the loss of ability to experience pleasure is a core feature of schizophrenia (Blanchard, Mueser, & Bellack, 1998). Moreover, we have observed abnormalities in the perception of positive emotional stimuli and neural network disruption during the perception of negative stimuli in schizophrenia (Crespo-Facorro et al., 2001; Paradiso et al., 2003a). Drawing on these findings, we hypothesized that cerebellar damage would impair the positive emotional experience and alter neural activity in response to negative emotionally-evocative stimuli in our cerebellar stroke patients.
Methods
Participants
Six participants with stable cerebellar infarctions were recruited through local hospital and community advertisements. All patients had strokes dating between 14 to 180 days prior to the experiment. Potential participants were excluded if they were unable to carry out Part One of the Token Test (De Renzi & Vignolo, 1962) (e.g., point to the red square) or scored below 23 on the Mini-Mental Status Exam (Folstein, Folstein, & McHugh, 1975). Participants had no neurological impairments that would affect their performance on emotion-evocative tasks. Nine healthy volunteers were recruited from the community by newspaper advertisement. Participants were equated based on age, education, and IQ. Demographic, cognitive, psychopathological and functioning data are summarized in Table 1.
Table 1.
Demographic, cognitive, psychopathological, and functioning data
| Healthy Volunteers | Stroke Patients | |||||
|---|---|---|---|---|---|---|
| Mean | (SD) | Mean | (SD) | Mann-Whitney U | p | |
| Demographic: | ||||||
| Age | 68.3 | (6.1) | 67.3 | (4.0) | 21.5 | 0.74 |
| Education | 15.3 | (4.1) | 13.7 | (3.3) | 20.0 | 0.60 |
| Gender (% male) | 100% | 100% | ||||
| General Cognition: | ||||||
| WAIS-R VIQ | 112.0 | (12.4) | 107.5 | (8.9) | 18.0 | 0.44 |
| WAIS-R PIQ | 125.3 | (22.6) | 105.0 | (13.8) | 13.5 | 0.17 |
| WAIS-R FIQ | 120.8 | (20.4) | 111.8 | (12.7) | 16.0 | 0.30 |
| ANART WAIS-R | 114.6 | (11.9) | 108.5 | (14.1) | 14.5 | 0.22 |
| MAE Token Test | 42.3 | (1.7) | 41.3 | (2.4) | 19.5 | 0.57 |
| MAE COWA | 32.6 | (12.6) | 29.0 | (14.1) | 19.0 | 0.52 |
| Visuospatial Cognition: | ||||||
| RCFT–Copy | 26.9 | (6.4) | 24.3 | (5.5) | 14.6 | 0.22 |
| BV–Total | 28.5 | (2.7) | 26.7 | (6.0) | 22.0 | 0.79 |
| BFR | 47.1 | (3.4) | 45.5 | (3.1) | 15.0 | 0.23 |
| Visual Memory: | ||||||
| RCFT–Immediate | 13.4 | (5.1) | 14.7 | (5.2) | 19.5 | 0.56 |
| RCFT–Delayed | 12.3 | (4.6) | 13.1 | (5.0) | 22.5 | 0.85 |
| Attention: | ||||||
| Digit Span | 10.6 | (2.1) | 12.2 | (4.5) | 21.5 | 0.74 |
| Language: | ||||||
| Boston Naming Test | 26.5 | (3.3) | 27.0 | (2.3) | 23.0 | 0.90 |
| Motor: | ||||||
| Finger Tapping–dominant hand | 61.9 | (53.0) | 38.6 | (14.2) | 16.0 | 0.30 |
| Finger Tapping–non-dominant hand | 38.8 | (8.3) | 41.8 | (10.7) | 17.0 | 0.37 |
| Executive Function: | ||||||
| WCST–Perseverative Errors | 8.6 | (5.6) | 9.7 | (5.2) | 17.0 | 0.35 |
| Psychopathological: | ||||||
| HAM-D | 3.7 | (3.3) | 10.0 | (10.6) | 16.0 | 0.19 |
| HAM-A | 4.7 | (3.0) | 9.8 | (6.3) | 12.0 | 0.07 |
| TAS-R | 51.7 | (8.4) | 56.3 | (15.5) | 19.5 | 0.38 |
| Functioning: | ||||||
| JHFI | 0.0 | (0.0) | 1.3 | (1.2) | 9.0 | 0.01 |
| FIM | 71.1 | (1.5) | 67.0 | (5.0) | 13.0 | 0.07 |
| SFE | 0.05 | (0.03) | 0.05 | (0.05) | 26.0 | 0.91 |
| STC | 2.6 | (1.0) | 3.5 | (2.1) | 20.5 | 0.43 |
WAIS-R VIQ: Wechsler Adult Intelligence Scale Verbal Intelligence Quotient
WAIS-R PIQ: Wechsler Adult Intelligence Scale Performance Intelligence Quotient
WAIS-R FIQ: Wechsler Adult Intelligence Scale Full Scale Intelligence Quotient
ANART WAIS-R: Adult North American Reading Test WAIS-R Equivalency
MAE Token Test: Multilingual Aphasia Exam Token Test
MAE COWA: Multilingual Aphasia Exam Controlled Oral Word Association
RCFT: Rey-Osterrieth Complex Figure Test
BV: Benton Visual Retention Test
BFR: Benton Facial Recognition Test–long form
WCST: Wisconsin Card Sorting Test
PSE: Present State Exam
Ham-D: Hamilton-Depression Scale
Ham-A: Hamilton Anxiety Scale
TAS-R: Toronto Alexithymia Scale–Revised
JHFI: Johns Hopkins Functional Inventory
FIM: Functional Inventory Measure
SFE: Social Function Exam
STC: Social Ties Checklist
The University of Iowa Institutional Review Board approved the project and written informed consent was obtained from each participant. All participants were given psychiatric, neurologic, and cognitive evaluations. Healthy volunteers were screened to rule out psychiatric and neurologic disorders as well as serious medical illnesses. A comprehensive neuropsychological battery aimed at assessing visual-spatial ability [Rey-Osterrieth Complex Figure Test–copy condition (Meyers & Meyers, 1995) and Benton Facial Recognition (Benton, Sivan, des Hamsher, Varney, & Spreen, 1994)], visual memory [Rey-Osterrieth Complex Figure Test–immediate and delay conditions (Meyers & Meyers, 1995)], attention [Wechsler Adult Intelligence Scale–Revised Digit Span (Wechsler, 1981)], motor function [Reitan Finger Tapping Task (Reitan & Wolfson, 1985)], and language [Boston Naming Test (Kaplan, Goodglass, & Weintraub, 1983)] was administered. Total raw scores and perseverative errors were examined on the Wisconsin Card Sorting Test (Heaton, Chelune, Talley, Kay, & Curtiss, 1981). No significant group differences were found on any of the tasks.
No participants were taking psychiatric medications at the time of testing. There were no group differences on the Hamilton Anxiety or Depression Scales (Hamilton, 1959, 1960). All subjects in the study showed mild impairment in activities of daily living assessed using the Johns Hopkins Functional Inventory (Robinson & Benson, 1981) and the Functional Independence Measure [“Guide for the Uniform Data System for Medical Rehabilitation (Adult FIM), Version 4.0,” 1993] (see Table 1). The Functional Independence Measure (lower score indicate more impairment) allows classification of function as “complete independence”, “modified independence”, “modified dependence”, and “complete dependence”. By contrast, the Johns Hopkins Functional Inventory (higher scores indicate more impairment) considers subjects “non-impaired” when activities are completed with assistance (i.e., “modified independence”). Perhaps, because all healthy volunteers, but not all stroke patients, were able to complete the activities with complete or modified independence, stroke patients were rated as significantly more impaired on the Johns Hopkins Functional Inventory. Alexithymia, assessed using the Toronto Alexithymia Scale–Revised (TAS-R) (Taylor, Bagby, & Parker, 1992), did not differ between the groups. Social functioning assessed using the Social Functioning Exam (Starr, Robinson, & Price, 1983) and the Social Ties Checklist (Starr et al., 1983) also showed no significant group differences.
Stimuli
To test the hypothesis that cerebellar damage would affect emotional responses, subjects were exposed to sets of emotionally evocative color images selected from the International Affective Picture System (Lang, Bradley, & Cuthbert, 1995). Stimuli are well-characterized psycho-physiologically (Lang et al., 1998) and have been shown to be capable of evoking emotional changes in the age range comparable to that of the subjects in the present study (Paradiso et al., 2003b). There were eighteen stimuli per set. Each set aimed to evoke a state of happiness or fright. Examples of stimuli that were intended to evoke happiness included pictures of expressive clowns, winning athletes, romantic couples, and smiling babies. Examples of frightening stimuli included pictures of people in situations of danger such as being kidnapped, robbed, or physically harmed. A selection of neutral images was also administered. The emotionally neutral stimuli included pictures of people that were neither smiling nor frowning, and were selected based on normative data (Lang et al., 1995).
Emotional states were assessed by asking participants to quantify the intensity of the emotions that they had experienced after viewing each 18 picture set in its entirety. Between thirty seconds and one minute after the end of the presentation of each set, participants were asked to rate how intensely they experienced happiness, hedonic amusement, surprise, sadness, fear, disgust, and anger for each set on a Likert scale with possible scores ranging from 0 (absence of feeling) to 10 (very intense feeling). They were also asked to rate the overall emotional intensity of the image set. In order to provide an objective measure of arousal, heart rate and blood pressure were recorded before and after presentation of each image set. The order of set presentation was randomized across participants. Stimuli were viewed on a 12-inch color video monitor in full view 18-inches from the participants’ eyes while they were lying in the PET camera. The room was darkened; eye movements were not restricted. Following completion of the PET imaging session, participants were asked to view the stimuli for a second time outside of the PET environment and rate each set for hedonic relevance (i.e., rate how pleasant or unpleasant the stimuli were as objectively as possible as opposed to reporting their own emotional response) using a Likert Scale ranging from −7 to +7 (negative scores equal appraisal of stimuli as unpleasant, positive as pleasant).
MRI Data Acquisition and Processing
Magnetic resonance (MR) imaging scans were obtained for each participant with a standard T1-weighted three-dimensional SPGR sequence on a 1.5-T GE scanner (echo time = 5 ms; repetition time = 24 ms; flip angle = 40 degrees; number of excitations = 2; field of view = 26 × 26 cm; matrix = 256 × 192; slice thickness = 1.5 mm). Two dimensional proton density (PD) and T2 sequences were also acquired (echo time = 36 ms for PD and 96 ms for T2; repetition time = 3000 ms; number of excitations = 1; field of view = 26 × 26 cm; matrix = 256 × 192; slice thickness = 3.0 mm for PD and 4.0 mm for T2). MR images were analyzed with locally developed software (BRAINS) (Andreasen et al., 1992). All brains were realigned parallel to the anterior commissure/posterior commissure (AC-PC) line and the interhemispheric fissure to ensure comparability of head position across participants. Alignment also placed the images in standard Talairach space (Talairach & Tournoux, 1988). Images from all participants were co-registered and resliced in three orthogonal planes to produce a three-dimensional data set that was used for visualization and localization of functional activity.
MR images were processed to obtain gray matter, white matter, and whole brain cerebral spinal fluid volumes with computer automated methods (Andreasen et al., 1996b; Harris et al., 1999). Participants were not specifically screened to rule out cerebrovascular small vessel lesions. Because older adults and especially persons who have suffered a stroke may show additional small vessel lesions, the number and extend of small vessel lesions were rated by a neuropsychiatrist (S.P.) with extensive experience in neuroimaging using the rating method of Fazekas (Wahlund et al., 2001). Specifically, T1- and T2-weighted MR images were viewed on a slice-by-slice basis using BRAINS software for presence of lesions in the frontal, parieto-occipital, temporal lobes, and the basal ganglia. The left and right hemispheres were examined separately. To maintain rater blindness, the cerebellum was masked during review of the images. A separate qualitative visual inspection of the cerebellar lesion extent and location was performed by a neuroscientist with expertise in cerebellar anatomy (R.P.) (Pierson et al., 2002).
PET Image Data Acquisition and Processing
PET images were obtained with a GE 4096 Plus whole-body tomograph capable of producing 15 slices with an interslice separation of 6.5-mm and a 10-cm axial field of view. Images were acquired in 20 five-second frames. Imaging began at the time of injection (t=0) of a 50 mCi bolus of [15O]water and continued for 100 seconds. The time from injection to bolus arrival in the brain was measured in each participant prior to the test protocol using a 15 mCi injection of [15O]water. Based upon this time, pictures were shown starting 15 seconds prior to bolus arrival time. The picture sequence continued for a total duration of 108 seconds (18 pictures shown for 6 seconds each). The frames reflecting forty seconds after bolus transit were summed, and the summed image was reconstructed into 2-mm voxels in a 128 × 128 matrix using filtered backprojection and a Butterworth filter (order = 6, cutoff frequency = 0.35 Nyquist interval). Injections were repeated at approximately 15-minute intervals. Subjective emotional responses were collected within 60 to 90 seconds following the end of each PET scan while participants remained lying in the scanner.
PET images for each subject were normalized to values of one by dividing each voxel’s count activity by the global count activity. Automated Image Registration (AIR) (Woods, Grafton, Holmes, Cherry, & Mazziotta, 1998; Woods, Grafton, Watson, Sicotte, & Mazziotta, 1998) software was then utilized to co-register each individual’s PET and MR images. An 18-mm Hanning filter was applied to the PET images. In order to minimize motion artifacts, the filtered PET image was spatially transformed into the standardized MR image space and was clipped to a hand-edited outline of the brain that was drawn on each individual’s MR scan.
Analysis of Emotional Responses
Response distributions and correlations among affective responses suggested collapsing the data into pleasant and unpleasant response clusters. The pleasant cluster included happiness and hedonic amusement responses. The unpleasant cluster included responses for fear, disgust, and anger. Responses for sadness did not correlate strongly with either cluster and were thus not included in the analyses. A mean response score was calculated for each cluster by averaging each subject’s individual emotion responses within that cluster. Measures of autonomic nervous system response (i.e., heart rate and blood pressure) were recorded before and after participants viewed each set of emotion-inducing images. Mean responses to the emotion-inducing images and autonomic measures were evaluated using Mann-Whitney U tests for within- and between-group comparisons. Both mood-congruent and mood-incongruent response clusters (as a check for errors of commission) were examined.
Analysis of the Brain Activity
Between-group differences in regional brain activity were examined by a direct statistical comparison between patients and healthy volunteers using randomization (or permutation) analysis. The randomization analysis is a non-parametric statistical method that makes no assumption about group variance (Arndt et al., 1996a; Arndt, Cizadlo, O’Leary, Gold, & Andreasen, 1996b; Holmes, Blair, Watson, & Ford, 1996). Despite our attempt to select neutral stimuli, healthy volunteers rated the neutral stimuli as mildly pleasant. As expected, the neutral stimuli did not match with frightening and happiness-evoking stimuli on the basis of arousal. In order to examine the widest emotional contrast and control for arousal, contrasts between happiness and fright-evoking stimuli were computed. Analyses with neutral stimuli are not reported for simplicity. The randomization analysis was based on an initial subtraction of the functional images obtained in all subjects in response to frightening and happiness-evoking stimuli. This allowed us to eliminate baseline group differences before a direct comparison of the difference images in stroke patients and healthy volunteers was performed. The randomization analysis sampled groups of 6 and 9 participants without regard for the original group assignment. Voxel-wise t-maps were generated after each sampling. After 3000 randomizations, the distributions of the voxel-wise t-values provided an estimation of the probability that an associated t-value could occur by chance. Regions exceeding chance t-values were identified on the t-map images and corrected for the large number of t-tests performed, the lack of independence between voxels, and the resolution of the processed images. The degrees of freedom were quite large (df = the number of resolution elements × (number of subjects -1) = 3,388). We used an uncorrected p-value of 0.0005 as the minimum threshold for defining a significant activation as was customary in our previous studies (Andreasen et al., 1996a; Arndt et al., 1996a). Only areas that exceeded 30 contiguous voxels were included in the results in order to omit isolated outlying values. Areas within the cerebellum were not examined in these between-group analyses. Region names given to each peak are based on direct visual inspection of coregistered MRI scans and PET images, providing a more accurate localization than the use of Talairach coordinates alone. Interpretation of the direction of the change in activity in each group was determined by examining the normalized counts for each significant peak.
Results
Emotional responses
Pleasant, unpleasant, and overall emotional intensity responses to stimuli are shown in Tables 2 and 3. Before reporting the results on emotional experience, we need to highlight that there were no significant group differences on measures of hedonic relevance (i.e., how pleasant or unpleasant the stimuli were). This means that the cerebellar stroke patients, when asked to rate the stimuli as objectively as possible (as opposed to reporting their own emotional response), indicated correctly the intended hedonic relevance of the stimuli (frightening stimuli: healthy volunteers mean = −6.6 (1.0), stroke patients mean = −5.4 (2.1), U = 19.5, p = 0.14; happiness-evoking stimuli: healthy volunteers mean = 5.8 (2.2); stroke patients mean = 6.1 (0.9), U = 27.0, p = 0.60). Between-group analyses showed that patients with cerebellar stroke and healthy volunteers reported similar levels of overall emotional intensity in response to the frightening (U = 18.0, p = 0.28) and happiness-evoking stimuli (U = 19.0, p = 0.34). Change in heart rate before and after viewing each set of images corroborated the subjective overall emotional intensity responses. No between-group differences in heart rate were found for the frightening (U = 20.5, p = 0.44) or happiness-evoking stimuli (U = 20.0, p = 0.41).
Table 2.
Subjective Evaluation of Emotional Experience to Frightening Stimuli
| Frightening Stimuli | |||||||||||
|---|---|---|---|---|---|---|---|---|---|---|---|
| Subject | Fear | Disgust | Anger | Negative Cluster | Negative Mean (SD) | Happy | Hedonic Amusement | Positive Cluster | Positive Mean (SD) | Overall Intensity | Intensity Mean (SD) |
| Stroke1 | 5 | 7 | 7 | 6.3 | 5.7 (SD 3.3) | 2 | 0 | 1 | 0.25 (SD 0.42) | 7 | 8.50 (SD 1.64) |
| Stroke2 | 1 | 0 | 0 | 0.3 | 0 | 0 | 0 | 7 | |||
| Stroke3 | 10 | 10 | 10 | 10 | 0 | 0 | 0 | 10 | |||
| Stroke4 | 6 | 8 | 7 | 7 | 0 | 0 | 0 | 10 | |||
| Stroke5 | 0 | 8 | 3 | 3.7 | 1 | 0 | 0.5 | 7 | |||
| Stroke6 | 6 | 7 | 8 | 7 | 0 | 0 | 0 | 10 | |||
| Healthy1 | 3 | 9 | 9 | 7 | 6.6 (SD 2.9) | 2 | 0 | 1 | 0.23 (SD 0.44) | 8 | 6.78 (SD 3.23) |
| Healthy2 | 0 | 5 | 3 | 2.7 | 1 | 0 | 0.5 | 6 | |||
| Healthy3 | 9 | 9 | 9 | 9 | 0 | 0 | 0 | 9 | |||
| Healthy4 | 10 | 10 | 10 | 10 | 0 | 0 | 0 | 10 | |||
| Healthy5 | 2 | 5 | 4 | 3.7 | 0 | 0 | 0 | 4 | |||
| Healthy6 | 8 | 9 | 9 | 8.7 | 1 | 1 | 1 | 8 | |||
| Healthy7 | 4 | 5 | 4 | 4.3 | 0 | 0 | 0 | 0 | |||
| Healthy8 | 4 | 8 | 0 | 4 | 0 | 0 | 0 | 6 | |||
| Healthy9 | 10 | 10 | 10 | 10 | 0 | 0 | 0 | 10 | |||
Table 3.
Subjective Evaluation of Emotional Experience to Happiness-evoking Stimuli[
| Happy Stimuli | |||||||||||
|---|---|---|---|---|---|---|---|---|---|---|---|
| Subject | Fear | Disgust | Anger | Negative Cluster | Negative Mean (SD) | Happy | Hedonic Amusement | Positive Cluster | Positive Mean** (SD) | Overall Intensity | Intensity Mean (SD) |
| Stroke1 | 2 | 1 | 0 | 1 | 0.33(SD 0.52) | 3 | 2 | 2.5 | 4.5 (SD 1.3) | 1 | 6.0 (SD 3.10) |
| Stroke2 | 0 | 0 | 0 | 0 | 7 | 2 | 4.5 | 7 | |||
| Stroke3 | 0 | 0 | 0 | 0 | 9 | 0 | 4.5 | 10 | |||
| Stroke4 | 0 | 0 | 0 | 0 | 7 | 2 | 4.5 | 7 | |||
| Stroke5 | 0 | 3 | 0 | 1 | 4 | 5 | 4.5 | 4 | |||
| Stroke6 | 0 | 0 | 0 | 0 | 7 | 6 | 6.5 | 7 | |||
| Healthy1 | 0 | 0 | 0 | 0 | 0.11 (SD 0.33) | 9 | 6 | 7.5 | 7.8 (SD 1.6) | 8 | 7.44 (SD 1.59) |
| Healthy2 | 0 | 0 | 0 | 0 | 7 | 3 | 5 | 6 | |||
| Healthy3 | 0 | 0 | 0 | 0 | 8 | 7 | 7.5 | 8 | |||
| Healthy4 | 0 | 0 | 0 | 0 | 9 | 8 | 8.5 | 9 | |||
| Healthy5 | 0 | 0 | 0 | 0 | 6 | 6 | 6 | 6 | |||
| Healthy6 | 1 | 1 | 1 | 1 | 7 | 9 | 8 | 7 | |||
| Healthy7 | 0 | 0 | 0 | 0 | 10 | 10 | 10 | 5 | |||
| Healthy8 | 0 | 0 | 0 | 0 | 8 | 7 | 7.5 | 8 | |||
| Healthy9 | 0 | 0 | 0 | 0 | 10 | 10 | 10 | 10 | |||
Significantly different between healthy volunteers and stroke patients: U = 2.0, p = 0.003
Subjects with cerebellar stroke experienced a weaker pleasurable emotional response while viewing the happiness-evoking stimuli (U = 2.00, p = 0.003). In contrast, no statistically significant group differences were found in the experience of unpleasant emotions in response to the frightening stimuli (U = 26.5, p = 0.94). Within-group analyses showed that frightening and happiness-evoking stimuli elicited similar levels of overall emotional intensity in cerebellar stroke patients (U = 9.0, p = 0.12) and healthy volunteers (U=39.5, p = 0.93). These findings were also supported by the lack of within-group differences in heart rate for frightening (U = 20.5, p = 0.64) and happiness-evoking stimuli (U =20.0, p = 0.41). Mood incongruent responses showed no between-group differences: cerebellar stroke patients and healthy volunteers reported similar degrees of pleasant experience in response to the frightening stimuli (U = 26.5, p = 0.95) as they reported unpleasant experience to the happiness-evoking stimuli (U = 21.0, p = 0.53). This means that neither group was responding with emotions opposite to the intended valence of the stimuli.
Structural Imaging Results
All stroke participants had damage to the cerebellum. Detailed descriptions of lesion location and extent are provided in the legend of Figure 1. Automated tissue classification showed no group differences in total gray matter, white matter, or cerebrospinal fluid volume. There were no significant group differences in cerebrovascular small vessel disease either for the frontal, parieto-occipital, temporal lobes, or basal ganglia. These data are presented in Table 4.
Figure 1. MRI slices showing location of the lesions in each of the six study participants.
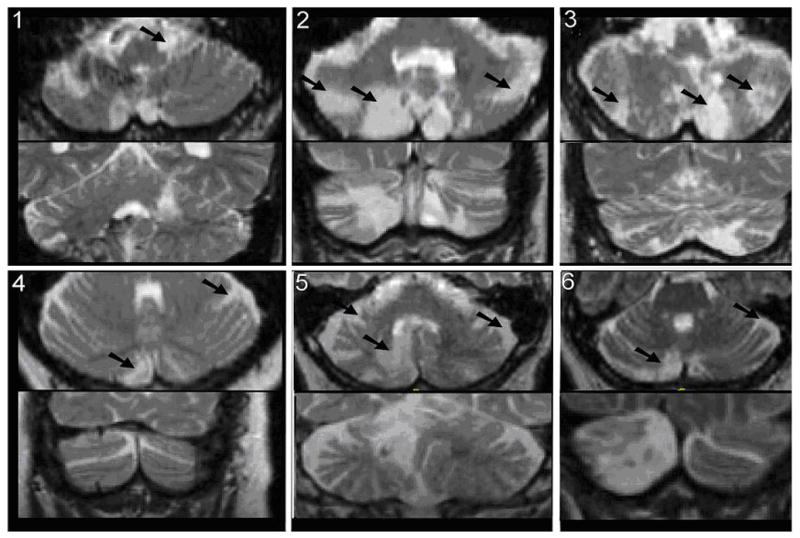
All stroke victims had lesions, identified in the figure with an arrow, affecting the cerebellum. The numbering for the MRI images corresponds with the stroke patient numbering in Tables 2 and 3. MRI scans showed Subject 1 had left sided damage to the lateral anterior lobe. The lesion extended deep into the corpus, just posterior and lateral to the dentate and may have impacted the dentate. A small lesion was also seen on the right side of Crus II within the intermediate region. A small portion of the right vermis was also affected, impacting lobules VIII and IX as well as the tonsil. Subject 2 had bilateral lesions in the medial and intermediate regions of Crus II of VIIa, VIIb, and VIII. General atrophy was visible throughout the cerebellum and cerebrum. Subject 3 showed damage to lobe VIII and Crus II of VIIb. Subject 4 showed damage to Crus I and lobe VIII. Subject 5 showed damage to the right cerebellum in area Crus II. Subject 6 showed damage to the right half of the inferior vermis as well as a very small part of Crus I.
Table 4.
Structural Magnetic Resonance Imaging Results
| Healthy Volunteers | Stroke Patients | |||||
|---|---|---|---|---|---|---|
| Mean | (SD) | Mean | (SD) | Mann-Whitney U | p | |
| Total Brain Volume | 1378.9 | (135.3) | 1368.6 | (117) | 24.0 | 0.72 |
| Total White Matter | 523.7 | (71.1) | 471.3 | (103.6) | 20.0 | 0.41 |
| Total Grey Matter | 780.0 | (70.5) | 801.5 | (55.1) | 19.0 | 0.35 |
| Total CSF | 239.5 | (82.8) | 295.6 | (119.4) | 20.0 | 0.41 |
| Fazekas’ scale | ||||||
| Frontal | ||||||
| Left | 0.3 | (0.7) | 0.3 | (0.5) | 25.0 | 0.76 |
| Right | 0.3 | (0.5) | 0.7 | (0.8) | 20.0 | 0.32 |
| Parieto-Occipital | ||||||
| Left | 0.4 | (1.0) | 0.5 | (0.8) | 24.5 | 0.71 |
| Right | 0.4 | (1.0) | 0.5 | (0.8) | 24.5 | 0.71 |
| Temporal | ||||||
| Left | 0 | (0) | 0 | (0) | 27.0 | 1.0 |
| Right | 0 | (0) | 0 | (0) | 27.0 | 1.0 |
| Basal Ganglia | ||||||
| Left | 1.3 | (1.0) | 0.8 | (1.3) | 19.0 | 0.32 |
| Right | 1.3 | (1.2) | 1.2 | (1.2) | 25.0 | 0.81 |
Functional Imaging Results
The analysis of cerebral activity revealed several differences between groups as shown in Table 5. When compared with healthy volunteers, patients with cerebellar lesions showed multiple regions with relatively decreased activity in response to frightening stimuli. These included limbic regions known to subserve processing of emotionally relevant material. Analyses revealed that stroke patients had lower activity in the amygdala (bilaterally), ventral lateral and dorsolateral prefrontal cortex, right anterior thalamus, retrosplenial cingulate gyrus (Brodmann’s Area 31) and visual association cortex. Increased activity was found in the ventromedial prefrontal cortex, putamen, hypothalamus, posterior insula, anterior cingulate gyrus (Brodmann’s Area 23), pulvinar, and visual association cortex.
Table 5.
Between group comparisons of Frightening minus Happiness-evoking stimuli in Stroke Patients versus Healthy Volunteers
| Brain Region or Brodmann’s Area (BA) | p | Vol (cc) | Voxels | X | Y | Z | Stroke Patients* | Healthy Volunteers* |
|---|---|---|---|---|---|---|---|---|
| Regions that decreased activity in response to frightening stimuli in stroke patients | ||||||||
| Right ventral lateral prefrontal (BA 47) | 0.0004 | 0.5 | 210 | 33 | 27 | −14 | −0.04 | 0.10 |
| Left dorsolateral prefrontal (BA 45) | 0.0020 | 0.1 | 55 | −49 | 24 | 14 | −0.06 | 0.06 |
| Right amygdala | <0.0001 | 0.9 | 404 | 26 | 0 | 18 | −0.09 | 0.07 |
| Left amygdala | 0.0016 | 0.1 | 62 | −20 | −8 | −17 | −0.08 | 0.04 |
| Right anterior thalamus | 0.0024 | 0.1 | 42 | 9 | −8 | 7 | −0.05 | 0.07 |
| Left retrosplenial cingulate gyrus (BA 31) | 0.0018 | 0.1 | 37 | −4 | −49 | 30 | −0.04 | 0.07 |
| Visual association cortex (BA 17/18/19) | ||||||||
| Right | 0.0001 | 0.5 | 227 | 44 | −30 | −20 | −0.06 | 0.10 |
| Right | 0.0003 | 0.4 | 205 | 43 | −43 | −14 | −0.08 | 0.05 |
| Left | 0.0009 | 0.1 | 68 | −32 | −66 | −9 | −0.08 | 0.05 |
| Right | 0.0006 | 0.4 | 204 | 34 | −74 | 20 | −0.10 | 0.03 |
| Right | 0.0022 | 0.3 | 124 | 17 | −87 | 2 | −0.05 | 0.06 |
| Regions that increased activity in response to frightening stimuli in stroke patients | ||||||||
| Right ventromedial prefrontal (BA 11) | 0.0006 | 0.5 | 238 | 10 | 47 | −4 | 0.10 | −0.03 |
| Right ventromedial prefrontal (BA 11) | 0.0002 | 1.2 | 580 | 8 | 36 | −18 | 0.09 | −0.05 |
| Right putamen | 0.0004 | 0.3 | 143 | 24 | 0 | 13 | 0.06 | −0.08 |
| Hypothalamus | <0.0001 | 1.6 | 745 | 2 | −4 | −14 | 0.08 | −0.08 |
| Left posterior insula | 0.0011 | 0.2 | 109 | −34 | −11 | 1 | 0.04 | −0.08 |
| Left anterior cingulate gyrus (BA 23) | <0.0001 | 1.3 | 595 | −38 | −15 | 30 | 0.16 | −0.02 |
| Right pulvinar | <0.0001 | 1.0 | 453 | 24 | −27 | 14 | 0.09 | −0.07 |
| Visual association cortex (BA 18) | <0.0001 | 1.5 | 707 | 0 | −81 | −5 | 0.13 | −0.03 |
These values represent the differences in normalized PET counts while participants viewed the frightening stimuli minus the happiness-evoking stimuli. In order to determine the direction of PET count activity (an increase or decrease) in each group, these values were obtained from the within-group images for each location that produced a significant randomization difference. Cerebellum lesion patients have consistently negative values in the regions shown in the upper half of the Table, indicating a decrease in brain activity in response to the frightening stimuli.
Discussion
To our knowledge this is the first study to combine the use of functional imaging and lesion patients to elucidate the role of the cerebellum in the modulation of neural networks that subserve processing of emotional material. Our study revealed several provocative findings. Patients with cerebellar lesions successfully perceived the emotional relevance of the stimuli presented. Despite normal perception, patients with cerebellar damage showed impairment in the subjective experience of pleasant feelings in response to happiness-evoking stimuli. Their subjective emotional experience in response to frightening stimuli was no different from that of age-matched comparison subjects. However, the “normal” emotional response to frightening stimuli in patients with cerebellar damage was achieved in association with relatively higher activity in the prefrontal and insular cortex, thalamus and basal ganglia; and in association with relatively lower activity in the amygdala and other limbic and paralimbic regions.
This study uncovers an interesting phenomenon: lesions of the cerebellum do not appear to affect the normal ability to experience unpleasant emotions, but are associated with a reduced ability to experience pleasant ones. While patients with cerebellar lesions could experience unpleasant feelings in response to frightening stimuli, they failed to recruit brain structures that would normally be engaged by this task (e.g. amygdala), and instead engaged “alternative” limbic circuitry including the ventromedial prefrontal cortex, insula, and cingulate gyrus. The notion that brain systems subserving processing of emotional material have adaptive capacity is consistent with the neural responses of older adults engaged in processing visual emotional material (Tessitore et al., 2005). Tessitore and colleagues interpreted older adults’ decreased amygdala and increased ventral prefrontal cortex activity as a reflection of the “adaptive network dynamics” of the late-life brain. The results of our study suggest that the role of the cerebellum as a coordinator of mental activity (Ito, 1993) extends to a dynamic network for processing emotion-laden stimuli. When the cerebellum is damaged, this network attempts to set forth an adaptive response by engaging alternative nodes. The findings in our study hence expand and clarify the growing data from functional neuroimaging studies showing elevations in cerebellar blood flow in association with appraisal of unpleasantly-laden emotional images (Paradiso et al., 1999; Paradiso et al., 2003b) but also in association with appreciation of humorous jokes (Goel & Dolan, 2001), and are consistent with a regulatory role of the cerebellum for the neural systems associated with responses to rewarding stimuli, including drugs of abuse (Sell et al., 1999; Volkow et al., 2003), money (Martin-Solch et al., 2001), and orgasm (Holstege et al., 2003).
It is unclear why positive emotional responses were reduced and negative ones were preserved in our patient group. Heath and colleagues (Heath, Franklin, Walker, & Keating, 1982) postulated that atrophy of the cerebellum may reduce its inhibitory influence on prefrontal regions and its facilitatory influence on reward systems (e.g., the nucleus accumbens). Indeed lesions of the cerebellum have been shown to result in decreased dopamine [a strong modulator of amygdala responses to emotion-laden stimuli (Rosenkranz & Grace, 2002; Tessitore et al., 2002)] and norepinephrine levels in the forebrain and thalamus and increased serotonin levels in the thalamus (Albert, Dempesy, & Sorenson, 1985; Cano, Garcia-Uria, Machado, & Reinoso-Suarez, 1980). A reduced excitation of reward systems in response to appetitive stimuli may account for the failure of persons with cerebellar stroke to experience pleasant feelings to happiness-evoking stimuli, while leaving their ability to experience frightening stimuli unaffected.
This explanation, however, does not fully explain the low amygdala activity observed in patients in association with preserved and congruent response to frightening stimuli. An explanation of this phenomenon may be due to the differential evolution of emotional systems within the brain. Phylogenetic theories have divided emotions into “primitive” emotions promoting survival (fear of dangerous stimuli, sexual desire, etc.) and “higher order” emotions, which are less obviously adaptive (aesthetic appreciation, altruism, happiness, etc.) (Stevens & Price, 1996). The field of affective neuroscience has made progress in elucidating neural substrates of emotions. For example, the subcortical limbic system (including the amygdala complex) appears to be engaged at least in the evaluation of novel and unpleasant stimuli (LeDoux, 1996), while the prefrontal cortex appears to play a pivotal role in the evaluation of pleasant and rewarding stimuli (Davidson, Putnam, & Larson, 2000). Schmahmann (1991) has proposed that the cerebellar vermis may be responsible for the “primitive” emotions while the cerebellar hemispheres modulate “higher cognitive functions” including thought, planning, learning, and language (Schmahmann, 1991). The “higher cognitive functions” may include experience of “higher order” emotions such as happiness. Our data are consistent with a regulatory role of the cerebellum in the network subserving the processing of emotional material of both positive and negative valence, albeit with “behavioral” consequences only for pleasant stimuli. The provocative finding is that the “only” abnormality associated with response of the negative stimuli emerges at the neural level. Based on the work of Joseph Ledoux (1996), it has been posited (Ohman & Mineka, 2001; Paradiso et al., 1999) that processing potentially dangerous stimuli is an evolutionarily older and therefore stronger function. Prompt awareness of danger (i.e., sudden experience of fear) promotes not only the individual, but most importantly, the species survival. Hence, circuit redundancy or compensatory neural circuitry may have evolutionarily developed far earlier for fear than did neural structures necessary to experience happiness.
Several lines of research using subliminal presentations of fear-inducing stimuli have come to suggest that compensatory circuitry could take advantage of direct connections between the superior colliculus, the pulvinar, and the amygdala complex (LeDoux, 1996; LeDoux, 2000; Liddell et al., 2005; Ohman, 2005; Ohman & Soares, 1994). Subliminally presented fear-evoking stimuli and low-spatial frequency fearful expressions have been shown to initially by-pass the visual cortex to engage a network comprised of the superior colliculus, pulvinar, amygdala, and prefrontal cortex (Liddell et al., 2005; Morris, Ohman, & Dolan, 1999; Vuilleumier, Armony, Driver, & Dolan, 2003). These findings further support the hypothesis that in patients with cerebellar damage areas responding with higher activity to frightening stimuli (e.g., ventral medial prefrontal cortex and pulvinar) may be engaged as a compensatory neural mechanism responsible for maintaining appropriate responses in the presence of potential danger.
Finally, it is of relevance that the overall pattern of affective and visual responses to emotion-laden stimuli in patients with cerebellar lesions was similar to that of patients with schizophrenia (Crespo-Facorro et al., 2001; Paradiso et al., 2003a) when asked to evaluate pleasant and unpleasant stimuli. Albeit indirectly, the findings in this study are consistent with the posited role of the cerebellum in schizophrenia’s “cognitive dysmetria” (Andreasen et al., 1999a; Andreasen et al., 1996a; Andreasen et al., 1998) or “dysmetria of thought” (Schmahmann, 2004).
Conclusion
This is the first study beginning to elucidate the effects of cerebellar lesions on brain circuits subserving emotional experience. Persons with lesions of the cerebellum reported weaker pleasant experiences to happiness-evoking stimuli than healthy volunteers, while their recognition of emotional valence was intact. Randomization analyses showed bilateral reduction in amygdala activity and an increase in ventromedial prefrontal activity in association with response to frightening stimuli in the lesion group. Increased activity was also observed in the anterior cingulate, pulvinar and insula. Our data support the hypothesis that the cerebellum is a node in the neural network that underlies the subjective experience of emotion. Potential redundancies in the neural networks that support the experience of fear in particular may have led to an evolutionary preservation of unpleasant but not pleasant emotions.
Figure 2. Statistical maps of brain regions showing differences in functional activity based on between-group comparisons of frightening versus happiness-evoking stimuli in cerebellar stroke victims and healthy volunteers.
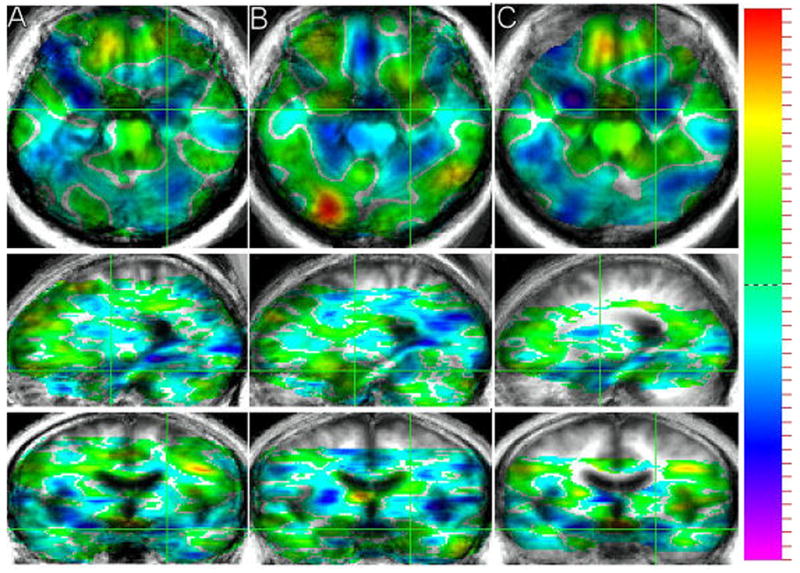
T-maps for the subtraction of PET count activity while viewing the frightening minus happiness-evoking stimuli are presented (A = cerebellar stroke patients, B = healthy volunteers, and C = the double subtraction of stroke patients minus healthy volunteers). The t-map shows the t-value for all voxels in the image and provides a general overview of the landscape of differences in functional activity between the two conditions. T-values are superimposed on a composite magnetic resonance image scan derived by averaging the MRI scans from the participants. Green crosshairs are used to show the location of a slice over the amygdala for each group. Images are presented in radiological convention.
Acknowledgments
Beth Turner and Sergio Paradiso contributed equally to this research. We wish to thank Eugene Zeien and Natalie Robinson for technical assistance with functional imaging analyses and Russ Hansen for structural work-up of the MR images. We wish to thank Dominic Cheng, Peter Strick, and two anonymous reviewers for their helpful comments regarding this manuscript. Beth Turner was partially supported by an NIH sponsored training grant for Innovative Neuroimaging Technologies. Dr. Paradiso is an Edward J. Mallinckrodt Jr. Foundation Scholar and funded by an NIH sponsored Institutional Career Development Award (K12). These data were collected with the generous support of NIH-sponsored R01 grants awarded to Dr. Robinson (MH00163 and MH52879).
Footnotes
Publisher's Disclaimer: This is a PDF file of an unedited manuscript that has been accepted for publication. As a service to our customers we are providing this early version of the manuscript. The manuscript will undergo copyediting, typesetting, and review of the resulting proof before it is published in its final citable form. Please note that during the production process errors may be discovered which could affect the content, and all legal disclaimers that apply to the journal pertain.
References
- Albert TJ, Dempesy CW, Sorenson CA. Anterior cerebellar vermal stimulation: effect on behavior and basal forebrain neurochemistry in rat. Biological Psychiatry. 1985;20(12):1267–1276. doi: 10.1016/0006-3223(85)90111-8. [DOI] [PubMed] [Google Scholar]
- Anand BK, Malhotra CL, Singh B, Dua S. Cerebellar projections to limbic system. Journal of Neurophysiology. 1959;22(4):451–457. doi: 10.1152/jn.1959.22.4.451. [DOI] [PubMed] [Google Scholar]
- Andreasen NC, Cohen G, Harris G, Cizadlo T, Parkkinen J, Rezai K, et al. Image processing for the study of brain structure and function: problems and programs. Journal of Neuropsychiatry and Clinical Neurosciences. 1992;4(2):125–133. doi: 10.1176/jnp.4.2.125. [DOI] [PubMed] [Google Scholar]
- Andreasen NC, Nopoulos P, O’Leary DS, Miller DD, Wassink T, Flaum M. Defining the phenotype of schizophrenia: cognitive dysmetria and its neural mechanisms. Biological Psychiatry. 1999a;46(7):908–920. doi: 10.1016/s0006-3223(99)00152-3. [DOI] [PubMed] [Google Scholar]
- Andreasen NC, O’Leary DS, Cizadlo T, Arndt S, Rezai K, Ponto LL, et al. Schizophrenia and cognitive dysmetria: a positron-emission tomography study of dysfunctional prefrontal-thalamic-cerebellar circuitry. Proceedings of the National Academy of Sciences. 1996a;93 (18):9985–9990. doi: 10.1073/pnas.93.18.9985. [DOI] [PMC free article] [PubMed] [Google Scholar]
- Andreasen NC, O’Leary DS, Paradiso S, Cizadlo T, Arndt S, Watkins GL, et al. The cerebellum plays a role in conscious episodic memory retrieval. Human Brain Mapping. 1999b;8 (4):226–234. doi: 10.1002/(SICI)1097-0193(1999)8:4<226::AID-HBM6>3.0.CO;2-4. [DOI] [PMC free article] [PubMed] [Google Scholar]
- Andreasen NC, Paradiso S, O’Leary DS. “Cognitive dysmetria” as an integrative theory of schizophrenia: a dysfunction in cortical-subcortical-cerebellar circuitry? Schizophrenia Bulletin. 1998;24(2):203–218. doi: 10.1093/oxfordjournals.schbul.a033321. [DOI] [PubMed] [Google Scholar]
- Andreasen NC, Rajarethinam R, Cizadlo T, Arndt S, Swayze VW, 2nd, Flashman LA, et al. Automatic atlas-based volume estimation of human brain regions from MR images. Journal of Computer Assisted Tomography. 1996b;20(1):98–106. doi: 10.1097/00004728-199601000-00018. [DOI] [PubMed] [Google Scholar]
- Annoni JM, Ptak R, Caldara-Schnetzer AS, Khateb A, Pollermann BZ. Decoupling of autonomic and cognitive emotional reactions after cerebellar stroke. Annals of Neurology. 2003;53(5):654–658. doi: 10.1002/ana.10549. [DOI] [PubMed] [Google Scholar]
- Appollonio IM, Grafman J, Schwartz V, Massaquoi S, Hallett M. Memory in patients with cerebellar degeneration. Neurology. 1993;43(8):1536–1544. doi: 10.1212/wnl.43.8.1536. [DOI] [PubMed] [Google Scholar]
- Arndt S, Cizadlo T, Andreasen NC, Heckel D, Gold S, O’Leary DS. Tests for comparing images based on randomization and permutation methods. Journal of Cerebral Blood Flow and Metabolism. 1996a;16(6):1271–1279. doi: 10.1097/00004647-199611000-00023. [DOI] [PubMed] [Google Scholar]
- Arndt S, Cizadlo T, O’Leary D, Gold S, Andreasen NC. Normalizing counts and cerebral blood flow intensity in functional imaging studies of the human brain. Neuroimage. 1996b;3(3 Pt 1):175–184. doi: 10.1006/nimg.1996.0019. [DOI] [PubMed] [Google Scholar]
- Bastian AJ, Mugnaini E, Thach WT. Cerebellum. In: Zigmond MJ, Bloom FE, Landis SC, Roberts JL, Squire LR, editors. Fundamental Neuroscience. San Diego, CA: Academic Press; 1999. pp. 973–992. [Google Scholar]
- Benton A, Sivan A, des Hamsher K, Varney N, Spreen O. Contributions to Neuropsychological Assessment. Oxford University Press; 1994. [Google Scholar]
- Blanchard JJ, Mueser KT, Bellack AS. Anhedonia, positive and negative affect, and social functioning in schizophrenia. Schizophrenia Bulletin. 1998;24(3):413–424. doi: 10.1093/oxfordjournals.schbul.a033336. [DOI] [PubMed] [Google Scholar]
- Cano J, Garcia-Uria J, Machado A, Reinoso-Suarez F. Effect of cerebellar lesions on monoamine levels in various brain areas of the cat. Journal of Neurochemistry. 1980;35(6):1446–1448. doi: 10.1111/j.1471-4159.1980.tb09021.x. [DOI] [PubMed] [Google Scholar]
- Chen SH, Desmond JE. Cerebrocerebellar networks during articulatory rehearsal and verbal working memory tasks. Neuroimage. 2005;24(2):332–338. doi: 10.1016/j.neuroimage.2004.08.032. [DOI] [PubMed] [Google Scholar]
- Crespo-Facorro B, Paradiso S, Andreasen NC, O’Leary DS, Watkins GL, Ponto LL, et al. Neural mechanisms of anhedonia in schizophrenia: a PET study of response to unpleasant and pleasant odors. Journal of the American Medical Association. 2001;286(4):427–435. doi: 10.1001/jama.286.4.427. [DOI] [PubMed] [Google Scholar]
- Davidson RJ, Putnam KM, Larson CL. Dysfunction in the neural circuitry of emotion regulation--a possible prelude to violence. Science. 2000;289(5479):591–594. doi: 10.1126/science.289.5479.591. [DOI] [PubMed] [Google Scholar]
- De Renzi E, Vignolo LA. The token test: A sensitive test to detect receptive disturbances in aphasics. Brain. 1962;85:665–678. doi: 10.1093/brain/85.4.665. [DOI] [PubMed] [Google Scholar]
- Dempesy CW, Tootle DM, Fontana CJ, Fitzjarrell AT, Garey RE, Heath RG. Stimulation of the paleocerebellar cortex of the cat: increased rate of synthesis and release of catecholamines at limbic sites. Biological Psychiatry. 1983;18(1):127–132. [PubMed] [Google Scholar]
- Dum RP, Strick PL. An unfolded map of the cerebellar dentate nucleus and its projections to the cerebral cortex. Journal of Neurophysiology. 2003;89(1):634–639. doi: 10.1152/jn.00626.2002. [DOI] [PubMed] [Google Scholar]
- Fiez JA, Petersen SE, Cheney MK, Raichle ME. Impaired non-motor learning and error detection associated with cerebellar damage. A single case study. Brain. 1992;115(Pt 1):155–178. doi: 10.1093/brain/115.1.155. [DOI] [PubMed] [Google Scholar]
- Folstein MF, Folstein SE, McHugh PR. “Mini-mental state”. A practical method for grading the cognitive state of patients for the clinician. Journal of Psychiatry Research. 1975;12(3):189–198. doi: 10.1016/0022-3956(75)90026-6. [DOI] [PubMed] [Google Scholar]
- George MS, Ketter TA, Gill DS, Haxby JV, Ungerleider LG, Herscovitch P, et al. Brain regions involved in recognizing facial emotion or identity: an oxygen-15 PET study. Journal of Neuropsychiatry and Clinical Neurosciences. 1993;5(4):384–394. doi: 10.1176/jnp.5.4.384. [DOI] [PubMed] [Google Scholar]
- Goel V, Dolan RJ. The functional anatomy of humor: segregating cognitive and affective components. Nature Neuroscience. 2001;4(3):237–238. doi: 10.1038/85076. [DOI] [PubMed] [Google Scholar]
- Guide for the Uniform Data System for Medical Rehabilitation (Adult FIM) Version 4.0. Buffalo: State University of New York at Buffalo; 1993. [Google Scholar]
- Hamilton M. The assessment of anxiety states by rating. British Journal of Medical Psychology. 1959;32(1):50–55. doi: 10.1111/j.2044-8341.1959.tb00467.x. [DOI] [PubMed] [Google Scholar]
- Hamilton M. A rating scale for depression. Journal of Neurology, Neurosurgery, and Psychiatry. 1960;23:56–62. doi: 10.1136/jnnp.23.1.56. [DOI] [PMC free article] [PubMed] [Google Scholar]
- Harper JW, Heath RG. Anatomic connections of the fastigial nucleus to the rostral forebrain in the cat. Experimental Neurology. 1973;39(2):285–292. doi: 10.1016/0014-4886(73)90231-8. [DOI] [PubMed] [Google Scholar]
- Harris G, Andreasen NC, Cizadlo T, Bailey JM, Bockholt HJ, Magnotta VA, et al. Improving tissue classification in MRI: a three-dimensional multispectral discriminant analysis method with automated training class selection. Journal of Computer Assisted Tomography. 1999;23(1):144–154. doi: 10.1097/00004728-199901000-00030. [DOI] [PubMed] [Google Scholar]
- Heath RG, Franklin DE, Walker CF, Keating JW., Jr Cerebellar vermal atrophy in psychiatric patients. Biological Psychiatry. 1982;17(5):569–583. [PubMed] [Google Scholar]
- Heaton RK, Chelune GJ, Talley JL, Kay GG, Curtiss G. Wisconsin Card Sorting Test Manual: Revised and Expanded. Odessa, FL: Psychological Assessment Resources, Inc; 1981. [Google Scholar]
- Holmes AP, Blair RC, Watson JD, Ford I. Nonparametric analysis of statistic images from functional mapping experiments. Journal of Cerebral Blood Flow and Metabolism. 1996;16(1):7–22. doi: 10.1097/00004647-199601000-00002. [DOI] [PubMed] [Google Scholar]
- Holstege G, Georgiadis JR, Paans AM, Meiners LC, van der Graaf FH, Reinders AA. Brain activation during human male ejaculation. Journal of Neuroscience. 2003;23(27):9185–9193. doi: 10.1523/JNEUROSCI.23-27-09185.2003. [DOI] [PMC free article] [PubMed] [Google Scholar]
- Ito M. Movement and thought: identical control mechanisms by the cerebellum. Trends in Neuroscience. 1993;16(11):448–450. 453–444. doi: 10.1016/0166-2236(93)90073-u. [DOI] [PubMed] [Google Scholar]
- Kaplan E, Goodglass H, Weintraub S. The Boston Naming Test. Philadelphia, PA: Lea & Febiger; 1983. [Google Scholar]
- Kelly RM, Strick PL. Cerebellar loops with motor cortex and prefrontal cortex of a nonhuman primate. Journal of Neuroscience. 2003;23(23):8432–8444. doi: 10.1523/JNEUROSCI.23-23-08432.2003. [DOI] [PMC free article] [PubMed] [Google Scholar]
- Lang PJ, Bradley MA, Cuthbert BN. International affective picture system (IAPS): Technical manual on affective rating. Gainsville: University of Florida; 1995. [Google Scholar]
- Lang PJ, Bradley MM, Fitzsimmons JR, Cuthbert BN, Scott JD, Moulder B, et al. Emotional arousal and activation of the visual cortex: an fMRI analysis. Psychophysiology. 1998;35(2):199–210. [PubMed] [Google Scholar]
- LeDoux JE. The Emotional Brain: The mysterious underpinnings of emotional life. New York: Simon and Schuster; 1996. [Google Scholar]
- LeDoux JE. Emotion circuits in the brain. Annual Review of Neuroscience. 2000;23:155–184. doi: 10.1146/annurev.neuro.23.1.155. [DOI] [PubMed] [Google Scholar]
- Liddell BJ, Brown KJ, Kemp AH, Barton MJ, Das P, Peduto A, et al. A direct brainstem-amygdala-cortical ‘alarm’ system for subliminal signals of fear. Neuroimage. 2005;24(1):235–243. doi: 10.1016/j.neuroimage.2004.08.016. [DOI] [PubMed] [Google Scholar]
- Marcinkiewicz M, Morcos R, Chretien M. CNS connections with the median raphe nucleus: retrograde tracing with WGA-apoHRP-Gold complex in the rat. Journal of Comparative Neurology. 1989;289(1):11–35. doi: 10.1002/cne.902890103. [DOI] [PubMed] [Google Scholar]
- Martin-Solch C, Magyar S, Kunig G, Missimer J, Schultz W, Leenders KL. Changes in brain activation associated with reward processing in smokers and nonsmokers. A positron emission tomography study. Experimental Brain Research. 2001;139(3):278–286. doi: 10.1007/s002210100751. [DOI] [PubMed] [Google Scholar]
- Meyers JE, Meyers KR. Rey Complex Figure Test under four different administration procedures. Clinical Neuropsychologist. 1995;9(1):63–67. [Google Scholar]
- Middleton FA, Strick PL. Cerebellar projections to the prefrontal cortex of the primate. Journal of Neuroscience. 2001;21(2):700–712. doi: 10.1523/JNEUROSCI.21-02-00700.2001. [DOI] [PMC free article] [PubMed] [Google Scholar]
- Morris JS, Ohman A, Dolan RJ. A subcortical pathway to the right amygdala mediating “unseen” fear. Proceedings of the National Academy of Sciences of the United States of America. 1999;96(4):1680–1685. doi: 10.1073/pnas.96.4.1680. [DOI] [PMC free article] [PubMed] [Google Scholar]
- Ohman A. The role of the amygdala in human fear: automatic detection of threat. Psychoneuroendocrinology. 2005;30(10):953–958. doi: 10.1016/j.psyneuen.2005.03.019. [DOI] [PubMed] [Google Scholar]
- Ohman A, Mineka S. Fears, phobias, and preparedness: toward an evolved module of fear and fear learning. Psychological Reviews. 2001;108(3):483–522. doi: 10.1037/0033-295x.108.3.483. [DOI] [PubMed] [Google Scholar]
- Ohman A, Soares JJ. “Unconscious anxiety”: phobic responses to masked stimuli. Journal of Abnormal Psychology. 1994;103(2):231–240. doi: 10.1037//0021-843x.103.2.231. [DOI] [PubMed] [Google Scholar]
- Paradiso S, Andreasen NC, Crespo-Facorro B, O’Leary DS, Watkins GL, Boles Ponto LL, et al. Emotions in unmedicated patients with schizophrenia during evaluation with positron emission tomography. American Journal of Psychiatry. 2003a;160(10):1775–1783. doi: 10.1176/appi.ajp.160.10.1775. [DOI] [PubMed] [Google Scholar]
- Paradiso S, Johnson DL, Andreasen NC, O’Leary DS, Watkins GL, Ponto LL, et al. Cerebral blood flow changes associated with attribution of emotional valence to pleasant, unpleasant, and neutral visual stimuli in a PET study of normal subjects. American Journal of Psychiatry. 1999;156(10):1618–1629. doi: 10.1176/ajp.156.10.1618. [DOI] [PubMed] [Google Scholar]
- Paradiso S, Robinson RG, Andreasen NC, Downhill JE, Davidson RJ, Kirchner PT, et al. Emotional activation of limbic circuitry in elderly normal subjects in a PET study. American Journal of Psychiatry. 1997;154(3):384–389. doi: 10.1176/ajp.154.3.384. [DOI] [PubMed] [Google Scholar]
- Paradiso S, Robinson RG, Boles Ponto LL, Watkins GL, Hichwa RD. Regional cerebral blood flow changes during visually induced subjective sadness in healthy elderly persons. Journal of Neuropsychiatry and Clinical Neurosciences. 2003b;15(1):35–44. doi: 10.1176/jnp.15.1.35. [DOI] [PubMed] [Google Scholar]
- Parsons LM, Fox PT. Sensory and cognitive functions. International Review of Neurobiology. 1997;41:255–271. doi: 10.1016/s0074-7742(08)60355-4. [DOI] [PubMed] [Google Scholar]
- Parvizi J, Anderson SW, Martin CO, Damasio H, Damasio AR. Pathological laughter and crying: a link to the cerebellum. Brain. 2001;124(Pt 9):1708–1719. doi: 10.1093/brain/124.9.1708. [DOI] [PubMed] [Google Scholar]
- Pierson R, Corson PW, Sears LL, Alicata D, Magnotta V, Oleary D, et al. Manual and semiautomated measurement of cerebellar subregions on MR images. Neuroimage. 2002;17(1):61–76. doi: 10.1006/nimg.2002.1207. [DOI] [PubMed] [Google Scholar]
- Reiman EM, Lane RD, Ahern GL, Schwartz GE, Davidson RJ, Friston KJ, et al. Neuroanatomical correlates of externally and internally generated human emotion. American Journal of Psychiatry. 1997;154(7):918–925. doi: 10.1176/ajp.154.7.918. [DOI] [PubMed] [Google Scholar]
- Reitan RM, Wolfson D. The Halstead-Reitan Neuropsychological Test Battery. Tucson, AZ: Neuropsychology Press; 1985. [Google Scholar]
- Robinson RG, Benson DF. Depression in aphasic patients: frequency, severity, and clinical-pathological correlations. Brain and Language. 1981;14(2):282–291. doi: 10.1016/0093-934x(81)90080-8. [DOI] [PubMed] [Google Scholar]
- Rolls ET. The functions of the orbitofrontal cortex. Brain and Cognition. 2004;55(1):11–29. doi: 10.1016/S0278-2626(03)00277-X. [DOI] [PubMed] [Google Scholar]
- Rosenkranz JA, Grace AA. Dopamine-mediated modulation of odour-evoked amygdala potentials during pavlovian conditioning. Nature. 2002;417(6886):282–287. doi: 10.1038/417282a. [DOI] [PubMed] [Google Scholar]
- Schmahmann JD. An emerging concept. The cerebellar contribution to higher function. Archives of Neurology. 1991;48(11):1178–1187. doi: 10.1001/archneur.1991.00530230086029. [DOI] [PubMed] [Google Scholar]
- Schmahmann JD. Disorders of the cerebellum: ataxia, dysmetria of thought, and the cerebellar cognitive affective syndrome. Journal of Neuropsychiatry and Clinical Neurosciences. 2004;16(3):367–378. doi: 10.1176/jnp.16.3.367. [DOI] [PubMed] [Google Scholar]
- Schmahmann JD, Sherman JC. The cerebellar cognitive affective syndrome. Brain. 1998;121(Pt 4):561–579. doi: 10.1093/brain/121.4.561. [DOI] [PubMed] [Google Scholar]
- Sell LA, Morris J, Bearn J, Frackowiak RS, Friston KJ, Dolan RJ. Activation of reward circuitry in human opiate addicts. European Journal of Neuroscience. 1999;11(3):1042–1048. doi: 10.1046/j.1460-9568.1999.00522.x. [DOI] [PubMed] [Google Scholar]
- Snider RS, Maiti A. Cerebellar contributions to the Papez circuit. Journal of Neuroscience Research. 1976;2(2):133–146. doi: 10.1002/jnr.490020204. [DOI] [PubMed] [Google Scholar]
- Starr LB, Robinson RG, Price TR. Reliability, validity, and clinical utility of the social functioning exam in the assessment of stroke patients. Experimental Aging Research. 1983;9(2):101–106. doi: 10.1080/03610738308258434. [DOI] [PubMed] [Google Scholar]
- Stevens A, Price J. Evolutionary Psychiatry: A new beginning. London/New York: Routledge; 1996. [Google Scholar]
- Talairach J, Tournoux P. Co-planar stereotaxic atlas of the human brain: 3-Dimensional proportional system: An approach to cerebral imaging. Stuttgart: Thieme; 1988. [Google Scholar]
- Taylor GJ, Bagby RM, Parker JD. The Revised Toronto Alexithymia Scale: some reliability, validity, and normative data. Psychotherapy and Psychosomatics. 1992;57(1–2):34–41. doi: 10.1159/000288571. [DOI] [PubMed] [Google Scholar]
- Tessitore A, Hariri AR, Fera F, Smith WG, Chase TN, Hyde TM, et al. Dopamine modulates the response of the human amygdala: a study in Parkinson’s disease. Journal of Neuroscience. 2002;22(20):9099–9103. doi: 10.1523/JNEUROSCI.22-20-09099.2002. [DOI] [PMC free article] [PubMed] [Google Scholar]
- Tessitore A, Hariri AR, Fera F, Smith WG, Das S, Weinberger DR, et al. Functional changes in the activity of brain regions underlying emotion processing in the elderly. Psychiatry Research. 2005;139(1):9–18. doi: 10.1016/j.pscychresns.2005.02.009. [DOI] [PubMed] [Google Scholar]
- Volkow ND, Wang GJ, Ma Y, Fowler JS, Zhu W, Maynard L, et al. Expectation enhances the regional brain metabolic and the reinforcing effects of stimulants in cocaine abusers. Journal of Neuroscience. 2003;23(36):11461–11468. doi: 10.1523/JNEUROSCI.23-36-11461.2003. [DOI] [PMC free article] [PubMed] [Google Scholar]
- Vuilleumier P, Armony JL, Driver J, Dolan RJ. Distinct spatial frequency sensitivities for processing faces and emotional expressions. Nature Neuroscience. 2003;6(6):624–631. doi: 10.1038/nn1057. [DOI] [PubMed] [Google Scholar]
- Wahlund LO, Barkhof F, Fazekas F, Bronge L, Augustin M, Sjogren M, et al. A new rating scale for age-related white matter changes applicable to MRI and CT. Stroke. 2001;32(6):1318–1322. doi: 10.1161/01.str.32.6.1318. [DOI] [PubMed] [Google Scholar]
- Wechsler D. Wechsler Adult Intelligence Scale - Revised. New York: Psychological Corp; 1981. [Google Scholar]
- Wiser AK, Andreasen NC, O’Leary DS, Watkins GL, Boles Ponto LL, Hichwa RD. Dysfunctional cortico-cerebellar circuits cause ‘cognitive dysmetria’ in schizophrenia. Neuroreport. 1998;9(8):1895–1899. doi: 10.1097/00001756-199806010-00042. [DOI] [PubMed] [Google Scholar]
- Woods RP, Grafton ST, Holmes CJ, Cherry SR, Mazziotta JC. Automated image registration: I. General methods and intrasubject, intramodality validation. Journal of Computer Assisted Tomography. 1998;22(1):139–152. doi: 10.1097/00004728-199801000-00027. [DOI] [PubMed] [Google Scholar]
- Woods RP, Grafton ST, Watson JD, Sicotte NL, Mazziotta JC. Automated image registration: II. Intersubject validation of linear and nonlinear models. Journal of Computer Assisted Tomography. 1998;22(1):153–165. doi: 10.1097/00004728-199801000-00028. [DOI] [PubMed] [Google Scholar]