

Abstract
This study examined the functional specificity of dorsal anterior cingulate cortex (dACC) and medial prefrontal cortex (mPFC) regarding two elements of decision-making: the number of available decision options and the level of expected reward. Eighteen healthy participants were trained to recognize the reward value associated with several visual stimuli, and then were presented with groups of two, three, or four of these stimuli and asked to select the object associated with the highest reward. BOLD activation in dorsomedial prefrontal cortex (dmFC)/dACC was strongly positively associated with increases in the number of decision options but only weakly associated with increases in the level of expected reward. Activation in rostral anterior cingulate cortex (rACC)/mPFC and amygdala was related to increases in the level of expected reward but not increases in the number of decision options. The current results suggest functional specificity with respect to the roles of dACC/dmFC and rACC/mPFC in decision-making.
Keywords: decision, FMRI, anterior cingulate, caudate, medial prefrontal cortex, amygdala
Reward-based decision-making is underlain by a neural architecture that includes the amygdala, medial prefrontal cortex (mPFC), dorsomedial frontal cortex (dmFC)/dorsal anterior cingulate cortex (dACC), and striatum (Arana et al., 2003; Delgado et al., 2004; Elliott et al., 2004; Rogers et al., 2004). However, the specific functional contributions of these regions during decision-making remain uncertain (Walton et al., 2004; Leland and Paulus, 2005). Two core aspects of decision-making include the magnitude of the reward associated with the available options, and the number of available options among which to decide. The present study aimed to examine the functional specificity of structures associated with two elements of decision-making by using functional magnetic resonance imaging (FMRI) in conjunction with a novel decision task incorporating variations in (a) the level of expected reward and (b) the number of available decision options.
Deciding among multiple options requires first assessing the relative reward values associated with the various options. The representation of reward value in conjunction with decision-making is associated with activity in a fronto-limbic network including the mPFC and the amygdala (Bechara et al., 2000; Montague and Berns, 2002; Arana et al., 2003; O’Doherty, 2004; Schoenbaum and Roesch, 2005). Medial prefrontal cortex is considered to be involved in the representation of stimulus-reward relationships (Rolls, 1996; Elliott et al., 2003; Elliott et al., 2004) and activity within mPFC has been shown to reflect anticipated reward values (Schoenbaum et al., 1998; Tremblay and Schultz, 1999; Elliott et al., 2003; Cox et al., 2005).
While the literature is consistent with suggestions that mPFC signals reinforcement expectancies (Montague and Berns, 2002; Schoenbaum and Roesch, 2005), what remains less clear is the extent to which this region is involved in choice rather than providing information to other regions which make the choice. It has been suggested that middle frontal cortex is involved in the comparison of reward values on the basis of a significant correlation between middle frontal cortex activity and subjective reports of choice difficulty (Arana et al., 2003). This predicts that mPFC will show increased activity as choice difficulty increases. One way to increase choice difficulty is to increase the number of available choices. Previous research has implicated other regions of frontal cortex with selection of verbal response options and shown that regions involved in selection increase in activity with the number of available options (Thompson-Schill et al., 1997; Nathaniel-James and Frith, 2002; Badre et al., 2005) and that the effects of damage to these regions are increasingly pronounced with the number of available options (Robinson et al., 1998; Thompson-Schill et al., 1998). If mPFC is involved in the comparison of reward values, it can be predicted that as the number of rewarded response options to compare increases so should mPFC activity increase.
A region dorsal to the cingulate gyrus and rostral to the anterior commissure plane, usually termed dorsal anterior cingulate cortex (dACC), has been associated with monitoring response conflict, or the effort associated with response selection (Elliott and Dolan, 1998; Botvinick et al., 1999; Badre and Wagner, 2004; Botvinick et al., 2004; Nunez et al., 2005) and the degree of dACC activation increases with conflict severity (Botvinick et al., 1999; Paus, 2001; Greene et al., 2004). According to Cohen’s model of response conflict (Botvinick et al., 1999; Botvinick et al., 2001), dACC is activated by the degree of competition between conflicting responses. From this computational account it can therefore be predicted that as the number of competing responses associated with a particular trial increases, activation in dACC should increase.
The present study incorporated parametric increases in response conflict and reward value in order to distinguish the functional specificity of structures associated with these two aspects of decision-making. Participants were first trained to recognize the reward value associated with pictographic stimuli. They were then presented with sets of two, three, or four of these stimuli from which they could choose one stimulus.
On the basis of Cohen’s modeling of response conflict (Botvinick et al., 2001; Botvinick et al., 2004; Yeung et al., 2004) we predicted that activity in dACC would be positively associated with the degree of response conflict, operationalized as the number of available response options. Contrasting predictions were made with respect to mPFC: If mPFC is involved in the comparison of reward values, as suggested by Arana et al (2003), then it was predicted that mPFC would show increased activity as choice difficulty increases. In contrast, if mPFC signals reinforcement expectancies, as has been suggested (Knutson et al., 2005; Montague and Berns, 2002; Schoenbaum and Roesch, 2005), mPFC should show increased activity as reward magnitude increases.
Moreover, if, as has been suggested (Blair, 2004; Schoenbaum and Roesch, 2005; Schoenbaum and Setlow, 2001), the amygdala communicates reward expectancies to mPFC then the amygdala should also show increased activity as reward magnitude increases. Connectivity analyses should also indicate positive connectivity between the two regions. Using stimulus/response/reward-based tasks related to the one used in the present study, our group has consistently found associations between activity in the amygdala and middle frontal cortex using both correlational (Nakic et al, 2006) and functional connectivity (Budhani et al., 2006) analyses. No predictions were made regarding regions that might be involved in mediating the interaction between response conflict (number of response options) and magnitude of reward as, to our knowledge, no position would formally predict such interactions. The current study tests these predictions.
MATERIALS AND METHODS
Participants
Eighteen healthy right-handed participants (13 females; mean age 27.9 years old; range, 21–37 years old) from the Washington, D.C., metropolitan area volunteered for the study and were paid for their participation. All participants gave written, informed consent before participating in the study, in accordance with the guidelines of the Institutional Review Board at the National Institutes of Health. All participants were in good health, with no history of psychiatric or neurological disease. These 18 participants met criterion for task performance (providing ≥20 correct responses at each of the three levels of response conflict).
MRI data acquisition
Subjects were scanned during task performance using a 1.5 Tesla GE Signa scanner. A total of 150 functional images per participant were taken, with a gradient echo-planar imaging (EPI) sequence (repetition time = 3000 ms, echo time = 30 ms, 64 × 64 matrix, flip angle 90°, FOV 24 cm). Coverage was obtained with 31 axial slices (thickness, 4mm, in-plane resolution 3.75 × 3.75 mm). Following the functional scans, a high-resolution anatomical scan was obtained (three-dimension Spoiled GRASS with inversion recovery prep pulse; repetition time = 8.1 ms, echo time = 1.8 ms; field of view = 24 cm; flip angle = 20°; 128 axial slices; thickness = 1.5 mm; 256 × 256 matrix) in register with the EPI dataset, covering the whole brain.
Multiple response options task and experimental procedure
During the scan session, five experimental runs were acquired from each subject. Each run was comprised of two types of phases, learning phases and testing phases, both of which involved an event-related design. Within each run were two learning and two testing phases (for a total of 7.5 minutes per run). Each testing phase was immediately preceded by the relevant learning phase. Each run began and concluded with five 3000 ms baseline fixation trials.
During each learning phase, participants were trained to recognize the reward values (number of points) associated with seven Snodgrass images (Snodgrass and Vanderwart, 1980; Cycowicz et al., 1997). These images are simple black-and-white line drawings of familiar animate and inanimate objects, e.g., an umbrella, a barn, a butterfly. The pictures are commonly used in cognitive tasks because they have been standardized in terms of name agreement, image agreement, familiarity, and visual complexity. Our task used stimuli that were matched for complexity and familiarity across conditions. In each trial during the learning phase, two images were presented onscreen. One image was always a “dummy” stimulus, worth zero points. The other image was one of the test stimuli, with a reward value between 1000 and 7000 points. Participants were told always to select the image worth the greatest number of points, and so quickly came to select only the test stimuli in each learning phase.
Each image appeared in one of four locations on the screen, the locations being demarcated by vertical lines. The images were presented for 2000 ms, during which time the participant could make a manual button press response to select an image. Responses were entered with the four fingers of the right hand using a four-button response box, each button mapping onto one of four possible on-screen locations. Immediately afterwards a feedback screen appeared for 1000 ms, indicating the number of points the participant had earned. Participants thus came to learn the reward value associated with each test stimulus. Each learning phase consisted of 28 trials, presented in random order. Twelve randomly occurring fixation trials (jitters) were also presented per learning phase.
In each testing phase, combinations of two, three, or four of the images shown in the learning phase appeared in the onscreen columns and participants again made a manual button press to select the stimulus worth the greatest number of points. The stimuli appeared for 2700 ms, during which time participants could make a manual button press response using the four-button box. No feedback was given in this phase. A fixation cross was presented for 300 ms at the end of each test trial. Each testing phase contained a total of 12 test stimuli (such that each type of stimulus was presented 10 times across the 5 runs). Sixteen variable inter-trial interval fixation trials (jitters) were included in each testing phase, lasting 3000 ms each. Trial ordering was randomized across runs and across subjects, such that no two trial types were more likely to be contiguous than any other two trial types. The most highly valued stimulus was always worth 4000, 5000, 6000, or 7000 points. The maximum available rewards were kept constant across the three types of response conflict trial (e.g., each stimulus worth 7000 points appeared with equal frequency across all three response-option conditions). In all trials, the most highly valued stimulus was paired with the next-most highly valued stimulus, so that reward value discrepancies did not vary across trial types. The reward values were symbolic and participants’ performance did not affect the compensation they received. See Fig. 1 for a schematic illustration of the study design.
Fig. 1.
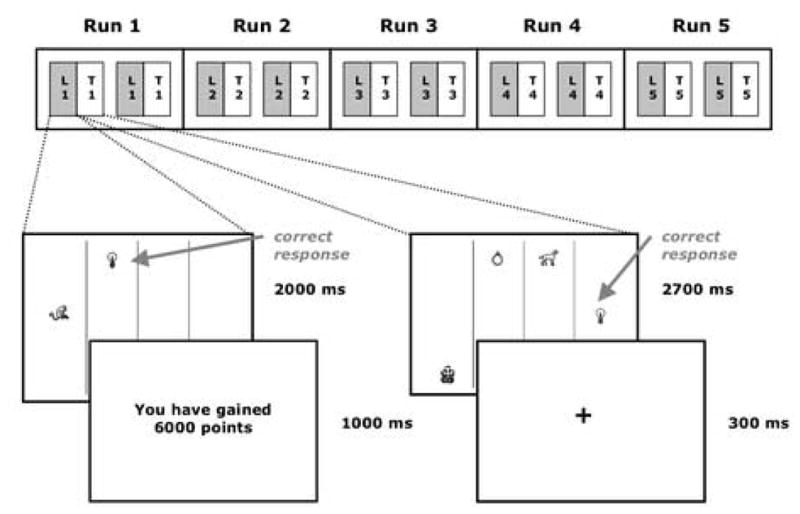
Schematic diagram of the study design. In each of 5 runs, subjects saw a learning and a testing phase, each repeated twice. In each learning phase, pairs of images appeared for 2000 ms. Subjects selected one image via button press and were provided with feedback. In each testing phase, combinations of 2, 3, or 4 images appeared for 2700 ms and subjects selected one via button press. No feedback was provided. Also included in both learning and testing phases were randomly occurring fixation (jitter) trials.
Each of the five runs used a separate stimulus set (repeated twice within each run) and was programmed in E-Studio. Stimuli were presented on a computer display that was projected onto a mirror in the MRI scanner. Participants were placed in a light head restraint within the scanner to limit movement during acquisition. (Subsequent analyses indicated that no participant moved more than 4 mm during the scan.1)
Behavioral data analysis
Confirmatory analyses were conducted in SPSS to verify that increasing the number of response options led to increased response conflict. This was done by calculating the mean error rate and the mean RT across point-value and response-option conditions and comparing these values using 3 (number of response options) × 4 (reward value) repeated-measures ANOVAs.
FMRI analysis
Data were analyzed within the framework of the general linear model using Analysis of Functional Neuroimages (AFNI) (Cox, 1996). Both individual and group-level analyses were conducted. The first 4 volumes in each scan series, collected before equilibrium magnetization was reached, were discarded, leaving 730 TRs per subject. Motion correction was performed by registering all volumes in the EPI dataset to a volume that was collected shortly before acquisition of the high-resolution anatomical dataset.
The EPI datasets for each participant were spatially smoothed (using an isotropic 6 mm Gaussian kernel) to reduce the influence of anatomical variability among the individual maps when generating group maps. The time series data were then normalized by dividing the signal intensity at each time point by the mean signal intensity for each run and multiplying the result by 100. As a result, all signal amplitude and regression coefficients represent a percent signal change from the mean.
Regressors were created by convolving the train of stimulus events with a gamma variate hemodynamic response function to account for the slow hemodynamic response (Cohen, 1997). It will be recalled that our task was a 3 (number of response options) × 4 (level of maximum reward value) design. We thus created twelve regressors, one for each combination of response conflict and reward value. Only correct responses were included in these regressors. An additional three regressors were created for incorrect responses, learning phase trials and fixation point trials. Data from the learning phases of the study were not analyzed.
Linear regression modeling was performed using the full set of regressors to model baseline drift and residual motion artifact. The baseline was modeled by a 1st-order function and motion artifacts were modeled using the 6 estimated rigid-body motion parameters.
Voxel-wise group analysis involved transforming single-subject beta coefficients into the standard coordinate space (Talairach and Tournoux, 1988). Following normalization, voxels measured 3 mm3. To identify brain regions responding to the degree of response conflict and the reward value, a 3 (response options) × 4 (reward values) random-effects ANOVA was performed on the means of all regressors compared to baseline (fixation). This resulted in a group map of areas of differential activation. A subset of clusters showing significant differential activation were selected according to a priori hypotheses about the regions involved in decision making. These clusters were used to define functional regions of interest (ROIs). Average activation levels for individual subjects within these ROIs were calculated for each regressor. These data were analyzed using contrast comparisons to determine the pattern of activation across conditions. To correct for multiple comparisons, a spatial clustering operation was performed using AlphaSim (Ward, 2000) with 1,000 Monte Carlo simulations taking into account the entire EPI matrix, with a map-wise false-positive probability of P<0.05. The labeling of anatomical locations was determined by Talairach-Tournoux Daemon.
Connectivity analysis
We measured functional connectivity by examining covariation across the whole brain with the activation for two seeds within functionally defined ROIs (amygdala and dACC; see below). The amygdala was chosen because of previous suggestions (Arana et al., 2004; Blair, 2004; Schoenbaum and Roesch, 2005), that this structure communicates reward expectancies to mPFC. This predicts positive connectivity should be found between the two regions for the type of paradigm considered in this study. dACC was chosen because of our interest in determining which regions dACC might be communicating with when attempting to resolve the response conflict engendered by the current paradigm.
Voxels with peak signal change for the contrast were identified within both amygdala and dACC. In two separate connectivity analyses, these voxels became our “seed” voxels. First, individual subjects’ time series were converted to common talairach space according to their structural data set. The time series within the seed voxels for each subject was extracted. Baseline plus linear and quadratic trend were removed from each voxel’s time series. The average of the resulting time series inside the brain was treated as a global signal and used as a covariate in the correlation analysis. Then a voxel-wise correlation analysis was conducted between each individual voxel’s time series and that of the identified seed. The proportion of the variation in the signal that could be explained by the correlation with the seed was determined by squaring the resulting correlation coefficient. Correlation coefficients were converted to a Gaussian variable using a Fisher transformation formula in order to reduce the skew and normalize the sampling distribution. To identify regions significantly positively or negatively correlated with the target voxel at group level, a one-sample t-test was performed on the transformed correlation coefficients.
RESULTS
Behavioral data
Table 1 shows the mean number of correct responses and the median RTs associated with correct responding across conditions. (Prior to conducting parametric analyses, it was ascertained that the RT data displayed significant positive skewness. Thus, median scores for each participant on each variable were analyzed instead of mean scores.) The results of the 3 (number of response options) × 4 (reward value) ANOVA we calculated for correct responses revealed a main effect for number of response options, F(2, 34)=5.981, P<0.01, such that participants made more errors as the number of available response options increased. A main effect of reward value was also found, F(3, 51)=7.05, P<0.001, such that participants made fewer errors as the available reward value increased. No interaction between these variables was seen, F(6, 102)=1.79, P>0.10.
Table 1.
Mean rate of correct responding and median RTs across conditions.
| % Correct Responses (SEM) | Median RT in milliseconds (SEM) | |
|---|---|---|
| Number of response options | ||
| Two | 76.7 (0.9) | 1345 (25) |
| Three | 75.7 (0.9) | 1520 (25) |
| Four | 70.4 (0.7) | 1724 (40) |
| Reward value for correct response | ||
| 4000 points | 67.8 (1.1) | 1740 (33) |
| 5000 points | 71.7 (0.7) | 1635 (37) |
| 6000 points | 81.1 (0.5) | 1499 (30) |
| 7000 points | 74.8 (0.8) | 1245 (32) |
For median RTs, a significant main effect of response options was also seen, F(2, 34)=78.91, P<0.001, such that response times increased as the number of available response options increased. For median RTs, a main effect for reward value was also found, F(3, 51)=79.17, P<0.001, such that participants responded more quickly as the available reward value increased (Table 1). An interaction between these variables was also found, F(6, 102)=4.41, P<0.01. However, an examination of the means reveals no clear pattern for this interaction. Thus, in general, the RT and response options data parallel one another: in the conditions in which accuracy decreases, RT generally increases.
FMRI data
Differences by response conflict
Activation in several cortical regions was modulated by number of available rewarded response options, F=9.59, P<0.0005; P<0.05, corrected (Table 2). We selected this uncorrected significance level in order to differentiate clusters of activation that were contiguous at lower significance thresholds. No areas of activation were apparent at P<0.005 that were not apparent at this threshold. Regions that survived correction included right dACC (centered at Talairach coordinates x = 2, y = 25, z = 37), as well as left caudate/bilateral thalamus (Fig. 2), bilateral precentral gyrus (BA 6), bilateral precuneus (BA 7), and right middle occipital gyrus.
Table 2.
Significant differential activation associated with changes in number of response options and in reward value
| Region | BA | mm3 | x | y | z | L/R |
|---|---|---|---|---|---|---|
| Response options, P<0.0005 (*corrected P<0.05) | ||||||
| Cingulate gyrus (dACC/dmFC)* | 32 | 1863 | 2 | 25 | 37 | L/R |
| Precentral gyrus* | 6 | 4050 | −35 | 0 | 32 | L |
| 6 | 4050 | 38 | 0 | 39 | R | |
| Medial frontal gyrus | 6 | 540 | −20 | 2 | 55 | L |
| Caudate/thalamus* | 2673 | −2 | −5 | 12 | L | |
| Precuneus* | 7 | 2376 | −20 | −70 | 51 | L |
| 7 | 2538 | 26 | −63 | 48 | R | |
| Middle occipital gyrus* | 18 | 4260 | 23 | −86 | 11 | R |
| Reward value, P<0.005 (*corrected P<0.05, **uncorrected P<0.05) | ||||||
| Medial frontal gyrus (rACC/mPFC) | 32/10 | 756 | −8 | 44 | 15 | L |
| Medial frontal gyrus | 6 | 1161 | −2 | 15 | 49 | L |
| Middle frontal gyrus | 6 | 1188 | −23 | −4 | 52 | L |
| 6 | 783 | −41 | 0 | 42 | L | |
| 6 | 891 | 26 | −1 | 52 | R | |
| 9 | 1431 | −38 | 19 | 30 | L | |
| Amygdala** | 405 | 26 | −1 | −15 | R | |
| Insula | 756 | −26 | 23 | 7 | L | |
| Supramarginal gyrus* | 39 | 5319 | −44 | −59 | 26 | L |
| 40 | 4104 | −56 | −49 | 30 | R | |
| Middle occipital gyrus | 891 | 38 | −63 | −8 | R | |
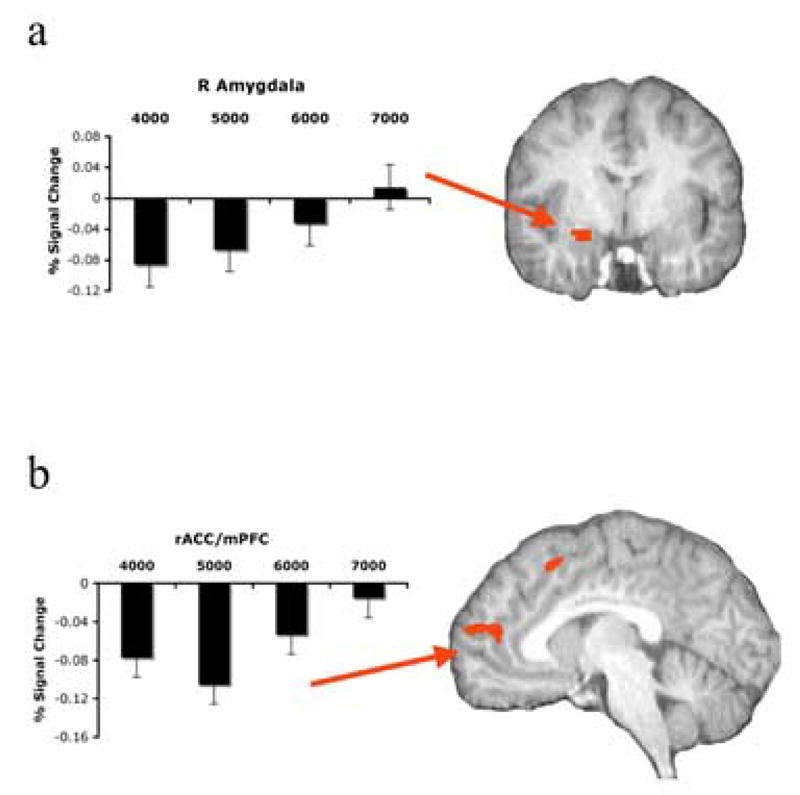
Fig. 2.
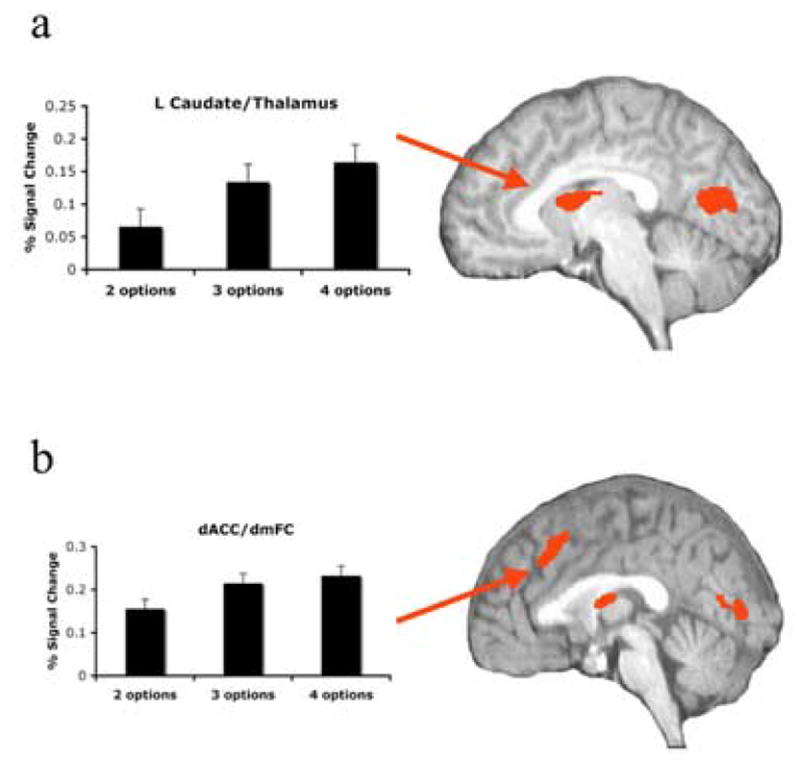
Significant differential activation associated with reward value [a: left amygdala (x, = 26, y = −1, z = −15); b: rACC/mPFC (x = −8, y = 44, z = 15)]. Also associated percent signal change from baseline (BOLD response as a function of available rewarded response options).
Activation in all of these regions increased in response to increasing response conflict. To further interrogate the pattern of results, we conducted two types of contrast tests for each region. First, a linear contrast (λ = −1, 0, 1) was calculated across all three levels of response-options to directly test our hypothesis that parametric increases in response conflict are associated with linear increases in BOLD activation. Next, pairwise comparisons of BOLD activation were conducted for 2 versus 3 options and 3 versus 4 options. Results of the pairwise contrasts are reported where significant.
Significant linear increases in BOLD activation accompanied parametric increases in response conflict in all regions: dACC: t(17)=4.53, P<0.001 (2 v. 3 options: t(17)=5.29, P<0.001); caudate/thalamus: t(17)=6.11, P<0.001 (2 v. 3 options: t(17)=3.98, P<0.001; 3 v. 4 options: t(17)=2.03, P<0.06); left precentral gyrus: t(17)=7.02 P<0.001 (2 v. 3 options: t(17)=6.21, P<0.001; 3 v. 4 options: t(17)=2.54, P<0.05); right precentral gyrus: t(17)=6.63, P<0.001 (2 v. 3 options: t(17)=6.31, P<0.001; 3 v. 4 options: t(17)=2.97, P<0.01); left precuneus: t(17)=4.98, P<0.005 (2 v. 3 options: t(17)=4.77, P<0.001; 3 v. 4 options: t(17)=2.24, P<0.05); right precuneus: t(17)=5.11, P<0.001 (2 v. 3 options: t(17)=4.40, P<0.001; 3 v. 4 options: t(17)=2.35, P<0.05); right middle occipital gyrus: t(17)=8.21, P<0.001 (2 v. 3 options: t(17)=4.15, P<0.001; 3 v. 4 options: t(17)=4.64, P<0.001).
We also conducted follow-up ANOVAs in SPSS in which we compared the extracted beta weights associated with our 12 regressors. This analysis was conducted to determine whether a main effect or interaction involving reward value existed in our dACC cluster but was not detected using our AFNI analysis. The results confirmed that BOLD activation in dACC was primarily influenced by number of response options (F(2, 34)=16.26, P<0.001). In addition, we found a small main effect of reward value, F(3, 51)=3.64, P<0.05, with BOLD activation decreasing as a function of increasing reward value. We did not find an interaction between these variables, F(6, 102)=0.68, ns (Fig. 5).
Fig. 5.
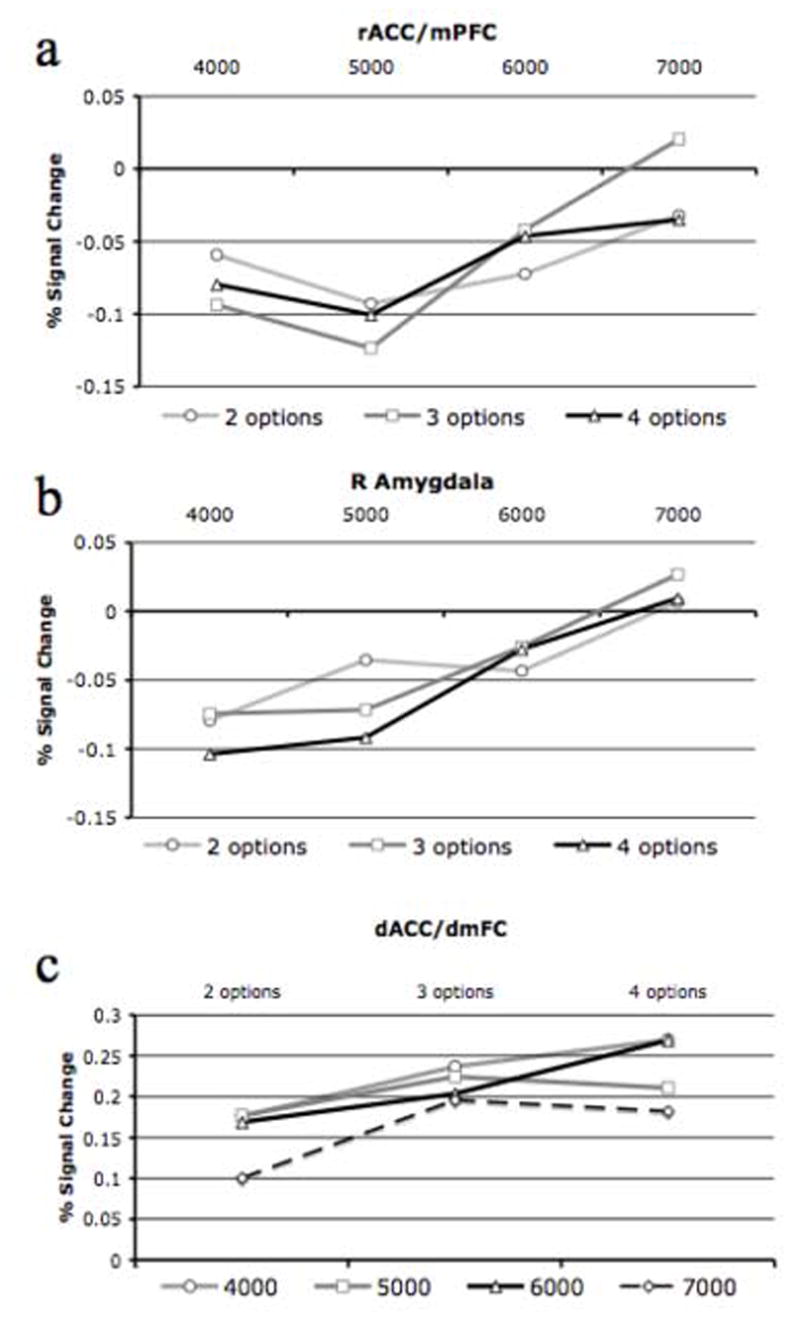
BOLD response across all regressors shown as percent signal change from baseline [a: rACC/mPFC, b: right amygdala, c: dACC/dmFC).
Connectivity analyses
For the dACC seed, we found significant positive connectivity, t(17)=5.375, P<0.00005, with left caudate (Fig. 4b) and right middle frontal gyrus (BA 6, x = 39, y = 1, z =45), and negative connectivity with left superior parietal lobule (BA 7, x = −31, y = 68, z =56).
Fig. 4.
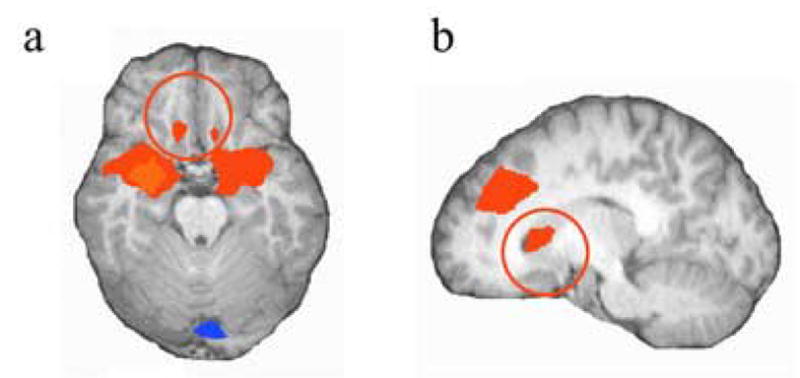
Caudate (x = −7, y = 13, z = 6) activation significantly correlated with activation in maximally activated dACC/dmFC voxel.
Differences by reward value
Activation in several cortical regions was modulated by number of available rewarded response options, F=4.82, P<0.005; P<0.05, corrected (Table 2). Regions in bilateral supramarginal gyrus survived correction for multiple comparisons. Activation in left medial prefrontal gyrus/rostral anterior cingulate cortex (rACC/mPFC, BA 10/32, x = −8, y = 44, z = 15), our primary area of interest, was significant at P<0.005, uncorrected. Also significant at this threshold were left insula, left middle frontal gyrus (BA 9), bilateral middle frontal gyrus (BA 6), left medial frontal gyrus (BA 6), and right middle occipital gyrus (BA 37).
In rACC/mPFC (Fig. 3b) and bilateral supramarginal gyrus, activation increased (deactivation decreased) in response to increasing reward value. By contrast, activation in the remaining regions decreased in response to increasing reward value. Again, linear contrasts (λ = −3, −1, 1, 3) were calculated across all four levels of reward value to directly test our hypothesis that parametric increases in reward are associated with linear increases in BOLD activation. Next, pairwise comparisons were conducted for each successive pair of reward values (e.g., 4000 vs 5000 points, 5000 vs. 6000 points, etc.). Results of the pairwise contrasts are reported where significant.
Fig. 3.
Significant differential activation associated with response conflict [a: caudate/thalamus (x = −2, y = −5, z = 12); b: dACC/dmFC (x = 2, y = 25, z = 37)]. Also associated percent signal change from baseline (BOLD response as a function of predicted reward value).
Significant linear changes in BOLD activation accompanied parametric increases in reward value in all regions: rACC/mPFC: t(17)= 2.87, P<0.05 (5 v. 6000 points: t(17)=2.79, P<0.05; 6 v. 7000 points: t(17)=2.59, P<0.05); left supramarginal gyrus: t(17)= 3.95, P<0.005 (5 v. 6000 points: t(17)=3.25, P<0.01; 6 v. 7000 points: t(17)=2.26, P<0.05); right supramarginal gyrus: t(17)=5.24, P<0.001 (5 v. 6000 points: t(17)=2.83, P<0.05; 6 v. 7000 points: t(17)=3.07, P<0.01); left insula: t(17)=−3.09, P<0.01 (4 v. 5000 points: t(17)=2.15, P<0.05; 6 v. 7000 points: t(17)=3.72, P<0.005); left middle frontal gyrus (BA 9): t(17)=−3.35, P<0.005 (6 v. 7000 points: t(17)=3.41, P<0.005); left middle frontal gyrus (BA 6): t(17)=−4.74, P<0.001 (6 v. 7000 points: t(17)=3.66, P<0.005); right middle frontal gyrus (BA 6): t(17)=−3.83, P<0.005 (6 v. 7000 points: t(17)=3.11, P<0.01); left medial frontal gyrus (BA 6): t(17)=−3.43, P<0.005 (6 v. 7000 points: t(17)=3.83, P<0.005); right middle occipital gyrus: t(17)=−2.92, P<0.01 (6 v. 7000 points: t(17)=4.58, P<0.001).
For rACC/mPFC, we again conducted follow-up ANOVAs in SPSS in which we compared the extracted beta weights associated with our 12 regressors. The results confirmed that BOLD activation in rACC/mPFC was modulated by reward value, F(3, 51)=7.09, P<0.001. We did not, however, find that BOLD activation in this region was modulated by response conflict, F(2, 34)=0.06, ns, or the interaction between these variables, F(6, 102)=0.87, ns (Fig. 5).
To test the hypothesis that reward value would modulate amygdala activation, we conducted an ROI analysis to measure BOLD activation in the amygdala as delineated by the Talairach-Tournoux daemon. This analysis revealed significant increases in activation (decreases in deactivation) in the right amygdala/parahippocampal gyrus, t=2.79, P< 0.05 (x = 26, y = −1, z = −11) in response to increases in reward value (Fig. 3a). The linear contrast for this effect was significant, t(17)=3.82, P<0.001 (see Fig. 2a). No pairwise comparisons were significant.
For the amygdala, we again conducted follow-up ANOVAs in SPSS in which we compared the beta weights associated with our 12 regressors. The results confirmed that BOLD activation in the amygdala was modulated by reward value, F(3, 51)=4.28, P<0.01, but not by response conflict, F(2, 34)=0.35, ns, or the interaction between these variables, F(6, 102)=0.21, ns (Fig. 5).
Connectivity Analysis
For the amygdala seed, we found significant positive connectivity, t=5.374, P<0.00005, with a region of medial frontal gyrus (BA 25, x = 13, y = 22, z = −19) (Fig. 4a). This region was inferior and posterior to the region of rACC/mPFC we found to respond to reward value (see Fig. 4a). Also showing positive connectivity were left superior temporal gyrus/insula (BA 22, x = −48, y = −1, z = 4) and right superior temporal gyrus (BA 38, x = 54, y = 1, z = −8); showing significant negative connectivity was bilateral occipito-temoporal cortex (BA 37, x = 51, y = −62, z = −17).
Results by Response Options x Point Value interaction
No meaningful results resulted from the interaction of response options and point value, F=3.32, P<0.005; P<0.05. The sole region to survive correction was a region of occipital cortex (BA 18).
DISCUSSION
The present study used event-related FMRI to examine neural activation associated with decision-making. In particular, functional specificity for dACC/dmFC and rACC/mPFC was seen with respect to two key aspects of decision-making: number of response options and level of expected reward. As predicted, increasing the number of response options was strongly associated with increased BOLD responses in dACC/dmFC but did not have significant impact on the BOLD response within rACC/mPFC. In contrast, selecting a response associated with higher reward was associated with increased BOLD response in mPFC and the amygdala but only a weak change in BOLD response in dACC/dmFC.
Previous neuroimaging studies have implicated a region of the dACC/dmFC “overlying the cingulate sulcus approximately two centimeters rostral to the anterior commissure plane… [that] lies within Brodmann’s area Area 24 and 32” (Botvinick et al., 2004, p. 542) in the monitoring of response conflict (Elliott and Dolan, 1998; Botvinick et al., 1999; Carter et al., 1999). An area closely resembling the region of the dmFC/dACC identified as activated by response conflict was also activated by increased response conflict in the current study. Cohen and colleagues have argued that dmFC/dACC is activated by the degree of competition between conflicting responses (Botvinick et al., 2004). From this, we considered that it must follow that as the number of response options increases so should the amount of competition among the response options increase. Therefore the amount of dACC/dmFC activation should increase as well. This prediction was confirmed.
A number of prior studies have attempted to the extent to which activity in dACC/dmFC is associated with response conflict versus response selection requirements (Botvinick et al., 1999; Carter et al., 2000). Our task was not specifically designed to distinguish between these two possible mechanisms. However, it can be noted that response conflict was modulated parametrically across conditions by the inclusion of more or fewer response options, whereas the response selection requirement remained comparatively constant. Thus, we interpret the regions in which activation varied linearly as a function of the number of response options to be involved in conflict monitoring (e.g., Botvinick et al, 1999, 2004). However, it could be argued that as response conflict increases the need for response control increases as well.
The region of dACC/dmFC in which we found activity during increased response conflict is adjacent to and partially overlapping with the supplementary eye fields (SEF). It could be suggested that participants performed the task by serially searching for particular stimuli. Under such a position, the dACC/dmFC activation seen reflected simply the response to the increased number of stimuli on the screen such as might be seen during a visual search paradigm. However, three factors suggest that activation in this region is not simply a response to visual search. First, the task presented here was not a simple visual search task in that participants were not searching for a single optimal response. Rather, in each trial a different stimulus constituted the correct response. Because this was the case, the task could only be performed by calculating the reward level of each stimulus relative to the reward levels of each of the other stimuli being presented. Second, the area of maximum activation in this cluster lies in the most anterior portion of the cluster, squarely in dACC/dmFC. Third, increasing numbers of response options also generated activity in caudate and medial frontal gyrus (BA 6), which are regions frequently seen in tasks involving response conflict, such as the Stroop (Liu et al., 2004; Peterson et al., 2002).
It is also worth noting that assessment of the functionally identified ROIs within dACC, caudate, and medial frontal gyrus revealed that all three areas responded very similarly to the task features. Moreover, the connectivity analysis indicated highly significant positive connectivity among dACC and caudate. These findings further support the notion that these areas were functioning in a coordinated fashion. Of course, future work can also address this issue by recording eye movements.
The region of dACC/dmFC which showed increased activity as response conflict increased also showed increased activation to increasing rewards (p < 0.05). Previous work has suggested that dACC plays an important role in reward-related decision making (Bush et al., 2002; Richmond et al., 2003; Ridderinkhof et al., 2004; Rogers et al., 2004; Walton et al., 2004; Williams et al., 2004). Rogers et al. (2004) reported that regions of ACC were involved in deliberating over choices involving large vs. small gains. Other work has shown increased ACC activity during task conditions where reward changes suggest that the participant should modify their behavioral response (Bush et al., 2002; Williams et al., 2004), or when participants freely choose a new rule (Walton et al., 2004). The current data are compatible with the suggestion that dACC/dmFC plays a role in reward-based decision making; however, they indicate that the response of dACC/dmFC to reward information is far less than this region’s response to response conflict.
In this context, it is worth noting that activity in a region of dmFC superior to dACC was found to decrease as reward value increased in our task. This result was not predicted a priori, leaving us only able to speculate on its possible function. This region is considered pre-supplementary motor area (pre-SMA), which has been found to be sensitive to movements that are self-initiated compared to movements that are externally cued (Cunnington et al., 2005). We speculate that responding to a 7000-point stimulus in our paradigm may have been a relatively “externally cued” event, because the 7000-point stimulus was always the correct option. By contrast, the fewer points a stimulus was worth, the less likely it was to be the correct response in a given trial. Thus, determining whether to select one of these stimuli may have required more control on the subject’s part. It should be noted that this region of pre-SMA overlaps minimally with the cingulate gyrus, and that the maximally activated voxel within it was in medial frontal gyrus.
Selecting a response associated with higher reward was associated with increased BOLD response in rACC/mPFC and the amygdala. This is consistent with previous work showing that activation in rACC/mPFC often co-occurs with activation in the amygdala during tasks in which reinforcement values are associated with conditioned stimuli (Holland and Gallagher, 2004; Cox et al., 2005). The extent of rACC/mPFC and amygdala activation has been found to reflect the relative value of the anticipated reward (O’Doherty et al., 2001; Arana et al., 2003; Elliott et al., 2003; Small et al., 2003; Schoenbaum and Roesch, 2005); though it should be noted that the area of activation seen here for reward conditions is slightly superior to that reported in some previous studies. It has been suggested that middle frontal cortex codes the expectation of reinforcement, which is acquired via input from the amygdala, and is used to guide behavior (Schoenbaum et al., 2003). In line with this suggestion we observed significant positive connectivity between activity within the amygdala and a region of OFC/mPFC somewhat inferior and posterior to the BOLD response in middle frontal cortex identified in the main contrast (Figs. 2 and 4; coordinates are x = −8, y = 44, z = 15 and x = 13, y = 22, z = −19, and respectively). The region of OFC/mPFC identified in the connectivity analysis is one for which activity is frequently associated with amygdala activity (Budhani et al., 2006; Pezawas et al., 2005; Nakic et al., 2006; Siegle et al., 2006).
There have also been suggestions that rACC/mPFC is involved in the comparison of goal values following data that rACC/mPFC activity is correlated with subjective reports of choice difficulty (Arana et al., 2003). Some support for this argument might be suggested by our finding of decreased activity within this region as a function of decreases in available reward value. We speculated above, with respect to dACC, that responding to a 7000-point stimulus may have been a relatively “externally cued” event because it was always the correct option whereas the fewer points a stimulus was worth, the less likely it was to be the correct response in a given trial. It could be argued (following the suggestion of an anonymous reviewer) that increased deactivation in rACC/mPFC reflects increased task difficulty. Such a suggestion is based on studies that show regions of the medial PFC, underlying part of so-called “default network”, deactivate relative to baseline when performing a cognitive task (Gusnard and Raichle, 2001). However, two important points should be noted with respect to this.
First, prior studies in which response difficulty has not covaried with reward value have nonetheless shown activations in mPFC/rACC to be associated with reward value (Elliott et al., 2000; Knutson et al., 2005; O’Doherty et al., 2003; Rogers et al., 2004). Second, if rACC/mPFC were responding to task difficulty, then we might have expected it to show increased activation as a function of the number of response options given that there would be more goal values to compare. However, in contrast to the BOLD response within dACC/dmFC, no significant change in BOLD response was seen within rACC/mPFC as a function of the number of response options. We suggest therefore, following Schoenbaum (Blair, 2004; Schoenbaum and Roesch, 2005; Schoenbaum and Setlow, 2001) and prior data (Budhani et al., 2006; Kosson et al., 2006) that rACC/mPFC codes reinforcement expectancies, perhaps normalizing the value of competing outcomes (cf. Montague and Berns, 2002). However, this region itself does not directly select between responses.
In conclusion, the current study used FMRI to assess the BOLD responses associated with performance in a decision-making task incorporating multiple response options of varying reward value. In keeping with our predictions, dACC/dmFC was more strongly activated by the number of response options than by expected reward value, and rACC/mPFC and the amygdala were activated by the level of the expected reward associated with the response made, regardless of the number of available decision options. In short, the current results suggest functional specificity with respect to the roles of dACC/dmFC and rACC/mPFC in decision-making.
Acknowledgments
This research was supported by the Intramural Research Program of the NIH:NIMH. We wish to thank Ellen Condon for her assistance with data collection.
Footnotes
AFNI analysis was repeated excluding the two subjects who showed more than 2 mm movement. No noteworthy changes in the resulting activation map occurred as a result of the exclusion of these subjects except for a slight increase in the size of the amygdala activation.
Publisher's Disclaimer: This is a PDF file of an unedited manuscript that has been accepted for publication. As a service to our customers we are providing this early version of the manuscript. The manuscript will undergo copyediting, typesetting, and review of the resulting proof before it is published in its final citable form. Please note that during the production process errors may be discovered which could affect the content, and all legal disclaimers that apply to the journal pertain.
References
- Arana FS, Parkinson JA, Hinton E, Holland AJ, Owen AM, Roberts AC. Dissociable contributions of the human amygdala and orbitofrontal cortex to incentive motivation and goal selection. J Neurosci. 2003;23:9632–9638. doi: 10.1523/JNEUROSCI.23-29-09632.2003. [DOI] [PMC free article] [PubMed] [Google Scholar]
- Badre D, Wagner AD. Selection, integration, and conflict monitoring; assessing the nature and generality of prefrontal cognitive control mechanisms. Neuron. 2004;41:473–487. doi: 10.1016/s0896-6273(03)00851-1. [DOI] [PubMed] [Google Scholar]
- Badre D, Poldrack RA, Pare-Blagoev EJ, Insler RZ, Wagner AD. Dissociable controlled retrieval and generalized selection mechanisms in ventrolateral prefrontal cortex. Neuron. 2005;47:907–918. doi: 10.1016/j.neuron.2005.07.023. [DOI] [PubMed] [Google Scholar]
- Bechara A, Damasio H, Damasio AR. Emotion, decision making and the orbitofrontal cortex. Cereb Cortex. 2000;10:295–307. doi: 10.1093/cercor/10.3.295. [DOI] [PubMed] [Google Scholar]
- Blair RJ. The roles of orbital frontal cortex in the modulation of antisocial behavior. Brain Cogn. 2004;55:198–208. doi: 10.1016/S0278-2626(03)00276-8. [DOI] [PubMed] [Google Scholar]
- Botvinick M, Nystrom LE, Fissell K, Carter CS, Cohen JD. Conflict monitoring versus selection-for-action in anterior cingulate cortex. Nature. 1999;402:179–181. doi: 10.1038/46035. [DOI] [PubMed] [Google Scholar]
- Botvinick MM, Cohen JD, Carter CS. Conflict monitoring and anterior cingulate cortex: an update. Trends Cogn Sci. 2004;8:539–546. doi: 10.1016/j.tics.2004.10.003. [DOI] [PubMed] [Google Scholar]
- Botvinick MM, Braver TS, Barch DM, Carter CS, Cohen JD. Conflict monitoring and cognitive control. Psychol Rev. 2001;108:624–652. doi: 10.1037/0033-295x.108.3.624. [DOI] [PubMed] [Google Scholar]
- Budhani S, Marsh AA, Pine DS, Blair RJR. Neural correlates of response reversal: Considering acquisition. NeuroImage. 2006 doi: 10.1016/j.neuroimage.2006.08.060. in press. [DOI] [PubMed] [Google Scholar]
- Bush G, Vogt BA, Holmes J, Dale AM, Greve D, Jenike MA, et al. Dorsal anterior cingulate cortex: a role in reward-based decision making. Proc Natl Acad Sci USA. 2002;99:523–28. doi: 10.1073/pnas.012470999. [DOI] [PMC free article] [PubMed] [Google Scholar]
- Carter CS, Botvinick MM, Cohen JD. The contribution of the anterior cingulate cortex to executive processes in cognition. Rev Neurosci. 1999;10:49–57. doi: 10.1515/revneuro.1999.10.1.49. [DOI] [PubMed] [Google Scholar]
- Carter CS, Macdonald AM, Botvinick M, Ross LL, Stenger VA, Noll D, Cohen JD. Parsing executive processes: strategic vs. evaluative functions of the anterior cingulate cortex. Proc Natl Acad Sci USA. 2000;15:1944–8. doi: 10.1073/pnas.97.4.1944. [DOI] [PMC free article] [PubMed] [Google Scholar]
- Cohen MS. Parametric analysis of fMRI data using linear systems methods. NeuroImage. 1997;6:93–103. doi: 10.1006/nimg.1997.0278. [DOI] [PubMed] [Google Scholar]
- Cox RW. AFNI: software for analysis and visualization of functional magnetic resonance neuroimages. Comput Biomed Res. 1996;29:162–173. doi: 10.1006/cbmr.1996.0014. [DOI] [PubMed] [Google Scholar]
- Cox SML, Andrade A, Johnsrude IS. Learning to like: A role for human orbital frontal cortex in conditioned reward. J Neurosci. 2005;25:2733–2740. doi: 10.1523/JNEUROSCI.3360-04.2005. [DOI] [PMC free article] [PubMed] [Google Scholar]
- Cunnington R, Windischberger C, Moser E. Premovement activity of the pre-supplementary motor area and the readiness for action: studies of time-resolved event-related functional MRI. Hum Mov Sci. 2005;24:644–56. doi: 10.1016/j.humov.2005.10.001. [DOI] [PubMed] [Google Scholar]
- Cycowicz YM, Friedman D, Rothstein M, Snodgrass JG. Picture naming by young children: Norms for name agreement, familiarity, and visual complexity. J Exper Child Psychol. 1997;65:171–237. doi: 10.1006/jecp.1996.2356. [DOI] [PubMed] [Google Scholar]
- Delgado MR, Stenger VA, Fiez JA. Motivation-dependent responses in the human caudate nucleus. Cereb Cortex. 2004;14:1022–1030. doi: 10.1093/cercor/bhh062. [DOI] [PubMed] [Google Scholar]
- Elliott R, Dolan RJ. Activation of different anterior cingulate foci in association with hypothesis testing and response selection. NeuroImage. 1998;8:17–29. doi: 10.1006/nimg.1998.0344. [DOI] [PubMed] [Google Scholar]
- Elliott R, Friston KJ, Dolan RJ. Dissociable neural responses in human reward systems. J Neurosci. 2000;20:6159–65. doi: 10.1523/JNEUROSCI.20-16-06159.2000. [DOI] [PMC free article] [PubMed] [Google Scholar]
- Elliott R, Newman JL, Longe OA, Deakin JF. Differential response patterns in the striatum and orbitofrontal cortex to financial reward in humans: a parametric functional magnetic resonance imaging study. J Neurosci. 2003;23:303–307. doi: 10.1523/JNEUROSCI.23-01-00303.2003. [DOI] [PMC free article] [PubMed] [Google Scholar]
- Elliott R, Newman JL, Longe OA, Deakin JF. Instrumental responding for rewards is associated with enhanced neuronal response in subcortical reward systems. NeuroImage. 2004;21:984–990. doi: 10.1016/j.neuroimage.2003.10.010. [DOI] [PubMed] [Google Scholar]
- Greene JD, Nystrom LE, Engell AD, Darley JM, Cohen JD. The neural bases of cognitive conflict and control in moral judgment. Neuron. 2004;44:389–400. doi: 10.1016/j.neuron.2004.09.027. [DOI] [PubMed] [Google Scholar]
- Gusnard DA, Raichle ME. Searching for a baseline: functional imaging and the resting human brain. Nat Rev Neurosci. 2001;2:685–94. doi: 10.1038/35094500. [DOI] [PubMed] [Google Scholar]
- Holland PC, Gallagher M. Amygdala-frontal interactions and reward expectancy. Curr Opin Neurobiol. 2004;14:148–155. doi: 10.1016/j.conb.2004.03.007. [DOI] [PubMed] [Google Scholar]
- Knutson B, Taylor J, Kaufman M, Peterson R, Glover G. Distributed neural representation of expected value. J Neurosci. 2005;25:4806–12. doi: 10.1523/JNEUROSCI.0642-05.2005. [DOI] [PMC free article] [PubMed] [Google Scholar]
- Kosson DS, Budhani S, Nakic M, Chen G, Saad ZS, Vythilingam M, et al. The role of the amygdala and rostral anterior cingulate in encoding expected outcomes during learning. Neuroimage. 2006;29:1161–72. doi: 10.1016/j.neuroimage.2005.07.060. [DOI] [PubMed] [Google Scholar]
- Leland DS, Paulus MP. Increased risk-taking decision-making but not altered response to punishment in stimulant-using young adults. Drug Alcohol Depend. 2005;78:83–90. doi: 10.1016/j.drugalcdep.2004.10.001. [DOI] [PubMed] [Google Scholar]
- Liu X, Banich MT, Jacobson BL, Tanabe JL. Common and distinct neural substrates of attentional control in an integrated Simon and spatial Stroop task as assessed by event-related fMRI. NeuroImage. 2004;22:1097–106. doi: 10.1016/j.neuroimage.2004.02.033. [DOI] [PubMed] [Google Scholar]
- Montague PR, Berns GS. Neural economics and the biological substrates of valuation. Neuron. 2002;36:265–284. doi: 10.1016/s0896-6273(02)00974-1. [DOI] [PubMed] [Google Scholar]
- Nakic M, Smith BW, Busis S, Vythilingam M, Blair RJ. The impact of affect and frequency on lexical decision: the role of the amygdala and inferior frontal cortex. NeuroImage. 2006;31:1752–61. doi: 10.1016/j.neuroimage.2006.02.022. [DOI] [PubMed] [Google Scholar]
- Nathaniel-James DA, Frith CD. The role of the dorsolateral prefrontal cortex: evidence from the effects of contextual constraint in a sentence completion task. NeuroImage. 2002;16:1094–1102. doi: 10.1006/nimg.2002.1167. [DOI] [PubMed] [Google Scholar]
- Nunez JM, Casey BJ, Egner T, Hare T, Hirsch J. Intentional false responding shares neural substrates with response conflict and cognitive control. NeuroImage. 2005;25:267–277. doi: 10.1016/j.neuroimage.2004.10.041. [DOI] [PubMed] [Google Scholar]
- O’Doherty JP. Reward representations and reward-related learning in the human brain: insights from neuroimaging. Curr Opin Neurobiol. 2004;14:769–776. doi: 10.1016/j.conb.2004.10.016. [DOI] [PubMed] [Google Scholar]
- O’Doherty J, Critchley H, Deichmann R, Dolan RJ. Dissociating valence of outcome from behavioral control in human orbital and ventral prefrontal cortices. J Neurosci. 2003;23:7931–39. doi: 10.1523/JNEUROSCI.23-21-07931.2003. [DOI] [PMC free article] [PubMed] [Google Scholar]
- O’Doherty J, Kringelbach ML, Rolls ET, Hornak J, Andrews C. Abstract reward and punishment representations in the human orbitofrontal cortex. Nat Neurosci. 2001;4:95–102. doi: 10.1038/82959. [DOI] [PubMed] [Google Scholar]
- Paulus MP, Feinstein JS, Leland D, Simmons AN. Superior temporal gyrus and insula provide response and outcome-dependent information during assessment and action selection in a decision-making situation. NeuroImage. 2005;25:607–615. doi: 10.1016/j.neuroimage.2004.12.055. [DOI] [PubMed] [Google Scholar]
- Paus T. Primate anterior cingulate cortex: where motor control, drive and cognition interface. Nat Rev, Neurosci. 2001;2:417–424. doi: 10.1038/35077500. [DOI] [PubMed] [Google Scholar]
- Peterson BS, Kane MJ, Alexander GM, Lacadie C, Skudlarski P, Leung HC, May J, Gore JC. An event-related functional MRI study comparing interference effects in the Simon and Stroop tasks. Brain Res Cogn Brain Res. 2002;13:427–40. doi: 10.1016/s0926-6410(02)00054-x. [DOI] [PubMed] [Google Scholar]
- Pezawas L, Meyer-Lindenberg A, Drabant EM, Verchinski BA, Munoz KE, Kolachana BS, Egan MF, Mattay VS, Hariri AR, Weinberger DR. 5-HTTLPR polymorphism impacts human cingulate-amygdala interactions: a genetic susceptibility mechanism for depression. Nat Neurosci. 2005;8:828–34. doi: 10.1038/nn1463. [DOI] [PubMed] [Google Scholar]
- Richmond BJ, Liu Z, Shidara M. Neuroscience. Predicting future rewards Science. 2003;301:179–80. doi: 10.1126/science.1087383. [DOI] [PubMed] [Google Scholar]
- Ridderinkhof KR, van den Wildenberg WP, Segalowitz SJ, Carter CS. Neurocognitive mechanisms of cognitive control: the role of prefrontal cortex in action selection, response inhibition, performance monitoring, and reward-based learning. Brain Cogn. 2004;56:129–40. doi: 10.1016/j.bandc.2004.09.016. [DOI] [PubMed] [Google Scholar]
- Robinson G, Blair J, Cipolotti L. Dynamic aphasia: an inability to select between competing verbal responses? Brain. 1998;121:77–89. doi: 10.1093/brain/121.1.77. [DOI] [PubMed] [Google Scholar]
- Rogers RD, Ramnani N, Mackay C, Wilson JL, Jezzard P, Carter CS, Smith SM. Distinct portions of anterior cingulate cortex and medial prefrontal cortex are activated by reward processing in separable phases of decision-making cognition. Biol Psychiatry. 2004;55:594–602. doi: 10.1016/j.biopsych.2003.11.012. [DOI] [PubMed] [Google Scholar]
- Rolls ET. The orbitofrontal cortex. Philos Trans R Soc Lond B Biol Sci. 1996;351:1433–1443. doi: 10.1098/rstb.1996.0128. [DOI] [PubMed] [Google Scholar]
- Schoenbaum G, Chiba AA, Gallagher M. Orbitofrontal cortex and basolateral amygdala encode expected outcomes during learning. Nat Neurosci. 1998;1:155–9. doi: 10.1038/407. [DOI] [PubMed] [Google Scholar]
- Schoenbaum G, Roesch M. Orbitofrontal cortex, associative learning, and expectancies. Neuron. 2005;47:633–636. doi: 10.1016/j.neuron.2005.07.018. [DOI] [PMC free article] [PubMed] [Google Scholar]
- Schoenbaum G, Setlow B. Integrating orbitofrontal cortex into prefrontal theory: common processing themes across species and subdivisions. Learn Mem. 2001;8:134–47. doi: 10.1101/lm.39901. [DOI] [PubMed] [Google Scholar]
- Schoenbaum G, Setlow B, Saddoris MP, Gallagher M. Encoding predicted outcome and acquired value in orbitofrontal cortex during cue sampling depends upon input from basolateral amygdala. Neuron. 2003;39:855–67. doi: 10.1016/s0896-6273(03)00474-4. [DOI] [PubMed] [Google Scholar]
- Siegle GJ, Carter CS, Thase ME. Use of FMRI to predict recovery from unipolar depression with cognitive behavior therapy. Am J Psychiatry. 2006;163:735–8. doi: 10.1176/ajp.2006.163.4.735. [DOI] [PubMed] [Google Scholar]
- Small DM, Gregory MD, Mak YE, Gitelman D, Mesulam MM, Parrish T. Dissociation of neural representation of intensity and affective valuation in human gustation. Neuron. 2003;39:701–711. doi: 10.1016/s0896-6273(03)00467-7. [DOI] [PubMed] [Google Scholar]
- Snodgrass JG, Vanderwart M. A standardized set of 260 pictures: norms for name agreement, image agreement, familiarity, and visual complexity. J Exp Psychol [Hum Learn] 1980;6:174–215. doi: 10.1037//0278-7393.6.2.174. [DOI] [PubMed] [Google Scholar]
- Talairach J, Tournoux P. Co-planar stereotaxic atlas of the human brain. New York: Thieme; 1988. [Google Scholar]
- Thompson-Schill SL, D’Esposito M, Aguirre GK, Farah MJ. Role of left inferior prefrontal cortex in retrieval of semantic knowledge: a reevaluation. Proc Natl Acad Sci U S A. 1997;94:14792–14797. doi: 10.1073/pnas.94.26.14792. [DOI] [PMC free article] [PubMed] [Google Scholar]
- Thompson-Schill SL, Swick D, Farah MJ, D’Esposito M, Kan IP, Knight RT. Verb generation in patients with focal frontal lesions: a neuropsychological test of neuroimaging findings. Proc Natl Acad Sci U S A. 1998;95:15855–15860. doi: 10.1073/pnas.95.26.15855. [DOI] [PMC free article] [PubMed] [Google Scholar]
- Tremblay L, Schultz W. Relative reward preference in primate orbitofrontal cortex. Nature. 1999;398:704–708. doi: 10.1038/19525. [DOI] [PubMed] [Google Scholar]
- Yeung N, Cohen JD, Botvinick MM. The neural basis of error detection: conflict monitoring and the error-related negativity. Psychol Rev. 2004;111:931–59. doi: 10.1037/0033-295x.111.4.939. [DOI] [PubMed] [Google Scholar]
- Walton ME, Devlin JT, Rushworth MF. Interactions between decision making and performance monitoring within prefrontal cortex. Nat Neurosci. 2004;7:1259–1265. doi: 10.1038/nn1339. [DOI] [PubMed] [Google Scholar]
- Williams ZM, Bush G, Rauch SL, Cosgrove GR, Eskandar EN. Human anterior cingulate neurons and the integration of monetary reward with motor responses. Nat Neurosci. 2004;7(12):1370–75. doi: 10.1038/nn1354. [DOI] [PubMed] [Google Scholar]