

Abstract
The physicochemical properties of TOP (thimet oligopeptidase) and NEL (neurolysin) and their hydrolytic activities towards the FRET (fluorescence resonance energy transfer) peptide series Abz-GFSXFRQ-EDDnp [where Abz is o-aminobenzoyl; X=Ala, Ile, Leu, Phe, Tyr, Trp, Ser, Gln, Glu, His, Arg or Pro; and EDDnp is N-(2,4-dinitrophenyl)-ethylenediamine] were compared with those of site-mutated analogues. Mutations at Tyr605 and Ala607 in TOP and at Tyr606 and Gly608 in NEL did not affect the overall folding of the two peptidases, as indicated by their thermal stability, CD analysis and the pH-dependence of the intrinsic fluorescence of the protein. The kinetic parameters for the hydrolysis of substrates with systematic variations at position P1 showed that Tyr605 and Tyr606 of TOP and NEL respectively, played a role in subsite S1. Ala607 of TOP and Gly608 of NEL contributed to the flexibility of the loops formed by residues 600–612 (GHLAGGYDGQYYG; one-letter amino acid codes used) in NEL and 599–611 (GHLAGGYDAQYYG; one-letter amino acid codes used) in TOP contributing to the distinct substrate specificities, particularly with an isoleucine residue at P1. TOP Y605A was inhibited less efficiently by JA-2 {N-[1-(R,S)-carboxy-3-phenylpropyl]Ala-Aib-Tyr-p-aminobenzoate}, which suggested that the aromatic ring of Tyr605 was an important anchor for its interaction with wild-type TOP. The hydroxy groups of Tyr605 and Tyr606 did not contribute to the pH-activity profiles, since the pKs obtained in the assays of mutants TOP Y605F and NEL Y606F were similar to those of wild-type peptidases. However, the pH–kcat/Km dependence curve of TOP Y605A differed from that of wild-type TOP and from TOP Y606F. These results provide insights into the residues involved in the substrate specificities of TOP and NEL and how they select cytosolic peptides for hydrolysis.
Keywords: neurolysin, substrate and inhibitor specificity, site-directed mutagenesis, thimet oligopeptidase
Abbreviations: Abz, o-aminobenzoyl; ACE, angiotensin-converting enzyme; Aib, α-aminoisobutyric acid; Dcp, dipeptidyl carboxypeptidase; DTT, dithiothreitol; EDDnp, N-[2,4-dinitrophenyl]-ethylenediamine; FRET, fluorescence resonance energy transfer; JA-2, N-[1-(R,S)-carboxy-3-phenylpropyl]Ala-Aib-Tyr-p-aminobenzoate; MALDI-TOF, matrix-assisted laser-desorption ionization–time-of-flight; NEL, neurolysin; TFA, trifluoroacetic acid; TOP, thimet oligopeptidase
INTRODUCTION
TOP (thimet oligopeptidase; EC 3.4.24.15) and NEL (neurolysin; EC 3.4.24.16), which were initially detected and purified from rat brain homogenates [1,2], are zinc-dependent peptidases of the metallopeptidase M3 family that contain the HEXXH motif in their primary sequence [3–5]. Studies using specific inhibitors have suggested that TOP and NEL cleave bioactive peptides inside and outside the central nervous system [6–8]. In addition, the observation that TOP can degrade or bind to several MHC-I antigenic peptides [9–11], which are 8–11 amino acid fragments generated in the cytoplasm by proteasomes [12], raises the possibility that TOP, and perhaps NEL, may participate in the intracellular metabolism of peptides [13–15].
A distinguishing feature of these peptidases is that their catalytic centres are located in a deep channel that provides access to only short peptides [5,16]. In vitro, TOP and NEL hydrolyse many bioactive peptides, including bradykinin, neurotensin, opioid peptides, angiotensin I and gonadotrophin-releasing hormone [17]. All of these peptides are hydrolysed at the same peptide bonds by the two enzymes, except for neurotensin, which is hydrolysed at the Arg8–Arg9 and Pro10–Tyr11 peptide bonds by TOP and NEL respectively [17,18]. Both peptidases show broad substrate specificities [18–20], probably because a significant portion of the enzyme-binding site is lined with potentially flexible loops that allow reorganization of the active sites following substrate binding [5]. This characteristic is supported by the ability of TOP and NEL to accommodate different amino acid residues at subsites S4 to S3′ [19] by temperature- and ionic strength-dependent shifts in the substrate cleavage sites [21], by the activation of TOP and NEL by Na2SO4 kosmotropic salt [21], by the partial unfolding of TOP by urea, which inhibits the hydrolysis of pentapeptides but enhances the hydrolysis of nonapeptides [22], and by the relatively high positive enthalpies and entropies for the activation of TOP and NEL, which suggest reorganization of the protein structure and/or water during catalysis [21]. Moreover, comparison of the crystallographic structures of TOP and NEL with the recently reported structures of Escherichia coli Dcp (dipeptidyl carboxypeptidase) and ACE (angiotensin-converting enzyme)-related carboxypeptidase (ACE2) suggests that TOP and NEL may also undergo a large hinge movement upon substrate or inhibitor binding that causes their deep open channels to close around the substrate or inhibitor [23,24].
The loops formed by residues 600–612 (GHLAGGYDGQYYG; one-letter amino acid codes used) in NEL and residues 599–611 in TOP (GHLAGGYDAQYYG; one-letter amino acid codes used) are best positioned to participate in subsite S1 [5,16]. In NEL, the five glycine residues in the 13 amino acid loop provide the flexibility that results in an average main-chain temperature factor of 45 Å2 (1 Å=0.1 nm) based on analysis of the crystal structure [5]. The only difference between NEL and TOP within this loop is that Gly608 in the NEL sequence is substituted by Ala607 in the TOP sequence. The mutation A607G in TOP makes this enzyme at least ten times more efficient in hydrolysing Abz-GFSIFRQ-EDDnp [where Abz is o-aminobenzoyl and EDDnp is N-(2,4-dinitrophenyl)-ethylenediamine] [25], indicating better accommodation of the branched side-chain of isoleucine (at substrate position P1) in subsite S1. Hence, Ala607 probably participates in substrate recognition by TOP and modulates the loop flexibility [25]. This interpretation is supported by the three-dimensional structure that shows an average main-chain temperature factor of about 19 Å2 for this loop, which is much lower than that observed for NEL (45 Å2) [16]. In addition, of all the residues in this glycine-rich loop, Tyr605 in TOP and Tyr606 in NEL are the amino acids most likely to interact with the P1 residue of the substrates [5,16].
In the present study, we investigated the structural and functional role of the amino acids in this loop using site-directed mutagenesis to replace Tyr606 of NEL and Tyr605 of TOP with a phenylalanine or alanine residue (NEL Y606F or Y606A and TOP Y605F or Y605A). In addition, we examined the influence of structural alterations on the catalytic activities of both oligopeptidases by preparing the NEL mutant G608A to complement results reported previously for the TOP mutant A607G [25]. The structures of wild-type and mutant TOP and NEL were compared by CD, by the kinetics of temperature denaturation based on the residual enzymatic activity, and by the intrinsic fluorescence of the proteins. The activities of the mutant enzymes were assayed using a FRET (fluorescence resonance energy transfer) peptide series with the sequence Abz-GFSXFRQ-EDDnp, where X is one of a variety of amino acids (Ala, Ile, Leu, Phe, Tyr, Trp, Ser, Gln, Glu, His, Arg or Pro) at position P1. The sensitivity of the TOP and NEL mutants to inhibition by JA-2 {N-[1-(R,S)-carboxy-3-phenylpropyl]Ala-Aib-Tyr-p-aminobenzoate}, an inhibitor for TOP [26], and the influence of pH on the hydrolytic activities, were also examined.
MATERIALS AND METHODS
Site-directed mutagenesis, protein expression and purification
The QuikChange® site-directed mutagenesis kit (Stratagene) was used to introduce specific point mutations in TOP and NEL wild-type cDNAs, as described previously [14]. The point mutations were all confirmed by DNA sequencing [14] and identified as TOP Y605F, TOP Y605A, TOP A607G, NEL Y606F, NEL Y606A and NEL G608A. Wild-type and mutant proteins were expressed in E. coli DH5α using the pGEX4T-2 plasmid containing cDNA encoding the desired protein (GE Healthcare), as described previously [17]. The recombinant proteins were purified to homogeneity by affinity chromatography on a glutathione–Sepharose column (GE Healthcare). After purification, all of the proteins were analysed using SDS/PAGE followed by staining with Coomassie Blue [17]. Protein batches with a homogeneity >95% were stored at −80 °C and used in all subsequent analyses.
Peptide synthesis
Highly sensitive FRET peptides were synthesized by solid-phase procedures, as described previously [27]. All of the peptides were produced by the Fmoc (fluoren-9-ylmethoxycarbonyl) procedure in an automated bench-top simultaneous multiple solid-phase peptide synthesizer (PSSM 8 system; Shimadzu). The final deprotected peptides were purified by semi-preparative HPLC using an Econosil C18 column (10 μm, 22.5 mm×250 mm) and a two-solvent system: (A) TFA (trifluoroacetic acid)/water (1:1000, v/v) and (B) TFA/ACN (acetonitrile)/water (1:90:10, v/v). The column was eluted at a flow rate of 5 ml/min with a 10 (or 30)% to 50 (or 60)% gradient of solvent B over 30 or 45 min. Analytical HPLC was performed using a binary HPLC system from Shimadzu fitted with an SPD-10AV Shimadzu UV-visible detector and a Shimadzu RF-535 fluorescence detector. The system was coupled to an Ultrasphere C18 column (5 μm, 4.6 mm×150 mm) that was eluted with solvent systems A and B at a flow rate of 1 ml/min and a 10–80% gradient of solvent B over 20 min. The elution profile of the peptides was monitored by the absorbance at 220 nm and by the fluorescence emission at 420 nm following excitation at 320 nm. The molecular mass and purity of the synthesized peptides were checked by MALDI-TOF (matrix-assisted laser-desorption ionization–time-of-flight) MS (TofSpec-E; Micromass) and/or peptide sequencing with a PPSQ-23 protein sequencer (Shimadzu).
Kinetic assays
TOP and NEL activities were monitored spectrofluorimetrically in a Shimadzu RF-5301PC spectrofluorimeter using the FRET peptides as substrates, with excitation and emission wavelengths of 320 and 420 nm respectively. A standard cuvette (1 cm pathlength) containing 2 ml of substrate solution was placed in a thermostatically controlled cell compartment for 5 min before the addition of enzyme. Prior to the assay, TOP and its mutants were pre-activated by incubation with 0.5 mM DTT (dithiothrietol) for 5 min at 37 °C. The kinetic parameters of peptide hydrolysis were determined at 37 °C in 50 mM Tris/HCl buffer (pH 7.4), containing 100 mM NaCl. The pH was adjusted at 25 °C based on the temperature coefficient for Tris buffer [d(pKa)/dt=−0.031 pH units·K−1] and checked immediately before the assay at 37 °C using a model 710A Orion pH meter with an ATC (automatic temperature compensation) glass probe. The reaction was monitored continuously based on the fluorescence of the released product. The rate of increase in fluorescence was converted into moles of substrate hydrolysed per s based on the fluorescence curves of standard peptide solutions before and after total enzymatic hydrolysis. The concentration of the peptide solutions was determined by measuring the absorption of the 2,4-dinitrophenyl group at 365 nm (ϵ=17300M−1·cm−1). The enzyme concentration for initial rate determinations was chosen so that <5% of the substrate was hydrolysed. The inner-filter effect was corrected using an empirical equation [28], and the kinetic parameters were calculated according to Wilkinson [29] and using Eadie–Hofstee plots. The data were analysed and equations were fitted using Grafit (version 5.0; Erithacus Software) [30]. A non-linear least square plot of eqn (1) was used to analyse the data for peptides that were cleaved at two bonds. The overall V was obtained from eqn (1), whereas the values for Va and Vb were calculated using the ratio of the areas taken from the integrated HPLC chromatogram. Additional information and discussion of this kinetic interpretation are provided in [19].
 |
(1) |
Thermal stability
The kinetics of denaturation of the wild-type and mutant peptidases were monitored by measuring the residual activity and by following the intrinsic fluorescence during incubation at 50 °C. The buffer used in the assays was 50 mM Tris/HCl (pH 7.4), containing 100 mM NaCl. The intrinsic fluorescence was monitored continuously (see above) with excitation at 280 nm and emission at 330 nm (2.5 nm slit-width in both cases). For the activity assays, the samples were incubated at 50 °C but the residual activity was measured at 37 °C using the FRET peptide Abz-GFSAFRQ-EDDnp as substrate and the same spectrofluorimetric conditions specified in the previous section. DTT (0.5 mM) was added to wild-type and mutant TOP. The final protein concentration in the assays was 2 μM.
pH-dependence of protein intrinsic fluorescence
The structural changes in wild-type TOP and its mutants Y605F, Y605A and A607G, and in wild-type NEL and its mutants Y606F, Y606A and G608A, as a function of pH, were studied by monitoring the intrinsic fluorescence of the proteins. A four-component buffer system of constant ionic strength consisting of 25 mM glycine, 25 mM acetic acid, 25 mM Mes and 75 mM Tris was used, with 0.5 mM DTT being added to wild-type and mutant TOP. The emission spectra in the range 300–400 nm were collected at 37 °C using a fixed excitation at 280 nm (2.5 nm slit-width), as described above. The final protein concentration in the assays was 2 μM.
pH-dependence of the kinetic parameters
The kinetic parameters kcat, Km and kcat/Km were determined over the pH range 5.0–9.8 using Abz-GFSAFRQ-EDDnp as the substrate in a four-component buffer system of constant ionic strength, as described above. DTT (0.5 mM) was added to assays using wild-type TOP and its mutants. Eqns (2) and (3) (shown below) were used in the non-linear regression analysis using the Grafit program [30].
 |
(2) |
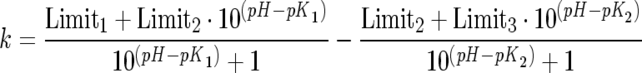
Eqn (2) fits data when the pH-activity profile depends upon two ionizing groups (double pKa) and does not assume that the activity is zero at high pH values. Limit1 represents the limit of the acid limb (low pH), Limit2 is the pH-independent maximum rate constant, K1 and K2 are the dissociation constants of a catalytically competent base and acid respectively, and Limit3 is the limit of the alkaline limb (high pH), k=kcat or kcat/Km. In the present study, eqn (2) was used to study the pH–kcat/Km profile of wild-type TOP and its mutants Y605F and A607G, and wild-type NEL and its mutants Y606F, Y606A and G608A, otherwise eqn (3) was used.
 |
(3) |
Eqn (3) fits data when the pH-activity profile also depends upon two ionizing groups in a bell-shaped curve and the activities at low and high pHs are zero. k(Limit) corresponds to the pH-independent maximum rate constant, K1 and K2 are the dissociation constants of a catalytically competent base and acid respectively, and k=kcat or kcat/Km. Eqn (3) was used in the non-linear regression analysis of pH–kcat/Km for TOP Y605A and pH–kcat of wild-type TOP and its mutants Y605F, Y605A and A607G, and wild-type NEL and its mutant G608A. The pK1 and pK2 estimated from the pH–kcat/Km curves were identified as pKe1 and pKe2 respectively, to differentiate them from the pK1 and pK2 values estimated from the pH–kcat profiles (pKes1 and pKes2 respectively).
Determination of inhibition parameters
Inhibition constants were determined using the TOP inhibitor JA-2 [26], which was kindly provided by Dr A. Ian Smith (Department of Biochemistry and Molecular Biology, Monash University, Victoria, Australia). The constants were determined in a continuous assay using the FRET peptide Abz-GFSHFRQ-EDDnp as substrate. The equation used to calculate the Ki values was Ki=Ki,app/(1+[S]/Km), where [S]=molar concentration of the substrate, Km=Michaelis constant and Ki,app=apparent inhibition constant. Ki,app was calculated using the equation Vo/Vi=1+[I]/Ki,app, where Vo=velocity of hydrolysis without the inhibitor, Vi=velocity of hydrolysis in the presence of the inhibitor and [I]=molar concentration of the inhibitor. A plot of (Vo/Vi)−1 versus [I] yields a slope of 1/Ki,app.
CD
Far-UV CD spectra were recorded on a Jasco J-810 spectropolarimeter with a Peltier system for controlling cell temperature. The system was routinely calibrated with an aqueous solution of twice crystallized d-10 camphorsulfonic acid. Ellipticity was recorded as the mean residue molar ellipticity [θ] (deg·cm2·dmol−1). The spectrometer conditions typically included a sensitivity of 100 mdeg, a resolution of 0.5 nm, a response time of 4 s, a scan rate of 20 nm/min and 4 accumulations at 37 °C.
Protein concentration
Protein concentrations for the CD and intrinsic fluorescence experiments were determined as described by Gill and von Hippel [31], whereas those for SDS/PAGE were determined using the Bradford dye-binding assay [32] using BSA as a standard.
Determination of peptide cleavage sites
The cleaved bonds were identified by isolating the resulting peptide fragments by HPLC and comparing the retention times of these fragments with those of authentic synthetic sequences and/or by determining their molecular mass by MALDI-TOF MS and/or by peptide sequencing using a PPSQ-23 protein sequencer (Shimadzu).
RESULTS
Protein expression and characterization
Proteolytic removal of glutathione S-transferase and subsequent purification of the recombinant proteins yielded apparently homogeneous peptidases (purity >95%), as assessed by SDS/PAGE (results not shown). The protein yield (∼0.5 mg/l of culture medium) was similar for all of the expressed peptidases, suggesting that none of the mutations significantly affected the relative levels of TOP or NEL expression in E. coli DH5α.
To assess the structural integrity of the recombinant proteins, far-UV CD analyses were performed for all of the enzymes. Figures 1(A) and 1(B) show that the CD spectra of the TOP mutants Y605F, Y605A and A607G and of the NEL mutants Y606F, Y606A and G608A were similar to the spectrum of the corresponding wild-type enzymes. Similarly, there were no marked differences in the thermal stability (Figure 1C) or intrinsic fluorescence (Figure 1D) of the mutant peptidases when compared with the wild-type enzymes. However, the rates of denaturation were slower at high protein concentrations (results not shown). The pH dependence of the intrinsic fluorescence in wild-type and mutant TOP and NEL did not differ significantly (Figures 1E and 1F). In addition, wild-type and mutant TOP and NEL released zinc during thermal denaturation (50 °C), as detected using PAR [4-(2-pyridylazo)resorcinol] reagent (results not shown) [22].
Figure 1. Structural characterization of TOP and NEL mutants.

Far-UV CD spectra for (A) recombinant wild-type TOP and the mutants TOP Y605F and TOP Y605A and (B) wild-type NEL and the mutants NEL Y606F and NEL Y606A. (C) Residual activity of wild-type (WT) TOP (▲) and TOP Y605A (○) was measured during incubation at 50 °C. The points correspond to a single exponential decay and the inset shows the linear fit of the log of the residual activity versus incubation time. (D) Intrinsic fluorescence (λEx=280 nm and λEm=330 nm) of wild-type NEL (▲) and NEL Y606A (○) during incubation at 50 °C. The data correspond to a double-exponential decay curve. The changes in intrinsic fluorescence as a function of pH are shown for (E) wild-type TOP (▲) and TOP Y605A (○) and (F) wild-type NEL (▲) and NEL Y606A (○). The solid lines represent the non-linear fit of eqn 2 over a pH range of 5–10. Only representative profiles are shown for clarity, but all of the mutant proteins were compared with their respective wild-type peptidases using each of the methods described in the text.
Hydrolysis of synthetic fluorogenic substrates
The catalytic activities of wild-type and mutant TOP and NEL were compared using FRET peptides based on the general structure Abz-GFSXFRQ-EDDnp (where X=Ala, Ile, Leu, Phe, Tyr, Trp, Ser, Gln, Glu, His, Arg or Pro). Wild-type TOP and NEL cleaved all of the peptides only at the X–Phe bond. However, the TOP mutant Y605A cleaved the peptides Abz-GFSWFRQ-EDDnp, Abz-GFSRFRQ-EDDnp, Abz-GFSLFRQ-EDDnp and Abz-GFSPFRQ-EDDnp at the Phe–Ser or X–Phe bonds (Table 1), indicating that the substitution of Tyr605 for an alanine residue allowed the amino acids Trp, Arg, Leu and Pro to fit into the S2′ subsite of the enzyme. In contrast, the NEL mutant Y606A did not hydrolyse the peptide Abz-GFSIFRQ-EDDnp, but cleaved the peptide Abz-GFSPFRQ-EDDnp at the Phe–Ser or Pro-Phe bonds (Table 1). The kinetic parameters (Km, kcat and kcat/Km) for the hydrolysis of the Abz-GFSXFRQ-EDDnp-based peptides are shown in Tables 1 and 2, and Figure 2 provides a more direct comparison of the kcat/Km values for the wild-type and mutant peptidases.
Table 1. Kinetic parameters for the hydrolysis of FRET peptides derived from Abz-GFSXFRQ-EDDnp by TOP Y605F and Y605A and NEL Y606F and Y606A compared with their wild-type forms.
The data are presented as means±S.D., with the S.D. (not shown) being <10% of the values indicated. * and ** indicate data from references [19] and [25] respectively. All of the peptides were hydrolysed at the X–Phe bond; peptides that were also hydrolysed at the Phe–Ser bond are indicated in parentheses with their kcat values. Km (μM), kcat (s−1), kcat/Km (s−1·mM−1).
| TOP | NEL | ||||||
|---|---|---|---|---|---|---|---|
| X | Wild-type | Y605F | Y605A | Wild-type | Y606F | Y606A | |
| Ala | Km | 1.2* | 4.7 | 9.8 | 1.1* | 5.4 | 7.8 |
| kcat | 10.2* | 2.6 | 10.4 | 2.6* | 0.8 | 0.5 | |
| kcat/Km | 8500* | 553 | 1061 | 2364* | 148 | 64 | |
| Ile | Km | 0.4** | 1.4 | 5.0 | 0.8* | 4.8 | Resistant |
| kcat | 0.01** | 13.6 | 5.0 | 0.2* | 0.01 | Resistant | |
| kcat/Km | 25** | 9714 | 1000 | 250* | 2 | Resistant | |
| Leu | Km | 1.6* | 2.3 | 10.2 | 1.8* | 4.8 | 6.1 |
| kcat | 3.4* | 13.6 | 7.0 (F↓S=10.8) | 3.5* | 0.7 | 0.1 | |
| kcat/Km | 2125* | 5913 | 1745 | 1944* | 146 | 16 | |
| Phe | Km | 0.7* | 3.3 | 16.0 | 1.5* | 9.8 | 10.1 |
| kcat | 6.7* | 27.3 | 12.7 | 3.4* | 1.1 | 0.09 | |
| kcat/Km | 9571* | 8273 | 794 | 2267* | 112 | 9 | |
| Tyr | Km | 0.9 | 2.3 | 11.0 | 9.6 | 3.8 | 6.5 |
| kcat | 6.2 | 6.4 | 20.4 | 1.0 | 1.3 | 0.3 | |
| kcat/Km | 6889 | 2783 | 1855 | 104 | 342 | 46 | |
| Trp | Km | 0.8 | 1.5 | 7.4 | 0.8 | 6.0 | 2.2 |
| kcat | 2.7 | 9.1 | 0.2 (F↓S=0.7) | 0.3 | 1.5 | 1.0 | |
| kcat/Km | 3375 | 6067 | 122 | 375 | 250 | 455 | |
| Ser | Km | 3.7* | 4.7 | 20 | 11.1* | 7.4 | 7.4 |
| kcat | 8.8* | 1.7 | 1.5 | 7.5* | 0.2 | 0.06 | |
| kcat/Km | 2378* | 362 | 75 | 676* | 27 | 8 | |
| Gln | Km | 1.2* | 5.4 | 5.8 | 1.6* | 9.6 | 21.0 |
| kcat | 6.3* | 12.1 | 5.8 | 3.6* | 0.6 | 0.7 | |
| kcat/Km | 5250* | 2241 | 1000 | 2250 | 63 | 33 | |
| Glu | Km | 7.5* | 2.1 | 3.0 | 2.4* | 5.0 | 5.3 |
| kcat | 1.5* | 3.2 | 5.3 | 0.7* | 1.2 | 0.1 | |
| kcat/Km | 200* | 1524 | 1767 | 292* | 240 | 19 | |
| His | Km | 7.6* | 8.6 | 9.6 | 1.8* | 10.4 | 10.6 |
| kcat | 24.7* | 15.1 | 1.8 | 2.5* | 0.2 | 0.05 | |
| kcat/Km | 3250* | 1756 | 188 | 1389* | 19 | 5 | |
| Arg | Km | 1.1* | 4.4 | 10.0 | 1.3* | 1.9 | 2.6 |
| kcat | 7* | 1.5 | 0.6 (F↓S=0.4) | 4.8* | 0.9 | 0.4 | |
| kcat/Km | 6364* | 341 | 100 | 3692* | 474 | 154 | |
| Pro | Km | 2.2* | 1.5 | 4.3 | 0.6* | 0.7 | 3.1 |
| kcat | 6.3* | 1.4 | 4.7(F↓S=1.2) | 0.3* | 0.1 | 0.006 (F↓S=0.024) | |
| kcat/Km | 2864* | 933 | 1372 | 500* | 143 | 10 | |
Table 2. Kinetic parameters for the hydrolysis of FRET peptides derived from Abz-GFSXFRQ-EDDnp by TOP A607G and NEL G608A compared with their wild type forms.
The data are presented as means±S.D., with the S.D. (not shown) being <10% of the values indicated. * and ** indicate data from references [19] and [25] respectively. All of the peptides were hydrolysed only at the X–Phe bond. Km (μM), kcat (s−1), kcat/Km (s−1·mM−1).
| TOP | NEL | ||||
|---|---|---|---|---|---|
| X | Wild-type | A607G | Wild-type | G608A | |
| Ala | Km | 1.2* | 0.5 | 1.1* | 0.2 |
| kcat | 10.2* | 10.6 | 2.6* | 0.9 | |
| kcat/Km | 8500* | 21200 | 2364* | 4500 | |
| Ile | Km | 0.4** | 0.5** | 0.8* | 0.8 |
| kcat | 0.01** | 0.1** | 0.2* | 0.04 | |
| kcat/Km | 25** | 200** | 250* | 50 | |
| Leu | Km | 1.6* | 2.7 | 1.8* | 1.9 |
| kcat | 3.4* | 3.8 | 3.5* | 2.4 | |
| kcat/Km | 2125* | 1407 | 1944* | 1263 | |
| Phe | Km | 0.7* | 0.8 | 1.5* | 2.5 |
| kcat | 6.7* | 2.7 | 3.4* | 4.9 | |
| kcat/Km | 9571* | 3375 | 2267* | 1960 | |
| Tyr | Km | 0.9 | 0.8 | 9.6 | 1.2 |
| kcat | 6.2 | 4.9 | 1.0 | 4.1 | |
| kcat/Km | 6889 | 6125 | 104 | 3417 | |
| Trp | Km | 0.8 | 1.9 | 0.8 | 2.9 |
| kcat | 2.7 | 3.8 | 0.3 | 2.4 | |
| kcat/Km | 3375 | 2000 | 375 | 828 | |
| Ser | Km | 3.7* | 1.3 | 11.1* | 5.6 |
| kcat | 8.8* | 12.1 | 7.5* | 2.4 | |
| kcat/Km | 2378* | 9308 | 676* | 429 | |
| Gln | Km | 1.2* | 3.4 | 1.6* | 5.4 |
| kcat | 6.3* | 2.3 | 3.6* | 5.9 | |
| kcat/Km | 5250* | 677 | 2250 | 1093 | |
| His | Km | 7.6* | 0.9 | 1.8* | 9.5 |
| kcat | 24.7* | 10.6 | 2.5* | 6.3 | |
| kcat/Km | 3250* | 11778 | 1389* | 663 | |
| Arg | Km | 1.1* | 0.7 | 1.3* | 8.3 |
| kcat | 7* | 9.8 | 4.8* | 3.3 | |
| kcat/Km | 6364* | 14000 | 3692* | 398 | |
| Pro | Km | 2.2* | 1.3 | 0.6* | 0.8 |
| kcat | 6.3* | 4.5 | 0.3* | 0.7 | |
| kcat/Km | 2864* | 3462 | 500* | 875 | |
Figure 2. Relative kcat/Km ratios for the hydrolysis of peptides derived from Abz-GFSXFRQ-EDDnp by wild-type and mutant enzymes.

(A) Solid bars, TOP Y605F/wild-type TOP; open bars, TOP Y605A/wild-type TOP; and dashed bars, TOP A607G/wild-type TOP. (B) Solid bars, NEL Y606F/wild-type NEL; open bars, NEL Y606A/wild-type NEL; and dashed bars, NEL G608A/wild-type NEL. The log scale allows rapid comparison of ratios greater or less than 1. One-letter amino acid codes are used.
TOP mutants Y605F, Y605A and A607G
The most notable difference between the activities of the TOP mutants Y605F and Y605A and the wild-type enzyme was the increase in kcat/Km for hydrolysis of the peptide Abz-GFSIFRQ-EDDnp (Figure 2A) that was attributable primarily to the high values for kcat (Table 1). This peptide was the worst substrate for wild-type TOP but was the best substrate for the TOP mutant Y605F. The peptide Abz-GFSEFRQ-EDDnp was also well hydrolysed by the TOP Y605F mutant compared with the wild-type enzyme, but the improvement in the kcat/Km values was significantly lower than for the hydrolysis of Abz-GFSIFRQ-EDDnp, with both kcat and Km contributing equally to the increase in kcat/Km (Table 1). The TOP mutant Y605F hydrolysed Abz-GFSWFRQ-EDDnp with a higher kcat/Km than the wild-type enzyme, whereas for the TOP mutant Y605A this peptide was one of the poorest substrates. All of the other peptides in the Abz-GFSXFRQ-EDDnp series were less susceptible to these TOP mutants when compared with the wild-type form (Figure 2A). The lack of a hydroxy group in the side chain of residue 605 in the TOP mutant Y605F resulted in a systematic increase in the Km values for the hydrolysis of all substrates except for those containing Glu and Pro. The highest kcat values for the TOP mutant Y605F were obtained with substrates containing hydrophobic amino acids at position P1 (Table 1). The presence of an aromatic ring at position 605 in TOP was important for the hydrolysis of most of the substrates because the kcat/Km values for TOP Y605F were significantly greater than those for TOP Y605A, except for the hydrolysis of Abz-GFSAFRQ-EDDnp and Abz-GFSEFRQ-EDDnp. The Km values for hydrolysis by TOP Y605A were consistently higher than those for TOP Y605F, suggesting a role for the aromatic ring of residue 605 in TOP–substrate interactions (Table 1).
The modification of residue 607 in TOP A607G significantly affected the kinetic parameters for the hydrolysis of Abz-GFSXFRQ-EDDnp-based peptides compared with wild-type peptidases (Table 2). The kcat/Km values for TOP A607G were higher than those for wild-type enzyme towards substrates containing Ala, Ile, Ser, His, Arg or Pro (Figure 2A), with these differences being attributable mainly to lower Km values for this mutant (Table 2). In contrast, the most significant decrease in the kcat/Km value (10-fold) was recorded for the hydrolysis of Abz-GFSQFRQ-EDDnp.
Comparison of the hydrolytic activities of the mutants revealed that TOP A607G was markedly more active in cleaving peptides containing Ala, Ser, His or Arg (Table 1 compared with Table 2). Particularly noteworthy was the efficient hydrolysis of Abz-GFSSFRQ-EDDnp, Abz-GFSHFRQ-EDDnp and Abz-GFSRFRQ-EDDnp, which were poorly hydrolysed by Y605A. These findings suggested that the presence of a glycine residue at position 607 in TOP resulted in greater flexibility of the loop G599HLAGGYDAQYYG611, and that this in turn facilitated the correct positioning of Tyr605, thereby improving the hydrolytic efficiency of the enzyme, especially for substrates containing Ser, His or Arg at P1.
NEL mutants Y606F, Y606A and G608A
Wild-type NEL was less active than wild-type TOP in hydrolysing Abz-GFSXFRQ-EDDnp-based peptides (Table 1 or Table 2). However, the mutations Y606F and Y606A in the G600HLAGGYDGQYYG612 loop of NEL systematically reduced the kcat/Km values, except for the hydrolysis of Abz-GFSYFRQ-EDDnp by NEL Y606F and of Abz-GFSWFRQ-EDDnp by NEL Y606A (Figure 2B). These lower kcat/Km values resulted mainly from a reduction in the kcat values, although the Km values for the hydrolysis of most of the substrates were also increased (Table 1). In contrast with the enhanced activity of TOP Y605F and Y605A in hydrolysing Abz-GFSIFRQ-EDDnp, the NEL mutants Y606F and Y606A showed no significant hydrolysis of this peptide, indicating that the interaction of Ile with subsite S1 of these NEL mutants was restricted.
Comparison of the kinetic parameters of NEL Y606F with those of the wild-type enzyme indicated that the hydroxy group at position 606 was important for NEL activity. The absence of an aromatic ring in the NEL mutant Y606A markedly affected the hydrolytic activity since this mutant showed the lowest kcat/Km values (Table 1). The mutation of Gly to Ala in the loop G600HLAGGYDGQYYG612 of NEL G608A, which could restrict the flexibility of this region, increased the kcat/Km values for the hydrolysis of peptides containing Ala, Tyr, Trp and Pro but decreased the values for peptides containing Ile, Leu, Phe, Ser, Gln, Glu, His or Arg (Table 2); this variation in kcat/Km values resulted from changes in both kcat and Km. Thus in addition to the change in loop flexibility introduced by an alanine residue at position 608, the hydrolytic activity of NEL G608A was also influenced by the amino acid at position P1 in the substrate. Similar behaviour was observed with TOP A607G, although the change in loop flexibility resulted in different patterns of peptide hydrolysis by TOP and NEL.
pH-dependence of the kinetic parameters
Table 3 shows the pKe1 and pKe2 values calculated from experiments that examined the relationship between pH and kcat/Km. Despite the loss of catalytic efficiency towards Abz-GFSAFRQ-EDDnp following removal of the hydroxy group from residue 605 of TOP Y605F and residue 606 of NEL Y606F (Table 1), there were no significant differences between the pKe1 and pKe2 values of the mutant and corresponding wild-type enzymes (Figure 3 and Table 3).
Table 3. Kinetic parameters for the hydrolysis of Abz-GFSAFRQ-EDDnp by wild-type and mutant NEL (a) and TOP (b) calculated from the pH-rate curves.
The data are presented as means±S.D., with the S.D. (not shown) being <10% of the mean values indicated. The data are presented as means±S.D. *Calculated using Eqn 3; all other values were calculated using Eqn 2. pKe1 and pKe2 were obtained from the pH–kcat/Km curves to differentiate them from pKes1 and pKes2, which were calculated from the pH–kcat curves. WT, wild-type.
| (a) | ||||||||
|---|---|---|---|---|---|---|---|---|
| kcat/Km | ||||||||
| NEL | pKe1 | pKe2 | ||||||
| WT | 6.7±0.2 | 7.6±0.2 | ||||||
| Y606F | 6.8±0.3 | 7.9±0.4 | ||||||
| Y606A | 6.8±0.3 | 7.4±0.2 | ||||||
| G608A | 6.5±0.3 | 7.4±0.2 | ||||||
| (b) | ||||||||
| kcat/Km | kcat | |||||||
| TOP | pKe1 | pKe2 | pKes1 | pKes2 | ||||
| WT | 6.2±0.2 | 8.1±0.1 | 5.4±0.2* | 9.3±0.2* | ||||
| Y605F | 6.5±0.2 | 8.0±0.3 | 5.7±0.2* | 8.9±0.2* | ||||
| Y605A | 6.7±0.2* | 9.4±0.2* | 6.1±0.1* | 9.1±0.1* | ||||
| A607G | 6.2±0.4 | 8.3±0.4 | 5.8±0.2* | 9.3±0.3* | ||||
Figure 3. pH dependence of the kinetic parameters.

pH dependence of (A) kcat/Km for wild-type TOP (●), TOP Y605F (○) and TOP Y605A (■), and (B) kcat for the hydrolysis of Abz-GFSAFRQ-EDDnp by wild-type TOP (●), TOP Y605F (○) and TOP Y605A (■). Solid lines represent the curves calculated using eqn (2) or (3) as indicated in the Materials and methods section.
The pKes1 and pKes2 determined from the pH–kcat profiles of wild-type and mutant TOP are shown in Table 3. For wild-type NEL, the pKes1 and pKes2 were 5.6±0.3 and 7.5±0.2 respectively, with the estimated values for the NEL mutants being very similar to those of the native enzyme (results not shown). The pKe1 values were consistently higher than those of pKes1 in wild-type and mutant TOP and NEL (Table 3). In contrast, in the alkaline limb, the pKe2 values for wild-type TOP and its mutants were approximately 1 pH unit lower than the corresponding pKes2, except for TOP Y605A, for which pKe2 and pKes2 did not differ (Table 3). Figure 3 shows the pH–kcat/Km and pH–kcat profiles for wild-type and mutant TOP. The distinct pH-dependence of the pH-kcat/Km profile of TOP Y605A in the alkaline limb indicated that this mutant present a distinct pH-dependence of the affinity by the assayed substrate.
Hydrolysis of natural peptides
Wild-type TOP and its mutants (TOP Y605F, Y605A and A607G) cleaved neurotensin (pELYENKPRRPYIL) at Arg8–Arg9, whereas TOP Y605A also cleaved this peptide at the Pro10–Tyr11 bond, with the ratio of Pro10–Tyr11/Arg8–Arg9 cleavage being approximately 1:1. Wild-type NEL and its mutants only hydrolysed neurotensin at Pro10–Tyr11. All of the peptidases cleaved bradykinin (RPPGFSPFR) at the Phe5–Ser6 bond only.
Inhibition by JA-2
The Ki values for the inhibition of wild-type TOP and NEL and their mutants by JA-2 are shown in Table 4. The greatest difference was observed with TOP Y605A which was inhibited with a Ki 14-fold higher than the wild-type enzyme. In contrast, the Ki value for TOP Y605F was only 1.7-fold higher than the wild-type peptidase. These data indicate a significant contribution of the Tyr605 aromatic ring for JA-2 binding in the TOP active site. Wild-type NEL was inhibited less efficiently by JA-2 compared with wild-type TOP, and the Ki values for NEL Y606F and Y606A were 2–3-fold higher than for wild-type NEL (Table 4). TOP A607G was also inhibited by JA-2, but with a Ki value 5.2-fold higher than for wild-type TOP; curiously, NEL G608A was inhibited more efficiently than wild-type NEL (Table 4). This finding suggests that the flexibility of the loop composed of residues 600–612 in NEL and 599–611 in TOP is important for JA-2 binding.
Table 4. Inhibition constants for wild type and mutant TOP (a) and NEL (b) by JA-2.
WT, wild-type.
| (a) | ||
|---|---|---|
| JA-2 | ||
| TOP | Ki (nM) | Ki mutant/Ki WT |
| WT | 45 | – |
| Y605F | 77 | 1.7 |
| Y605A | 636 | 14 |
| A607G | 235 | 5.2 |
| (b) | ||
| JA-2 | ||
| NEL | Ki (nM) | Ki mutant/Ki WT |
| WT | 534 | – |
| Y606F | 1262 | 2.4 |
| Y606A | 1490 | 2.8 |
| G608A | 117 | 0.2 |
DISCUSSION
Wild-type TOP and NEL and their mutant forms did not present any significant differences that could be detected by far-UV CD analysis, thermal stability and pH-dependence of the protein intrinsic fluorescence assays (Figure 1). Therefore local structural modifications that possibly occur in the mutated forms of TOP and NEL studied in the present work did not affect their overall folding in an extension that could be detected by these methods.
The replacement of Tyr605 of TOP and Tyr606 of NEL by a phenylalanine or alanine residue affected the parameters of hydrolysis obtained in the kinetic assays with FRET substrates (Table 1) indicating important roles for both hydroxy groups and aromatic rings of these tyrosine residues in the activities of both peptidases. The additional cleavage at the Phe–Ser bond only, verified in the hydrolysis of peptides with X=Leu, Trp, Arg and Pro of the Abz-GFSXFRQ-EDDnp series by TOP Y605A, indicated that this mutant can accommodate these amino acids at the S2′ subsite (Table 1). These observations suggest that Tyr605 and Tyr606 of TOP and NEL respectively, participate in the S1 constitution and/or help the correct positioning of the residues of other enzymes during catalysis. It is possible that other residues of the loop G599HLAGGYDAQYYG611 of TOP or G600HLAGGYDGQYYG612 of NEL also play roles in the definition of the P1 residue in substrate hydrolysis.
The flexibility of the specific loops, formed by residues 599–611 in TOP and 600–612 in NEL, seems to be important for the catalysis of both peptidases, as suggested by their crystallographic structures and previous studies [5,16,25]. Although direct interactions between the P1 residues of the Abz-GFSXFRQ-EDDnp substrate-derived series with residues Ala607 in wild-type TOP or Ala608 in NEL G608A mutant cannot be totally excluded, changes in the flexibilities of the loops seems to be the most plausible explanation for the effects detected with these mutations (Table 2) [25]. Furthermore, this flexibility seems to be critical when an isoleucine residue is at the P1 position as previously reported for TOP [25] and confirmed by the lower specificity constant observed in the hydrolysis of peptide containing isoleucine by NEL G608A in comparison with the hydrolysis by wild-type NEL (Table 2). The results obtained with the NEL G608A, where the mutation of Gly608 to Ala in the loop G600HLAGGYDGQYYG612 of NEL possibly makes this segment less flexible, further supports the importance of this single difference between TOP and NEL when isoleucine is at the P1 position of the substrate (Table 2). On the other hand, NEL G608A hydrolysed more efficiently the peptides containing the aromatic residues (Tyr or Trp) at P1 than NEL wild-type, especially considering the peptide Abz-GFSYFRQ-EDDnp.
Despite the important role of the hydroxy groups of Tyr605 of TOP and of Tyr606 of NEL in the catalytic efficiencies of these peptidases (Table 1), the pK values obtained in the pH-activity assays with the mutants TOP Y605F and NEL Y606F were similar to those obtained with wild-type enzymes (Table 3). These results indicate that the hydroxy groups of these tyrosine residues present pK values outside the pH range pH 5.0–9.8 or the ionization of these groups do not contribute significantly to the pK values obtained from the pH profiles. Mutant TOP Y605A presented a pH–kcat/Km dependence curve significantly different from that of wild-type and also from TOP Y606F (Figure 3A and Table 3). This difference was not observed in the pH–kcat dependence curves (Figure 3B and Table 3) suggesting that the ionizing group(s) that contribute to substrate affinity are different in this TOP mutant, or are differentially affected upon substrate binding in its mutant Y605A. The systematic lower pKes1 values compared with the respective pKe1 values indicate perturbation of this ionization due to the substrate binding. However, the pKe2 observed in pH–kcat/Km profiles of TOP is most probably a macroscopic constant involving contribution from changes with pH in the rate-determining step and/or ionization of more than one group [33–35]. The distinct pH-dependence between TOP wild-type and mutant Y605A might be due to different interactions of the substrate with other residues of the enzyme that contributes to substrate affinity and most probably these other residues are in the loop that contains this mutated tyrosine residue (G599HLAGGYDAQYYG611).
TOP Y605A was inhibited with a Ki 14-fold higher than the wild-type enzyme (Table 4). This result suggests that the aromatic ring of Tyr605 is an important anchor for this inhibitor specifically in TOP. This interpretation is in accordance with the model previously proposed by Orlowski et al. [36], where the 1-carboxy-3-phenylpropyl group of the cFP-AAY-pAb {where cFP is N-[1-(R,S)-carboxyl-3-phenylpropyl]Ala-Ala-Tyr-p-aminobenzoate} inhibitor would interact at the TOP S1 subsite. The inhibitor JA-2 was developed based on the structure of this inhibitor cFP-AAY-pAb, containing a modified amino acid (Aib, α-aminoisobutyric acid) to increase stability for in vivo studies [26,37]. Orlowski et al. [36], synthesized a series of compounds containing systematic modifications and observed that the phenyl group of the carboxy-3-phenylpropyl group was crucial for the affinity of these inhibitors by TOP. However, in these previous studies, the replacement of the carboxy-3-phenylpropyl group by carboxymethyl group decreased the inhibitory potency more than three orders of magnitude for TOP [36], a stronger effect than that observed in the mutation of the Tyr605 by alanine (14-fold; Table 4). Alternative interactions with the loop G599HLAGGYDAQYYG611 due to the mutation of the Tyr605 residue may contribute to these effects presented by TOP Y605A. Both the mutation of Gly to Ala in the loop G600HLAGGYDGQYYG612 of NEL G608A and the mutation of Ala to Gly in the loop G599HLAGGYDAQYYG611 of TOP A607G caused a 5-fold effect in the inhibition constants of these mutants by the JA-2 inhibitor (Table 4). But, interestingly, while the mutant NEL G608A presented a decrease in the Ki constant an increase in this constant was obtained with mutant TOP A607G with respect to the corresponding wild-type enzymes. These opposite changes in the affinities by this inhibitor observed with TOP A607G and NEL G608A also support that, at least, part of the difference found between TOP and NEL concerning JA-2 affinity is possibly due to different conformations of the loops, G599HLAGGYDAQYYG611 in TOP and G600HLAGGYDGQYYG612 in NEL (Table 4) [5,16]. Based on these observations, we are currently synthesizing JA-2 analogues containing modifications in the place of the phenylpropyl in order to obtain specific inhibitors with higher selectivity for TOP or NEL.
Taken together the results showed that the loops formed by residues 599–611 in TOP or 600–612 in NEL are crucial for enzyme–substrate positioning and catalysis. Based on the three-dimensional structures of both TOP and NEL [5,16], such results suggest that the Tyr605 and Tyr606 respectively, can make direct interaction with the side chain of the residue at P1 depending on the nature of this residue. The superposition of the three-dimensional structures of NEL and TOP shows a small shift between the Tyr605 of TOP and Tyr606 of NEL and these residues also adopt different side chain rotomers in the respective structures [16], which might be an explanation for some differences observed with the TOP and NEL mutants of these tyrosine residues, for example, in the assays with the substrates containing isoleucine or glutamate at P1 (Figure 2). However, the recent description of the crystallographic structures of the E. coli Dcp and ACE-related carboxypeptidase (ACE2) and the comparison of these structures with those of TOP and NEL suggest that these latter two enzymes may undergo a large hinge movement upon substrate or inhibitor binding that causes the deep open channel of the enzyme to close around the substrate molecule bringing important residues into position for catalysis [23,24]. Analysing these ACE2 structures, the Tyr510 residue is in a similar position to Tyr605 and Tyr606 of TOP and neurolysin respectively. Furthermore, this Tyr510 is one of the residues that compose the S1 subsite interacting with the inhibitor moiety that mimics a substrate P1 side chain [23]. On the other hand, the corresponding residue to Tyr605 and Tyr606 of TOP and NEL respectively in Dcp is Tyr607 that interacts with the main-chain atoms of the peptide bound between P2–P1 substrate residues instead of with the P1 side chain [24]. Therefore crystallographic structures of TOP and/or NEL complexes with inhibitors or substrates will be necessary to address the precise role of the Tyr605 and Tyr606. In conclusion, the flexible loop formed by residues G599HLAGGYDAQYYG611 in TOP or G600HLAGGYDGQYYG612 in NEL plays a role in this possible close–open movement that these peptidases execute during substrate binding and hydrolysis. The results of the present study provide insights on the substrate specificity of both TOP and NEL that is important to better define their participation in the selection of cytosolic peptides for MHC class I antigen presentation and consequently help to understand this mechanism within the cells.
Acknowledgments
We thank Sandra Regina Lascosck for technical support. This work was supported by FAPESP (Fundação de Amparo à Pesquisa do Estado de São Paulo) and CNPq (Conselho Nacional de Desenvolvimento Científico e Tecnológico). M.F.M.M. is supported by a research fellowship from FAPESP (05/56952-3) and E.S.F. is supported by a research fellowship from CNPq. We thank Dr Marcia Moss (BioZyme, APEX, NC, U.S.A.) and Dr Stephen Hyslop (Departamento de Farmacologia, FCM-UNICAMP, SP, Brazil) for editorial assistance.
References
- 1.Orlowski M., Michaud C., Chu T. G. A soluble metalloendopeptidase from rat brain. Purification of the enzyme and determination of specificity with synthetic and natural peptides. Eur. J. Biochem. 1983;135:81–88. doi: 10.1111/j.1432-1033.1983.tb07620.x. [DOI] [PubMed] [Google Scholar]
- 2.Checler F., Vincent J. P., Kitabgi P. Purification and characterization of a novel neurotensin-degrading peptidase from rat brain synaptic membranes. J. Biol. Chem. 1986;261:11274–11281. [PubMed] [Google Scholar]
- 3.Pierotti A., Dong K. W., Glucksman M. J., Orlowski M., Roberts J. L. Molecular cloning and primary structure of rat testes metallopeptidase EC 3.4.24.15. Biochemistry. 1990;29:10323–10329. doi: 10.1021/bi00497a006. [DOI] [PubMed] [Google Scholar]
- 4.Dauch P., Vincent J. P., Checler F. Molecular cloning and expression of rat brain endopeptidase 3.4.24.16. J. Biol. Chem. 1995;270:27266–27271. doi: 10.1074/jbc.270.45.27266. [DOI] [PubMed] [Google Scholar]
- 5.Brown C. K., Madauss K., Lian W., Beck M. R., Tolbert W. D., Rodgers D. W. Structure of neurolysin reveals a deep channel that limits substrate access. Proc. Natl. Acad. Sci. U.S.A. 2001;98:3127–3132. doi: 10.1073/pnas.051633198. [DOI] [PMC free article] [PubMed] [Google Scholar]
- 6.Vincent B., Jiracek J., Noble F., Loog M., Roques B., Dive V., Vincent J. P., Checler F. Contribution of endopeptidase 3.4.24.15 to central neurotensin inactivation. Eur. J. Pharmacol. 1997;334:49–53. doi: 10.1016/s0014-2999(97)01209-0. [DOI] [PubMed] [Google Scholar]
- 7.Checler F., Barelli H., Dauch P., Dive V., Vincent B., Vincent J. P. Neurolysin: purification and assays. Methods Enzymol. 1995;248:593–614. doi: 10.1016/0076-6879(95)48038-2. [DOI] [PubMed] [Google Scholar]
- 8.Shrimpton C. N., Smith A. I., Lew R. A. Soluble metalloendopeptidases and neuroendocrine signaling. Endocr. Rev. 2002;23:647–664. doi: 10.1210/er.2001-0032. [DOI] [PubMed] [Google Scholar]
- 9.Barrett A. J., Rawlings N. D. Oligopeptidases, and the emergence of the prolyl oligopeptidase family. Biol. Chem. Hoppe Seyler. 1992;373:353–360. doi: 10.1515/bchm3.1992.373.2.353. [DOI] [PubMed] [Google Scholar]
- 10.Silva C. L., Portaro F. C., Bonato V. L., de Camargo A. C., Ferro E. S. Thimet oligopeptidase (EC 3.4.24.15), a novel protein on the route of MHC class I antigen presentation. Biochem. Biophys. Res. Commun. 1999;255:591–595. doi: 10.1006/bbrc.1999.0250. [DOI] [PubMed] [Google Scholar]
- 11.Portaro F. C., Gomes M. D., Cabrera A., Fernandes B. L., Silva C. L., Ferro E. S., Juliano L., de Camargo A. C. Thimet oligopeptidase and the stability of MHC class I epitopes in macrophage cytosol. Biochem. Biophys. Res. Commun. 1999;255:596–601. doi: 10.1006/bbrc.1999.0251. [DOI] [PubMed] [Google Scholar]
- 12.Saric T., Beninga J., Graef C. I., Akopian T. N., Rock K. L., Goldberg A. L. Major histocompatibility complex class I-presented antigenic peptides are degraded in cytosolic extracts primarily by thimet oligopeptidase. J. Biol. Chem. 2001;276:36474–36481. doi: 10.1074/jbc.M105517200. [DOI] [PubMed] [Google Scholar]
- 13.Ferro E. S., Hyslop S., Camargo A. C. Intracellular peptides as putative natural regulators of protein interactions. J. Neurochem. 2004;91:769–777. doi: 10.1111/j.1471-4159.2004.02757.x. [DOI] [PubMed] [Google Scholar]
- 14.Rioli V., Gozzo F. C., Heimann A. S., Linardi A., Krieger J. E., Shida C. S., Almeida P. C., Hyslop S., Eberlin M. N., Ferros E. S. Novel natural peptide substrates for endopeptidase 24.15, neurolysin and angiotensin-converting enzyme. J. Biol. Chem. 2003;278:8547–8555. doi: 10.1074/jbc.M212030200. [DOI] [PubMed] [Google Scholar]
- 15.Heimann A. S., Favarato M. H., Gozzo F. C., Rioli V., Carreno F. R., Eberlin M. N., Ferro E. S., Krege J. H., Krieger J. E. ACE gene titration in mice uncovers a new mechanism for ACE on the control of body weight. Physiol. Genomics. 2005;20:173–182. doi: 10.1152/physiolgenomics.00145.2004. [DOI] [PubMed] [Google Scholar]
- 16.Ray K., Hines C. S., Coll-Rodriguez J., Rodgers D. W. Crystal structure of human thimet oligopeptidase provides insight into substrate recognition, regulation, and localization. J. Biol. Chem. 2004;279:20480–20489. doi: 10.1074/jbc.M400795200. [DOI] [PubMed] [Google Scholar]
- 17.Rioli V., Kato A., Portaro F. C., Cury G. K., te Kaat K., Vincent B., Checler F., Camargo A. C., Glucksman M. J., Roberts J. L., et al. Neuropeptide specificity and inhibition of recombinant isoforms of the endopeptidase 3.4.24.16 family: comparison with the related recombinant endopeptidase 3.4.24.15. Biochem. Biophys. Res. Commun. 1998;250:5–11. doi: 10.1006/bbrc.1998.8941. [DOI] [PubMed] [Google Scholar]
- 18.Oliveira V., Campos M., Hemerly J. P., Ferro E. S., Camargo A. C., Juliano M. A., Juliano L. Selective neurotensin-derived internally quenched fluorogenic substrates for neurolysin (EC 3.4.24.16): comparison with thimet oligopeptidase (EC 3.4.24.15) and neprilysin (EC 3.4.24.11) Anal. Biochem. 2001;292:257–265. doi: 10.1006/abio.2001.5083. [DOI] [PubMed] [Google Scholar]
- 19.Oliveira V., Campos M., Melo R. L., Ferro E. S., Camargo A. C., Juliano M. A., Juliano L. Substrate specificity characterization of recombinant metallo oligo-peptidases thimet oligopeptidase and neurolysin. Biochemistry. 2001;40:4417–4425. doi: 10.1021/bi002715k. [DOI] [PubMed] [Google Scholar]
- 20.Scholle M. D., Kriplani U., Pabon A., Sishtla K., Glucksman M. J., Kay B. K. Mapping protease substrate by using a biotinylated phage substrate library. Chembiochem. 2006;7:834–838. doi: 10.1002/cbic.200500427. [DOI] [PubMed] [Google Scholar]
- 21.Oliveira V., Gatti R., Rioli V., Ferro E. S., Spisni A., Camargo A. C., Juliano M. A., Juliano L. Temperature and salts effects on the peptidase activities of the recombinant metallooligopeptidases neurolysin and thimet oligopeptidase. Eur. J. Biochem. 2002;269:4326–4334. doi: 10.1046/j.1432-1033.2002.03129.x. [DOI] [PubMed] [Google Scholar]
- 22.Sigman J. A., Patwa T. H., Tablante A.V., Joseph C. D., Glucksman M. J., Wolfson A. J. Flexibility in substrate recognition by thimet oligopeptidase as revealed by denaturation studies. Biochem. J. 2005;388:255–261. doi: 10.1042/BJ20041481. [DOI] [PMC free article] [PubMed] [Google Scholar]
- 23.Towler P., Staker B., Prasad S. G., Menon S., Tang J., Parsons T., Ryan D., Fisher M., Williams D., Dales N. A., et al. ACE2 X-ray structures reveal a large hinge-bending motion important for inhibitor binding and catalysis. J. Biol. Chem. 2004;279:17996–18007. doi: 10.1074/jbc.M311191200. [DOI] [PMC free article] [PubMed] [Google Scholar]
- 24.Comellas-Bigler M., Lang R., Bode W., Maskos K. Crystal structure of the E. coli dipeptidyl carboxypeptidase Dcp: further indication of a ligand-dependent hinge movement mechanism. J. Mol. Biol. 2005;349:99–112. doi: 10.1016/j.jmb.2005.03.016. [DOI] [PubMed] [Google Scholar]
- 25.Oliveira V., Araujo M. C., Rioli V., de Camargo A. C., Tersariol I. L., Juliano M. A., Juliano L., Ferros E. S. A structure-based site-directed mutagenesis study on the neurolysin (EC 3.4.24.16) and thimet oligopeptidase (EC 3.4.24.15) catalysis. FEBS Lett. 2003;541:89–92. doi: 10.1016/s0014-5793(03)00310-7. [DOI] [PubMed] [Google Scholar]
- 26.Shrimpton C. N., Abbenante G., Lew R. A., Smith I. Development and characterization of novel potent and stable inhibitors of endopeptidase EC 3.4.24.15. Biochem. J. 2000;345:351–356. [PMC free article] [PubMed] [Google Scholar]
- 27.Hirata I. Y., Cesari M. H. S., Nakaie C. R., Boschov P., Ito A. S., Juliano M. A., Juliano L. Internally quenched fluorogenic protease substrates: solid-phase synthesis and fluorescence spectroscopy of peptides containing orth-aminobenzoyl/dinitrophenyl groups as donor acceptor pairs. Lett. Pept. Sci. 1994;1:299–301. [Google Scholar]
- 28.Araujo M. C., Melo R. L., Cesari M. H., Juliano M. A., Juliano L., Carmona A. K. Peptidase specificity characterization of C- and N-terminal catalytic sites of angiotensin I-converting enzyme. Biochemistry. 2000;39:8519–8525. doi: 10.1021/bi9928905. [DOI] [PubMed] [Google Scholar]
- 29.Wilkinson G. N. Statistical estimations in enzyme kinetics. Biochem. J. 1961;80:324–332. doi: 10.1042/bj0800324. [DOI] [PMC free article] [PubMed] [Google Scholar]
- 30.Leatherbarrow R. J. Erithacus Software Ltd.; 2001. Grafit Version 5. [Google Scholar]
- 31.Gill S. C., von Hippel P. H. Calculation of protein extinction coefficients from amino acid sequence data. Anal. Biochem. 1989;182:319–326. doi: 10.1016/0003-2697(89)90602-7. [DOI] [PubMed] [Google Scholar]
- 32.Bradford M. M. A rapid sensitive method for the quantification of microgram quantities of protein utilizing the principle of protein-dye binding. Anal. Biochem. 1976;72:248–254. doi: 10.1016/0003-2697(76)90527-3. [DOI] [PubMed] [Google Scholar]
- 33.Sigman J. A., Edwards S. R., Pabon A., Glucksman M. J., Wolfson A. J. pH dependence studies provide insight into the structure and mechanism of thimet oligopeptidase (EC 3.4.24.15) FEBS Lett. 2003;545:224–228. doi: 10.1016/s0014-5793(03)00548-9. [DOI] [PubMed] [Google Scholar]
- 34.Brocklehurst K. A sound basis for pH-dependent kinetic studies on enzymes. Protein Eng. 1994;7:291–299. doi: 10.1093/protein/7.3.291. [DOI] [PubMed] [Google Scholar]
- 35.Dixon H. B., Clarke S. D., Smith G. A., Carne T. K. The origin of multiply sigmoid curves of pH-dependence. The partitioning of groups among titration pK values. Biochem. J. 1991;278:279–284. doi: 10.1042/bj2780279. [DOI] [PMC free article] [PubMed] [Google Scholar]
- 36.Orlowski M., Michaud C., Molineaux C. J. Substrate-related potent inhibitors of brain metalloendopeptidase. Biochemistry. 1988;27:597–602. doi: 10.1021/bi00402a015. [DOI] [PubMed] [Google Scholar]
- 37.Smith A. I., Lew R. A., Shrimpton C. N., Evans R. G., Abbenante G. A novel stable inhibitor of endopeptidase EC 3.4.24.15 and EC 3.4.24.16 potentiates bradykinin-induced hypotension. Hypertension. 2000;35:626–630. doi: 10.1161/01.hyp.35.2.626. [DOI] [PubMed] [Google Scholar]