Abstract
Analyzing nonlinear conformational relaxation dynamics in elastic networks corresponding to two classical motor proteins, we find that they respond by well defined internal mechanical motions to various initial deformations and that these motions are robust against external perturbations. We show that this behavior is not characteristic for random elastic networks. However, special network architectures with such properties can be designed by evolutionary optimization methods. Using them, an example of an artificial elastic network, operating as a cyclic machine powered by ligand binding, is constructed.
Keywords: complex systems, protein machines, molecular motors, evolutionary optimization
Understanding design principles of single-molecule machines is a major challenge. Experimental and theoretical studies of proteins, acting as motors (1–5), ion pumps (6–8), or channels (6, 9), and enzymes (10–14), show that their operation involves functional conformational motions (see ref. 15). Such motions are slow and cannot therefore be reproduced by full molecular dynamics simulations. Within the last decade, approximate descriptions based on elastic network models of proteins have been developed (16–21). In this approach, structural elements of a protein are viewed as identical point particles, with two particles connected by an elastic string if the respective elements lie close enough in the native state of the considered protein. Thus, a network of elastic connections corresponding to a protein is constructed. So far, the attention has been focused on linear dynamics of elastic networks, characterized in terms of their normal vibrational modes. It has been found that ligand-induced conformational changes in many proteins agree with the patterns of atomic displacements in their slowest vibrational modes (refs. 22–25 and see also refs. 26 and 27), even though nonlinear elastic effects must become important for large deviations from the equilibrium (28, 29). The focus of this article is on nonlinear relaxation phenomena in elastic networks seen as complex dynamical systems.
Generally, a machine is a mechanical device that performs ordered internal motions that are robust against external perturbations. In machines representing single molecules, energy is typically supplied in discrete portions, through individual reaction events. Therefore, their cycles consist of the processes of conformational relaxation that follow after energetic excitations. For a robust machine operation, special nonlinear relaxation dynamics is required. We expect that, starting from a broad range of initial deformations, such dynamical systems would return to the same final equilibrium state. Moreover, the relaxation would proceed along a well defined trajectory (or a low-dimensional manifold), rapidly approached starting from different initial states and robust against external perturbations. These attractive relaxation trajectories would define internal mechanical motions of the machine inside its operation cycle.
This special conformational relaxation dynamics has been confirmed in our study of the elastic networks of two protein motors (F1-ATPase and myosin). On the other hand, our control investigation of random elastic networks has shown that relaxation patterns in random elastic networks are typically complex and qualitatively different from those of protein motors. Actual proteins with specific architectures allowing robust machine operation may have developed through a natural biological evolution, with the selection favoring such special dynamical properties. In a model study, we have demonstrated that artificial elastic network architectures possessing machine-like properties can be designed by running an evolutionary computer optimization process. Finally, an example of an artificially designed elastic network that operates like a machine powered by ligand binding has been constructed.
Elastic Network Models
The considered elastic networks consist of a set of N identical material particles (nodes) connected by identical elastic strings (links). A network is specified by indicating equilibrium positions of all particles. Two particles are connected by a string if the equilibrium distance between them is sufficiently small. The elastic forces, acting on the particles, obey Hooke's law and depend only on the change in the distances between them. In the overdamped limit (18), the velocity of a particle is proportional to the sum of elastic forces applied to it. If Ri(0) are equilibrium positions of the particles and Ri(t) are their actual coordinates, the dynamics is described by:
 |
where A is the adjacency matrix, with the elements Aij = 1, if |Ri(0) − Rj(0)| < l0, and Aij = 0 otherwise. The dependence on the stiffness constant of the strings and the viscous friction coefficient of the particles is removed here by an appropriate rescaling of time.
The dynamics of elastic networks is nonlinear, because distances |Ri − Rj| are nonlinear functions of the coordinates Ri and Rj. Close to the equilibrium, equations of motion can however be linearized, yielding:
 |
for small deviations ri = Ri − Ri(0). These equations can be written as ṙi = − ΣjΛijrj, where Λ is a 3N × 3N linearization matrix. In the linear approximation, relaxation motion is described by a sum of independent exponentially decaying normal modes:
with λα and ei(α) representing nonzero eigenvalues and the respective eigenvectors of the matrix Λ. It should be noted that the same eigenvalues determine vibration frequencies of the network, ωα ∼ , and the vibrational normal modes are the same. Long-time relaxation is dominated by soft modes with small eigenvalues.
Results
Two Motor Proteins.
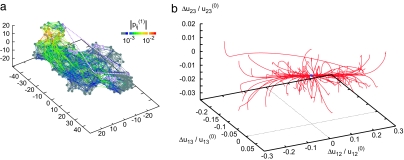
As an example, Fig. 1 shows the elastic network of the single β-subunit of the molecular motor F1-ATPase (Protein Data Bank ID code 1H8H, chain E) (30). Each node corresponds to a residue in this protein (the total number of nodes is N = 466). In Fig. 1b, a set of conformational relaxation trajectories, obtained by numerical integration of the nonlinear elastic model (see Methods and Eq. 1) of this macromolecule, is displayed. To track conformational motions, three network nodes (1, 2, and 3) were chosen, and pair distances u12, u13, and u23 were determined during the relaxation process. Thus, each conformational motion was represented by a trajectory in a 3D space, where coordinates were normalized deviations Δuij/uij(0) from the equilibrium pair distances uij(0) = |Ri(0) − Rj(0)| (uij = |Ri − Rj| and Δuij = uij − uij(0)). Each trajectory begins from a different initial conformation obtained by applying random static forces to all network nodes (see Methods). Trajectories starting from various initial conditions soon converge to a well defined relaxation path leading to the equilibrium state. This path corresponds to a slow motion of the network group, including label 1, with respect to the rest of the molecule. The protein is soft along such a path: by applying static forces of the same magnitude, one can stretch it by 30% along the path, as compared with the length changes of only a few percent when the forces were applied in other directions.
Fig. 1.
Elastic network of the single β-subunit of the molecular motor F1-ATPase (a) and the set of relaxation trajectories for this network (b). Links are colored according to their relative deformations |pij(1)| in the motion corresponding to the slowest normal mode. Each of 100 trajectories starts from a different initial conformation (see Methods). In this case, all of the trajectories converge to the original equilibrium state (blue dot). The labels (1, 2, and 3) are attached at Ile-390, Arg-191, and Gly-54, respectively.
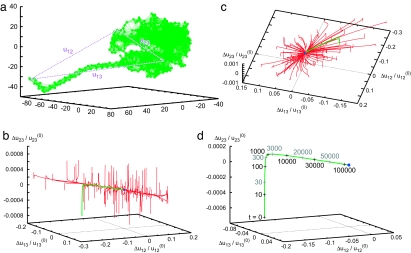
Relaxation behavior in the nonlinear elastic network (N = 793) of another classical molecular motor, myosin (single heavy chain; Protein Data Bank ID code 1KK8, chain A) (31), is displayed in Fig. 2. In contrast to the β-subunit of F1-ATPase, this elastic network possesses an attractive 2D manifold (a plane). The network is extremely stiff for deformations in the directions orthogonal to this plane. By applying static forces of the same magnitude, one can only induce relative deformations of ≈10−3 along such orthogonal directions, as compared with the relative deformations of the order of 10−1 for the directions within the plane. To characterize the temporal course of relaxation, one relaxation trajectory (displayed in green in Fig. 2 b and c) and subsequent positions at different time moments along the trajectory are indicated in Fig. 2d. The trajectory rapidly reaches the plane and then the relaxation motion becomes much slower (with the characteristic time scales larger by a factor 10–100). A similar behavior is characteristic for other relaxation trajectories, starting from different initial conditions. All recorded trajectories returned to the equilibrium state, and no metastable states were encountered starting from the chosen initial conditions.
Fig. 2.
Elastic network of the single heavy chain of myosin (a) and the set of relaxation trajectories for this network (b–d). b and c are viewed from different angles; each of 100 trajectories starts from a different initial conformation (see Methods). All of the trajectories converge to the original equilibrium state (blue dot). d shows a trajectory (shown by green curve in b and c) with labels of passage time. The labels (1, 2, and 3) are attached at Leu-836, Asp-63, and Glu-370, respectively.
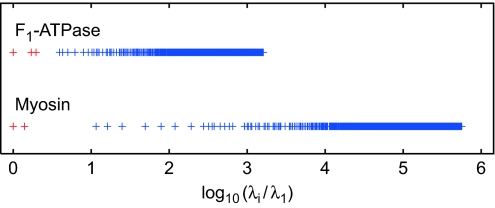
Nonlinear effects were essential in the relaxation dynamics starting from large arbitrary initial deformations considered here. Remarkably, the observed relaxation patterns are nonetheless qualitatively in agreement with the normal mode analysis. Both motors possess a group of soft modes separated by a gap from the rest of the spectrum (eigenvalue spectra of elastic networks of these proteins are shown in Fig. 3). The two soft modes of myosin define the attractive plane seen in the relaxation pattern of its elastic network (Fig. 2). The elastic network of F1-ATPase has three soft modes. However, one of the soft modes has a relaxation rate that is smaller than the other two modes. Therefore, the pattern of relaxation trajectories looks here like a thick 1D bundle. Specific ligand-induced conformational changes in F1-ATPase and myosin were previously shown to have strong overlaps with patterns of deformation in slow vibrational modes (24).
Fig. 3.
Eigenvalue spectra for the networks of F1-ATPase and myosin, normalized to the lowest nonzero eigenvalue λ1. λ1 = 1.09 × 10⁻² for F1-ATPase and 2.81 × 10⁻⁵ for myosin.
Random and Designed Elastic Networks.
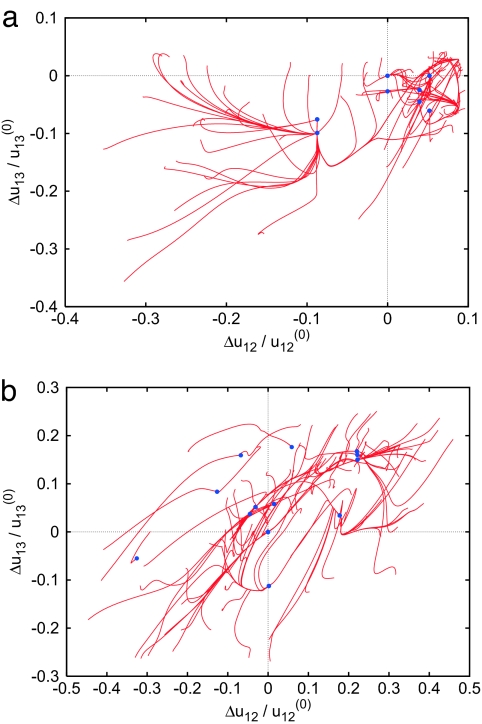
A control study of nonlinear relaxation phenomena in random elastic networks was performed. Such networks were obtained by taking a relatively short chain of N = 64 and randomly folding it in absence of energetic interactions (see Methods). After that, all particles separated by short enough distances were connected by identical elastic links. Fig. 4 shows relaxation patterns for two typical random elastic networks (using the same procedure for generation of initial conditions and for tracking of conformational relaxation as in Figs. 1 and 2). Relaxation patterns in random networks are clearly different from those of the considered motor proteins. Random networks possess many (meta)stable stationary states, with relaxation trajectories often ending in one of them instead of going back to the equilibrium conformation. The linear normal mode description holds in such networks only in close proximity of the equilibrium state.
Fig. 4.
Relaxation trajectories for two random elastic networks, in the plane (Δu12/u12(0), Δu13/u13(0)) of normalized distance deviations. Each of 100 trajectories starts from a different initial conformation. Blue dots indicate stationary states reached; the original equilibrium state is Δu12 = Δu13 = 0. These networks have no internal rotational modes.
Thus, elastic networks of motor proteins are special. Their equilibrium conformation has a big attraction basin. Starting from an arbitrary initial deformation, relaxation dynamics is soon reduced to a low-dimensional attractive manifold. Within its large part, the dynamics is approximately linear and determined by a few soft modes. Proteins with such special dynamical properties, essential for their functions, may have emerged through a biological evolution. Below, we show that artificial elastic networks with similar properties can be constructed by running an evolutionary optimization process based on a variant of the Metropolis algorithm.
The evolutionary optimization technique is described in Methods. For each network, spectral gap g = log10(λ2/λ1) is defined as the logarithm of the ratio between the relaxation rates λ2 and λ1 of its two slowest normal modes. If a substantial gap is present, the slowest mode has the relaxation rate that is much smaller than that of the other modes; therefore, the long-time relaxation in the linear regime would be dominated by this soft normal mode. The used evolutionary optimization process maximizes the spectral gap g of the evolving networks. Beginning with an initial random network, we applied structural mutations and determined the difference Δg = g′ − g of the gaps before and after a mutation. If the gap was increased (Δg > 0), the mutation was always accepted. If Δg < 0, the mutation was accepted with the probability P = exp(Δg/θ), where θ is the effective optimization temperature. This procedure was applied iteratively, generating an evolution started from an initial network.†
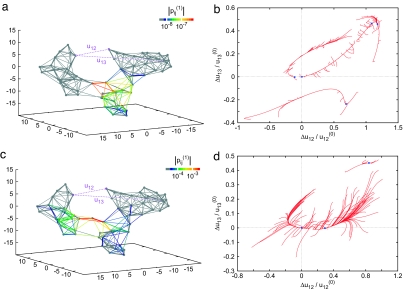
Networks with soft normal modes and large spectral gaps were thus constructed. A typical network with a large gap and its relaxation pattern are shown in Fig. 5 a and b [for other examples, see supporting information (SI) Fig. 7)]. The presence of a large gap has a strong effect on the nonlinear relaxation properties in such systems. They possess well defined long paths with slow conformational motion leading to the equilibrium state. There are only a few (meta)stable states and these states usually lie on an attractive relaxation path, so that a small barrier is encountered when moving along the path. The opposite behavior with complex relaxation patterns and a high number of (meta)stable conformations was found for a set of “failed” networks where gaps were small and could not be significantly increased through the evolution (see SI Fig. 8). Our analysis shows that the designed networks can be viewed as consisting of rigid blocks connected by soft joints; they are able to perform some large conformational changes accompanied by only small local deformations (see SI Fig. 9).
Fig. 5.
Examples of designed elastic networks. (a) A typical network with a large gap (g = 9.53). (b) Its set of 100 relaxation trajectories. (c) A network with a smaller gap (g = 1.22) obtained by reverse evolution from the network in a. (d) Its set of 100 relaxation trajectories. Network links are colored according to their relative deformations |pij(1)| in the motion corresponding to the slowest normal mode; thick lines indicate the backbone chain. Each trajectory starts from a different initial conformation; blue dots indicate stationary states reached.
Spectral gaps of the networks, designed by using this optimization method, are much larger than those characteristic for motor proteins (compare Fig. 3). To improve the agreement, additional “reverse” evolution was subsequently applied to the designed networks, with the selection pressure aimed to decrease the gap (see Methods). While the gap was rapidly reduced, the global relaxation pattern was changing only much more slowly with structural mutations and retained characteristic features of the networks with large gaps. Fig. 5c displays the network, obtained by applying such reverse evolution (with only five subsequent mutations) to the original network shown in Fig. 5a. Although the spectral gap has been reduced from 9.53 to 1.22, the principal structure of the network is retained, with the mutations mostly affecting only the hinge region. The relaxation pattern of the constructed network (Fig. 5d) reveals an attractive path leading to the equilibrium state (with another stable state lying on it). Remarkably, the linear normal mode description of relaxation dynamics holds in such networks within a much larger domain around the equilibrium state. We conclude that, by running an evolutionary optimization process, artificial elastic networks approaching conformational relaxation properties of real motor proteins can be constructed.
An Artificial Machine Network.
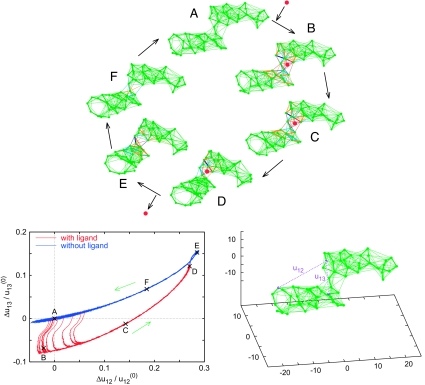
Using such designed networks, we proceed to construct nonlinear elastic systems that can be viewed as prototypes of a machine powered by ligand binding. The network shown in Fig. 6 performs cyclic hinge motions, caused by binding and detachment of a ligand. To obtain it, an initial network with two distinct parts (dense clusters), which were only loosely connected, was prepared. This initial network was characterized by a small spectral gap. By running evolutionary optimization, the architecture of the network was modified, so that it developed a large spectral gap while maintaining its special structure. The equilibrium conformation of the finally obtained network is shown in Fig. 6 Lower Right. The cycle began with binding of a ligand (snapshot A, t = 0). The ligand was an additional particle that could form elastic connections with the existing network nodes. Binding of a ligand was modeled by placing the particle at a location chosen in the hinge region and creating elastic links with the three near nodes (for details, see Methods). When such new links were introduced, they were in a deformed (i.e., stretched) state and a certain amount of energy was thus supplied to the system. Therefore, the network-ligand complex was not initially in the equilibrium state and conformational relaxation to the equilibrium had to occur. Within a short time, deformations spread over a group of near elastic links (B, t = 200), producing a small change in the network configuration. After that, a slow hinge motion of the network-ligand complex took place (C, t = 4,000) until the equilibrium state of the complex was reached (D, t = 20,000). In this state, the ligand was removed. At that moment, the elastic network was in a configuration far from equilibrium and its relaxation set on. Within a short time, the network reached the path (E, t = 20,200) along which its slow ordered relaxation proceeded (F, t = 30,000), until the equilibrium conformation (A) was reached. Then, a new ligand could bind at the network, and the cycle was repeated. For visualization of conformational motions inside the network cycle, see SI Movie 1.
Fig. 6.
The prototype of a molecular machine: an elastic network performing regular cyclic hinge motions caused by repeated binding and detachment of ligand particles. (Upper) A series of snapshots (A–F), corresponding to different cycle phases, is displayed. In the snapshots, the stretched links are shown in light blue (0.01 < Δuij ≤ 0.1) and in blue (0.1 < Δuij), the compressed links in orange (−0.1 ≤ Δuij < −0.01) and in red (Δuij < −0.1). The ligand is shown as a red dot. (Lower) (Left) Trajectories of the network for 10 subsequent cycles in the plane (Δu12, Δu13) of distance deviations between the three labeled nodes (Right). Dots A to F along the trajectory correspond to the network conformations shown in the snapshots A to F.
To monitor conformational motions, three labels were attached to the network, and distances u12 and u13 between them were recorded. Fig. 6 Lower Left shows trajectories in the plane (Δu12, Δu13) that correspond to the operation of this prototype machine in the presence of noise and with stochastic binding of ligands. As seen in Fig. 6, the trajectories of the forward and back hinge motions are different, but both of them are well defined. The applied noise (see Methods) is only weakly perturbing them, which means that both the free network and the network–ligand complex have narrow valleys with steep walls, leading to their respective equilibrium states. Binding of a ligand is possible in a relatively broad interval of conformations near the equilibrium and therefore there is a dispersion in the transitions from the upper to the lower branch of the cycle. The operation of this machine is essentially nonlinear and unharmonic effects are strong. Characteristic rates of slow relaxation motions in this network differ by a factor between 10 and 1,000 from the rate of the fast conformational transition after the ligand binding.
Discussion
In conclusion, we have shown that motor proteins possess unique dynamical properties, intrinsically related to their functioning as machines. We have also demonstrated that artificial elastic networks with similar properties can be constructed by evolutionary optimization methods. To verify these theoretical predictions, special single-molecule experiments monitoring conformational relaxation after arbitrary initial deformations can be performed. An example of an elastic machine-like network powered by ligand binding is presented. Using such designed networks, fundamentals of molecular machine operation, including energetic aspects, the role of thermal noise and hydrodynamic interactions, can be discussed (32). Comparing the behavior of such designed networks with that of real molecular machines, better understanding of what is general and what is specific for a particular protein can be gained. Moreover, our analysis provides a systematic approach for the design of proteins with prescribed (programmed) robust conformational motions. Not only proteins, but also atomic clusters can be described by elastic network models (33). Similar methods can further be used for engineering of nonprotein machine-like nanodevices (see ref. 34).
Methods
The elastic networks for protein structures in Figs. 1 and 2 are constructed from the structural data of F1-ATPase in the ATP-analog state (Protein Data Bank ID code 1H8H) chain E (30) and myosin in the ATP-analog state (Protein Data Bank ID code 1KK8) chain A (31) with a cutoff distance l0 = 10 Å. We place a node at the position of each α-carbon atom and connect nodes lying within the cutoff distance by a link. Stiffness constants of all links and friction coefficients for all particles are equal.
To generate random networks, a chain of N nodes is taken and folded randomly in the 3D space. Each next node is positioned at random, in such a way that its distance l from the preceding node satisfies the condition lmin ≤ l ≤ lmax. Moreover, the next node should be separated by at least the distance lmin from all previous nodes. Examining the folded chain, all pairs of nodes (i, j) with distances <l0 are noticed (l0 > lmax) and connected by elastic strings (hence, not only all neighbors in the string get connected, but also those nodes that come by chance close one to another in the folded conformation).
The iterative optimization process consists of a sequence of structural mutations followed by selection. To perform a mutation, a node is taken at random and its equilibrium position is changed. The new equilibrium position is chosen with equal probability within a sphere of radius d around the old equilibrium position. To preserve the backbone chain, we additionally require that, after a mutation, the distances of the node from its both neighbors in the chain lie within an interval from lmin to lmax; other pair distances should not be shorter than lmin either. The new graph of connections after a mutation is constructed by examining the pair distances between all nodes and linking the nodes separated at equilibrium by a distance shorter than l0.
Sometimes, networks allowing internal free rotations (and, thus, additional zero eigenvalues) may be obtained. To distinguish zero eigenvalues numerically, we adopt a numerical cutoff δλ = 10−12 and assume the eigenvalues < δλ to be zero. For the networks without internal rotation modes, that is, if the number Nnz of nonzero modes is equal to 3N − 6, we proceed in each iteration step as described. When such modes are present, a mutation is always accepted when it decreases the number of zero eigenvalues (N′zm < Nzm) and accepted with the probability P = exp[−(N′zm − Nzm)/θ] otherwise. In this study, we consider networks with N = 64 nodes. The parameter values d = lmin = 3.4, lmax = 4.2, l0 = 8.0, and θ = 0.1 are used.
Most of the networks after optimization (97.3%) had a large gap g > 3, whereas such gaps were rare in the initial networks (1.9%). Here, only networks without internal rotations were counted (1,511 random networks of 30,000 trials and 2,346 selected networks of 2,500 trials).
In the reverse evolution used to generate special networks with smaller gaps (such as shown in Fig. 5c), the same evolution algorithm is used with the replacement of g by −g; the effective temperature is θ = 0.01 in these simulations.
Around the equilibrium conformation, relative changes pij(α) in the distances uij between nodes i and j in a relaxation mode α are calculated as pij(α) = ∂uij/∂Xα = eij(α)·uij(0)/uij(0), where eij(α) = ei(α) − ej(α), uij(0) = Ri(0) − Rj(0) and uij(0) = |uij(0)| (see also Eq. 3). Here, the eigenvectors are normalized as Σi|ei(α)|2 = 1. In SI Fig. 9, statistical distributions of relative changes pij(1) in the slowest relaxation mode (α = 1) in ensembles of elastic networks are shown.
For trajectory visualizations, three labels (1, 2, and 3) are attached to a network and distances u12, u13, and u23 between them are recorded. The labels are chosen in such a way that |p12(1)|, the relative distance change in the slowest relaxation mode, is maximal between the nodes labeled as 1 and 2; then the third node is chosen for which |p13(2)|, in the second slowest relaxation mode, is maximal between the nodes labeled as 1 and 3 (there are two choices and we have selected one of them).
To prepare initial conditions when relaxation patterns are considered, we apply randomly chosen static forces Fi,static and wait for a certain time τs. These random forces are chosen in such a way that their total magnitude Fs = [Σi=1N|Fi,static|2]1/2 is fixed. Then, we remove the static forces and record the trajectory. For each network, 100 trajectories from different initial conditions are shown. In Fig. 1, Fs = 10, τs = 3 × 10⁴; in Fig. 2, Fs = 0.1, τs = 105; and in Figs. 4 and 5 and SI Figs. 7 and 8, Fs = 0.1 and τs = 106.
In Fig. 6 and SI Movie 1, we initially place a ligand in the center of mass of the three ligand-binding nodes and introduce additional links to these nodes with the natural length of 1.7. At the initial moment, the links are longer than their natural lengths (i.e., they are stretched) and thus attractive forces between the ligand and the binding nodes are acting. To include fluctuations, random time-dependent forces fi(t) of intensity σ have been added to the equations of motion of all particles, i.e., Ṙi = Fi,elastic + fi(t) with 〈fi(t)〉 = 0 and 〈fi(t)·fj(t′)〉 = 6σδijδ(t − t′). We have σ = 10−3 (Fig. 6 Upper and SI Movie 1) and 3 × 10⁻³ (Fig. 6 Lower Left). At t = 20,000 (which is long enough for the network to relax to the steady state with a ligand, snapshot D), we remove the ligand and the additional links. In the ligand-free state, we have assumed that the network binds with a ligand again at a constant rate (probability per unit time) ν even in nonequilibrium network configurations, provided that all distances uij between the three ligand-binding nodes satisfy the conditions |Δuij| = |uij − uij(0)| ≤ εl, i.e., the conformation of the ligand-binding site is close enough to the initial one. Then, a ligand is placed again in the center of mass of the ligand-binding nodes and the next cycle starts. The parameter values ν = 10−6 and εl = 0.01 are used. Coordinates of the nodes in the constructed example of the machine-like network and positions of the three binding nodes are given in SI Data Set.
Supplementary Material
Acknowledgments
Y.T. was supported by the Japan Society for the Promotion of Science through a fellowship for research abroad (H17).
Footnotes
The authors declare no conflict of interest.
This article contains supporting information online at www.pnas.org/cgi/content/full/0702950104/DC1.
The described evolutionary optimization algorithm allows us to construct only the networks with a single soft mode. It can be, however, easily modified for the design of networks with two or more soft modes, separated by a gap from the rest of the spectrum.
References
- 1.Amos LA, Cross RA. Curr Opin Struct Biol. 1997;7:239–246. doi: 10.1016/s0959-440x(97)80032-2. [DOI] [PubMed] [Google Scholar]
- 2.Spudich JA. Nature. 1994;372:515–518. doi: 10.1038/372515a0. [DOI] [PubMed] [Google Scholar]
- 3.Corrie JET, Brandmeier BD, Ferguson RE, Trentham DR, Kendrick-Jones J, Hopkins SC, van der Heide UA, Goldman YE, Sabido-David C, Dale RE, et al. Nature. 1999;400:425–430. doi: 10.1038/22704. [DOI] [PubMed] [Google Scholar]
- 4.Kitamura K, Tokunaga M, Esaki S, Iwane AH, Yanagida T. Biophysics (Japan) 2005;1:1–19. doi: 10.2142/biophysics.1.1. [DOI] [PMC free article] [PubMed] [Google Scholar]
- 5.Boyer PD. Annu Rev Biochem. 1997;66:717–749. doi: 10.1146/annurev.biochem.66.1.717. [DOI] [PubMed] [Google Scholar]
- 6.Gouaux E, MacKinnon R. Science. 2005;310:1461–1465. doi: 10.1126/science.1113666. [DOI] [PubMed] [Google Scholar]
- 7.Scarborough GA. Curr Opin Cell Biol. 1999;11:517–522. doi: 10.1016/S0955-0674(99)80075-1. [DOI] [PubMed] [Google Scholar]
- 8.Toyoshima C, Nomura H. Nature. 2002;418:605–611. doi: 10.1038/nature00944. [DOI] [PubMed] [Google Scholar]
- 9.Perozo E, Cortes DM, Cuello LG. Science. 1999;285:73–78. doi: 10.1126/science.285.5424.73. [DOI] [PubMed] [Google Scholar]
- 10.Blumenfeld LA, Tikhonov AN. Biophysical Thermodynamics of Intracellular Processes: Molecular Machines of the Living Cell. Berlin: Springer; 1994. [Google Scholar]
- 11.Adams MJ, Buehner M, Chandrasekhar K, Ford GC, Hackert ML, Liljas A, Rossmann MG, Smiley IE, Allison WS, Everse J, et al. Proc Natl Acad Sci USA. 1973;70:1968–1972. doi: 10.1073/pnas.70.7.1968. [DOI] [PMC free article] [PubMed] [Google Scholar]
- 12.Reed LJ, Hackert ML. J Biol Chem. 1990;265:8971–8974. [PubMed] [Google Scholar]
- 13.Lerch H-P, Mikhailov AS, Hess B. Proc Natl Acad Sci USA. 2002;99:15410–15415. doi: 10.1073/pnas.232376799. [DOI] [PMC free article] [PubMed] [Google Scholar]
- 14.Lerch H-P, Rigler R, Mikhailov AS. Proc Natl Acad Sci USA. 2005;102:10807–10812. doi: 10.1073/pnas.0504995102. [DOI] [PMC free article] [PubMed] [Google Scholar]
- 15.Gerstein M, Lesk AM, Chothia C. Biochemistry. 1994;33:6739–6749. doi: 10.1021/bi00188a001. [DOI] [PubMed] [Google Scholar]
- 16.Tirion MM. Phys Rev Lett. 1996;77:1905–1908. doi: 10.1103/PhysRevLett.77.1905. [DOI] [PubMed] [Google Scholar]
- 17.Bahar I, Atilgan AR, Erman B. Folding Des. 1997;2:173–181. doi: 10.1016/S1359-0278(97)00024-2. [DOI] [PubMed] [Google Scholar]
- 18.Haliloglu T, Bahar I, Erman B. Phys Rev Lett. 1997;79:3090–3093. [Google Scholar]
- 19.Tama F, Sanejouand Y-H. Protein Eng. 2001;14:1–6. doi: 10.1093/protein/14.1.1. [DOI] [PubMed] [Google Scholar]
- 20.Liao J-L, Beratan DN. Biophys J. 2004;87:1369–1377. doi: 10.1529/biophysj.103.038653. [DOI] [PMC free article] [PubMed] [Google Scholar]
- 21.Chennubhotla C, Rader AJ, Yang L-W, Bahar I. Phys Biol. 2005;2:S173–S180. doi: 10.1088/1478-3975/2/4/S12. [DOI] [PubMed] [Google Scholar]
- 22.Brooks B, Karplus M. Proc Natl Acad Sci USA. 1985;82:4995–4999. doi: 10.1073/pnas.82.15.4995. [DOI] [PMC free article] [PubMed] [Google Scholar]
- 23.Levitt M, Sander C, Stern PS. J Mol Biol. 1985;181:423–447. doi: 10.1016/0022-2836(85)90230-x. [DOI] [PubMed] [Google Scholar]
- 24.Zheng W, Doniach S. Proc Natl Acad Sci USA. 2003;100:13253–13258. doi: 10.1073/pnas.2235686100. [DOI] [PMC free article] [PubMed] [Google Scholar]
- 25.Li G, Cui Q. Biophys J. 2004;86:743–763. doi: 10.1016/S0006-3495(04)74152-1. [DOI] [PMC free article] [PubMed] [Google Scholar]
- 26.Cui Q, Bahar I, editors. Normal Mode Analysis: Theory and Applications to Biological and Chemical Systems. Boca Raton, FL: CRC; 2006. [Google Scholar]
- 27.Yang L-W, Bahar I. Structure (London) 2005;13:893–904. doi: 10.1016/j.str.2005.03.015. [DOI] [PMC free article] [PubMed] [Google Scholar]
- 28.Ma J. Structure (London) 2005;13:373–380. doi: 10.1016/j.str.2005.02.002. [DOI] [PubMed] [Google Scholar]
- 29.Miyashita O, Onuchic JN, Wolynes PG. Proc Natl Acad Sci USA. 2003;100:12570–12575. doi: 10.1073/pnas.2135471100. [DOI] [PMC free article] [PubMed] [Google Scholar]
- 30.Menz RI, Leslie AGW, Walker JE. FEBS Lett. 2001;494:11–14. doi: 10.1016/s0014-5793(01)02302-x. [DOI] [PubMed] [Google Scholar]
- 31.Himmel DM, Gourinath S, Reshetnikova L, Shen Y, Szent-Györgyi AG, Cohen C. Proc Natl Acad Sci USA. 2002;99:12645–12650. doi: 10.1073/pnas.202476799. [DOI] [PMC free article] [PubMed] [Google Scholar]
- 32.Jülicher F, Ajdari A, Prost J. Rev Mod Phys. 1997;69:1269–1281. [Google Scholar]
- 33.Piazza F, De Los Rios P, Sanejouand Y-H. Phys Rev Lett. 2005;94:145502. doi: 10.1103/PhysRevLett.94.145502. [DOI] [PubMed] [Google Scholar]
- 34.Kinbara K, Aida T. Chem Rev. 2005;105:1377–1400. doi: 10.1021/cr030071r. [DOI] [PubMed] [Google Scholar]
Associated Data
This section collects any data citations, data availability statements, or supplementary materials included in this article.


