

Short abstract
A novel microarray technology that permits the screening of alternative splice variants identifies disease-associated alternative splicing patterns in ion channel genes of patients with mesial temporal lobe epilepsy and Alzheimers disease.
Abstract
Background
Alternative gene transcript splicing permits a single gene to produce multiple proteins with varied functions. Bioinformatic investigations have identified numerous splice variants, but whether these transcripts are translated to functional proteins and the physiological significance of these alternative proteins are largely unknown. Through direct identification of splice variants associated with disease states, we can begin to address these questions and to elucidate their roles in disease predisposition and pathophysiology. This work specifically sought to identify disease-associated alternative splicing patterns in ion channel genes by comprehensively screening affected brain tissue collected from patients with mesial temporal lobe epilepsy and Alzheimer's disease. New technology permitting the screening of alternative splice variants in microarray format was employed. Real time quantitative PCR was used to verify observed splice variant patterns.
Results
This work shows for the first time that two common neurological conditions are associated with extensive changes in gene splicing, with 25% and 12% of the genes considered having significant changes in splicing patterns associated with mesial temporal lobe epilepsy and Alzheimer's disease, respectively. Furthermore, these changes were found to exhibit unique and consistent patterns within the disease groups.
Conclusion
This work has identified a set of disease-associated, alternatively spliced gene products that represent high priorities for detailed functional investigations into how these changes impact the pathophysiology of mesial temporal lobe epilepsy and Alzheimer's disease.
Background
The complexity of the genome lies not only in the many genes comprising it, but also in the many levels of processing that influence the proteins that are produced and their abundance. One key site of regulation is the splicing of precursor RNAs to their associated mRNA transcripts. This process alone allows a single gene to have multiple different mRNA transcripts, producing proteins that may differ substantially from one another, even to the extent of having opposing effects [1]. Overall, however, little is known about the functional differences amongst the alternative proteins produced from the same gene. Because the functional characterization of proteins can be laborious, it would be useful to be able to prioritize alternative transcripts more likely to have biological significance. One direction for prioritization is on the basis of association with human disease.
Alternative splicing of key genes generates alternative proteins that contribute to several prominent human diseases, for example, the spinal motor neuron protein in spinal muscular atrophy [2], cardiac troponin T, insulin receptor, myotubularin-related 1, and other proteins in myotonic dystrophies [3-5], and the tau protein in frontotemporal dementia and Alzheimer's disease [3,4] (other examples are reviewed extensively in [5]). Furthermore, alternative splicing of a sodium channel gene, SCN1A, has also recently been associated with altered response to antiepileptic medications [6]. There are potentially many more undetected examples of splicing alterations associated with disease pathophysiology and drug response variation in humans.
Studies of alternative splicing have usually been restricted to a single gene or small gene family. To date, there are only a few reports of splice variation screens in human disease and none has been reported for any central nervous system disease. Recently, new technology has become available that allows for the comprehensive investigation of alternative splicing through the use of splice variant microarrays. This technology uses probes in a microarray format and screens for unique exon-exon junctions specific to a particular splicing event [7-10]. Here we applied this systematic approach to assess the relationship between alternative splicing and two common and important neurological conditions, with the aim of identifying alternative splicing patterns of potential relevance to human disease.
Mesial temporal lobe epilepsy (mTLE) and Alzheimer's disease (AD) are highly complex neurological diseases characterized by aberrant neuronal excitation and neurodegeneration. While the pathological processes differ substantially, both diseases exhibit pathophysiology linked to ion channel activity. Seizure activity characteristic of epilepsy is the result of a dysregulation of inhibitory and excitatory neuronal signaling largely controlled by ion channel activity [11]. Likewise, abnormal ion channel function also has been associated extensively with AD. AD-related neurodegeneration is believed to be, in part, caused by the overactivation of N-methyl-D-aspartate receptor activation and subsequent increases in intracellular calcium, oxidative stress, and neurodegeneration [12]. Other ion channels, including glutamate receptors, nicotinic cholinergic receptors, and calcium and potassium channels, also have been implicated in AD pathophysiology [13-18]. Little information exists regarding the impact of splicing variation of ion channel genes on mTLE and AD. Our work sought to comprehensively evaluate ion channel splice variation in these two neurological diseases using a microarray format (ExonHit Therapeutics). We evaluated 1,665 known and potential splice events across 287 ion channel genes in human brain tissue samples collected from patients with AD and mTLE. In addition to identifying disease-associated splicing variation, a secondary aim of this work was to assess the reliability of the array-based identification of splicing changes through the use of real time PCR (rtPCR) to validate associations detected using the high-throughput platform.
Results
Mesial temporal lobe epilepsy
Following our initial screen of 1,665 possible alternative splicing events, a total of 221 splicing changes were identified as statistically significantly changed in mTLE samples, with p < 0.05, when comparing splice variant ratio (SVR) values calculated using equation 1 (see Materials and methods). Selected statistically significant events representing a range of p values were chosen for rtPCR confirmation. Of 13 splice array-identified alternative splicing events with an associated p value of less than 0.05, 9 were verified using rtPCR in a larger sample size. Evaluation of discrete groups of p value ranges revealed increased success rates with lower p values (0.02 < p < 0.05, 0% success (two events evaluated); 0.01 < p < 0.02, 70% success (seven events evaluated); p < 0.01, 100% success (3 events evaluated)). In order to report changes most likely to be real, only events that had a p value in splice array analyses of less than 0.02 are reported (Table 1). With this additional filter, a total of 126 alternative splicing events were observed in brain tissue collected from mTLE patients. As additional confirmation, four events not identified as changed in the splice array screen (p > 0.05) were confirmed not to be changed using rtPCR. The compiled list of rtPCR confirmed mTLE-associated alternative splicing events are included in Table 2.
Table 1.
List of ion channel genes exhibiting alternative splicing in patients with mTLE
| Genes by gene class | GenBank accession number (reference transcript*) | GenBank accession number (variant transcript*) | Alternative splicing event: change of mRNA transcript composition in epilepsy† | Alternatively spliced region | Splice array p value |
|---|---|---|---|---|---|
| Calcium channels | |||||
| CACNA1A | NM_023035 | U79668 | ES: 26% ↓ variant/reference ratio | EXON 48 | 0.002 |
| NM_023035 | CQ723237 | ASA: 24% ↓ reference/total ratio | EXON 23 | 0.003 | |
| NM_023035 | BE972738 | NE: 36% ↓ variant/total ratio | 3' downstream | <0.001 | |
| CACNA1C | NM_000719 | CQ722696 | ASD: 94% ↓ variant/reference ratio | EXON 2 | <0.001 |
| NM_000719 | CQ722691 | ASD: 23% ↓ variant/reference ratio | EXON 24 | 0.017 | |
| CACNA1H | NM_021098 | CQ730788 | ASA: 25% ↓ variant/reference ratio | EXON 34 | <0.001 |
| CACNA1I | NM_001003406 | AX068892 | NE: 36% ↓ variant/reference ratio | INTRON 1 | 0.012 |
| NM_001003406 | AX068892 | NE: 23% ↓ variant/reference ratio | INTRONS 20/21 | 0.009 | |
| CACNA2D1 | NM_000722 | BG211441 | ES: 28% ↑ reference/total ratio | EXON 8 | 0.003 |
| CACNB1 | NM_000723 | NM_199247 | NE: 28% ↑ variant/reference ratio | INTRON 6 | <0.001 |
| NM_000723 | BP316738 | NE: 28% ↑ variant/reference ratio | INTRON 6 | 0.002 | |
| CACNB2 | NM_201596 | AF465485 | ES: 20% ↓ variant/reference ratio | EXON 7 | 0.020 |
| CACNB3 | NM_000725 | AK122911 | NEs: 28% ↓ variant/total ratio | 5' upstream | <0.001 |
| CACNB4 | NM_000726 | AY054985 | NE: 31% ↑ variant/reference ratio | INTRON 2 | 0.012 |
| CACNG4 | NM_014405 | AW134993 | PIED: 45% ↑ reference/total ratio | EXON 4 | 0.009 |
| NM_014405 | AI675178 | PIED: 41% ↓ variant/reference ratio | EXON 4 | 0.003 | |
| Chloride channels | |||||
| CLCN2 | NM_004366 | BC021578 | ES: 38% ↓ reference/total ratio | EXON 13 | <0.001 |
| CLCN3 | NM_001829 | CQ732096 | ASA: 22% ↓ variant/reference ratio | EXON 2 | 0.004 |
| NM_001829 | CQ736554 | NE: 32% ↑ reference/total ratio | INTRON 12 | 0.012 | |
| CLCN6 | NM_001286 | BC050457 | ASA: 16% ↓ variant/reference ratio | EXON 20 | 0.016 |
| CLCN7 | NM_001287 | AK096963 | IR: 36% ↓ variant/reference ratio | INTRON 18 | <0.001 |
| NM_001287 | BQ920088 | ASA: 21% ↓ variant/reference ratio | EXON 12 | 0.004 | |
| CLIC5 | NM_016929 | BC039380 | ASA: 20% ↓ reference/total ratio | EXON 5 | 0.013 |
| Sodium channels | |||||
| SCN2A2 | NM_021007 | BC029489 | ES: 23% ↑ reference/total ratio | EXON 1 | 0.006 |
| SCN9A | NM_002977 | BG108767 | ASD: 26% ↓ variant/reference ratio | EXON 16 | 0.003 |
| SCNN1A | NM_001038 | BF033087 | PIED: 21% ↓ variant/reference ratio | EXON 13 | <0.001 |
| SCNN1D | NM_002978 | AX230571 | NE: 52% ↑ variant/total ratio | INTRON 2 | 0.012 |
| NM_002978 | AK127357 | NE: 77% ↑ variant/total ratio | 5' upstream | 0.002 | |
| Potassium channels | |||||
| KCNAB2 | NM_003636 | BG720519 | ES: 35% ↑ variant/reference ratio | EXON 1 | 0.014 |
| NM_003636 | BM823724 | NEs: 19% ↓ variant/total ratio | 5' upstream | 0.015 | |
| NM_003636 | CA495339 | IR: 24% ↓ reference/total ratio | INTRON 11 | 0.020 | |
| KCNC3 | NM_004977 | AK127492 | ASD: 27% ↓ variant/reference ratio | EXON 5 | 0.020 |
| KCNH5 | NM_172376 | NM_139318 | NE: 24% ↑ variant/total ratio | 3' downstream | <0.001 |
| KCNJ1 | NM_153767 | NM_000220 | NE: 27% ↓ variant/reference ratio | INTRON 3 | <0.001 |
| KCNJ6 | NM_002240 | CQ738104 | NEs: 24% ↓ variant/total ratio | INTRON 2 | 0.017 |
| KCNJ15 | NM_170736 | NM_002243 | NE: 108% ↑ variant/total ratio | 5' upstream | <0.001 |
| NM_170736 | NM_170737 | NE: 2.5x ↑ reference/total ratio | INTRON 2 | <0.001 | |
| NM_170736 | CQ732921 | NEs: 42% ↓ variant/reference ratio | INTRON 2 | 0.005 | |
| NM_170736 | BM544058 | NE: 98% ↑ variant/total ratio | 5' upstream | <0.001 | |
| NM_170736 | BF105170 | NE: 78% ↑ variant/total ratio | 5' upstream | 0.003 | |
| NM_170736 | BI518753 | NE: 2.5x ↑ reference/total ratio | INTRON 2 | <0.001 | |
| KCNK1 | NM_002245 | AV733795 | PIED: 34% ↓ variant/reference ratio | EXON 2 | 0.010 |
| NM_002245 | BG699040 | NE: 45% ↓ variant/total ratio | INTRON 1 | 0.009 | |
| NM_002245 | BF212472 | NEs: 23% ↓ variant/total ratio | INTRON 1 | 0.017 | |
| NM_002245 | BU661246 | NEs: 48% ↓ variant/total ratio | INTRON 1 | <0.001 | |
| KCNK2 | NM_014217 | BU956092 | ES: 62% ↑ reference/total ratio | EXON 4 | 0.008 |
| KCNK4 | NM_016611 | NM_033310 | NE: 102% ↑ variant/total ratio | 5' upstream | 0.005 |
| KCNK12 | NM_022055 | AX302031 | NEs: 20% ↓ variant/total ratio | INTRON 1 | 0.014 |
| KCNMA1 | NM_002247 | CQ870200 | NE: 24% ↓ variant/reference ratio | EXON 20 | 0.006 |
| NM_002247 | CQ870204 | PIED: 32% ↓ variant/reference ratio | 3' downstream | 0.020 | |
| NM_002247 | BG185868 | NE: 28% ↓ variant/reference ratio | EXON 9 | 0.014 | |
| KCNN2 | NM_021614 | NM_170775 | NE: 26% ↓ variant/total ratio | INTRON 3 | 0.002 |
| KCNQ2 | NM_004518 | AY358189 | NE: 28% ↓ variant/reference ratio | INTRON 7 | 0.018 |
| NM_004518 | BG772772 | NEs: 23% ↓ variant/reference ratio | INTRON 7 | 0.018 | |
| HCN3 | NM_020897 | CQ715247 | EsS: 15% ↓ variant/reference ratio | EXONS 3-4 | 0.012 |
| SLICK | NM_198503 | CQ728754 | EsS: 28% ↓ reference/total ratio | EXONS 22-25 | 0.019 |
| NM_198503 | CQ728754 | ES: 57% ↑ variant/reference ratio | EXON 15 | 0.003 | |
| GABA receptors | |||||
| GABRA2 | NM_000807 | CD014113 | ES: 26% ↑ reference/total ratio | EXON 8 | <0.001 |
| NM_000807 | CD014116 | EsS: 29% ↑ reference/total ratio | EXONS 4-9 | <0.001 | |
| NM_000807 | CD014112 | EsS: 35% ↑ reference/total ratio | EXON 4 | <0.001 | |
| NM_000807 | CD014107 | EsS: 31% ↑ reference/total ratio | EXONS 7/8 | <0.001 | |
| NM_000807 | CD014110 | EsS: 36% ↑ reference/total ratio | EXONS 6-8 | <0.001 | |
| NM_000807 | CD014109 | EsS: 40% ↑ reference/total ratio | EXONS 6/7 | <0.001 | |
| GABRA3 | NM_000808 | AX897950 | ES: 17% ↓ reference/total ratio | EXON 7 | 0.007 |
| GABRG2 | NM_198904 | NM_198903 | ASA: 22% ↑ reference/total ratio | EXON 4 | 0.005 |
| GABRR1 | NM_002042 | CB959800 | NEs: 17% ↓ variant/total ratio | 5' upstream | 0.007 |
| Ionotropic glutamate receptors | |||||
| GRIA1 | NM_000827 | A46050 | NE: 34% ↓ variant/reference ratio | INTRON 14 | 0.012 |
| NM_000827 | M64752 | NE: 39% ↓ variant/reference ratio | INTRON 14 | 0.008 | |
| GRIA2 | NM_000826 | BC010574 | NE: 44% ↓ variant/reference ratio | INTRON 13 | 0.007 |
| NM_000826 | AX147452 | NE: 61% ↓ variant/reference ratio | INTRON 13/EXON14 | 0.005 | |
| NM_000826 | AV748963 | NE: 44% ↓ variant/reference ratio | EXON 14 | 0.015 | |
| GRIA3 | NM_007325 | NM_181894 | NEs: 19% ↑ variant/reference ratio | INTRON 2 | 0.006 |
| GRIK2 | NM_021956 | CQ715784 | ASD: 65% ↓ reference/total ratio | EXON 10 | <0.001 |
| GRIK4 | NM_014619 | CQ869986 | NEs: 29% ↓ variant/total ratio | 5' upstream | 0.006 |
| NM_014619 | CQ715345 | NE: 31% ↓ variant/total ratio | INTRON 4 | 0.015 | |
| NM_014619 | CQ715345 | ES: 23% ↑ reference/total | EXON 7 | 0.005 | |
| GRIK5 | NM_002088 | CQ719647 | ASD: 24% ↓ reference/total ratio | EXON 16 | 0.008 |
| NM_002088 | AX665460 | ASD: 23% ↓ variant/reference ratio | EXON 18 | 0.004 | |
| NM_002088 | CN420154 | EsS: 27% ↓ variant/reference | EXONS 12-14 | 0.020 | |
| FXYD domain ion transport regulators | |||||
| FXYD1 | NM_021902 | BQ181273 | IR: 51% ↓ variant/reference ratio | INTRON 7 | <0.001 |
| FXYD6 | NM_022003 | AX430335 | NE: 31% ↓ variant/total ratio | 5' upstream | <0.001 |
| NM_022003 | AX892598 | NE: 35% ↓ variant/total ratio | 5' upstream | <0.001 | |
| NM_022003 | BC018652 | NEs: 38% ↓ variant/reference ratio | EXON 1/INTRON 1 | <0.001 | |
| NM_022003 | AL832811 | NE: 33% ↓ variant/reference ratio | INTRON 1 | <0.001 | |
| NM_022003 | AW270073 | ES: 34% ↓ variant/reference ratio | EXON 9 | <0.001 | |
| NM_022003 | BI823239 | NE: 48% ↓ variant/reference ratio | INTRON 1 | <0.001 | |
| NM_022003 | BF527041 | NE: 36% ↓ variant/reference ratio | INTRON 1 | 0.002 | |
| NM_022003 | BP372334 | NE: 45% ↓ variant/reference ratio | INTRON 1 | <0.001 | |
| NM_022003 | BE263758 | NE: 37% ↓ variant/reference ratio | EXON 2 | <0.001 | |
| NM_022003 | BX488702 | ASA: 50% ↓ variant/reference ratio | INTRON 2 | <0.001 | |
| NM_022003 | BI598749 | NE: 40% ↓ variant/reference ratio | INTRON 1 | 0.006 | |
| FXYD7 | NM_022006 | CQ722304 | ES: 21% ↓ variant/reference ratio | EXON 4 | 0.007 |
| Transient receptor potential cation channels | |||||
| TRPA1 | NM_007332 | BF570694 | ASD: 37% ↓ reference/total ratio | EXON 25 | <0.001 |
| TRPC4 | NM_016179 | AF421362 | ES: 24% ↓ reference/total ratio | EXON 3 | 0.004 |
| TRPM1 | NM_002420 | AX480882 | ASD:43% ↓ variant/reference ratio | EXON 17 | <0.001 |
| TRPM7 | NM_017672 | CQ728707 | EsS: 35% ↑ variant/reference ratio | EXONS 7-11 | <0.001 |
| TRPV1 | NM_080704 | NM_080705 | NE: 31% ↑ variant/total ratio | INTRON 1 | 0.007 |
| NM_080704 | AX686983 | ES: 35% ↑ variant/reference ratio | EXON 8 | 0.005 | |
| TRPV2 | NM_016113 | BQ645005 | ASD: 25% ↓ variant/reference ratio | EXON 15 | 0.005 |
| Glycine receptors | |||||
| GLRB | NM_000824 | CD013911 | ES: 31% ↑ variant/reference ratio | EXON 9 | 0.004 |
| Inositol triphosphate receptors | |||||
| ITPR1 | NM_002223 | CQ727353 | EsS: 22% ↑ variant/reference ratio | EXONS 52-54 | 0.020 |
| Purinergic receptors | |||||
| P2RX1 | NM_002558 | BM469621 | NE: 57% ↑ variant/total ratio | INTRON 3 | <0.001 |
| NM_002558 | BP372168 | ASD: 17% ↑ reference/total ratio | EXON 1 | 0.002 | |
| P2RXL1 | NM_005446 | BC064805 | ASD: 24% ↑ variant/reference ratio | EXON 1 | 0.013 |
| Cyclic nucleotide gated channels | |||||
| CNGA1 | NM_000087 | CN366905 | NEs: 20% ↓ variant/total ratio | 5' upstream | 0.011 |
| CNGB3 | NM_019098 | AI150392 | ES: 19% ↓ variant/total ratio | EXON 18 | 0.016 |
| Amiloride-sensitive cation channel | |||||
| ACCN2 | NM_020039 | BC028722 | NE: 19% ↓ variant/reference | INTRON 3 | 0.017 |
| NM_020039 | AX683970 | NE: 23% ↓ variant/reference | INTRON 3 | 0.019 | |
| Two pore segment channels | |||||
| TPCN1 | NM_017901 | CQ729206 | ASA: 27% ↑ variant/reference ratio | EXON 10 | <0.001 |
| TPCN2 | NM_139075 | AW178475 | NE: 87% ↑ variant/total ratio | INTRON 9 | <0.001 |
| Mucolipin | |||||
| MCOLN1 | NM_020533 | BQ723075 | ASD: 17% ↓ variant/reference ratio | EXON 2 | <0.001 |
| NM_020533 | CA489568 | ASD: 69% ↑ variant/reference ratio | EXON 7 | 0.011 | |
| Ryanodine receptors | |||||
| RYR3 | NM_001036 | CQ730808 | ES: 28% ↑ variant/total ratio | EXON 84 | 0.017 |
| Miscellaneous other ion channels/interacting proteins | |||||
| C6orf69 | NM_173562 | BC023525 | EsS: 33% ↑ reference/total ratio | EXONS 3-5 | 0.003 |
| KCNIP2 (potassium channel interacting protein) | NM_014591 | NM_173191 | ASA: 37% ↑ variant/reference ratio | EXON 3 | 0.004 |
| NM_014591 | NM_173193 | EsS: 19% ↑ variant/reference ratio | EXONS 2-3 | 0.018 | |
| NM_014591 | NM_173197 | ES: 9% ↓ reference/total ratio | EXON 7 | 0.015 | |
| MLC1 (megalencephalic leuko-encephalopathy with subcortical cysts) | NM_015166 | BX451200 | ASD: 31% ↓ variant/reference ratio | EXON 8 | 0.009 |
| PKD1L2 (polycystic kidney disease 1-like) | NM_052892 | CQ741519 | ES: 82% ↑ variant/reference ratio | EXON 7 | 0.006 |
| PKD2L2 (polycystic kidney disease 2like) | NM_014386 | AF182034 | NEs: 38% ↑ variant/total ratio | INTRON 13/3' downstream | 0.005 |
| SH3KBP1 (SH3KBP1 binding protein) | NM_138392 | BX366064 | ASD: 26% ↓ variant/reference ratio | EXON 10 | 0.002 |
| NM_138392 | AL523485 | ASD: 26% ↑ reference/total ratio | EXON 13 | 0.005 | |
| VGCNL1 (voltage-gated channel) | NM_052867 | BM556576 | NE: 31% ↓ variant/total ratio | INTRON 7 | <0.001 |
| NM_052867 | AK094669 | EsS: 28% ↓ reference/total ratio | INTRON 12 | 0.019 |
*Reference transcript refers to traditionally spliced gene product, while the variant refers to the alternatively spliced mRNA transcript. †Change was quantified using splice array samples (control versus mTLE temporal cortex, n = 10/group). The ratio selected to quantify an event was determined based on best available probe choice (see Materials and methods section). ASA, alternative splice acceptor site; ASD, alternative splice donor site; ES, exon skipped; EsS, exons skipped; IR, intron retention; NE, novel exon; NEs, novel exons; PIED, partial internal exon deletion.
Table 2.
List of alternative splicing events confirmed using rtPCR
| Gene | GenBank accession number (reference transcript*) | GenBank accession number (variant transcript*) | Alternative splicing event: change of mRNA transcript composition in disease state† | Alternatively spliced region | rtPCR p value |
|---|---|---|---|---|---|
| mTLE | |||||
| CACNB1 | NM_000723 | NM_199247 | NE: 65% ↑ variant/reference ratio | INTRON 6 | 0.035 |
| CACNB4 | NM_000726 | AY054985 | NE: 4.2x ↑ variant/reference ratio | INTRON 2 | 0.027 |
| CLCN7 | NM_001287 | AK096963 | IR: 65% ↓ variant/total ratio | INTRON 18 | <0.001 |
| FXYD6 | NM_022003 | BP372334 | NE: 22% ↓ variant/reference ratio | INTRON 1 | <0.001 |
| GRIA1 | NM_000827 | A46050 | NE: 62% ↓ variant/reference ratio | INTRON 14 | 0.002 |
| KCNK1 | NM_002245 | AV733795 | PIED: 13% ↓ variant/total ratio | EXON 2 | <0.001 |
| KCNQ2 | NM_004518 | AY358189 | NE: 34% ↓ variant/total ratio | INTRON 7 | <0.001 |
| MCOLN1 | NM_020533 | CA489568 | ASD: 47% ↑ variant/reference ratio | EXON 7 | <0.001 |
| AD | |||||
| CACNA1G | NM_018896 | NM_198376 | PIED: 67% ↓ variant/total ratio | EXON 36 | <0.001 |
| GABRA6 | NM_000811 | AK090735 | IR: 30% ↓ variant/reference ratio | INTRON 6 | 0.007 |
| GRIA1 | NM_000827 | A46050 | NE: 2.5x ↑ variant/reference ratio | INTRON 14 | 0.001 |
| KCNAB1 | NM_172160 | NM_172159 | NE: 75% ↓ variant/reference ratio | INTRON 1 | 0.004 |
| KCNN1 | NM_002248 | BM718136 | ASD: 25% ↓ variant/reference ratio | EXON 6 | <0.001 |
| KCNN2 | NM_021614 | BG769522 | ES: 85% ↓ variant/reference ratio | EXON 3 | 0.002 |
| MCOLN1 | NM_020533 | CA489568 | ASD: 19% ↑ variant/reference ratio | EXON 7 | 0.016 |
*Reference transcript refers to traditionally spliced gene product, while the variant refers to the alternatively spliced mRNA transcript. †Splice array determined results were confirmed using quantitative rtPCR in a larger sample size (control (n = 28-29) versus mTLE neocortex (n = 43); control (n = 27) versus AD (n = 31) temporal cortex and cerebellum). ASA, alternative splice acceptor site; ASD, alternative splice donor site; ES, exon skipped; EsS, exons skipped; IR, intron retention; NE, novel exon; NEs, novel exons; PIED, partial internal exon deletion.
Our splice array studies revealed an mTLE-associated splicing change in CACNA1B (p = 0.017, variant GenBank: M94173). This particular event was randomly selected for rtPCR confirmation, and we observed a change opposite that detected with the splice array. This likely occurred due to the presence of unknown splicing events that were being detected either by the splice array probes, or possibly by the rtPCR assay probes. Due to the uncertainty linked to this event, we deemed this splicing change in our studies as an event that rtPCR failed to confirm and, therefore, it is not included in Table 1. Given our results in our rtPCR confirmation analyses of array-detected events, we believe this occurs relatively infrequently, but this does bring to light a shortcoming of the splice array technology in accurately detecting complex series of alternative splicing events that occur in a gene region.
Nearly 25% of all genes represented on the splice variant microarray were alternatively spliced in mTLE compared to control. Following normalization of the number of genes found to be alternatively spliced to the total number of genes in the gene class, calcium channels, chloride channels, and glutamate receptors were found to exhibit the most mTLE-associated alternative splicing events, with nearly 30% of genes in these classes found to be alternatively spliced in this disease state.
A representative mTLE-associated alternative splicing event is shown in Figure 1. This selected event in the CLCN7 gene results in the inclusion of an intronic sequence located between exons 17 and 18 (Figure 1a). Both the splice array data and the rtPCR confirmation revealed a net reduction in the variant form containing the intronic sequence in mTLE brain tissue samples (Figure 1b). Furthermore, with reverse transcriptase amplification of the transcript variants in selected brain tissue samples, we show both the presence of the two transcript forms and the effects of the disease state on reducing the variant splice form of CLCN7 (Figure 1c).
Figure 1.
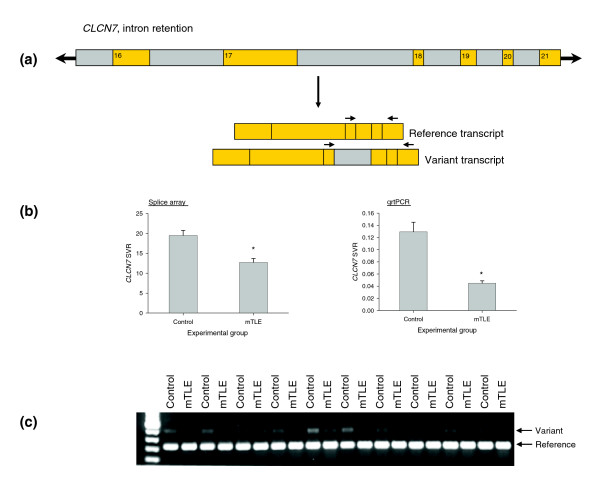
Representative mTLE-associated alternative splicing event identified using splice array technology. (a) Schematic of CLCN7 alternative splicing event associated with mTLE. Exons are shown in orange and intronic regions are shown in gray. (b) Data collected for the CLCN7 alternative splice event in control and mTLE brain tissue samples using the splice array technology (left) and quantitative rtPCR (qrtPCR, right). Data are presented as mean ± standard error of the mean; *p < 0.05 when compared to control, Student's t-test. (c) rtPCR confirmation of the pattern of transcript expression in brain tissue collected from ten subjects from each group. Both reference and variant transcript forms were amplified using the following primer sequences (indicated in the figure by arrows above mRNA transcripts): CLCN7F-GGCAAATACGCCCTGATG, CLCN7R-CTCAGCACGTCCACAATGAC.
Alzheimer's disease
For AD, 1,479 potential splicing events passed the criteria on probe quality for the control 2 versus AD comparison. Using the SVR ratios shown in equation 2 (see Materials and methods), we found that 43 events reached a nominal significance level of 0.05 for comparison between cases and controls (Table 3). Five out of six randomly selected events that exhibited a p value less than 0.05 also were found to be significantly changed when subjected to more quantitative rtPCR analysis in a larger sample size (Table 2). Additionally, four events not identified as statistically significantly changed in the splice array screen (p > 0.05) were confirmed not to be changed using rtPCR.
Table 3.
List of ion channel genes exhibiting alternative splicing in patients with Alzheimer's Disease
| Genes by gene class | GenBank accession number (reference transcript*) | GenBank accession number (variant transcript*) | Alternative splicing event: change of mRNA transcript composition in AD† | Alternatively spliced region | Splice array p value |
|---|---|---|---|---|---|
| Calcium channels | |||||
| CACNA1A | NM_023035 | CQ723237 | ASA: 23% ↓ reference/total ratio | EXON 23 | 0.007 |
| NM_023035 | U79668 | ASD: 36% ↓ variant/reference ratio | EXON 48 | 0.022 | |
| CACNA1C | NM_000719 | CQ722691 | ASD: 19% ↑ reference/total ratio | EXON 27 | 0.033 |
| CACNA1G | NM_018896 | NM_198376 | PIED: 14% ↓ variant/reference ratio | EXON 36 | <0.001 |
| CACNA1I | NM_001003406 | AX068892 | ASD: 29% ↓ variant/total ratio | EXON 16 | 0.049 |
| CACNA2D1 | NM_000722 | BG210356 | NE: 55% ↑ reference/total ratio | INTRON 3 | 0.021 |
| Chloride channels | |||||
| CLCN2 | NM_004366 | BC021578 | ES: 14% ↓ reference/total ratio | EXON 13 | 0.041 |
| NM_004366 | BF002578 | NE: 38% ↓ variant/total ratio | 3' downstream | 0.042 | |
| CLCN6 | NM_001286 | NM_021736 | ES: 15% ↓ reference/total ratio | EXON 12 | 0.022 |
| CLCNKA | NM_004070 | CQ733615 | ASD: 27% ↓ variant/reference | EXON 15 | 0.039 |
| Sodium channels | |||||
| SCN2A2 | NM_021007 | CQ730725 | ES: 16% ↓ variant/total ratio | EXON 11 | 0.023 |
| SCN7A | NM_002976 | BC062699 | ES: 39% ↓ reference/total ratio | EXON 1 | 0.027 |
| SCNN1D | NM_002978 | AX230571 | ASA: 17% ↓ variant/reference ratio | EXON 1 | 0.045 |
| Potassium channels | |||||
| KCNAB1 | NM_172160 | NM_172159 | NE: 21% ↓ variant/reference | INITRON 1 | 0.028 |
| KCNAB2 | NM_003636 | AI933060 | NE: 51% ↓ variant/total ratio | 3' downstream | 0.017 |
| NM_003636 | AI090677 | NEs: 105% ↑ variant/reference ratio | INTRON 7 | 0.039 | |
| NM_003636 | BM925038 | PIED: 65% ↑ variant/reference ratio | EXON 16 | 0.045 | |
| KCNF1 | NM_002236 | AI566537 | PIED: 51% ↑ variant/reference ratio | EXON 1 | 0.045 |
| KCNG1 | NM_172318 | BF569197 | ASD: 23% ↓ variant/reference ratio | EXON 1 | 0.005 |
| NM_172318 | AI968477 | ASD: 28% ↑ reference/total ratio | EXON 1 | 0.031 | |
| KCNH5 | NM_172376 | NM_139318 | ES: 14% ↑ reference/total ratio | EXON 11 | 0.033 |
| KCNMB2 | NM_181361 | NM_005832 | NEs: 25% ↓ variant/total ratio | INTRON 1 | 0.030 |
| KCNN1 | NM_002248 | BX106650 | ASD: 47% ↑ reference/total ratio | EXON 6 | 0.004 |
| NM_002248 | BM718136 | ASD: 39% ↑ reference/total ratio | EXON 6 | 0.015 | |
| KCNQ2 | NM_004518 | NM_172107 | NE: 70% ↑ variant/reference ratio | INTRON 10 | 0.038 |
| NM_004518 | BG772772 | NEs: 55% ↑ variant/reference ratio | EXONS 7-9 | 0.016 | |
| KCNQ3 | NM_004519 | CQ725469 | PIED: 47% ↓ reference/total ratio | EXON 15 | 0.036 |
| GABA receptors | |||||
| GABRA3 | NM_000808 | AX897950 | ES: 48% ↑ reference/total ratio | EXON 7 | 0.037 |
| GABRA5 | NM_000810 | AL035782 | EsS: 65% ↑ variant/reference ratio | EXONS 2/3 | 0.030 |
| GABRA6 | NM_000811 | AK090735 | IR: 72% ↓ variant/total ratio | INTRON 6 | 0.037 |
| Ionotropic glutamate receptors | |||||
| GRIK2 | NM_021956 | CQ715784 | ASD: 57% ↓ reference/total ratio | EXON 10 | 0.007 |
| GRIK4 | NM_014619 | CQ734018 | NEs: 35% ↓ variant/total ratio | INTRON 1 | 0.006 |
| GRIK5 | NM_002088 | AJ249209 | NE: 52% ↑ variant/reference ratio | INTRON 18 | 0.037 |
| Transient receptor potential cation channels | |||||
| TRPM7 | NM_017672 | CQ728707 | ES: 6% ↓ reference/total ratio | EXON 4 | 0.048 |
| FXYD domain ion transport regulators | |||||
| FXYD5 | NM_014164 | BU164524 | NE: 36% ↓ variant/reference ratio | INTRON 1 | 0.030 |
| Inositol triphosphate receptors | |||||
| ITPR1 | NM_002222 | CQ719499 | ES: 15% ↓ reference/total ratio | EXON 23 | 0.030 |
| Two pore segment channels | |||||
| TPCN1 | NM_017901 | BG899733 | NE: 49% ↑ variant/reference ratio | INTRON 1 | 0.016 |
| Mucolipin | |||||
| MCOLN1 | NM_020533 | CA489568 | ASD: 95% ↑ variant/reference ratio | EXON 7 | 0.026 |
| NM_020533 | AJ293659 | IR: 33% ↑ variant/total ratio | INTRON 5 | 0.032 | |
| Ryanodine receptors | |||||
| RYR1 | NM_000540 | CQ717972 | PIED: 30% ↑ reference/total ratio | EXON 91 | 0.011 |
| NM_000540 | CQ730824 | ES: 35% ↑ variant/reference ratio | EXON 35 | 0.042 | |
| Miscellaneous other ion channels/interacting proteins | |||||
| TM4SF11 (plasmolipin) | NM_015993 | R16034 | NE: 21% ↑ variant/reference ratio | INTRON 1 | 0.016 |
| GMRP-1 (potassium channel tetramerization protein) | NM_032320 | BG722430 | NE: 26% ↑ variant/reference ratio | INTRON 1 | 0.031 |
*Reference transcript refers to traditionally splicing gene product, while the variant refers to the alternatively spliced mRNA transcript. †Change was quantified using splice array samples (control versus AD temporal cortex, n = 10/group). The ratio selected to quantify event was determined based on best available probe choice (see Materials and methods section). ASA, alternative splice acceptor site; ASD, alternative splice donor site; ES, exon skipped; EsS, exons skipped; IR, intron retention; NE, novel exon; NEs, novel exons; PIED, partial internal exon deletion.
The splice array screen revealed 12% of ion channel genes in these experiments to be alternatively spliced in AD, with greater than 20% of genes comprising the calcium channel, chloride channel, sodium channel, and glutamate receptor gene class exhibiting AD-associated alternative transcript splicing. When compared to mTLE, there are fewer alternative splicing events in AD. Several explanations could account for this, with the simplest being that there are more alternative splicing events in mTLE compared to AD. On the other hand, the larger number of alternative splicing events in mTLE also could be explained by tissue differences between freshly resected and postmortem tissue. However, if this were the case and transcript degradation in the time prior to brain tissue collection were contributing to some of the observed splicing changes, we would expect to see a correlation between the splice variant proportions and time of brain tissue collection. This was not observed for any of the SVRs for splicing events identified in this study (data not shown). Another possible explanation might be that, in the AD cases, normalization of changes in the temporal cortex to those in the cerebellum reduces the baseline human-to-human variability in splicing proportions, thereby reducing the number of falsely identified events. While theoretically this could be the reason for the difference in the number of splicing events identified in mTLE and AD, caution should be used in accepting this interpretation. The comparison between AD and control is performed after two normalization steps, with the first being a probe normalization, followed by a brain region normalization. This results in an additional normalization step compared to the mTLE samples and, while reducing the subject-to-subject variability, the interassay variability is increased due to the compounding variability added with each ratio taken. It is possible that the extra normalization step results in more missed events due to an increase in variability. In fact, the GRIA1 (ionotropic (AMPA) glutamate receptor) gene was identified as a potential splice variant associated with AD in a preliminary study using the splice array technology (in n = 4 samples). In rtPCR this event was confirmed (Table 2) in a larger sample size. However, when additional samples were studied by splice array analysis, this event was no longer detected as being changed in the complete sample set (n = 10) employed in this arm of the study. This also occurred for the alternative splicing event of the KCCN2 gene in AD. This strongly suggests that our list of events is a minimum estimate of the ion channel splice events that are associated with AD. However, in order to minimize the number of false positives we report due to human-to-human variability (in most cases considered to be greater than interassay variability), we applied a conservative data analysis approach given the tissue samples available to us for these studies.
A representative AD-associated alternative splicing event is shown in Figure 2. This selected event in the GABRA6 gene results in the inclusion of an intronic sequence located between exons 6 and 7 (Figure 2a). Both the splice array data and the rtPCR confirmation revealed a reduction in the variant form containing the intronic sequence in AD brain tissue samples (Figure 2b). In the splice array evaluation of this event, a statistically significant reduction was observed in temporal cortex from AD subjects compared to controls, while no such change was seen in the cerebellar samples. Quantitative rtPCR revealed, however, a statistically significant AD-associated reduction in the variant form in both the temporal cortex and cerebellum, with a much larger change detected in the temporal cortex. Given the enhanced sensitivity of rtPCR, this difference is not unexpected and likely results from rtPCR picking up on a more subtle change in the cerebellum. Reverse transcriptase amplification of the transcript variants in selected brain tissue samples reveals the effects of the disease state on reducing the variant splice form of GABRA6, with a greater magnitude of change in the transcripts containing the intronic region detected in the disease-affected brain tissue structure (temporal cortex, Figure 2c).
Figure 2.
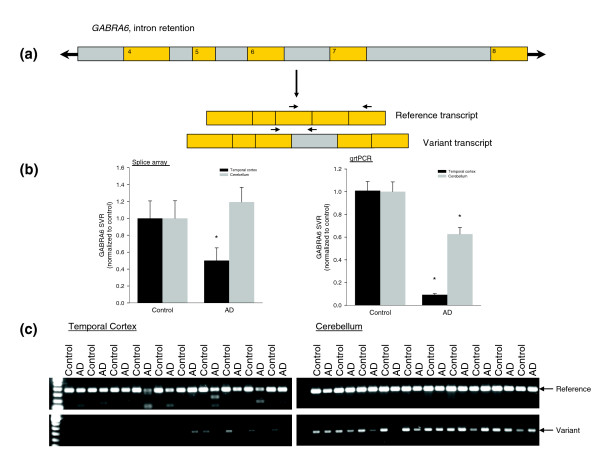
Representative AD-associated alternative splicing event identified using splice array technology. (a) Schematic of GABRA6 alternative splicing event associated with mTLE. Exons are shown in orange and intronic regions are shown in gray. (b) Data collected for the GABRA6 alternative splice event in control and AD brain tissue (TC and CB) samples using the splice array technology (left) and quantitative rtPCR (qrtPCR, right). Data are presented as mean ± standard error of the mean; *p < 0.05 when compared to control, Student's t-test. (c) rtPCR confirmation of the pattern of transcript expression in brain tissue collected from ten subjects from each group. Reference and variant transcript forms were amplified using the following primer sequences (indicated in the figure by arrows above mRNA transcripts): reference GABRA6F-AAGAATCTTCAAGCCTTCTCCA, GABRA6R-TGACAGCTGCGAACTCGATA, variant GABRA6F-AAGAATCTTCAAGCCTTCTCCA, GABRA6F-TCCAAGATTACACAAATCTTTATATGC.
Discussion
Bioinformatic investigations have permitted the comprehensive compilation of expressed sequence tag (EST) and cDNA databases that identify potential sites of alternative splicing in human genes. The technological capability now exists to discover the extent to which splicing changes are present in human disease. Using mTLE and AD as prototypical neurological diseases, we specifically sought to identify alternative splice variants of ion channel genes in human brain tissue samples to address the following goals: to compile a list of ion channel genes in mTLE and AD that undergo alternative splicing; and to validate the use of new technology in the evaluation of ion channel splice variation for a large set of genes in a high-throughput manner. Based on these results, we propose a strategy for selection of the most clinically relevant splicing changes to be pursued in further functional and mechanistic studies.
Disease-associated alternative ion channel splicing
Alternative splicing of ion channels in mTLE
The splice array technology identified widespread alternative splicing changes associated with mTLE. Importantly, the well-characterized mTLE-associated flip-flop alternative splicing events of the ionotropic glutamate receptor (splicing change conserved across all neuronally expressed GRIA genes) were detected in both GRIA1 and GRIA2 genes in these experiments (Table 1). Our results are in agreement with the previously published finding of an upregulation of the flip splice form in mTLE [19,20].
We also have demonstrated splicing changes in many genes with known associations to human epilepsies. Specifically, we have identified two mTLE-associated splicing events (Table 1) in the KCNQ2 gene, which encodes a voltage-gated potassium channel. This gene is of particular interest in epilepsy as several mutations in it have been associated with benign familial neonatal convulsions [11,21-26]. Furthermore, many of the mutations have been located in splice sites surrounding exons [23,24,26], possibly implicating them in alternative splicing events identified herein. Several other genes that we have identified as undergoing mTLE-linked alternative splicing events also have been associated with other, non-mTLE forms of human epilepsy, including CACNA1A, CACNA1H, CLCN2, and GABRG2 [27-30], indicating that these also may be of particular interest in the epilepsy field.
We emphasize that in screening for alternative splicing events associated with mTLE, we employed neocortical brain tissue. While the hippocampus is generally felt to be the disease focus in this form of epilepsy, the hippocampus is also the site of greatest tissue damage. The intent of this work was to investigate a high-throughput method of splice variant identification. Therefore, to reduce potential confounding issues of significant non-uniform neuronal loss and/or altered cellular composition, we pursued changes in the temporal neocortex, adjacent to the diseased hippocampus, rather than in the hippocampus itself. We believe that this approach minimizes the number of artifactual splicing changes. Now that a list of potential TLE-linked splicing changes has been identified, additional work is needed to evaluate the extent of these changes in the hippocampus. To do this it will be necessary to use laser capture microdissection to separate intact neurons in the hippocampus to assess splice variation in homogeneous cell populations in this brain structure. Events that occur more extensively in the hippocampus compared to the neocortical tissue may indicate a more direct role in disease pathology.
Alternative splicing of ion channels in AD
AD also revealed extensive alternative ion channel splicing. No information has been reported to date regarding alternative splicing of ion channel genes associated with AD, although several ion channels that we have identified as undergoing alternative splicing have been implicated in AD. Specifically, our data show a splicing change in GRIA1 in AD (Table 3). GRIA1 encodes an ionotropic (AMPA) glutamate receptor, one of a class of genes that have been extensively linked to cognition and memory [31]. A downregulation of GRIA1 expression has been observed in diseased brain regions collected from subjects with AD [14,17,18]. Furthermore, mice deficient in GluR-A (encoded by gria1) have been shown to have deficits in long-term potentiation and reductions in spatial working memory tasks [32-34]. Therefore, alternative splicing of the GRIA1 gene may have a pathophysiological role in AD. Based on previous literature, the splicing change identified in ITPR1 (Table 3) may also play an important role in AD. Presenilin, a transmembrane protein localized to endoplasmic reticulum, is required for the proteolysis of amyloid precursor protein. Evidence suggests that mutations in the presenilin gene causing early onset AD [35] may result in alterations in inositol-triphosphate signaling (via ITPR receptors) to increase intracellular calcium [36]. In addition to alternative splicing in ITPR1, our data also show several alternative splicing events in calcium channel genes that also may factor into the pathway of intracellular calcium dysregulation commonly associated with AD [15].
Validation of disease-associated alternative splicing
The splice array technology has proven valuable for comprehensively identifying splice variation across a large set of genes. The accuracy of the splice array technology is evident by the reproducibility of the results using more quantitative rtPCR. While events could have been missed using our data analysis strategy, the reported list likely reflects few false positive results given the follow-up rtPCR success rate and the reproducibility in a relatively large sample size. Collectively evaluating all of our rtPCR confirmation studies, we estimate that >80% of all array-identified splicing changes (Tables 1 and 3) are real events.
All splicing events identified in this work exhibit only small magnitude changes, with the maximum exceeding just over a 2.5-fold change. Despite the relatively low magnitude of changes, if these transcripts encode proteins with altered function then the biological consequences could be substantial. The fact that previously identified splicing changes in the GRIA genes, which have been well-established in the literature to be involved in both human epilepsy and animal models [19,20,37-40], were observed in mTLE brain tissue at only a 30% increase suggests that these low level splicing changes could be real and biologically important alternative splicing events.
To provide further validation of the accuracy of the technology in identifying true alternative splicing differences in the experimental groups, we employed principal component and k-means clustering analyses to collectively evaluate patterns of splicing changes in the brain tissue samples. Regression analysis of the first two principal components (PCs; Figure 3) indicates that the largest sources of variability are accounted for by brain structures (temporal cortex or cerebellum) and by disease state. Across PC1 and PC2 combined, 37% of variation is explained by membership of the epilepsy (mTLE NC) group. Outside of epilepsy samples, 30% is explained by differences in brain tissue type, and an additional 11% is explained by differences between AD and control samples (combining main and interaction effects with tissue type). We note that while the majority of the control temporal cortex (Control TC) samples cluster together, these samples have several outliers from the dominant cluster (blue cluster, Figure 3). This is likely due to the lack of homogeneity of these patients with regard to disease states, past medical history, and current medications at the time of death. In fact, with regard to the medical history of the controls, all that is known is that they did not have epilepsy and had minimal cognitive dysfunction. Despite the lack of precise grouping in the controls, the mTLE and AD subjects cluster together well and, in both conditions, the groups do diverge from the dominant control subject cluster. Importantly, the clustering analyses place the control, AD, and mTLE temporal cortex results predominantly in unique groups, while the control and AD cerebellar samples are largely grouped together (Figure 3a). Given that the cerebellum in AD patients is considered a largely unaffected brain structure, the overlap of control and AD cerebellum results is not unexpected and validates the use of this structure as an internal control for improving the ability to detect disease related changes in the temporal cortex. Furthermore, for AD it was possible to distinguish the contribution of disease state in both the temporal cortex (affected in AD) and cerebellum (largely unaffected in AD) using linear regression modeling.
Figure 3.
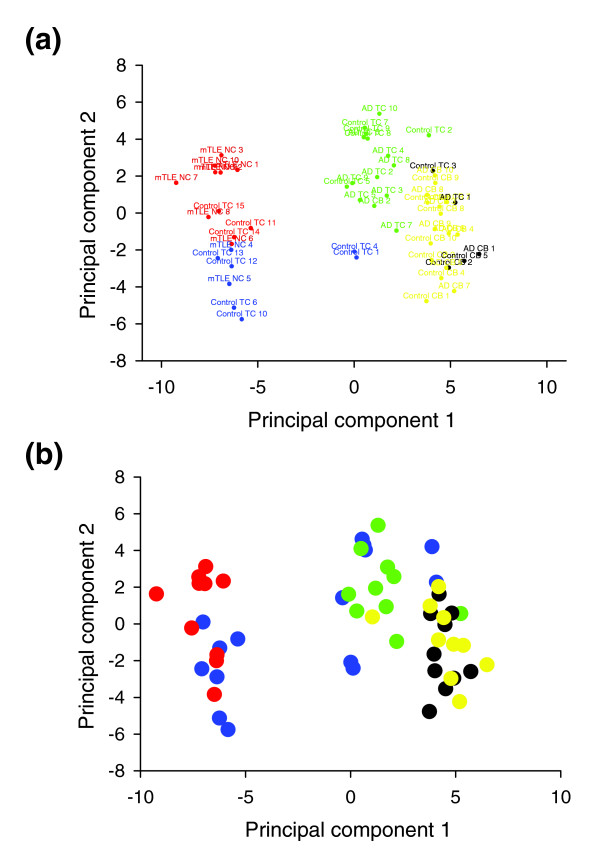
Principal component analysis of ion channel splice variant expression patterns for all experimental groups. (a) Colors separate groups based on statistical clustering (k-means clustering) of individuals with similar patterns of ion channel splicing. (b) Colors separate groups based on disease state and brain structure: control TC (blue), mTLE NC (red), AD TC (green), control CB (black), AD CB (yellow). The first principal component explains 43% of the variation in log expression ratios, while the second principal component accounts for 13% of the variation. Separation of clusters along principal components 1 and 2 is, to a large extent, governed by brain structure and disease state.
Using this approach, we determined that, in the temporal cortex, 20% of the variability accounted for by PC1 and PC2 is attributed to disease state, whereas in the cerebellum only 0.4% of the variability could be accounted for by AD-status. Taken together, these analyses provide strong validation for the accuracy of the splice array in detecting real alternative splicing changes in the disease states.
Effects of altered cellular composition in disease states
Both mTLE and AD are diseases that result in neurodegeneration in patients to varying degrees between affected individuals and between brain regions. A concern arises that the alternative splicing changes we are observing in this work are due to alteration in cellular composition. To address this issue, we undertook immunoblot analysis to assess neuronal and glial cell numbers. Immunoblot results were obtained for control (n = 24), mTLE (n = 22), and AD (n = 31) temporal cortex. Samples that did not have adequate protein amount to evaluate their NeuN (neuronal nuclei, neuronal marker) and GFAP (glial fibrillary acidic protein, glial cell marker) amounts accurately were excluded from the analysis. Despite the ability to detect group-specific changes in cellular populations (Additional data figure 1 in Additional data file 2), neither the splice array-determined splice proportions, nor data collected using rtPCR, showed any statistically significant correlation to the NeuN or GFAP protein content. A representative graph showing this lack of correlation is given in Additional data figure 2 (in Additional data file 2) for MCOLN1 SVR in control, mTLE, and AD temporal cortical tissue. All other events demonstrated a similar lack of correlation between SVRs and NeuN or GFAP protein concentration. Although immunoblotting might not be quantitative enough to detect slight changes in cellular composition that likely are occurring in these brain tissue samples, given that we were able to detect quantitative differences between experimental groups (Additional data figure 1 in Additional data file 2) consistent with neurodegeneration (Additional data file 1), we believe that alterations in cellular composition are not the major cause of the observed disease-associated splicing changes.
Functional consequences of alternative splicing
Splice variants with known function
We cannot determine if particular splice variant transcripts identified in this work are translated into proteins with altered function, if translation does not occur for a splice variant, or if a resulting protein is immediately degraded because of dysfunctional activity. Theoretically, more drastic changes could result from a translated protein with altered function, otherwise alteration would simply be a low level expression change. Few splicing events detected by the splice array have information about the presence of an associated protein and even fewer have functional data available for the proteins translated from the splice variant transcripts. Of all events identified in our work, only CACNB4 (GenBank: AY054985; Tables 1 and 2) and the previously reported GRIA gene splicing changes (flip-flop), identified to be present in increased quantities in mTLE patients, have data regarding the functional consequences of the splice variant [37,41].
CACNB4 encodes the β subunit of calcium channels and modulates the activity of the pore-forming α subunits [42]. The function of the protein produced from the splice variant compared to the normal transcript was studied in Xenopus oocytes in the presence of α subunits. The protein encoded by the splice variant inactivated at a faster rate and the voltage dependence of the α/β complex was shifted to more depolarized potentials in the presence of the splice variant of CACNB4 [41]. Thus, in the presence of this splice variant, the neuron may be more likely to depolarize with a smaller stimulus. The GRIA gene splice variants also have been shown to exhibit electrophysiological properties consistent with enhanced cellular excitability [37]. While the direct biological consequences of the CACNB4 and GRIA gene splicing changes in patients with mTLE cannot be concluded from this work, the observation of expressed proteins with altered function is important and warrants follow-up investigations to decipher how the changes may contribute to mTLE. Specifically, for both CACNB4 and GRIA splicing changes, it would be interesting to evaluate the relationship between SVRs and seizure frequency/severity in animal models of epilepsy to assess in vivo the consequences of the alterations.
Elucidating functional consequences of splice variants with unknown function
This work has, for the first time, established specific disease-associated alternative splicing events across a broad category of genes in two neurological diseases. With the generation of these lists of disease-associated ion channel alternative splicing events comes the task of deciphering the functional consequences of these changes and how they may contribute to the diseases. There are too many splicing changes associated with mTLE and AD to pursue comprehensive functional evaluation to determine the biological impact of all proteins expressed from alternatively spliced mRNA transcripts. A strategy is clearly needed for selection of events for functional evaluations.
One approach to identify the most clinically significant alternative splicing events is to evaluate the compiled lists for mTLE (Table 1) and AD (Table 3) for splicing events that are genetically controlled. Specifically, we propose evaluating splice donor and acceptor regions for single nucleotide polymorphisms that may be responsible for alterations in SVRs and to evaluate correlations between SVRs and genotypes. We can then evaluate a large population of affected individuals for the presence of the polymorphism and certain clinical phenotypes, such as measures of disease severity or responsiveness to medications. In doing this, we would be able to indirectly associate the splicing event with key clinical outcomes. This approach would focus mechanistic investigation upon only the most disease-relevant changes. Furthermore, in knowing that a splicing change contributes to a specific clinical endpoint, functional investigations can be designed to evaluate specific and relevant mechanistic hypotheses. This approach is exemplified by an SCN1A polymorphism located in the 5' consensus site region following the neonatal form of exon 5 that has been found to be a genetically controlled key alternative splicing event [43]. This polymorphism has been associated with altered doses of certain antiepileptic drugs in two independent populations [6,44]. These findings have led to the hypothesis that the pharmacology of these antiepileptic drugs may be altered in the presence of decreased expression of the splice variant, and have guided follow-up mechanistic work into how this might be occurring. While many of the identified splicing changes reported herein are not genetically controlled, it is not unreasonable to expect that a proportion of them are. In cases where it is possible, establishing genetic control of alternative splicing will serve as a valuable platform for beginning to decipher their disease significance.
Conclusion
Based on the few known examples of disease-associated splicing events, the impact of elucidating the contribution of alternative transcript forms in human disease likely will be substantial. EST and cDNA libraries provide valuable information about potential alternative splice forms on a genome-wide scale. It is not currently feasible to determine in a high throughput manner which of these numerous events result in a change in system biology. One possible direction is to concentrate on the functional significance of variant transcripts associated with human disease. We undertook such a task by evaluating brain tissue from mTLE and AD for disease-associated alternative splice variants using a splice variant microarray, the first reported example of employing such an approach in neurological disease. Collectively, our results demonstrate that two common and important neurological conditions are associated with widespread alterations in splicing patterns of ion channel genes. While additional experimentation is needed to establish the consequences of these alternative splicing events in the diseases, these lists provide a valuable foundation for elucidating which of these events translate into clinically significant changes.
Materials and methods
Brain tissue samples
This study was approved by the Joint Research Ethics Committee of the Institute of Neurology and the National Hospital for Neurology and Neurosurgery, and the Duke University Institutional Review Board.
Freshly resected brain tissue from patients with mTLE was used to identify key splicing changes associated with this type of epilepsy. All these patients gave written informed consent for use of the resected brain tissue for research. Temporal neocortical tissue samples (n = 43) were obtained from material resected from patients undergoing therapeutic surgery for drug-resistant mTLE according to routine clinical protocols at the National Hospital for Neurology and Neurosurgery (London, UK). All tissue used for research was surplus to diagnostic requirements. Patients were between the ages of 18 and 60 years and the group consisted of 15 males and 28 females. All had a diagnosis of hippocampal sclerosis confirmed histologically. The hippocampal tissue was excluded from analysis due to potential confounding issues of extensive, non-uniform, neuronal loss.
Nonepileptic/nondemented autopsy control and AD temporal cortical and cerebellar tissue was obtained through the Kathleen Price Bryan Alzheimer's Disease Brain Bank at Duke University. Subjects were enrolled prospectively and followed until death as previously described [45]. Temporal cortex samples were tested as this area is highly affected by AD, while the cerebellum has minimal AD pathology, and was, therefore, used as an internal control. Control subjects (n = 31) were between the ages of 56 and 90 years (mean 85.5 years) and consisted of 14 males and 17 females. AD patients (n = 32) were between the ages of 79 and 90 years (mean 83.5 years) and consisted of 8 males and 24 females. All AD subjects had AD pathology greater than Braak stage IV. All brain tissue was collected postmortem with the time to collection ranging from 1-30 h (mean 9.5 h) and 0.5-18.5 h (mean 8 h) for control and AD, respectively. Autopsy control samples were used as the control group for both epilepsy and AD. All brain tissue was flash frozen in liquid nitrogen and stored at -80°C until use.
Splice array
Ion channel splice arrays were purchased through ExonHit Therapeutics (Gaithersburg, MD, USA). All known and postulated alternative splicing events involving ion channel genes and their major associated interacting proteins were included on the array (1,665 events in total). Each alternatively spliced transcript defined a splicing event. The reference transcript was chosen for each gene by the company as one of the most commonly accepted mRNA transcript forms. The splice variant for a particular event is referred to as the variant transcript. In all cases where a splicing event was identified to be altered in epilepsy or AD, the GenBank accession numbers for both transcript forms and the affected exons are provided in Tables 1 and 3 to define the specific exon structure for the gene undergoing alternative splicing.
For each splicing event analyzed on the splice array, three to six probes were used to quantify the event. The number of probes selected for an event depended on the nature of the splicing event and the ability to design an adequate probe for the desired sequence (more detail about probe design is given in Fehlbaum et al. [8]). Specifically, the complete probe sets consisted of an A3 probe to monitor total transcript expression at the 3' end, an A5 probe for assessing total transcript expression at the 5' end, a B probe designed to bind to a purely exonic region specific to the reference or the variant (which transcript depends on the event), a C and D probe to screen for exon-exon junctions surrounding an exon unique to the reference or the variant, and an E probe to assess a unique exon-exon boundary in the transcript form not being screened for by the B probe.
RNA extraction and splice array data collection
Brain tissue was ground in liquid nitrogen (mortar and pestle). Tissue powder was separated into a 20-30 mg fraction for RNA extraction and a 5-10 mg sample for protein extraction. Total RNA was extracted from brain tissue using the RNeasy Lipid Tissue Purification Kit (Qiagen, Valencia, CA, USA) according to the manufacturer's instructions. The resulting RNA was quantified spectrophotometrically. RNA was extracted from all subjects comprising the experimental groups (n = 43 for mTLE, n = 29 for control temporal cortex (mTLE), n = 32 AD temporal cortex, and n = 31 control (AD)). RNA from a subset of ten subjects from each group was selected for splice array analysis.
Samples were selected for splice array analysis to provide for the closest possible age and gender comparisons. To do this effectively for each disease to control comparison, five of the ten control samples overlapped for the AD and epilepsy evaluations. Coded aliquots of extracted total RNA from the selected subjects were sent to ExonHit Therapeutics for Ion Channel splice array analysis. Prior to dye-labeling and hybridization, the RNA quality was assessed on an Agilent Bioanalyzer (Palo Alto, CA, USA).
For the epilepsy splice variation scan, a set of ten samples per group (controls and epilepsy samples) were submitted for the comparison between mTLE neocortex and control temporal cortex (control temporal cortex 1). A mTLE neocortex and a control temporal cortex 1 sample were labeled with cy3 and cy5 fluorescent dyes and hybridized to the splice array chip simultaneously (two samples labeled with different dyes per array). A total of ten splice arrays were used for the disease to control comparison. The effects of potential dye bias were minimized by labeling five of the ten samples comprising a group with opposite dyes.
For the AD splice variation scan, splice array data were generated for a set of ten samples per group (AD temporal cortex, control temporal cortex 2, cerebellum AD, and cerebellum control 2). In all cases, matched temporal cortical and cerebellar tissue samples were obtained from each subject. An AD and control sample were run together on a single chip in an identical manner as described for the mTLE samples. The same control versus AD comparison also was made for the cerebellar samples. A total of 20 arrays were used for the analysis, with 10 arrays used for temporal cortex comparisons and 10 arrays used for cerebellar analyses.
All splice array data files are available through the Gene Expression Omnibus (series accession numbers: mTLE neocortex (GSE6773), control temporal cortex 1 (GSE6771), AD temporal cortex (GSE6775), control temporal cortex 2 (GSE6774), cerebellum AD (GSE6777), and cerebellum control 2 (GSE6778)).
Splice array data analysis
In some cases, probes included on the splice array do not hybridize to the RNA in the experimental sample either due to a lack of the targeted sequence in the sample or because of a failure of the probe to bind in a sample type. To address this issue, probe hybridization fluorescence output values were excluded for a particular splicing event if values were <200, as this approaches the limit of detection of this technology. A single probe hybridization value of <200 in a group resulted in the complete elimination of that probe from the quantification of that splice variant for that control versus disease comparison. Probe sets were eliminated across the entire disease-control comparison only if they failed to hybridize in a particular brain structure regardless of disease state, and not if they failed solely in the control or diseased brain tissue structure, as the latter could be caused by a disease-altered splicing change.
Ratios of probe hybridization fluorescence outputs were used to quantify the relative number of alternatively spliced transcripts, and to control for any alterations in overall gene expression. Selection of the best possible ratio for an event was based on the following ratio priority: E/B > B/A3 = B/A5 > E/A3 = E/A5 > E/C = E/D. This priority system was largely based on the rationale that the most sensitive measure of an alternative splicing event will be to directly quantify variant to reference ratios. This is particularly the case when the changes in the reference and variant transcripts occur in concert (that is, a reduction in reference occurs simultaneously with an increase in variant). However, junction probes generally are shorter in length and, therefore, emit a less reliable fluorescence output. Thus, for this study we accepted the less reliable junction probe when it was normalized to a more reliable nonjunction probe (E/B), but deemed the dual junction probe ratio (E/C or E/D) to be of lower priority. The A3 and A5 probes are longer probes that often span several exons and, therefore, provide reliable hybridization fluorescence outputs. However, in a gene where there are several alternative splicing events, normalizing to one of the probes screening for total transcript expression (A3 or A5) may actually be quantifying more than one splicing event. Therefore, the strategy of normalizing to total transcript expression was placed as lower priority to the more specific variant/reference (E/B) normalization ratio. In addition to this priority system, it also was necessary to select a ratio that was available in all groups for most accurate comparison. For example, when comparing AD to control, the E/B ratio would be selected only if it were available in the AD and control temporal cortex and cerebellum samples. If the E/B ratio was not available for any of the groups (due to one of the probes being below the limit of detection in a group), then the next highest priority ratio was selected. The selected ratio was defined as the SVR for a particular variant.
Using this selection procedure, SVRs were defined for all of the splice variants for both the mTLE and AD comparisons. For AD, following selection of a common SVR across all four groups, an additional ratio was taken normalizing the temporal cortex ratio to the cerebellum ratio (TC/CB) for each individual. A Student's t-test was then used to identify particular splicing events with a statistically significant change in epilepsy and AD using the following comparisons:
mTLE: SVRTC, control2 vs. SVRNC, mTLE (equation 1)
Lists were made of the events that had a statistically significant alteration (p < 0.05). Of these, several were selected for quantitative real time PCR follow-up evaluations to test the accuracy of the splice array findings. As negative controls, a total of four events that were not found to be significantly changed in mTLE or AD were also selected for follow-up rtPCR confirmation. rtPCR follow-up was carried out in a larger sample set, also including all of the original samples.
All splice array data analysis was performed in Microsoft Excel. All data inputs and calculations were verified by two individuals. Final compiled sheets were checked by manual calculation of randomly selected splicing events.
Due to the differences in time of brain tissue collection in the AD experiments, linear regression analyses were performed comparing the proportion of alternative transcripts versus the time of postmortem brain tissue collection in control and AD brain tissue. For events identified in epilepsy, correlations were assessed only in control tissue, as all the mTLE neocortical tissue was freshly collected.
Real time PCR
To confirm splicing events identified in the splice array, and to estimate the magnitude of the effect in a larger set of samples, rtPCR was employed. RNA from all subjects comprising the groups (including the ten sent for splice array analysis) was used in the rtPCR analyses. A total RNA sample from all subjects was reverse transcribed into cDNA using a High Capacity cDNA Synthesis Kit (Applied Biosystems, Foster City, CA, USA) according to product instructions. Taqman® assays and custom-designed primer/probe sets that were used in rtPCR studies to confirm the presence of the splice variants are given in Additional data file 1. All rtPCR assays were purchased through Applied Biosystems and run per the manufacturer's protocol using 10-20 ng of total RNA (converted to cDNA) per reaction.
Standard curves were run for a range of total RNA (converted to cDNA, 9 standards ranging from 0.01-100 ng). Number of cycles to reach a threshold fluorescence reading (CT) was plotted against log RNA amount and a line was fitted to the data points using linear regression. The following equation was used to quantify the number of transcripts present in an experimental sample:
Where, CT, sample is the number of cycles to reach the fluorescence threshold for a given sample, and y0 and α are, respectively, the intercept and slope of the line defining the relationship of CT versus log(RNA amount) determined from the standard curve [46]. Using this approach, differences in amplification efficiency are accounted for, thereby permitting relative quantification between the two transcript forms. Relative proportions of splice variants were quantified by dividing the number of transcripts in the variant form to the number of transcripts in the reference form. Occasionally, it was necessary to normalize to total expression of the two transcripts forms (by probing for transcript region common to both) due to assay development restrictions.
Principal components analyses
Principal component analyses on covariances between log-transformed SVRs within individuals were used to identify the most significant sources of variability between brain tissue samples collected from diseased and nondiseased patients. K-means clustering was performed to group individuals with similar alternative splicing profiles. Linear regression models were fitted to the data points defining AD and control samples along the most important principal component axes to determine the contribution of disease state in both disease-affected and unaffected brain structures. Principal component analyses were performed using JMP software (version 5.1.2, Cary, NC, USA). Linear regression analyses were performed using SPSS software (version 13, Chicago, IL, USA).
Additional data files
The following additional data are available with the online version of this paper. Additional data file 1 contains Taqman® assays and custom-designed primer/probe sequences that were used in rtPCR studies to confirm the presence of the splice variants. Additional data file 2 contains additional methods, discussion and figures regarding the assessment of cellular composition of the brain tissue samples used in these studies.
Supplementary Material
Taqman® assays and custom-designed primer/probe sequences used in rtPCR studies to confirm the presence of the splice variants.
Additional methods, discussion and figures regarding the assessment of cellular composition of the brain tissue samples used in these studies.
Contributor Information
Erin L Heinzen, Email: e.heinzen@duke.edu.
Woohyun Yoon, Email: yoon0001@mc.duke.edu.
Michael E Weale, Email: mweale@duke.edu.
Arjune Sen, Email: a.sen@ion.ucl.ac.uk.
Nicholas W Wood, Email: n.wood@ion.ucl.ac.uk.
James R Burke, Email: james.burke@duke.edu.
Kathleen A Welsh-Bohmer, Email: kwe@duke.edu.
Christine M Hulette, Email: hulet001@mc.duke.edu.
Sanjay M Sisodiya, Email: s.sisodiya@ion.ucl.ac.uk.
David B Goldstein, Email: d.goldstein@duke.edu.
Acknowledgements
This work was supported by laboratory start up funds and MRC UK grants G69520 (SMS, DBG) and G84/6168 (AS).
References
- Syken J, De-Medina T, Munger K. TID1, a human homolog of the Drosophila tumor suppressor l(2)tid, encodes two mitochondrial modulators of apoptosis with opposing functions. Proc Natl Acad Sci USA. 1999;96:8499–8504. doi: 10.1073/pnas.96.15.8499. [DOI] [PMC free article] [PubMed] [Google Scholar]
- Cartegni L, Krainer AR. Disruption of an SF2/ASF-dependent exonic splicing enhancer in SMN2 causes spinal muscular atrophy in the absence of SMN1. Nat Genet. 2002;30:377–384. doi: 10.1038/ng854. [DOI] [PubMed] [Google Scholar]
- Hutton M, Lendon CL, Rizzu P, Baker M, Froelich S, Houlden H, Pickering-Brown S, Chakraverty S, Isaacs A, Grover A. et al. Association of missense and 5'-splice-site mutations in tau with the inherited dementia FTDP-17. Nature. 1998;393:702–705. doi: 10.1038/31508. [DOI] [PubMed] [Google Scholar]
- Glatz DC, Rujescu D, Tang Y, Berendt FJ, Hartmann AM, Faltraco F, Rosenberg C, Hulette C, Jellinger K, Hampel H. et al. The alternative splicing of tau exon 10 and its regulatory proteins CLK2 and TRA2-BETA1 changes in sporadic Alzheimer's disease. J Neurochem. 2006;96:635–644. doi: 10.1111/j.1471-4159.2005.03552.x. [DOI] [PubMed] [Google Scholar]
- Faustino NA, Cooper TA. Pre-mRNA splicing and human disease. Genes Dev. 2003;17:419–437. doi: 10.1101/gad.1048803. [DOI] [PubMed] [Google Scholar]
- Tate SK, Depondt C, Sisodiya SM, Cavalleri GL, Schorge S, Soranzo N, Thom M, Sen A, Shorvon SD, Sander JW. et al. Genetic predictors of the maximum doses patients receive during clinical use of the anti-epileptic drugs carbamazepine and phenytoin. Proc Natl Acad Sci USA. 2005;102:5507–5512. doi: 10.1073/pnas.0407346102. [DOI] [PMC free article] [PubMed] [Google Scholar]
- Clark TA, Sugnet CW, Ares M Jr. Genomewide analysis of mRNA processing in yeast using splicing-specific microarrays. Science. 2002;296:907–910. doi: 10.1126/science.1069415. [DOI] [PubMed] [Google Scholar]
- Fehlbaum P, Guihal C, Bracco L, Cochet O. A microarray configuration to quantify expression levels and relative abundance of splice variants. Nucleic Acids Res. 2005;33:e47. doi: 10.1093/nar/gni047. [DOI] [PMC free article] [PubMed] [Google Scholar]
- Johnson JM, Castle J, Garrett-Engele P, Kan Z, Loerch PM, Armour CD, Santos R, Schadt EE, Stoughton R, Shoemaker DD. Genome-wide survey of human alternative pre-mRNA splicing with exon junction microarrays. Science. 2003;302:2141–2144. doi: 10.1126/science.1090100. [DOI] [PubMed] [Google Scholar]
- Pan Q, Saltzman AL, Kim YK, Misquitta C, Shai O, Maquat LE, Frey BJ, Blencowe BJ. Quantitative microarray profiling provides evidence against widespread coupling of alternative splicing with nonsense-mediated mRNA decay to control gene expression. Genes Dev. 2006;20:153–158. doi: 10.1101/gad.1382806. [DOI] [PMC free article] [PubMed] [Google Scholar]
- Moulard B, Picard F, le Hellard S, Agulhon C, Weiland S, Favre I, Bertrand S, Malafosse A, Bertrand D. Ion channel variation causes epilepsies. Brain Res Brain Res Rev. 2001;36:275–284. doi: 10.1016/S0165-0173(01)00104-7. [DOI] [PubMed] [Google Scholar]
- Hynd MR, Scott HL, Dodd PR. Glutamate-mediated excitotoxicity and neurodegeneration in Alzheimer's disease. Neurochem Int. 2004;45:583–595. doi: 10.1016/j.neuint.2004.03.007. [DOI] [PubMed] [Google Scholar]
- Angulo E, Noe V, Casado V, Mallol J, Gomez-Isla T, Lluis C, Ferrer I, Ciudad CJ, Franco R. Up-regulation of the Kv3.4 potassium channel subunit in early stages of Alzheimer's disease. J Neurochem. 2004;91:547–557. doi: 10.1111/j.1471-4159.2004.02771.x. [DOI] [PubMed] [Google Scholar]
- Dewar D, Chalmers DT, Graham DI, McCulloch J. Glutamate metabotropic and AMPA binding sites are reduced in Alzheimer's disease: an autoradiographic study of the hippocampus. Brain Res. 1991;553:58–64. doi: 10.1016/0006-8993(91)90230-S. [DOI] [PubMed] [Google Scholar]
- LaFerla FM. Calcium dyshomeostasis and intracellular signalling in Alzheimer's disease. Nat Rev Neurosci. 2002;3:862–872. doi: 10.1038/nrn960. [DOI] [PubMed] [Google Scholar]
- Oddo S, LaFerla FM. The role of nicotinic acetylcholine receptors in Alzheimer's disease. J Physiol Paris. 2006;99:172–179. doi: 10.1016/j.jphysparis.2005.12.080. [DOI] [PubMed] [Google Scholar]
- Wakabayashi K, Narisawa-Saito M, Iwakura Y, Arai T, Ikeda K, Takahashi H, Nawa H. Phenotypic down-regulation of glutamate receptor subunit GluR1 in Alzheimer's disease. Neurobiol Aging. 1999;20:287–295. doi: 10.1016/S0197-4580(99)00035-4. [DOI] [PubMed] [Google Scholar]
- Yasuda RP, Ikonomovic MD, Sheffield R, Rubin RT, Wolfe BB, Armstrong DM. Reduction of AMPA-selective glutamate receptor subunits in the entorhinal cortex of patients with Alzheimer's disease pathology: a biochemical study. Brain Res. 1995;678:161–167. doi: 10.1016/0006-8993(95)00178-S. [DOI] [PubMed] [Google Scholar]
- Seifert G, Schroder W, Hinterkeuser S, Schumacher T, Schramm J, Steinhauser C. Changes in flip/flop splicing of astroglial AMPA receptors in human temporal lobe epilepsy. Epilepsia. 2002;43(Suppl 5):162–167. doi: 10.1046/j.1528-1157.43.s.5.10.x. [DOI] [PubMed] [Google Scholar]
- de Lanerolle NC, Eid T, von Campe G, Kovacs I, Spencer DD, Brines M. Glutamate receptor subunits GluR1 and GluR2/3 distribution shows reorganization in the human epileptogenic hippocampus. Eur J Neurosci. 1998;10:1687–1703. doi: 10.1046/j.1460-9568.1998.00171.x. [DOI] [PubMed] [Google Scholar]
- Tang B, Li H, Xia K, Jiang H, Pan Q, Shen L, Long Z, Zhao G, Cai F. A novel mutation in KCNQ2 gene causes benign familial neonatal convulsions in a Chinese family. J Neurol Sci. 2004;221:31–34. doi: 10.1016/j.jns.2004.03.001. [DOI] [PubMed] [Google Scholar]
- Singh NA, Westenskow P, Charlier C, Pappas C, Leslie J, Dillon J, Anderson VE, Sanguinetti MC, Leppert MF. BFNC Physician Consortium. KCNQ2 and KCNQ3 potassium channel genes in benign familial neonatal convulsions: expansion of the functional and mutation spectrum. Brain. 2003;126:2726–2737. doi: 10.1093/brain/awg286. [DOI] [PubMed] [Google Scholar]
- Singh NA, Charlier C, Stauffer D, DuPont BR, Leach RJ, Melis R, Ronen GM, Bjerre I, Quattlebaum T, Murphy JV. et al. A novel potassium channel gene, KCNQ2, is mutated in an inherited epilepsy of newborns. Nat Genet. 1998;18:25–29. doi: 10.1038/ng0198-25. [DOI] [PubMed] [Google Scholar]
- Lee WL, Biervert C, Hallmann K, Tay A, Dean JC, Steinlein OK. A KCNQ2 splice site mutation causing benign neonatal convulsions in a Scottish family. Neuropediatrics. 2000;31:9–12. doi: 10.1055/s-2000-15290. [DOI] [PubMed] [Google Scholar]
- de Haan GJ, Pinto D, Carton D, Bader A, Witte J, Peters E, van Erp G, Vandereyken W, Boezeman E, Wapenaar MC. et al. A novel splicing mutation in KCNQ2 in a multigenerational family with BFNC followed for 25 years. Epilepsia. 2006;47:851–859. doi: 10.1111/j.1528-1167.2006.00552.x. [DOI] [PubMed] [Google Scholar]
- Claes LR, Ceulemans B, Audenaert D, Deprez L, Jansen A, Hasaerts D, Weckx S, Claeys KG, Del-Favero J, Van Broeckhoven C. et al. De novo KCNQ2 mutations in patients with benign neonatal seizures. Neurology. 2004;63:2155–2158. doi: 10.1212/01.wnl.0000145629.94338.89. [DOI] [PubMed] [Google Scholar]
- Kananura C, Haug K, Sander T, Runge U, Gu W, Hallmann K, Rebstock J, Heils A, Steinlein OK. A splice-site mutation in GABRG2 associated with childhood absence epilepsy and febrile convulsions. Arch Neurol. 2002;59:1137–1141. doi: 10.1001/archneur.59.7.1137. [DOI] [PubMed] [Google Scholar]
- Haug K, Warnstedt M, Alekov AK, Sander T, Ramirez A, Poser B, Maljevic S, Hebeisen S, Kubisch C, Rebstock J. et al. Mutations in CLCN2 encoding a voltage-gated chloride channel are associated with idiopathic generalized epilepsies. Nat Genet. 2003;33:527–532. doi: 10.1038/ng1121. [DOI] [PubMed] [Google Scholar]
- Chioza B, Wilkie H, Nashef L, Blower J, McCormick D, Sham P, Asherson P, Makoff AJ. Association between the alpha(1a) calcium channel gene CACNA1A and idiopathic generalized epilepsy. Neurology. 2001;56:1245–1246. doi: 10.1212/wnl.56.9.1245. [DOI] [PubMed] [Google Scholar]
- Chen Y, Lu J, Pan H, Zhang Y, Wu H, Xu K, Liu X, Jiang Y, Bao X, Yao Z. et al. Association between genetic variation of CACNA1H and childhood absence epilepsy. Ann Neurol. 2003;54:239–243. doi: 10.1002/ana.10607. [DOI] [PubMed] [Google Scholar]
- Robbins TW, Murphy ER. Behavioural pharmacology: 40+ years of progress, with a focus on glutamate receptors and cognition. Trends Pharmacol Sci. 2006;27:141–148. doi: 10.1016/j.tips.2006.01.009. [DOI] [PMC free article] [PubMed] [Google Scholar]
- Zamanillo D, Sprengel R, Hvalby O, Jensen V, Burnashev N, Rozov A, Kaiser KM, Koster HJ, Borchardt T, Worley P. et al. Importance of AMPA receptors for hippocampal synaptic plasticity but not for spatial learning. Science. 1999;284:1805–1811. doi: 10.1126/science.284.5421.1805. [DOI] [PubMed] [Google Scholar]
- Schmitt WB, Sprengel R, Mack V, Draft RW, Seeburg PH, Deacon RM, Rawlins JN, Bannerman DM. Restoration of spatial working memory by genetic rescue of GluR-A-deficient mice. Nat Neurosci. 2005;8:270–272. doi: 10.1038/nn1412. [DOI] [PubMed] [Google Scholar]
- Schmitt WB, Deacon RM, Seeburg PH, Rawlins JN, Bannerman DM. A within-subjects, within-task demonstration of intact spatial reference memory and impaired spatial working memory in glutamate receptor-A-deficient mice. J Neurosci. 2003;23:3953–3959. doi: 10.1523/JNEUROSCI.23-09-03953.2003. [DOI] [PMC free article] [PubMed] [Google Scholar]
- Campion D, Flaman JM, Brice A, Hannequin D, Dubois B, Martin C, Moreau V, Charbonnier F, Didierjean O, Tardieu S. et al. Mutations of the presenilin I gene in families with early-onset Alzheimer's disease. Hum Mol Genet. 1995;4:2373–2377. doi: 10.1093/hmg/4.12.2373. [DOI] [PubMed] [Google Scholar]
- Stutzmann GE, Caccamo A, LaFerla FM, Parker I. Dysregulated IP3 signaling in cortical neurons of knock-in mice expressing an Alzheimer's-linked mutation in presenilin1 results in exaggerated Ca2+ signals and altered membrane excitability. J Neurosci. 2004;24:508–513. doi: 10.1523/JNEUROSCI.4386-03.2004. [DOI] [PMC free article] [PubMed] [Google Scholar]
- Sommer B, Keinanen K, Verdoorn TA, Wisden W, Burnashev N, Herb A, Kohler M, Takagi T, Sakmann B, Seeburg PH. Flip and flop: a cell-specific functional switch in glutamate-operated channels of the CNS. Science. 1990;249:1580–1585. doi: 10.1126/science.1699275. [DOI] [PubMed] [Google Scholar]
- Seifert G, Zhou M, Dietrich D, Schumacher TB, Dybek A, Weiser T, Wienrich M, Wilhelm D, Steinhauser C. Developmental regulation of AMPA-receptor properties in CA1 pyramidal neurons of rat hippocampus. Neuropharmacology. 2000;39:931–942. doi: 10.1016/S0028-3908(99)00212-9. [DOI] [PubMed] [Google Scholar]
- Seifert G, Huttmann K, Schramm J, Steinhauser C. Enhanced relative expression of glutamate receptor 1 flip AMPA receptor subunits in hippocampal astrocytes of epilepsy patients with Ammon's horn sclerosis. J Neurosci. 2004;24:1996–2003. doi: 10.1523/JNEUROSCI.3904-03.2004. [DOI] [PMC free article] [PubMed] [Google Scholar]
- Pollard H, Heron A, Moreau J, Ben-Ari Y, Khrestchatisky M. Alterations of the GluR-B AMPA receptor subunit flip/flop expression in kainate-induced epilepsy and ischemia. Neuroscience. 1993;57:545–554. doi: 10.1016/0306-4522(93)90004-Y. [DOI] [PubMed] [Google Scholar]
- Helton TD, Horne WA. Alternative splicing of the beta 4 subunit has alpha1 subunit subtype-specific effects on Ca2+ channel gating. J Neurosci. 2002;22:1573–1582. doi: 10.1523/JNEUROSCI.22-05-01573.2002. [DOI] [PMC free article] [PubMed] [Google Scholar]
- Liu H, De Waard M, Scott VE, Gurnett CA, Lennon VA, Campbell KP. Identification of three subunits of the high affinity omega-conotoxin MVIIC-sensitive Ca2+ channel. J Biol Chem. 1996;271:13804–13810. doi: 10.1074/jbc.271.23.13804. [DOI] [PubMed] [Google Scholar]
- Heinzen EL, Yoon W, Tate SK, Sen A, Wood NW, Sisodiya SM, Goldstein DB. Nova2 interacts with a cis-acting polymorphism to influence the proportions of pharmacologically relevant splice variants of SCN1A. Am J Hum Genet. 2007. in press . [DOI] [PMC free article] [PubMed]
- Tate SK, Singh R, Hung C, Tai JJ, Depondt C, Cavalleri GL, Sisodiya SM, Goldstein DB, Horng-Huei L. A common polymorphism in the SCN1A gene associates with phenytoin serum levels at maintenance dose. Pharmacogenet Genomics. 2006;16:721–726. doi: 10.1097/01.fpc.0000230114.41828.73. [DOI] [PubMed] [Google Scholar]
- Hulette C, Welsh-Bohmer K, Crain B, Szymanski M, Sinclaire N, Roses A. Rapid brain autopsy: The Brayn Alzheimer's Disease Research Center experience. Arch Pathol Lab Med. 1997;121:615–618. [PubMed] [Google Scholar]
- Applied Biosystems. Guide to performing relative quantitation of gene expression using real-time quantitative PCR. http://docs.appliedbiosystems.com/pebiodocs/04371095.pdf
Associated Data
This section collects any data citations, data availability statements, or supplementary materials included in this article.
Supplementary Materials
Taqman® assays and custom-designed primer/probe sequences used in rtPCR studies to confirm the presence of the splice variants.
Additional methods, discussion and figures regarding the assessment of cellular composition of the brain tissue samples used in these studies.