Abstract
The miscibility and phase behavior of hydrated binary mixtures of two N-acylethanolamines (NAEs), N-myristoylethanolamine (NMEA), and N-palmitoylethanolamine (NPEA), with the corresponding diacyl phosphatidylethanolamines (PEs), dimyristoylphosphatidylethanolamine (DMPE), and dipalmitoylphosphatidylethanolamine (DPPE), respectively, have been investigated by differential scanning calorimetry (DSC), spin-label electron spin resonance (ESR), and 31P-NMR spectroscopy. Temperature-composition phase diagrams for both NMEA/DMPE and NPEA/DPPE binary systems were established from high sensitivity DSC. The structures of the phases involved were determined by 31P-NMR spectroscopy. For both systems, complete miscibility in the fluid and gel phases is indicated by DSC and ESR, up to 35 mol % of NMEA in DMPE and 40 mol % of NPEA in DPPE. At higher contents of the NAEs, extensive solid-fluid phase separation and solid-solid immiscibility occur depending on the temperature. Characterization of the structures of the mixtures formed with 31P-NMR spectroscopy shows that up to 75 mol % of NAE, both DMPE and DPPE form lamellar structures in the gel phase as well as up to at least 65°C in the fluid phase. ESR spectra of phosphatidylcholine spin labeled at the C-5 position in the sn-2 acyl chain present at a probe concentration of 1 mol % exhibit strong spin-spin broadening in the low-temperature region for both systems, suggesting that the acyl chains pack very tightly and exclude the spin label. However, spectra recorded in the fluid phase do not exhibit any spin-spin broadening and indicate complete miscibility of the two components. The miscibility of NAE and diacyl PE of matched chainlengths is significantly less than that found earlier for NPEA and dipalmitoylphosphatidylcholine, an observation that is consistent with the notion that the NAEs are most likely stored as their precursor lipids (N-acyl PEs) and are generated only when the system is subjected to membrane stress.
INTRODUCTION
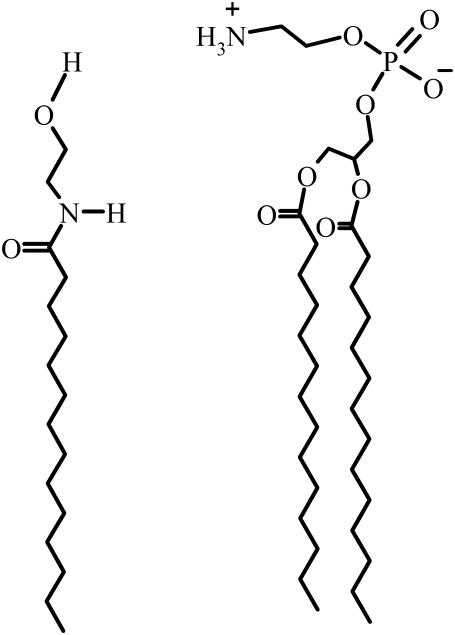
N-Acylethanolamines (NAEs) are naturally occurring amphiphiles that are present in a wide variety of animals, plants, and microbes (1,2). Chemically, NAEs may be considered derivatives of 2-ethanolamine, wherein the amino group is derivatized with a long acyl chain (Fig. 1). The content of long-chain NAEs and their precursors, N-acylphosphatidylethanolamines (NAPEs), has been shown to increase quite dramatically in a variety of organisms when subjected to stress (3). For example, both NAEs and NAPEs accumulate in rat brain during traumatic brain injury (4,5) and postdecapitative ischemia (6,7), and their content rises to very high levels when extensive membrane degradation occurs, e.g., in myocardial infarction (1,3,8–11). NAEs have also been reported to accumulate in different types of human tumors and in the surrounding normal tissue. Because NAEs have been shown to inhibit the growth of different cell lines, it appears that their accumulation in tumors might be due to their production by the adjacent tissues to fight the cancerous growth (12). These observations lend support to the notion that increase in the levels of NAEs and NAPEs may be due to a stress-fighting response of the parent organisms.
FIGURE 1.
Structures of NMEA and DMPE. The acyl chains in NPEA and DPPE contain 16 C-atoms instead of 14 C-atoms.
In addition to the dramatic increase in their concentration under conditions of stress, NAEs exhibit a number of other interesting biological and medicinal properties. For example, the interaction of N-arachidonylethanolamine (anandamide) with the type 1 cannabinoid receptor (CB-1) as an endogenous ligand, and its ability to inhibit gap-junction conductance and reduce the fertilizing capacity of sperm are well documented (13–15), whereas N-palmitoylethanolamine (NPEA) is reported to act as an agonist of the type 2 cannabinoid receptor, CB-2 (16). N-Myristoylethanolamine (NMEA) and N-lauroylethanolamine are secreted into the culture medium of tobacco cells when challenged with the fungal elicitor, xylanase, suggesting that their production could be in response to the stress (17). NAEs also exhibit antiinflammatory, antibacterial, and antiviral properties, which may have considerable therapeutic potential (1).
Besides the biological properties mentioned above, NAEs and NAPEs are interesting in view of their potential in formulating liposomal systems for use in drug delivery and targeting. For example, both NAEs and NAPEs have been reported to stabilize the bilayer structure. In particular, N-palmitoyl PE stabilizes liposomes even in the presence of human serum (18–20).
In view of their production as a stress response of organisms (such as upon injury in animals and dehydration in plants) and potential applications in developing liposomal drug delivery systems and as therapeutic agents, it is important to investigate NAEs and NAPEs with respect to their metabolism and physicochemical properties (e.g., phase transitions and supramolecular structure) as well as their interaction with other membrane lipids and proteins. Metabolic studies have shown that NAPEs are synthesized by a calcium- and energy-dependent transacylase and are hydrolyzed by a phospholipase D-type enzyme to phosphatidic acid and NAEs, which are further degraded by fatty acid amidohydrolase (3,21). More recent studies indicate that NAEs can also be synthesized by the sequential action of phospholipase A2 and lysophospholipase D on NAPE (22). Several enzymes involved in the metabolism of NAPEs and NAEs have been purified, characterized, and cloned (22–24).
Although a number of studies have been carried out to characterize the accumulation of NAEs and NAPEs in various species under stress and to understand their metabolism as described above, studies aimed at understanding the phase behavior and membrane interactions of these molecules are relatively fewer. Initial studies on the interaction of several NAEs with dipalmitoylphosphatidylcholine (DPPC) multilamellar vesicles have shown that NAEs modulate the phase transition characteristics of DPPC in different ways, depending on the acyl chainlength and unsaturation (18). In earlier work, we investigated the chain-melting phase transitions of homologous series of these two classes of compounds by using differential scanning calorimetry (DSC) and reported the crystal structures of NMEA and NPEA (8,25–29). Studies employing DSC, fast-atom-bombardment mass spectrometry, and computational modeling have indicated that NMEA forms a 1:1 (mol/mol) complex with cholesterol (30). In another study, the interaction of NPEA with DPPC was investigated by DSC, 31P-NMR, and small-angle x-ray scattering (31).
In this study, we have investigated the interaction of two NAEs, namely NMEA and NPEA, with diacyl phosphatidylethanolamines (PEs) of matched acyl chainlengths, i.e., with dimyristoyl (DMPE) and dipalmitoyl (DPPE) PEs. The phase properties of binary NAE/PE mixtures were characterized at various compositions, temperature-composition phase diagrams constructed from DSC data, and the structures of the phases delineated from 31P-NMR spectroscopic data.
MATERIALS AND METHODS
Materials
1,2-Dimyristoyl-sn-glycero-3-phosphoethanolamine (DMPE) and 1,2-dipalmitoyl-sn-glycero-3-phosphoethanolamine (DPPE) were purchased from Avanti Polar Lipids (Alabaster, AL). Myristic acid and palmitic acid were obtained from Sigma (St. Louis, MO) and oxalylchloride was a product of Fluka (Buchs, Switzerland). Ethanolamine was obtained from Ranbaxy (Mumbai, India). All solvents were distilled and dried before use. The 1-acyl-2-[5-(4,4-dimethyloxazolidine-N-oxyl)]stearoyl-sn-glycero-3-phosphocholine (5-PCSL) phosphatidylcholine spin label bearing the nitroxide oxazolidine ring on the 5 C-atom of the sn-2 chain was synthesized as described in Marsh and Watts (32).
Synthesis of N-myristoylethanolamine and NPEA
Myristic acid and palmitic acid were converted to the corresponding acid chlorides by treating with 4 mol equivalents of oxalyl chloride according to the procedure described in Akoka et al. (33). NMEA and NPEA were synthesized by the reaction of myristoyl chloride and palmitoyl chloride, respectively, with ethanolamine; and the products were characterized by thin layer chromatography (TLC) and infrared spectroscopy as reported earlier (28).
Sample preparation
Samples for DSC experiments were prepared in the following way. Stock solutions of the two lipids were prepared in dichloromethane/methanol (1:1, v/v), and appropriate volumes were aliquoted into glass test tubes to yield the desired mole ratio. The lipid mixture was then vortexed thoroughly, and the organic solvent was removed under a stream of dry nitrogen gas. The resulting lipid film was vacuum desiccated overnight to remove residual traces of the solvent. About 3–6 mg of the lipid was weighed and placed into 1.5-mL Hastelloy ampoules and then 500 μL of 10 mM HEPES buffer, pH 7.4, containing 1 mM EDTA and 1 M NaCl (HBS) was added. The ampoules were then tightly sealed with screw caps and placed in the calorimeter. The reference ampoule contained an equal volume of the buffer alone.
Samples for electron spin resonance (ESR) spectroscopy were prepared by codissolving 1 mg of the lipid and 1 mol % of the spin label in dichloromethane/methanol (1:1, v/v) in a dry glass test tube. The solvent was then evaporated with a gentle stream of dry nitrogen gas, and the residual solvent was removed by subjecting the sample to vacuum desiccation overnight. The sample was then hydrated with 100 μL of HBS by heating it above the phase transition temperature with intermittent vortexing and finally transferred to a 100-μL glass capillary. The hydrated lipid was pelleted by centrifuging at 10,000 rpm in a Biofuge (Heraeus, Hanau, Germany), excess supernatant was removed with the aid of a drawn-out Pasteur pipette, and the capillary was flame sealed.
Samples for 31P-NMR spectroscopy were prepared by codissolving 20–40 mg of the required lipid mixture (NMEA + DMPE or NPEA + DPPE) in dichloromethane/methanol (1:1, v/v). The solvent was then evaporated by blowing dry nitrogen gas gently over the sample, and the final traces were completely removed by vacuum desiccation for 5–6 h. The dry lipid was hydrated with 0.5 mL of HBS at ∼10° above the chain-melting temperature of NMEA or NPEA for the mixtures with DMPE or DPPE, respectively, and transferred to a 5-mm-diameter NMR tube. Samples were freeze-thawed five times, then pelleted in a bench-top centrifuge, and excess buffer was removed before measurement.
Differential scanning calorimetry
DSC experiments were performed on a Hart Scientific 4207 (Calorimetry Sciences Corporation, Lindon, Utah) heat-flow differential scanning calorimeter. Samples, prepared as described above, were subjected to heating and cooling scans at a scan rate of 10°/h in the Celcius Scale. Hydration of the lipid was achieved by first heating the samples in the calorimeter to a temperature that is above the lipid chain-melting phase transition.
Electron spin resonance spectroscopy
ESR spectra were recorded on a 9-GHz Bruker-EMX-EPR spectrometer (Billerica, MA) with model ER 041 XK-D Microwave Bridge and equipped with nitrogen gas-flow temperature regulation. Samples in 1-mm inner diameter glass capillaries were placed in a standard quartz ESR tube containing light silicone oil for thermal stability. Temperature was measured with a fine-wire thermocouple positioned in the silicone oil just above the ESR cavity.
31P-NMR spectroscopy
31P-NMR spectra were recorded at a frequency of 162 MHz on a Bruker Avance 400 FT-NMR spectrometer. Spectra were recorded using the zgpg30 pulse program provided by Bruker with 1H-decoupling with a decoupling power of 14 db. The π/2 pulse width used was 9.5 μs for 31P, and the recycle delay was 1 s. About 2048–16,384 scans were accumulated for each spectrum, and the free induction decay was processed using 100 Hz of line broadening to improve s/n ratio. Temperature was regulated by a thermostatted air-flow system. The spectral width was set to 400 ppm.
RESULTS
The interaction of NMEA and NPEA with diacylphosphatidylethanolamines of matched acyl chainlengths, namely DMPE and DPPE, has been investigated in this study by biophysical approaches. Binary temperature-composition phase diagrams have been established from the DSC thermograms, and the structures of the different phases have been assigned by 31P-NMR spectroscopy. In addition, the lipid-mixing behavior and chain dynamics have been investigated by spin-label ESR spectroscopy.
Differential scanning calorimetry
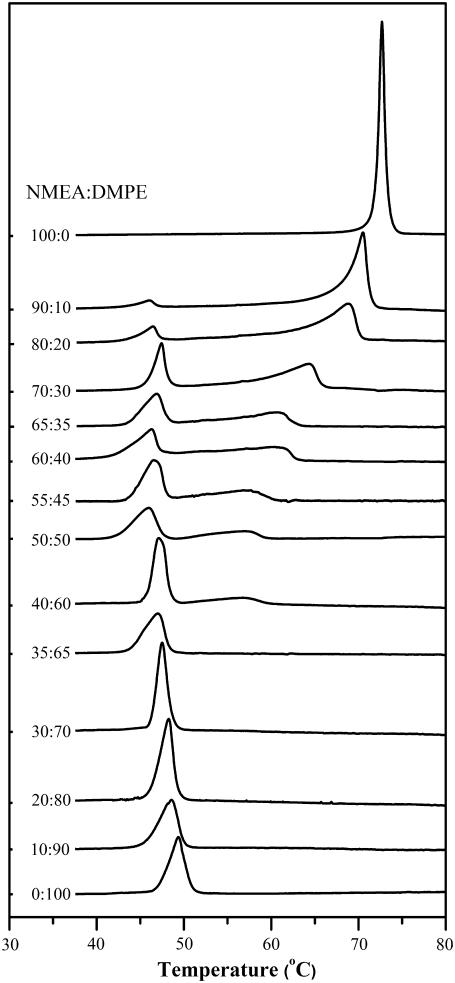
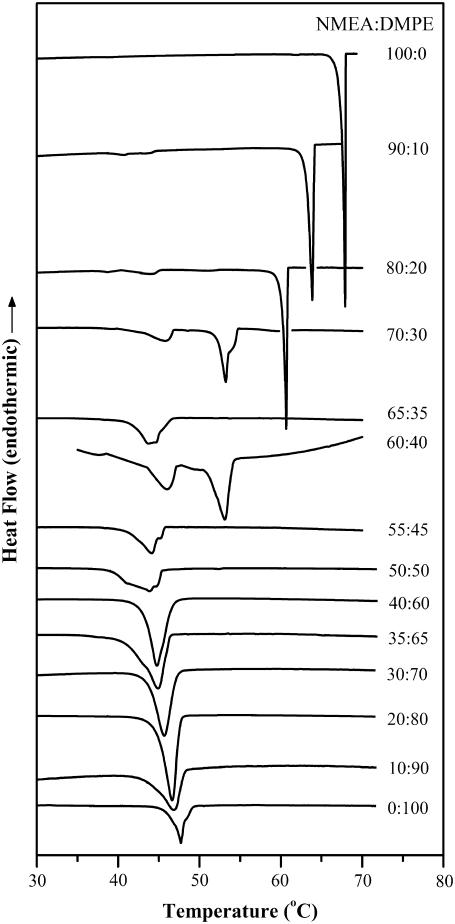
Thermograms of the heating scans of DMPE, NMEA, and their mixtures of various compositions are given in Fig. 2, and the corresponding cooling scans are given in Fig. 3. Heating and cooling thermograms of DPPE, NPEA, and their mixtures have been found to be qualitatively very similar; therefore, these are not shown here but are given in Supplementary Material as Fig. S1 and Fig. S2, respectively. From Fig. 2 and Fig. S1 it is seen that the chain-melting endothermic transitions of DMPE and DPPE, observed at 49.4°C and 63.6°C, respectively, are consistent with literature reports (34). The chain-melting phase transitions of NMEA and NPEA, seen at 72.5°C and 79.6°C in Fig. 2 and Fig. S1, respectively, are also consistent with the values reported in the literature (28). It is to be noted here that the transitions of both the diacyl PEs and NAEs are of nonvanishing width, and analysis of phase transition data from an earlier study (35) shows that the transition width of fully hydrated DMPE and DPPE alone are in the region of 4°C–5°C. Examination of the thermograms for the NMEA/DMPE and NPEA/DPPE mixtures indicates that the changes occurring in the phase transition behavior with increasing mole fraction of NAE in the diacyl PE are broadly similar for the two systems; therefore, both sets of lipid mixtures are dealt with together in the following discussion.
FIGURE 2.
Calorimetric heating scans of NMEA, DMPE, and their mixtures of different compositions. Samples were dispersed in 10 mM HEPES buffer containing 1 M NaCl and 1 mM EDTA, pH 7.4. Thermograms were recorded at a rate of 10°C/h. The molar composition (NMEA/DMPE) for each sample is indicated.
FIGURE 3.
Calorimetric cooling scans of NMEA, DMPE, and their mixtures of different compositions. Samples were dispersed in 10 mM HEPES buffer containing 1 M NaCl and 1 mM EDTA, pH 7.4. Scan rate: 10°C/h. The molar composition (NMEA/DMPE) for each sample is indicated.
Addition of NMEA to DMPE and NPEA to DPPE at low to moderate mole fractions results in a decrease in the onset temperature of the phase transition of the PE, with a sharpening of the phase transition. The thermograms become sharper with increasing NMEA fraction up to 30 mol %, whereas the thermogram corresponding to 35 mol % NMEA is somewhat broader than that of DMPE alone. For samples containing 40–90 mol % NMEA, the thermograms display two peaks in heat capacity, indicating phase separation. The onset temperature of the transition at up to 35 mol % NMEA is in the temperature range between 43.0°C and 46.0°C, and the completion temperature of this transition decreases from 51.0°C for DMPE alone to 48.3°C for the sample containing 35 mol % NMEA. In samples containing 40–90 mol % NMEA, which exhibit two heat-capacity maxima, the position of the low-temperature endotherm is more or less constant and the onset temperature occurs at ∼43°C–46°C. However, the position of the high-temperature endotherm shifts quite sharply to higher temperature with increasing NMEA content up to the mixture containing 90 mol % NMEA. The completion temperature increases in parallel from 60.3°C for the sample with 40 mol % NMEA to 72.6°C for the mixture containing 90 mol % NMEA.
The thermograms obtained for the DPPE/NPEA mixtures (Figs. S1 and S2) are qualitatively very similar to those obtained with the DMPE/NMEA samples. The thermograms become slightly broader for the samples with 10–30 mol % NPEA, but the thermogram for the sample with 40 mol % NPEA becomes sharper, indicating the formation of an isothermally melting complex between the two components. In addition, the onset temperature decreases steadily from 60.4°C for DPPE alone to 57.7°C for the sample with 40 mol % NPEA, which is also consistent with complex formation between NPEA and DPPE. For samples with 50–90 mol % NPEA, the thermograms exhibit two heat-capacity maxima, which is consistent with phase separation. The intensity of the second heat-capacity maximum increases with increasing mole fraction of NPEA, whereas the intensity of the first heat-capacity maximum decreases. Again, the onset temperature remains approximately constant on increasing the content of NPEA from 50 to 90 mol %, whereas the completion temperature increases steeply with increasing NPEA content.
Several observations can be made from an analysis of the cooling scans shown in Fig. 3. First, whereas the phase transitions corresponding to the samples with NMEA content up to 35 mol % are completely reversible with a small hysteresis, cooling thermograms corresponding to the samples containing 40–55 mol % NMEA exhibit a broad single exotherm, which possibly contains more than one underlying peak, with significant hysteresis (the corresponding heating transitions show two peaks). The cooling thermograms corresponding to samples with 70–90 mol % NMEA exhibit multiple peaks, with a major peak followed by two or three minor, overlapping peaks. These thermograms also exhibit considerable hysteresis.
From the cooling thermograms shown in Fig. S2, it is seen that the chain melting of DPPE/NPEA mixtures with up to 40 mol % NPEA is essentially reversible with a small hysteresis, whereas the thermograms corresponding to 50 and 60 mol % NPEA exhibit a single peak with significant hysteresis, although the corresponding heating thermograms contain two peaks. The cooling thermograms corresponding to 70–90 mol % NPEA display essentially the same peaks as seen in the corresponding heating thermograms; however, they exhibit considerable hysteresis. Part of the reason for the hysteresis could be the long time that is required to achieve compositional equilibrium between the coexisting phases in the region of lateral phase separation when one of these two phases is solid NAE.
Binary phase diagrams
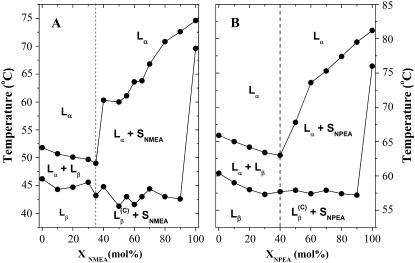
Temperature-composition binary phase diagrams of the NMEA/DMPE and NPEA/DPPE mixtures, derived from the temperature boundaries of the heating thermograms shown in Fig. 2 and Fig. S1, are given in Fig. 4, A and B, respectively. Solid symbols indicate the onset and completion temperatures of the entire endotherm. The overall phase diagram is rather similar in the two cases and contains two distinct regions. In the first region, which spans between 0% NAE and 35%–40% NAE, the two components mix rather well, and the corresponding thermograms contain a single, relatively sharp endothermic peak. Above 35 mol % for NMEA and above 40 mol % for NPEA, the thermograms become more complex with the appearance of a second endothermic peak, which shifts progressively to higher temperature with the increase in content of NAE. This is indicative of extensive regions of solid-fluid phase separation. Binary phase diagrams constructed from the DSC cooling scans (not shown) are qualitatively similar to those obtained from the heating scans. Only the positions of the solidus and fluidus lines are somewhat displaced in temperature (cf. Figs. 2, 3 and S1, S2).
FIGURE 4.
Binary phase diagrams of (A) NMEA/DMPE and (B) NPEA/DPPE mixtures dispersed in 10 mM HEPES containing 1 M NaCl and 1 mM EDTA, pH 7.4. The phase diagrams have been deduced from the phase boundaries established from DSC endotherms shown in Fig. 2 (for NMEA/DMPE mixture) and Fig. 4 (for NPEA/DPPE mixture). Phase designations are indicated: Lβ and Lα are lamellar gel and fluid phases, respectively;  is the gel phase of compound C; and SNMAE and SNPAE are solid NMAE and NPAE, respectively.
31P-NMR spectroscopy
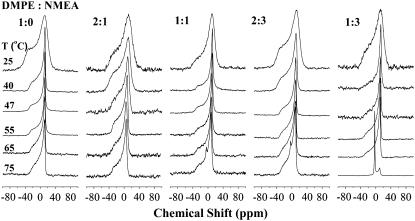
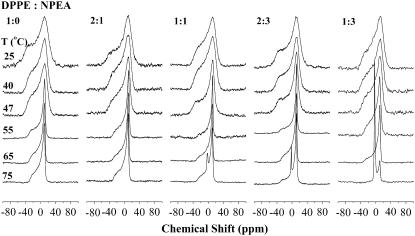
The structures of the phases for the NMEA/DMPE and NPEA/DPPE mixtures at different compositions were investigated by broad-line 31P-NMR spectroscopy. Spectra of NMEA/DMPE mixtures are shown in Fig. 5, and the spectra of NPEA/DPPE mixtures are shown in Fig. 6. For both systems, spectra were recorded in the temperature range 25°C–75°C, and the chemical shift anisotropies determined from these spectra are listed in Table 1. The spectra shown in Fig. 5 correspond to DMPE alone and to DMPE/NMEA mixtures with mole ratios of 2:1, 1:1, 2:3, and 1:3, that is, 33.3 mol %, 50 mol %, 66.7 mol %, and 75 mol % NMEA in the mixture. In the gel phase region at 25°C, the spectra of all the mixtures as well as of DMPE alone are broad, axially anisotropic powder patterns with a high-field peak and a low-field shoulder. The effective chemical shift anisotropies are found to be in the range of Δσ = −58.7 to −63.2 ppm and are typical of a lamellar gel phase. At 47°C–65°C, the spectra for all the samples are considerably sharper, axially anisotropic powder patterns with effective chemical shift anisotropies in the range of Δσ = −38.7 to −48.5 ppm, which are typical of the lamellar fluid phase. At 75°C, the highest temperature at which 31P-NMR spectra were recorded, the spectra for the samples with DMPE/NMEA ratios of 1:1 and 2:3 (mol/mol) contain a small isotropic peak, whose intensity increases significantly in the sample with a DMPE/NMEA mole ratio of 1:3.
FIGURE 5.
Proton-dipolar decoupled 162 MHz 31P-NMR spectra of DMPE and NMEA/DMPE binary mixtures of different compositions. Samples were hydrated with 10 mM HEPES containing 1 M NaCl and 1 mM EDTA, pH 7.4. The lipid composition (DMPE:NMEA mol/mol) of the samples and the temperature at which each spectrum was recorded are indicated in the figure. Chemical shifts are referenced to external phosphoric acid.
FIGURE 6.
Proton-dipolar decoupled 162 MHz 31P-NMR spectra of DPPE and NPEA/DPPE binary mixtures of different compositions. Samples were hydrated with 10 mM HEPES containing 1 M NaCl and 1 mM EDTA, pH 7.4. The lipid composition (DPPE:NPEA mol/mol) of the samples and the temperature at which each spectrum was recorded are indicated in the figure. Chemical shifts are referenced to external phosphoric acid.
TABLE 1.
Values of effective chemical shift anisotropy, obtained from the 31P-NMR spectra of hydrated samples of DMPE/NMEA and DPPE/NPEA mixtures at different temperatures
| Diacyl PE/NAE ratio (mol/mol) | CSA (ppm)
|
||
|---|---|---|---|
| T (°C) | DMPE/NMEA | DPPE/NPEA | |
| 1:0 | 25 | −63.8 | −69.0 |
| 40 | −41.7 | −56.1 | |
| 47 | −42.4 | −56.7 | |
| 55 | −41.7 | −45.5 | |
| 65 | −38.7 | −40.7 | |
| 75 | −38.8 | −38.4 | |
| 2:1 | 25 | −62.7 | −66.6 |
| 40 | −58.1 | −58.0 | |
| 47 | −48.5 | −56.2 | |
| 55 | −41.4 | −42.6 | |
| 65 | −40.2 | −41.7 | |
| 75 | −40.0 | −40.6 | |
| 1:1 | 25 | −59.5 | −60.5 |
| 40 | −45.1 | −60.4 | |
| 47 | −47.1 | −59.8 | |
| 55 | −42.4 | −40.5 | |
| 65 | −42.6 | −43.1 | |
| 75 | −42.2 | −41.5 | |
| 2:3 | 25 | −62.0 | −68.6 |
| 40 | −52.2 | −64.1 | |
| 47 | −42.1 | −61.8 | |
| 55 | −41.1 | −47.2 | |
| 65 | −40.3 | −42.2 | |
| 75 | −39.9 | −43.2 | |
| 1:3 | 25 | −58.7 | −59.6 |
| 40 | −46.9 | −59.9 | |
| 47 | −44.7 | −56.3 | |
| 55 | −43.6 | −44.5 | |
| 65 | −43.1 | −43.4 | |
| 75 | −43.5 | …. | |
Buffer: 10 mM HEPES, pH 7.4, containing 1 mM EDTA and 1 M NaCl.
31P-NMR spectra of DPPE/NPEA mixtures shown in Fig. 6 are qualitatively very similar to those of DMPE/NMEA mixtures discussed above. All the spectra recorded at 25°C, 40°C, and 47°C, which are in a temperature region corresponding to the gel phase of DPPE, are broad, axially anisotropic powder patterns with effective chemical shift anisotropy (CSA) values ranging from −56.2 to −69.0 ppm that are characteristic of a lamellar gel phase. The spectra recorded at 55°C and 65°C are significantly sharper, axially anisotropic powder patterns that are consistent with a lamellar liquid-crystalline phase. Interestingly, the spectra recorded at 75°C for the samples with DPPE/NPEA (mol/mol) ratios of 1:1, 2:3, and 1:3 all contain an isotropic peak. The intensity of this isotropic component is considerably higher for all three samples than it is in the DMPE/NMEA mixtures with corresponding diacyl PE/NAE ratios at 75°C.
Spin-label ESR spectroscopy
DMPE/NMEA system
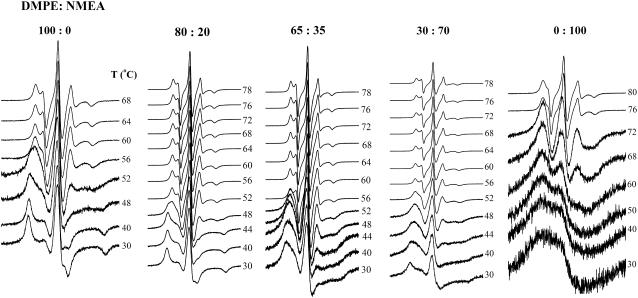
The temperature dependences of the ESR spectra of 5-PCSL phosphatidylcholine spin label in DMPE, NMEA, and their mixtures with DMPE/NMEA mole ratios of 80:20, 65:35, and 30:70 are shown in Fig. 7. The spectra recorded at temperatures below the chain-melting transition of DMPE (30°C and 40°C) in DMPE alone and in DMPE/NMEA (80:20 mol/mol) are in the slow motional regime. They contain a single component, and the hyperfine splitting constants are close to those expected for rigid limit spectra. The spectra recorded close to the phase transition temperature (at 48°C and 52°C) consist of two components: one component is similar to that seen at lower temperatures and the second corresponds to a lipid fraction that is more mobile and is strongly spin-spin broadened. These two components can be explained as arising from the coexistence of a large fraction of gel-phase lipid with a small fraction of liquid-crystalline lipid into which a major fraction of the spin label partitions, resulting in strong spin-spin interaction that yields the broad component in the ESR spectrum. Spectra recorded at higher temperatures display features that are characteristic of a fluid liquid-crystalline phase with partially motionally averaged, axial hyperfine anisotropy.
FIGURE 7.
ESR spectra of 5-PCSL spin label in DMPE, NMEA, and DMPE/NMEA mixtures of the mole ratios indicated. Samples were hydrated with 10 mM HEPES containing 1 M NaCl and 1 mM EDTA, pH 7.4. The temperature at which each spectrum is recorded is indicated in the figure. Total scan width = 100 G.
In contrast to the above, ESR spectra of 5-PCSL in mixtures with DMPE/NMEA mole ratios of 65:35 and 30:70 recorded in the low-temperature region (30°C and 40°C) evidence strong spin-spin broadening. Because the DSC data suggest that the 65:35 mol/mol mixture corresponds to a complex between the two components, it is likely that the solubility of the spin label in the complex is rather low, resulting in its partial exclusion from the tightly packed lipid in the gel phase. The spectra of the DMPE/NMEA (65:35 mol/mol) mixture recorded at 56°C and above are sharp, partially motionally averaged, and contain a single component. This is consistent with the fluid liquid-crystalline nature of this mixture at these temperatures. For the DMPE/NMEA (30:70 mol/mol) mixture, the ESR spectra recorded at 56°C and above are also characteristic of the spin label in a liquid-crystalline phase, although the DSC data and the phase diagram obtained from them indicate that the sample should be a mixture of solid and fluid phases at this temperature. It therefore appears that the spin label is predominantly partitioned into the fluid phase and thus seems to consist of only a single component. This is consistent with the very poor solubility of the spin label in the solid phase of NMEA alone, as seen from the spectra shown in the extreme right panel of Fig. 7. The spectra of 5-PCSL in NMEA alone recorded at temperatures below 70°C are all highly spin-spin broadened, clearly indicating that in the crystalline phase the acyl chains of this single-chain lipid are very tightly packed. Even at 72°C, which is near the phase transition, the spectra are strongly broadened. However, above the phase transition temperature, the spectra are characteristic of a liquid-crystalline phase with sharp, only partially motionally averaged, spectral lines.
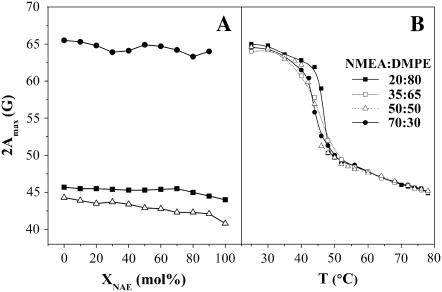
Although there is considerable spin-spin broadening in the low-temperature spectra from some of the mixtures of NMEA and DMPE, the outer wings of the spectra could be analyzed unambiguously to obtain the outer hyperfine splitting, 2Amax, for all mixtures, both in the gel phase and in the liquid-crystalline phase with the exception of the spectra of 5-PCSL in NMEA alone in the solid phase. A plot giving the values of 2Amax at 30°C in the gel phase (•) and at 76°C in the liquid-crystalline phase (▪) as a function of mole fraction, XNMEA, of NMEA is given in Fig. 8 A. From this figure it is seen that the values of 2Amax range between 63.3 and 65.3 G in the gel phase and between 44.5 and 45.5 G in the fluid phase for the different mixtures of DMPE and NMEA. The hyperfine anisotropy for DMPE alone is similar to values of 2Amax of 65.5 and 45.7 G at 30°C and 76°C in the gel and fluid phases, respectively. These values indicate that the lipid acyl chain packing does not change much with change in the lipid composition, which suggests that the bilayer structure is preserved at compositions up to 90 mol % NMEA and that there is good hydrophobic matching between NMEA and DMPE. For 100% NMEA, the ESR spectra at low temperature are indicative of a crystalline phase because they are almost completely spin-spin broadened, as a result of exclusion of the spin label from the very tightly packed chains of the host lipid. However, in the fluid phase of NMEA, the value of 2Amax for 5-PCSL is 44.0 G, which is in the range expected for the liquid-crystalline phase of a bilayer membrane.
FIGURE 8.
(A) Plots of 2Amax versus mole% of NAE, XNAE, for the 5-PCSL spin label in various NAE/diacyl PE mixtures. Values of 2Amax for 5-PCSL in mixtures of NMEA and DMPE in the gel phase at 30°C (•) and in the liquid-crystalline phase at 76°C (▪) are shown along with the corresponding values obtained for 5-PCSL in mixtures of NPEA and DPPE in the liquid-crystalline phase at 83°C (Δ). (B) Temperature dependence of 2Amax for 5-PCSL in mixtures of DMPE/NMEA. The composition of the samples is indicated in the figure. See text for details.
The variation of 2Amax as a function of temperature for several of the mixtures is given in Fig. 8 B. The sharp decline in the 2Amax values seen between 40°C and 50°C corresponds to the gel-fluid phase transition of the different mixtures. It may be noted that the phase transition temperatures observed from the ESR data are very close, which could be due to the preferential partitioning of the spin-label probe into the fluid phase as mentioned above and hence do not match the transition range determined from the DSC measurements.
DPPE/NPEA system
The ESR spectra of 5-PCSL in pure DPPE and in pure NPEA are very strongly spin-spin broadened in the low-temperature region (see Fig. S3), suggesting that the spin label is strongly excluded from the tightly packed lipid chains in the gel or crystalline phase. Although somewhat less pronounced, in the three mixtures with DPPE/NPEA molar ratios of 80:20, 60:40, and 30:70, the spectra in the region below ∼60°C are all strongly spin-spin broadened, suggesting that the lipid acyl chains are rather tightly packed in the low-temperature phase, resulting in an exclusion of the spin-labeled probe (Fig. S3). Above the phase transition temperature of pure DPPE, the spectra become sharper and are composed of a single component. The liquid crystalline phase in all the mixtures appears to be homogeneous because the spin-labeled probe reports a single, anisotropically averaged axial component.
The strong spin-spin broadening in the ESR spectra in the low-temperature region precludes analysis of the spectra to obtain values of 2Amax for most of the samples. However, the values of 2Amax could be determined for all the mixtures of NPEA and DPPE in the fluid phase, and these were found to range between 42.1 and 43.9 G at 83°C for the different mixtures with NPEA mole fractions ranging between 0.1 and 0.9. The value of 2Amax for 5-PCSL in DPPE alone is similar at 44.3 G. These values for DPPE/NPEA mixtures in the fluid phase are also shown in Fig. 8 A (Δ). Again, the relatively constant values of 2Amax suggest preservation of the bilayer structure and good hydrophobic matching between the two lipid components.
DISCUSSION
In view of the production of NAEs in response to membrane stress, it is of interest to investigate the interaction of various NAEs with other membrane components, especially with the major membrane lipids such as phosphatidylcholine, phosphatidylethanolamine, and cholesterol. The mixing behavior of NMEA with cholesterol and that of NPEA with DPPC have been investigated in earlier studies (30,31). In this study we report DSC, spin-label ESR, and 31P-NMR studies on the interaction of NMEA with DMPE and of NPEA with DPPE. The structures of the various phases of the hydrated mixtures for the two systems are discussed first. This is followed by a discussion of the phase diagrams and phase coexistence. Then the biological/functional implications of the mixing properties of NAEs with other membrane lipids are considered.
Structures of phases and lipid miscibility
The structures of the phases have been examined by 31P-NMR spectroscopy, which can distinguish between various types of structures formed by phospholipids (viz., DMPE and DPPE in the mixtures investigated here) but cannot provide direct information on the structures formed by other nonphosphorus-containing lipids (NMEA and NPEA here). However, if the phase structure of the diacyl PEs is affected by the NAEs, this can be detected by this technique. The 31P-NMR spectra of NMEA/DMPE and NPEA/DPPE mixtures shown in Fig. 5 and Fig. 6 suggest that in the gel-phase region all the samples examined are in a lamellar state. For both systems, the spectra recorded up to 65°C are also characteristic of a lamellar phase, indicating that the diacyl PEs exist in a bilayer structure up to this temperature. The spectra recorded at 75°C for mixtures of NMEA and DMPE with mole compositions of 1:1 and 2:3 contain a small isotropic component, which increases significantly in the spectrum of the DMPE/NMEA (1:3 mol/mol) sample. This isotropic component may be attributed to the formation of small vesicles or possibly even of a fluid nonlamellar (cubic) structure. In the DPPE/NPEA system, lamellar structure is also seen for all samples at temperatures up to 65°C, and at 75°C there is a distinct isotropic 31P-NMR component for the samples with DPPE/NPEA mole ratios of 1:1, 2:3, and 1:3. Interestingly, the isotropic content in the samples with DPPE/NPEA mole ratios of 1:1 and 2:3 is relatively larger than in the corresponding samples in the DMPE/NMEA system. Also, the magnitude of the isotropic component increases with increasing NPEA content. These observations are consistent with a model in which the phase structure of the diacyl PE is affected by the NAE at high mole fractions and leads to the formation of highly curved vesicles or a nonlamellar structure. According to the phase diagram presented in Fig. 4 B (or the equivalent constructed from DSC cooling scans), the sample with DPPE/NPEA 1:3 mole ratio would be in a region of solid-fluid phase separation at 75°C. Under these conditions, coexistence of two fluid phases (i.e., lamellar and nonlamellar) in addition to the solid phase would be forbidden by the Gibbs phase rule. Further studies have to be carried out to investigate this aspect in greater detail.
Binary phase diagram and phase coexistence
The phase diagrams of the two binary systems investigated here, namely those of DMPE/NMEA and DPPE/NPEA constructed from the DSC solidus and liquidus data, can be divided broadly into two regions. In the first region, which corresponds to mole fractions up to XNMEA = 0.35 (and XNPEA = 0.4), the phase diagram is of the isomorphous type and the diacyl PE and NAE mix well in both gel and fluid phases. The 31P-NMR results discussed above are fully consistent with this model. At the above stoichiometries the two components form a complex, C, which melts at a lower temperature than the PE component alone. In the low-temperature region, the uncomplexed PE and complex mix well in a uniform gel phase, Lβ, and correspondingly form a uniform fluid phase, Lα, in the high-temperature region. In the intermediate chain-melting region, fluid and gel phases coexist, Lα + Lβ.
The second region spans from 35 to 100 mol % NMEA in mixture with DMPE (or 40 to 100 mol % NPEA in mixture with DPPE). In this region, the phase diagram is characteristic of solid phase immiscibility, with a horizontal solidus at the melting temperature of the compound C. Below this temperature the compound in the gel phase,  coexists with solid NAE, SNAE. Above the solidus, there is an extended region, Lα + SNAE, over which a fluid lamellar lipid phase coexists with solid NAE. Above the fluidus line, the system is in a liquid-crystalline phase at all compositions and is predominantly lamellar, although some nonlamellar cubic phase cannot be excluded entirely on the basis of the 31P-NMR results.
It is pertinent here to compare the two phase diagrams obtained in this study for the interaction of NMEA and NPEA with diacyl PEs of matched chainlengths with the phase diagrams obtained in earlier studies for the interaction of NPEA with DPPC (31) and for the interaction of N-myristoyldimyristoylphosphatidylethanolamine (N-14 DMPE) with dimyristoylphosphatidylcholine (DMPC) (36). Whereas NMEA and NPEA mix well with diacyl PEs of matched chainlengths only up to 35–40 mol % in the gel phase, N-14 DMPE was found to mix well with DMPC over the entire composition range in both gel and fluid phases. The binary phase diagram of NPEA with DPPC resembles more closely that of the NAE/PE systems. Gel-phase miscibility extends to 60 mol % of NPEA in DPPC, corresponding to the formation of an isothermally melting compound with a higher proportion of NPEA than that which is formed with DPPE. At higher contents of NPEA, the low-temperature behavior of NPEA/DPPC mixtures is complicated by the presence of one or more metastable polymorphs that are absent in the NAE/PE systems. Nonetheless, solid-solid immiscibility is indicated with uncomplexed solid NAPE, as in the NAPE/DPPE system. In view of the lower phase transition temperatures of NAPEs as compared with the NAEs of equivalent acyl chainlengths, it appears that the NAPEs are the more compatible with the phospholipids present in fluid biological membranes.
Biological implications
The two NAEs investigated in this study, namely NMEA and NPEA, exhibit good miscibility with PEs of equivalent acyl chainlength at contents up to only 35–40 mol %. This is considerably lower than the miscibility of NPEA and DPPC, which were found to mix well at contents up to 60 mol % of the former (31). It is interesting to note that although the phase transition temperatures of the diacyl PEs are closer to those of the NAEs of corresponding chainlengths, the miscibility of the NAE/diacyl PE systems is less extensive than that of the NAE/diacyl PC system. Overall, these results indicate that the NAEs do not exhibit complete miscibility with either of the two major phospholipids of eukaryotic cell plasma membranes, namely phosphatidylcholine and phosphatidylethanolamine. Consequently, it appears that the NAEs may be stored in the biological membranes as their precursor lipids, namely NAPEs, which are mobilized when necessary, i.e., when subjected to membrane stress (Ramakrishnan et al. (36)).
SUPPLEMENTARY MATERIAL
An online supplement to this article can be found by visiting BJ Online at http://www.biophysj.org.
Acknowledgments
We are grateful to Frau B. Angerstein for the synthesis of the 5-PCSL phosphatidylcholine spin label.
This work was supported in part by a research project from The Department of Science and Technology (DST) to M.J.S. (SP/SO/D-124/98). R.K.K. is a Senior Research Fellow of Council of Scientific and Industrial Research (India). The 400-MHz Bruker NMR spectrometer used in this study was supported by a FIST grant from the DST (India) to the School of Chemistry, University of Hyderabad. We thank the University Grants Commission (India) for their support through the University with Potential for Excellence and Center for Advanced Studies programs, to the University of Hyderabad and School of Chemistry, respectively.
References
- 1.Schmid, H. H. O., P. C. Schmid, and V. Natarajan. 1990. N-Acylated glycerophospholipids and their derivatives. Prog. Lipid Res. 29:1–43. [DOI] [PubMed] [Google Scholar]
- 2.Hansen, H. S., B. Moesgaard, H. H. Hansen, and G. Petersen. 2000. N-Acylethanolamines and precursor phospholipids: relation to cell injury. Chem. Phys. Lipids. 108:135–150. [DOI] [PubMed] [Google Scholar]
- 3.Schmid, H. H. O., P. C. Schmid, and V. Natarajan. 1996. The N-acylation-phosphodiesterase pathway and signaling. Chem. Phys. Lipids. 80:133–142. [DOI] [PubMed] [Google Scholar]
- 4.Hansen, H. H., C. Ikonomidou, P. Bittigau, and H. S. Hansen. 2001. Accumulation of the anadamide precursor and other N-acylethanolamine phospholipids in infant rat models of in vivo necrotic and apoptotic neural death. J. Neurochem. 76:39–46. [DOI] [PubMed] [Google Scholar]
- 5.Hansen, H. H., P. C. Schmid, P. Bittigau, I. Lastres-Becker, F. Berrendero, J. Manzanares, C. Ikonomidou, H. H. O. Schmid, J. J. Fernandez-Ruiz, and H. S. Hansen. 2001. Anandamide, but not 2-arachidonoylglycerol, accumulates during in vivo neurodegeneration. J. Neurochem. 78:1415–1427. [DOI] [PubMed] [Google Scholar]
- 6.Natarajan, V., P. C. Schmid, and H. H. O. Schmid. 1986. N-Acylethanolamine phospholipid metabolism in normal and ischemic rat brain. Biochim. Biophys. Acta. 878:32–41. [DOI] [PubMed] [Google Scholar]
- 7.Moesgaard, B., J. W. Jaroszweski, and H. S. Hansen. 1999. Accumulation of N-acyl-ethanolamine phospholipid in rat brains during post-decapitative ischemia: a 31P NMR study. J. Lipid Res. 40:515–521. [PubMed] [Google Scholar]
- 8.Marsh, D., and M. J. Swamy. 2000. Derivatised lipids in membranes. Physico-chemical aspects of N-biotinyl phosphatidylethanolamines, N-acylphosphatidylethanolamines and N-acylethanolamines. Chem. Phys. Lipids. 105:43–69. [DOI] [PubMed] [Google Scholar]
- 9.Chapman, K. D. 2000. Emerging physiological roles for N-acylphosphatidylethanolamine metabolism in plants: signal transduction and membrane protection. Chem. Phys. Lipids. 108:221–230. [DOI] [PubMed] [Google Scholar]
- 10.Epps, D. E., P. C. Schmid, V. Natarajan, and H. H. O. Schmid. 1979. N-acylethanolamine accumulation in infarcted myocardium. Biochem. Biophys. Res. Commun. 90:628–633. [DOI] [PubMed] [Google Scholar]
- 11.Epps, D. E., V. Natarajan, P. C. Schmid, and H. H. O. Schmid. 1980. Accumulation of N-acylethanolamine glycerophospholipids in infarcted myocardium. Biochim. Biophys. Acta. 618:420–430. [DOI] [PubMed] [Google Scholar]
- 12.Schmid, H. H. O., P. C. Schmid, and E. V. Berdyshev. 2002. Cell signaling by endocannabinoids and their congeners: questions of selectivity and other challenges. Chem. Phys. Lipids. 121:111–134. [DOI] [PubMed] [Google Scholar]
- 13.Devane, W. A., L. Hanus, A. Breuer, R. G. Pertwee, L. A. Stevensen, G. Griffin, D. Gibson, A. Mandelbaum, A. Etinger, and R. Mechoulam. 1992. Isolation and structure of a brain constituent that binds to the cannabinoid receptor. Science. 258:1946–1949. [DOI] [PubMed] [Google Scholar]
- 14.Schuel, H., E. Goldstein, R. Mechoulam, A. M. Zimmerman, and S. Zimmerman. 1994. Anandamide (arachidonylethanolamide), a brain cannabinoid receptor agonist, reduces sperm fertilizing capacity in sea urchins by inhibiting the acrosome reaction. Proc. Natl. Acad. Sci. USA. 91:7678–7682. [DOI] [PMC free article] [PubMed] [Google Scholar]
- 15.Venance, L., D. Piomelli, J. Glowinski, and C. Giaume. 1995. Inhibition of anandamide of gap junctions and intercellular calcium signaling in striatal astrocytes. Nature. 376:590–594. [DOI] [PubMed] [Google Scholar]
- 16.Facci, L., R. Dal Toso, S. Romanello, A. Buriani, S. D. Skaper, and A. Leon. 1995. Mast cells express a peripheral cannabinoid receptor with differential sensitivity to anandamide and palmitoylethanolamide. Proc. Natl. Acad. Sci. USA. 92:3376–3380. [DOI] [PMC free article] [PubMed] [Google Scholar]
- 17.Chapman, K. D., S. Tripathy, B. Venables, and A. D. Desouja. 1998. N-Acylethanolamines: formation and molecular composition of a new class of plant lipids. Plant Physiol. 116:1163–1168. [DOI] [PMC free article] [PubMed] [Google Scholar]
- 18.Ambrosoni, A., E. Bertoli, P. Mariani, E. Tanfani, M. Wozniak, and G. Zolese. 1993. N-Acylethanolamines as membrane topological stress compromising agents. Biochim. Biophys. Acta. 1148:351–355. [DOI] [PubMed] [Google Scholar]
- 19.Domingo, J., M. Mora, and M. A. De Madariaga. 1993. Incorporation of N-acylethanolamine phospholipids into egg phosphatidylcholine vesicles: characterization and permeability properties of the binary systems. Biochim. Biophys. Acta. 1148:308–316. [DOI] [PubMed] [Google Scholar]
- 20.Mercadal, M., J. C. Domingo, M. Bermudez, M. Mora, and M. A. De Madariaga. 1995. N-Palmitoylphosphatidylethanolamine stabilizes liposomes in the presence of human serum: effect of lipidic composition and system characterization. Biochim. Biophys. Acta. 1235:281–288. [DOI] [PubMed] [Google Scholar]
- 21.Cravatt, B. F., and A. H. Lichtman. 2003. Fatty acid amide hydrolase: an emerging therapeutic target in the endocannabinoid system. Curr. Opin. Chem. Biol. 7:469–475. [DOI] [PubMed] [Google Scholar]
- 22.Sun, Y.-X., K. Tsuboi, Y. Okamoto, T. Tonai, M. Murakami, I. Kudo, and N. Ueda. 2004. Biosynthesis of anandamide and N-palmitoylethanolamine by sequential actions of phospholipase A2 and lysophospholipase D. Biochem. J. 380:749–756. [DOI] [PMC free article] [PubMed] [Google Scholar]
- 23.Okamoto, Y., J. Morishita, K. Tsuboi, T. Tonai, and N. Ueda. 2004. Molecular characterization of a phospholipase D generating anandamide and its congeners. J. Biol. Chem. 279:5298–5305. [DOI] [PubMed] [Google Scholar]
- 24.Tsuboi, K., Y.-X. Sun, Y. Okamoto, N. Araki, T. Tonai, and N. Ueda. 2005. Molecular characterization of N-acylethanolamine-hydrolyzing acid amidase, a novel member of the choloylglycine hydrolase family with structural and functional similarity to acid ceramidase. J. Biol. Chem. 280:11082–11092. [DOI] [PubMed] [Google Scholar]
- 25.Ramakrishnan, M., and M. J. Swamy. 1998. Differential scanning calorimetric studies on the thermotropic phase transitions of N-acylethanolamines of odd chainlengths. Chem. Phys. Lipids. 94:43–51. [DOI] [PubMed] [Google Scholar]
- 26.Ramakrishnan, M., and M. J. Swamy. 1999. Molecular packing and intermolecular interactions in N-acylethanolamines: crystal structure of N-myristoylethanolamine. Biochim. Biophys. Acta. 1418:261–267. [DOI] [PubMed] [Google Scholar]
- 27.Kamlekar, R. K., and M. J. Swamy. 2006. Molecular packing and intermolecular interactions in two structural polymorphs of N-palmitoylethanolamine, a type 2 cannabinoid receptor agonist. J. Lipid Res. 47:1424–1433. [DOI] [PubMed] [Google Scholar]
- 28.Ramakrishnan, M., V. Sheeba, S. S. Komath, and M. J. Swamy. 1997. Differential scanning calorimetric studies on the thermotropic phase transitions of dry and hydrated forms of N-acylethanolamines of even chainlengths. Biochim. Biophys. Acta. 1329:302–310. [DOI] [PubMed] [Google Scholar]
- 29.Swamy, M. J., D. Marsh, and M. Ramakrishnan. 1997. Differential scanning calorimetry of chain-melting phase transitions of N-acylphosphatidylethanolamines. Biophys. J. 73:2556–2564. [DOI] [PMC free article] [PubMed] [Google Scholar]
- 30.Ramakrishnan, M., R. Kenoth, R. K. Kamlekar, M. S. Chandra, T. P. Radhakrishnan, and M. J. Swamy. 2002. N-Myristoylethanolamine-cholesterol (1:1) complex: first evidence from differential scanning calorimetry, fast-atom-bombardment mass spectrometry and computational modeling. FEBS Lett. 531:343–347. [DOI] [PubMed] [Google Scholar]
- 31.Swamy, M. J., M. Ramakrishnan, D. Marsh, and U. Würz. 2003. Miscibility and phase behaviour of binary mixtures of N-palmitoylethanolamine and dipalmitoylphosphatidylcholine. Biochim. Biophys. Acta. 1616:174–183. [DOI] [PubMed] [Google Scholar]
- 32.Marsh, D., and A. Watts. 1982. Spin labeling and lipid-protein interactions in membranes. In Lipid-Protein Interactions, Vol. 2. P. C. Jost and O. H. Griffith, editors. Wiley-Interscience, New York. 53–126.
- 33.Akoka, S., C. Tellier, C. LeRoux, and D. Marion. 1988. A phosphorus magnetic resonance and a differential scanning calorimetry study of the physical properties of N-acylphosphatidylethanolamines in aqueous dispersions. Chem. Phys. Lipids. 46:43–50. [Google Scholar]
- 34.Marsh, D. 1990. Handbook of Lipid Bilayers. CRC Press, Boca Raton, FL.
- 35.Seddon, J. M., G. Cevc, and D. Marsh. 1983. Calorimetric studies of the gel-fluid (Lβ-Lα) and lamellar-inverted hexagonal (Lα-HII) phase transitions in dialkyl- and diacylphosphatidylethanolamines. Biochemistry. 22:1280–1289. [DOI] [PubMed] [Google Scholar]
- 36.Ramakrishnan, M., D. Marsh, and M. J. Swamy. 2001. Interaction of N-myristoyldimyristoylphosphatidylethanolamine with dimyristoylphosphatidylcholine investigated by differential scanning calorimetry: binary phase diagram. Biochim. Biophys. Acta. 1512:22–26. [DOI] [PubMed] [Google Scholar]


