Abstract
Neonatal exposure to ethanol in rats, during the period of brain development comparable to that of the human third trimester, produces significant, dose-dependent cell loss in the cerebellum and deficits in coordinated motor performance. These rats are also impaired in eyeblink conditioning as weanlings and as adults. The current study examined single-unit neural activity in the interpositus nucleus of the cerebellum in adults following neonatal binge ethanol exposure. Group Ethanol received alcohol doses of 5.25 g/kg/day on postnatal days 4–9. Group Sham Intubated underwent acute intragastric intubation on postnatal days 4–9 but did not receive any infusions. Group Unintubated Control (from separate litters) did not receive any intubations. When rats were 3–7 mo old, pairs of extracellular microelectrodes were implanted in the region of the interpositus nucleus. Beginning 1 wk later, the rats were given either 100 paired or 190 unpaired trials per day for 10 d followed by 4 d of 100 conditioned stimulus (CS)-alone trials per day. As in our previous study, conditioned response acquisition in Group Ethanol rats was impaired. In addition, by session 5 of paired acquisition, Group Sham Intubated and Group Unintubated Control showed significant increases in interpositus nucleus activity, relative to baseline, in the CS–unconditioned stimulus interval. In contrast, Group Ethanol failed to show significant changes in interpositus nucleus activity until later in training. These results indicate that the disruption in eyeblink conditioning after early exposure to ethanol is reflected in alterations in interpositus nucleus activity.
Early exposure to alcohol in humans is known to produce a variety of behavioral and neural abnormalities (for reviews, see Mattson and Riley 1998; Roebuck et al. 1998; Streissguth and O'Malley 2000). In some cases of heavy prenatal exposure to alcohol, fetal alcohol syndrome (FAS) can be diagnosed by the presence of the constellation of facial dysmorphology, growth deficiency, and central nervous system damage in the affected child. The development of animal models of FAS has been essential in understanding, at a detailed level, some of the behavioral and neural abnormalities associated with early exposure to alcohol (Hannigan 1996; Goodlett and Johnson 1999). This research has revealed that cortical, hippocampal, basal gangliar, and cerebellar areas are particularly vulnerable to the teratogenic effects of alcohol, and that the vulnerability of specific brain structures changes over stages of development.
Much recent research has concentrated on cerebellar abnormalities that occur in conjunction with early exposure to alcohol. The use of a neonatal rat model of binge alcohol exposure during the period of brain development comparable to that of the human third trimester has been critical to this research. This model involves exposing neonatal rats to high doses of alcohol over a short period of time via either a chronic (Diaz and Samson 1980; West 1993) or an acute (Sonderegger et al. 1982; Light et al. 1998) intragastric infusion procedure. Either of these procedures allows control of the dose, pattern, and resulting profile of blood alcohol concentrations produced (BACs) while administering alcohol during a stage of brain development that is vulnerable to environmental insults (Goodlett and Johnson 1999). These are critical factors when cross-species comparisons of the effects of alcohol are made.
Research using this model has shown that BACs in excess of 200 mg/dL produce significant loss of Purkinje cells in neonatal rats that increases with increasing BACs (Bonthius and West 1990; Hamre and West 1993; Marcussen et al. 1994). More recent studies have confirmed and extended these findings using unbiased stereological procedures, in which estimates of the total number of cells in a structure are not affected by changes in cell density (Napper and West 1995a; Pauli et al. 1995; Goodlett and Lundahl 1996; Goodlett and Eilers 1997; Goodlett et al. 1997; Goodlett et al. 1998; Miki et al. 1999). Cell loss is greatest during the early stages of Purkinje cell dendritic outgrowth and synaptogenesis (which occurs in rats on postnatal days [PDs] 4–9). Less Purkinje cell loss occurs with binge exposure during neurogenesis (which occurs in rats on prenatal days 13–16) (Marcussen et al. 1994), or during later differentiation (Hamre and West 1993). PD days 4–6 appear to be the period of greatest vulnerability, with a dose-related loss of Purkinje cells that can reach 50%–60% of control values (Thomas et al. 1998; Goodlett and Eilers 1997; Goodlett and Lundahl 1997). Early binge exposure to ethanol also produces loss of cells in the inferior olive (Napper and West 1995b), a brainstem area that is the source of climbing fiber projections to Purkinje cells. We have recently shown that early exposure to ethanol produces loss of cerebellar deep nuclear cells (J.T. Green, T. Tran, J.E. Steinmetz, and C.R. Goodlett, in prep.), the target cells of Purkinje cells and the final relay for the majority of cerebellar output to other brain regions.
Rats exposed to binge levels of ethanol as neonates show disrupted performance in motor tasks thought to require an intact cerebellum (Meyer et al. 1990; Goodlett et al. 1991; Goodlett and Lundahl 1996; Thomas et al. 1998). However, the precise nature of cerebellar engagement by these tasks is not well defined, making correlations between cell loss and behavioral performance somewhat difficult to interpret. Furthermore, it is difficult to separate learning from performance deficits with these tasks. A task that is particularly well suited to addressing these issues is eyeblink classical conditioning. In eyeblink classical conditioning, a conditioned stimulus (CS), which initially elicits no response, precedes an unconditioned stimulus (US), which elicits a reflexive, or unconditioned response in the form of an eyeblink. Learning is shown by the occurrence of eyeblinks after the CS but before the US (conditioned responses; CRs).
An extensive body of research in rabbits, using a variety of approaches, has characterized the brainstem-cerebellar substrates of eyeblink conditioning (for review, see Steinmetz 2000). The auditory or visual CS is thought to project to cerebellar cortex and deep nuclei via mossy fibers arising from lateral pontine nuclei. The somatosensory US is hypothesized to project to cerebellar cortex and deep nuclei via climbing fibers arising from the dorsal accessory olive. One of the deep nuclei, the interpositus nucleus ipsilateral to the eye that receives the US, appears to be the site of plasticity for learning the CR. Overlying cerebellar cortex seems to play at least a modulatory role in learning eyeblink conditioning, perhaps through control of the amplitude and timing of CRs. These substrates appear to be the same in the rat (Freeman et al. 1995; Skelton 1988; Freeman and Nicholson 1999; Rogers et al. 2001). In addition to knowledge of the neural circuitry engaged by eyeblink conditioning, control procedures, such as unpaired presentations of the CS and US, allow separation of performance factors from learning.
Knowledge of the precise cerebellar substrates of eyeblink conditioning makes it particularly useful for assessing the effects of early exposure to alcohol on the developing cerebellum (for review, see Steinmetz et al. 2001). Studies have shown that rats exposed to a high dose of alcohol on PDs 4–9 are impaired in eyeblink conditioning both as weanlings (23–24 d old) (Stanton and Goodlett 1998) and as adults (>3 mo old) (Green et al. 2000). Given that the number of deep nuclear neurons is highly correlated with the rate of acquisition of eyeblink conditioning ( J.T. Green, T. Tran, J.E. Steinmetz, and C.R. Goodlett, in prep.), deficits in eyeblink conditioning in rats exposed to binge levels of ethanol as neonates may be directly caused by neuronal depletion in the deep nuclei, particularly in the interpositus nucleus.
The purpose of the present study was to assess activity of interpositus nucleus neurons during eyeblink conditioning in adult rats after neonatal exposure to binge levels of ethanol. Although we have confirmed that deep nuclear neurons are lost after neonatal exposure to binge levels of ethanol, we do not know if those that remain show normal activity during eyeblink conditioning. The current study shows that adult interpositus nucleus neurons show a delay in the development conditioning-related activity after neonatal exposure to binge levels of ethanol.
RESULTS
Histology
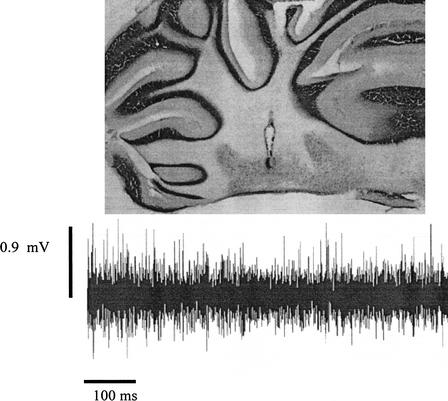
Electrode tracks and marking lesions were used to confirm electrode placement. Forty-seven rats (29 underwent paired conditioning; 18 underwent unpaired conditioning) had electrode placements in the region of the left interpositus nucleus, distributed throughout the dorsal–ventral extent. Group totals were as follows: Group Paired Ethanol (EtOH; n = 9); Group Paired Sham Intubated (SI; n = 11); Group Paired Unintubated Control (UC; n = 9); Group Unpaired EtOH (n = 5); Group Unpaired SI (n = 6); and Group Unpaired UC (n = 7). An additional 19 rats had placements outside of the interpositus nucleus, most commonly in either white matter just dorsal to the interpositus nucleus or in brainstem areas somewhat ventral to the interpositus nucleus, such as the dorsal cochlear nucleus or the lateral vestibular nucleus. Only data from the 47 rats with placements in the interpositus nucleus are described. Note that because of technical difficulties, data from extinction sessions for one rat from Group EtOH and three rats from Group UC were not available for analysis. Figure 1 shows a typical electrode placement, along with a sample of spontaneous neural activity recorded from this location during adaptation.
Figure 1.
An example of a microelectrode placement in the ipsilateral interpositus nucleus and corresponding spontaneous unit activity from this site.
Blood Alcohol Concentrations
Blood samples were available for 11 of 14 EtOH-treated animals with a confirmed interpositus nucleus electrode placement. The mean BAC of these 11 rats on PD 6 was 344 (±36 SEM) mg/dL.
Spike Separation
Mean threshold for detecting spikes across all treatment groups was 0.39 mV. There were no differences between treatment groups in threshold for detecting spikes. For paired groups, a total of 19–26 units were separated per group per session. For unpaired groups, a total of 10–18 units were separated per group per session. Mean number of units separated per animal per session was approximately two across all treatment and training groups. Given that our previous study established that rats from Group EtOH have about 50% fewer deep nuclear neurons than do control groups (J.T. Green, T. Tran, J.E. Steinmetz, and C.R. Goodlett, in prep.), one might expect that we would have recorded from fewer neurons in this group. However, assuming uniform loss of cells in the interpositus nucleus (which is our working assumption), loss of neurons in the interpositus nucleus in rats from Group EtOH would be expected to result in depressed background activity as well (i.e., the signal-to-noise ratio would be the same in Group EtOH as in the control groups), allowing discrimination of similar numbers of units in Group EtOH and control groups, even though fewer units exist in Group EtOH. In addition, we limited spike separation to no more than the three best units per rat in any one session. It is possible that more than three units would be separable in control groups, whereas three was approaching the limit in Group EtOH.
Adaptation
During adaptation, all rats received 20 presentations of periocular stimulation followed by 20 presentations of the tone CS. Eyeblink responses to the 20 presentations of the tone were analyzed using a one-way analysis of variance (ANOVA). Adaptation data were available for 46 of 47 rats. There was no difference between treatment groups in either the percentage of eyeblink responses, F(2,43) = 1.72, P > 0.05 or in the amplitude of eyeblink responses, F(2,43) = 1.71, P > 0.05. Average percentage of spontaneous eyeblink responses to the tone (during the 81–350 msec after the tone in which we measured CRs during acquisition) on these initial exposures was 33.7%.
Baseline firing rates (spikes per second) for 350 msec before US onset on the 20 US-alone trials and for 350 msec before CS onset on the 20 CS-alone trials were calculated. A one-way ANOVA revealed no difference between treatments for either baseline firing rate before periocular stimulation onset, F(2,89) = 2.37, P > 0.05 or baseline firing rate before CS onset, F(2,93) = 0.99, P > 0.05. Mean firing rates before periocular stimulation onset were 35.9 (±6.6 SEM) spikes/sec for Group EtOH, 28.4 (±6.0 SEM) spikes/sec for Group SI, and 47.4 (±6.4 SEM) spikes/sec for Group UC. Mean firing rates before CS onset were 46.7 (±7.7 SEM) spikes/sec for Group EtOH, 38.9 (±7.2 SEM) spikes/sec for Group SI, and 53.5 (±7.5 SEM) spikes/sec for Group UC. See Figure 1 for an example of unit activity during adaptation.
Paired Groups
Acquisition: Behavior
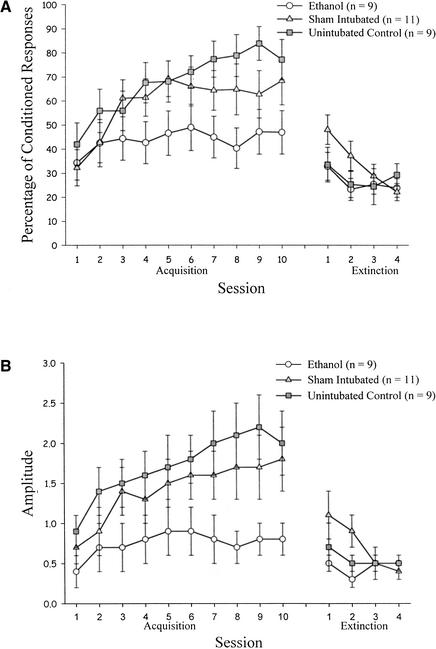
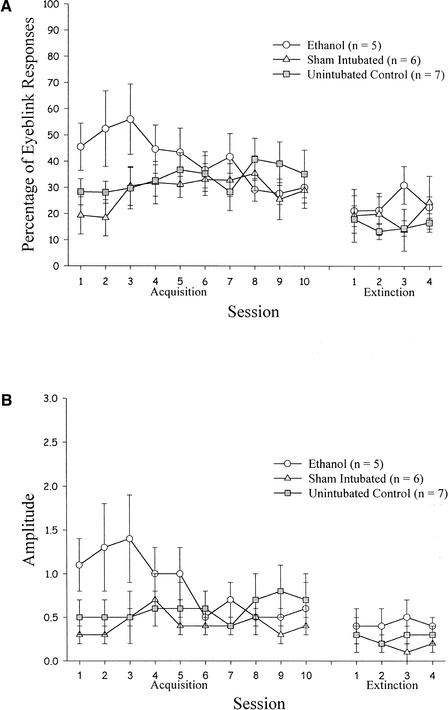
Data from the 29 rats that underwent paired eyeblink conditioning were analyzed. Group EtOH attained a lower asymptote of learning than did control groups, whether measured by percentage of CRs or CR amplitude, that was comparable to our previous study (Green et al. 2000). Groups SI and UC did not attain quite as high an asymptote as in our previous study.
These results were confirmed by statistical analyses. Learning for the rats that underwent paired eye-blink conditioning was analyzed with a 3 (treatment: EtOH, SI, UC) × 10 (acquisition session) repeated-measures ANOVA with percentage of CRs as the dependent measure. This analysis revealed a significant effect of session, F(9, 234) = 7.44, P < 0.001. Although the percentage of CRs was consistently lower in Group EtOH compared with control groups, the treatment effect did not quite attain statistical significance (P = .064). A second ANOVA with CR amplitude as the dependent measure revealed a significant effect of session, F(9, 234) = 7.55, P < 0.001, and a significant effect of treatment, F(2,26) = 3.40, P < 0.05. Post hoc Tukey's Honestly Significant Difference (HSD) tests revealed a significant difference between Group EtOH and Group UC, with Group SI performing intermediate to, but not significantly different from either of them (Fig. 2).
Figure 2.
Learning in treatment groups that received paired eyeblink conditioning as a function of acquisition and extinction session. (A) Percentage of conditioned eyeblink responses. (B) Amplitude of eyeblink responses.
The lack of a statistically significant difference between Group EtOH and Group SI was surprising, given the results of our previous study (Green et al. 2000). The current results can be attributed to two rats in Group SI who conditioned exceptionally poorly. Without these two rats, there were clear and consistent significant differences between Group EtOH and Group SI in both percentage of CRs and CR amplitude.
Comparisons were conducted between paired and unpaired training for each treatment group to assess further the issue of whether Group SI performed differently from Group EtOH and similarly to Group UC. For each treatment group, a 2 (training: paired, unpaired) × 10 (session) ANOVA with percentage of CRs as the dependent measure was conducted. For Group EtOH, this analysis revealed no significant effects. In contrast, for Group SI, this analysis revealed a significant effect of session, F(9,135) = 3.32, P < 0.01, whereas the effect of training just missed attaining significance, F(1,15) = 3.68, P = 0.07. For Group UC, this analysis revealed a significant training × session interaction, F(9, 126) = 1.89, P = 0.05. Post hoc one-way ANOVAs comparing training within each session revealed that rats in Group UC receiving paired training showed a significantly higher percentage of CRs in sessions 4, 6, 7, 9, and 10 (P's = 0.006 to 0.05).
A similar set of analyses was conducted with CR amplitude as the dependent measure. For Group EtOH, this analysis revealed a significant training × session interaction effect, F(9,108) = 2.19, P < 0.05. Post hoc one-way ANOVAs comparing training within each session revealed that Group EtOH rats differed significantly in CR amplitude only in session 1, in which rats that received unpaired training actually outperformed those that received paired training. For Group SI, this analysis also revealed a significant training × session interaction effect, F(9,135) = 1.92, P = 0.05. In contrast to Group EtOH, however, post hoc ANOVAs revealed a significantly higher CR amplitude in Group SI rats that underwent paired training compared with those that underwent unpaired training in sessions 4–7, 9, and 10. Finally, for Group UC, this analysis revealed significant effects of training, F(1,14) = 5.68, P < 0.05 and session, F(9,126) = 3.54, P < 0.01. Group UC rats that underwent paired training showed a significantly higher CR amplitude than did Group UC rats that underwent unpaired training across all sessions.
Acquisition: Unit Activity
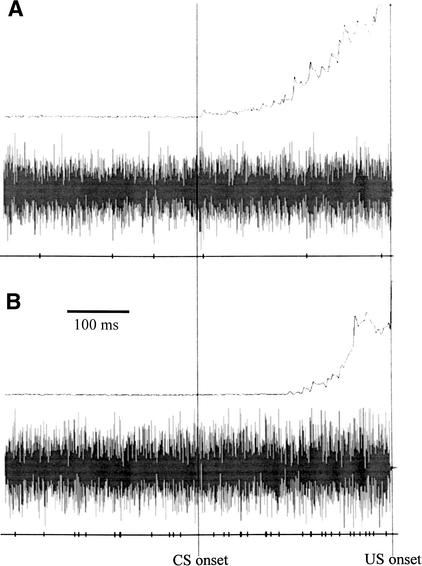
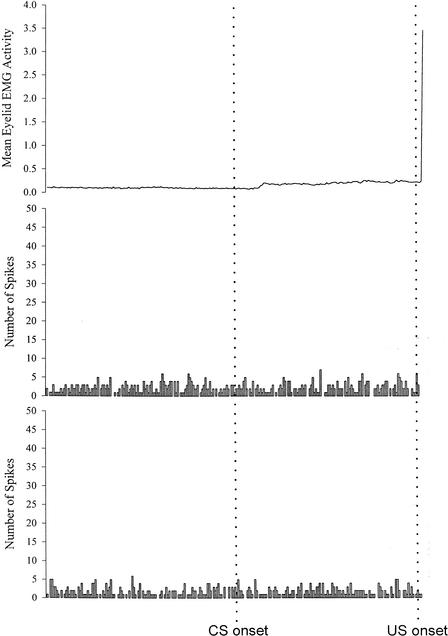
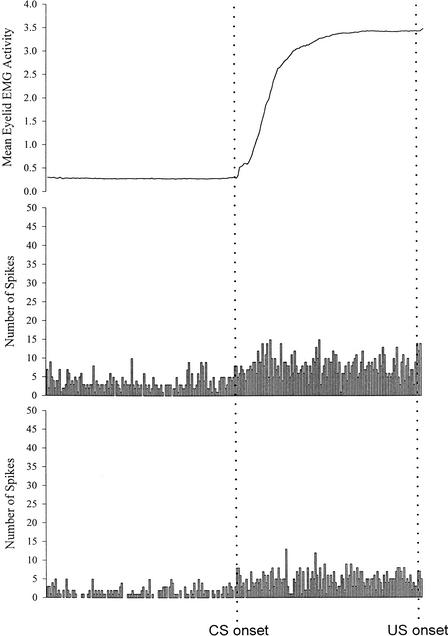
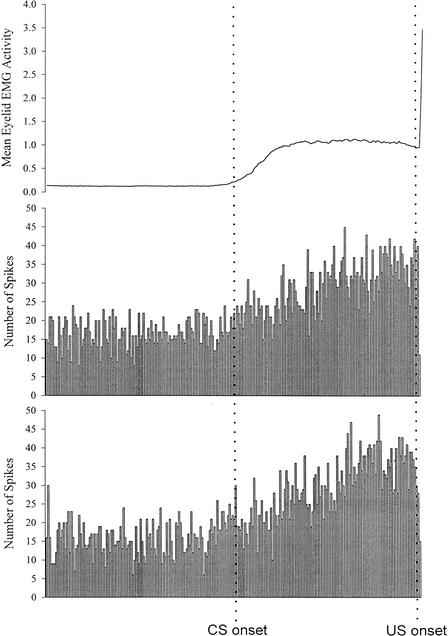
Baseline firing rates (spikes per second) were calculated across all paired trials of a session for the 350-msec period before the tone CS onset. Separate one-way ANOVAs for sessions 1, 5, and 10 comparing treatment groups, with baseline firing rate as the dependent measure, revealed no difference in baseline firing rate. Collapsed across sessions, mean baseline firing rate was 38.1 (±3.2 SEM) spikes/sec for Group EtOH, 47.0 (±3.1 SEM) spikes/sec for Group SI, and 52.1 (±3.2 SEM) spikes/sec for Group UC. Figure 3 shows an example of behavioral and unit activity on a CR trial recorded in session 5 of acquisition in a rat from Group EtOH (Fig. 3A) and a rat from Group UC (Fig. 3B).
Figure 3.
Rectified and integrated eyelid EMG activity (top trace), interpositus nucleus activity (middle trace), and tick marks representing action potentials of a discriminated unit (bottom trace) on a CR trial during session 5 of paired eyeblink conditioning in a rat from (A) Group EtOH and (B) Group UC.
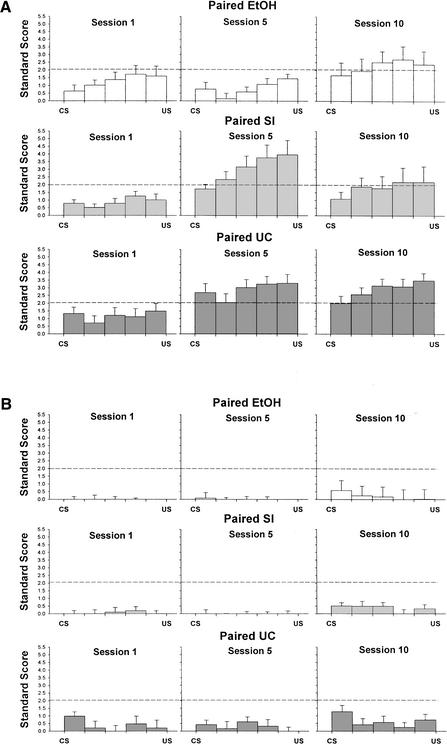
The analysis of changes in firing from baseline to the CS–US interval can be summarized as follows: (1) when a CR was executed, activity increased during the CS–US interval; in the middle of training, Groups SI and UC showed greater increases between 80 and 280 msec after CS onset than did Group EtOH; and (2) when no CR was executed, changes in activity from baseline to the CS–US interval were minimal and did not differ between treatment groups.
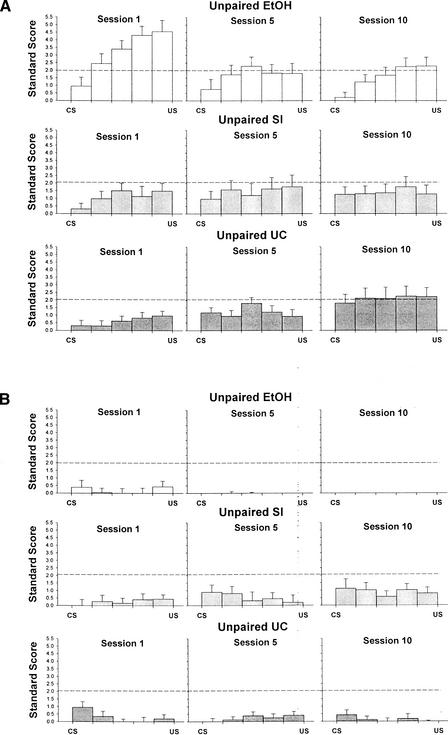
To examine changes in firing from baseline to the CS–US interval, we analyzed standard scores of neural activity separately for five 70-msec periods during the CS–US interval for acquisition sessions 1, 5, and 10 with a 3 (treatment: EtOH, SI, UC) × 5 (period) repeated-measures ANOVA with treatment as a between-subjects factors and period as a within-subjects factor. Analyses were conducted separately for CR and non-CR trials. On CR trials, there were no differences between treatment groups at the beginning of acquisition (session 1) or at the end of acquisition (session 10). In contrast, a significant period × treatment interaction was observed in session 5, F (8,256) = 2.26, P = 0.024. Examination of the interaction effect using one-way ANOVAs comparing treatment groups in each period revealed differences between treatment groups in all five periods, P's = 0.03 to 0.003. Post hoc Tukey's HSD tests showed that Group EtOH showed significantly less interpositus nucleus activation on CR trials compared with both Group SI and Group UC in periods 2–4 and less activation compared with Group UC in period 1 and Group SI in period 5 (Fig. 4A). Similar analyses of non-CR trials revealed only a significant effect of period in session 10, F (4,224) = 3.88, P < 0.01 caused by a significant linear decrease in activation across periods that was similar in all treatment groups (Fig. 4B).
Figure 4.
Standard scores for sessions 1, 5, and 10 of paired eyeblink conditioning as a function of the 70-msec period during the CS–US interval for each treatment group on (A) paired trials with a CR; (B) paired trials without a CR. A standard score of approximately 2.0 represents a significant increase in activity above baseline.
Representative examples of mean behavioral and summed unit activity across CR trials in session 5 of paired acquisition for a rat from each treatment group are shown in Figures 5–7.
Figure 5.
Mean rectified and integrated eyelid EMG activity (top trace) and summed peristimulus time histograms for two separate units recorded from a Group Ethanol rat on trials with a CR during session 5 of paired eyeblink conditioning.
Figure 7.
Mean rectified and integrated eyelid EMG activity (top trace) and summed peristimulus time histograms for two separate units recorded from a Group Unintubated Control rat on trials with a CR during session 5 of paired eyeblink conditioning.
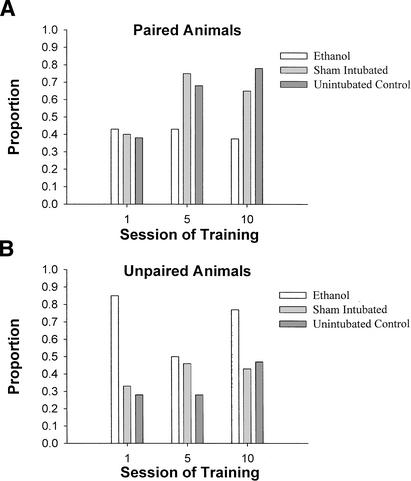
The analyses of standard scores were supported by calculation of the proportion of neurons showing significant activation in periods 4 and/or 5 on CR trials but not on non-CR trials during the CS–US interval. These neurons are the strongest candidates for conditioning-related units. Fewer of these potential conditioning-related neurons showed significant activation in sessions 5 and 10 in Group EtOH compared with control groups (Fig. 8A).
Figure 8.
Proportion of neurons showing significant activation in the (A) last 140 msec of the CS–US interval on CR trials but not on non-CR trials, as a function of a paired acquisition session and (B) the equivalent interval on CS-alone trials with an eyeblink but not on trials without an eyeblink, as a function of an unpaired training session.
Acquisition: Relationship Between Behavior and Unit Activity
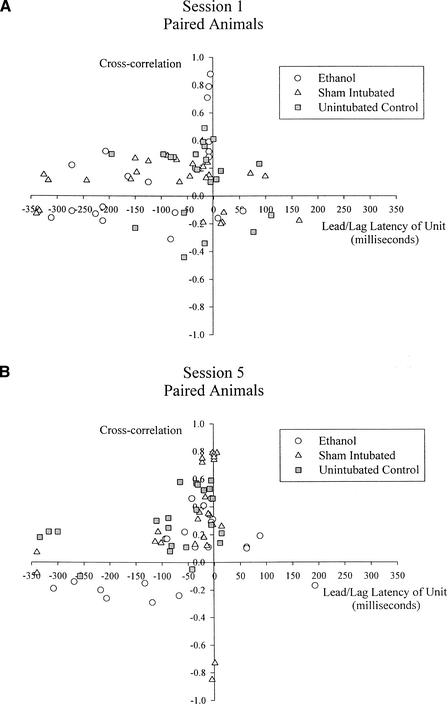
Cross-correlations between eyelid electromyographic (EMG) activity during eyeblink conditioning and interpositus nucleus activity for each paired acquisition session were calculated across all paired trials that were not discarded because of excessive eyelid activity in the pre-CS period. Separate one-way ANOVAs for sessions 1, 5, and 10 comparing treatment groups were calculated using the maximum correlation coefficient as the dependent measure. This analysis revealed a significant treatment effect in session 5, F(2,63) = 5.77, P < 0.01. Post hoc Tukey's HSD tests showed that Group EtOH had a significantly lower cross-correlation coefficient in session 5 compared with both Group SI (P = 0.006) and Group UC (P = 0.030) but Groups SI and UC did not differ. A similar set of analyses conducted using the lead/lag latency of the cross-correlation coefficient (i.e., the latency by which interpositus nucleus activity preceded or followed eyelid EMG activity) as the dependent measure revealed a difference between treatment groups in session 1, F(2,63) = 3.59, P = 0.033. Post hoc Tukey's HSD tests showed that Group EtOH had a significantly shorter amount of time between behavior onset and unit onset compared with Group UC (P = 0.027) in session 1. Figure 9 shows a scatterplot of cross-correlations from sessions 1 and 5 of paired acquisition.
Figure 9.
Scatterplot of cross-correlation coefficients and lead/lag latencies during paired eyeblink conditioning in (A) session 1 and (B) session 5.
Extinction: Behavior
A 3 (treatment: EtOH, SI, UC) × 4 (extinction session) ANOVA with percentage of CRs as the dependent measure revealed a significant interaction effect, F(6,60) = 2.38, P = 0.039. Further analysis, using separate one-way ANOVAs comparing treatment groups in each extinction session separately, revealed no significant difference between treatment groups in any individual extinction session, (P's = 0.16 to 0.82). Results were similar with CR amplitude as the dependent measure (see Fig. 2).
Extinction: Unit Activity
To examine changes in firing from baseline to the post-CS interval, standard scores of neural activity for five 70-msec periods after CS onset were analyzed separately for extinction session 1 and 4 with a 3 (treatment: EtOH, SI, UC) × 5 (period) repeated-measures ANOVA with treatment as a between-subjects factors and period as a within-subjects factor. Analyses were conducted separately for CR and non-CR trials. On CR trials, there were no differences between treatment groups at the beginning (session 1) or end (session 4) of extinction, but there were significant effects of period for both sessions, P's < 0.01. Standard scores increased linearly across post-CS periods on trials with a CR and this pattern was similar across treatment groups. On trials without a CR, there were no significant effects in session 1 but, in session 4, there was a significant effect of period, F(4,176) = 4.97, P = 0.001 and treatment, F(2,44) = 4.02, P = 0.025. In the last session of extinction, standard scores increased linearly across post-CS periods on trials without a CR and were larger in Group UC compared with Group EtOH.
Unpaired Groups
Training: Behavior
Data from the 18 rats that underwent unpaired training were analyzed. Responses to CS-alone presentations were analyzed with a 3 (treatment: EtOH, SI, UC) × 10 (training session) ANOVA with percentage of eyeblinks as the dependent measure. This analysis revealed no significant effects. A similar analysis with eyeblink amplitude as the dependent measure also revealed no significant effects. These results indicated that nonassociative responses to the tone were no different in the EtOH rats compared with controls. Furthermore, responding to the tone remained stable across sessions. Average percentage of eyeblinks to the tone across groups and sessions was 33.9%, which was almost identical to the average spontaneous percentage of eyeblinks to the tone during adaptation (see Fig. 10). Although not statistically significant, we did note that tone-evoked responses were relatively high in the EtOH rats compared with other rats on sessions 1 to 3. The higher level of responding disappeared, however, after the fourth session.
Figure 10.
Eyeblink responses in treatment groups that received unpaired training, as a function of training and extinction session. (A) Percentage of eyeblink responses. (B) Amplitude of eyeblink responses.
Training: Unit Activity
To examine changes in firing from baseline to the post-tone interval for the unpaired groups, standard scores of neural activity for five 70-msec periods during the post tone interval were analyzed separately for training sessions 1, 5, and 10 with a 3 (treatment: EtOH, SI, UC) × 5 (period) repeated-measures ANOVA with treatment as a between-subjects factors and period as a within-subjects factor. Analyses were conducted separately for trials with an eyeblink response and trials without an eyeblink response. For trials with an eyeblink response, this analysis revealed significant period x treatment interaction effects for session 1, F(8,172) = 5.37, P < 0.001, session 5, F(8,160) = 2.20, P = 0.030, and session 10, F(8,164) = 3.01, P < 0.01. For session 1, examination of the interaction effect using one-way ANOVAs comparing treatment groups in each period revealed significant differences between treatment groups for periods 2–5, P's < 0.02. Post-hoc Tukey's HSD tests showed that Group EtOH showed a significantly higher standard score compared to Group UC in period 2 (P < 0.01), and compared to both Group SI and Group UC in periods 3–5 (P's < 0.02). For sessions 5 and 10, examination of the interaction effect revealed no difference between treatment groups in any period, although the F-values varied widely and approached significance for period 1 of session 10 (Fig. 11A).
Figure 11.
Standard scores for sessions 1, 5, and 10 of unpaired eyeblink conditioning as a function of the 70-msec period during the post-CS interval for each treatment group on (A) CS-alone trials with an eyeblink response and (B) CS-alone trials without an eyeblink response. A standard score of approximately 2.0 represents a significant increase in activity above baseline.
The same analyses were performed for tone presentations with no eyeblink response. These analyses revealed no significant effects for session 1 or 5. For session 10, a significant treatment effect was revealed, F(2,41) = 7.54, P < 0.01. Post-hoc Tukey's HSD tests showed that Group EtOH had significantly less change in interpositus nucleus activity from the pre-tone to the post-tone interval compared to Group SI (P = 0.001). (Fig. 11B). The results of the standard score analysis were supported by the proportion of neurons that showed significant activation in periods 4 and/or 5 on trials with a response but not on trials without a response (see Fig. 8B).
DISCUSSION
Learning and Interpositus Nucleus Activity in Ethanol-Exposed Rats
As in our previous study (Green et al. 2000), rats exposed to binge levels of ethanol as neonates were impaired in acquisition of 350-msec delay eyeblink conditioning as adults. Deficits did not appear quite as large in the current study because the control animals did not perform quite as well as previously. In particular, two rats in Group SI performed exceptionally poorly compared with the other nine rats in Group SI in the current study and the eight rats in Group SI in our previous study. Comparisons between rats that received paired training versus those that received unpaired training in each treatment group showed that rats in Group EtOH showed no differences in performance (except for session 1) whether they received paired or unpaired training, whereas rats in Group SI and rats in Group UC that underwent paired training almost always differed from their counterparts that underwent unpaired training in sessions 4 to 10. Overall, in the current study, as in our previous study, there appear to be learning deficits in adult rats exposed to binge levels of ethanol as neonates in that they always learned eyeblink conditioning more poorly than did unintubated controls. Rats that undergo sham intubation usually perform somewhat more poorly than unintubated controls but better than ethanol-exposed rats, indicating that the stress of the intubation procedure may have some long-term effects on eyeblink conditioning. However, the effects of early exposure to binge levels of ethanol on eyeblink conditioning in adult rats are clearly a greater factor than is the stress of the intubation procedure in producing deficits in adult eyeblink conditioning.
The learning deficits in Group EtOH rats do not appear to be due to a simple inability to perform an eyeblink, as indicated by (1) similar numbers of spontaneous blinks in ethanol-exposed and control rats (Green et al. 2000); (2) similar number of startle responses to the tone in ethanol-exposed and control rats (Green et al. 2000); and (3) similar eyelid EMG activity to periorbital stimulation in ethanol-exposed and control rats (J.T. Green and J.E. Steinmetz, unpubl.). Also, in agreement with our previous study, there were no significant behavioral differences between treatment groups during unpaired training, although there was some initial heightened responding in Group EtOH. In contrast to our previous study, no differences were noted between groups during extinction training after either paired or unpaired training.
In addition to behavioral deficits in the ability to acquire CRs in eyeblink conditioning, adult rats that had been exposed to binge levels of ethanol as neonates showed patterns of interpositus nucleus activity that differed from both sham intubated and unintubated controls. Overall baseline firing rates were similar across treatment groups and were approximately 28–54 Hz, which accords well with previous studies of extracellular deep nuclear activity in cats (Gruart and Delgado-Garcia 1994) and rabbits (Berthier and Moore 1990). However, during paired acquisition, there was a slower-than-normal engagement of interpositus nucleus neurons during eyeblink conditioning in Group EtOH. Although both Group SI and Group UC showed similar and significant unit activation in the CS–US interval by session 5 on trials when a CR was executed, Group EtOH did not show this pattern until the end of acquisition. This delayed pattern of interpositus nucleus activation in Group EtOH indicates that these rats may be capable of eventually exhibiting the level of CRs shown by control groups and further indicates that CS and US input pathways to the interpositus nucleus must be at least somewhat intact. The most likely explanation of the delayed activation of the interpositus nucleus in Group EtOH during eyeblink conditioning is that these rats have fewer interpositus nucleus neurons available to become plastic, although abnormalities in cerebellar cortex, inferior olive, and pontine nuclei cannot be ruled out. It is important to note, however, that these results indicate that the interpositus nucleus remains, functionally as well as structurally, partially intact after exposure to binge levels of ethanol during the brain growth spurt.
A cross-correlation analysis between behavior and unit activity across trials further strengthened the conclusion that CR-related interpositus nucleus activity in Group EtOH was slow to develop during eyeblink classical conditioning. Cross-correlations were lowest in Group EtOH in session 5 of paired acquisition, indicating less connection between behavior and interpositus nucleus activity. Analysis of the proportion of units showing significant activation around the time that CRs were executed indicates that this difference in activation patterns was due to fewer units showing significant activation in Group EtOH, rather than to an overall depression of unit activity. This accords well with the fact that Group EtOH has fewer cells in the deep nuclei (J.T. Green, T. Tran, J.E. Steinmetz, and C.R. Goodlett, in prep.) and supports our conclusion that there are still plastic units in the interpositus nucleus of adult rats exposed to binge levels of ethanol as neonates, but they have been reduced in number.
Activation of interpositus nucleus units in ethanol-exposed rats during the initial sessions of unpaired training was observed when eyeblinks were executed. This heightened activation disappeared later in training, but there was still evidence of some activation of interpositus nucleus units on trials with an eyeblink during unpaired training in all treatment groups. Although the interpositus nucleus does not show activation in the absence of CRs in rabbits (Gould and Steinmetz 1996), it is important to note that rabbits rarely blink at all during unpaired training. In contrast, rats (much like humans), appear to blink spontaneously quite often. Given the activation of deep nuclear neurons during eyeblinks (Gruart and Delgado-Garcia 1994), it is not surprising that we observed some activation during unpaired training. However, in contrast to paired acquisition, unit activation during unpaired training was generally lower and did not increase across sessions. Thus, these units may have been coding the eyeblink itself, but did not appear to be showing learning-related plasticity.
Possible Mechanisms for Differences in Interpositus Nucleus Activity Between Ethanol-Exposed and Control Rats
There are several possible reasons (which are not mutually exclusive) for why we observed delayed learning-related activity in the interpositus nucleus of rats exposed to binge levels of ethanol as neonates: (1) loss of interpositus nucleus cells; (2) loss of Purkinje cells; and (3) loss of inferior olivary cells.
One possible explanation for our results is that rats exposed to binge levels of ethanol as neonates had fewer interpositus nucleus cells available to become plastic. Recently, we have shown that adult rats have fewer deep nuclear neurons after early exposure to binge levels of ethanol (J.T. Green, T. Tran, J.E. Steinmetz, and C.R. Goodlett, in prep.). In the current study, ethanol-exposed rats did not develop strong conditioning-related activity in the interpositus nucleus during eyeblink conditioning until late in acquisition. If eyeblink conditioning normally engages a population of interpositus nucleus neurons and some of this population is missing, conditioning-related activity of individual neurons of the population may be reduced. This reduced conditioning-related activity may not be enough to consistently generate a CR. The fact that we saw some conditioning-related activity in ethanol-exposed rats agrees with the finding that these rats do learn during eyeblink conditioning, but not as well as controls. Thus, ethanol-exposed rats have some interpositus nu- cleus neurons remaining that can become plastic, but the number is significantly reduced compared with control rats. We were able to find similar numbers of units across treatment groups but we were unable to find similar numbers of conditioning-related units across treatment groups.
A second possible explanation for our results is that rats exposed to binge levels of ethanol as neonates had fewer Purkinje cells available and that this directly affected interpositus nucleus activity. Numerous studies have shown that early exposure to binge levels of ethanol reduces Purkinje cell numbers in a dose-dependent manner, with severe loss at high binge doses (Napper and West 1995a; Pauli et al. 1995; Goodlett and Lundahl 1996; Goodlett and Eilers 1997; Goodlett et al. 1997; Goodlett et al. 1998; Miki et al. 1999). The interpositus nucleus receives inhibitory afferents from Purkinje cells. It is possible that there were not enough Purkinje cells to properly shape interpositus nucleus activity for generation of CRs in ethanol-exposed rats. Damage to cerebellar cortex before training, in the absence of damage to the interpositus nucleus, is known to slow the rate of eyeblink conditioning in rabbits with permanent or reversible lesions (Lavond and Steinmetz 1989; Clark et al. 1997), rats with fewer cortical cells because of neonatal treatment with an antimitotic agent (Freeman et al. 1995), and mutant mice that lose all of their Purkinje cells as preweanlings (Chen et al. 1996). Although it is possible that damage to the interpositus nucleus in ethanol-exposed animals is secondary to loss of Purkinje cells in causing deficits in eyeblink conditioning, it seems unlikely that damage to the critical substrate would not play a key role in slower eyeblink conditioning. Fewer Purkinje cells is likely to play a role secondary to loss of cells in the interpositus nucleus in the deficits we observed. It may be the case that additional interpositus nucleus units would become plastic if a full complement of Purkinje cells were available, perhaps through control of plasticity by Purkinje cells at mossy fiber-to-interpositus nuclear cell synapses (Mauk 1997; Medina and Mauk 1999).
A third possible explanation for our results involves loss of inferior olivary input to both Purkinje cells and interpositus nucleus cells. Rats exposed to binge levels of ethanol as neonates have been shown to have fewer inferior olivary cells compared with controls (Napper and West 1995b). Furthermore, this loss appears to have consequences on Purkinje cell activity. Spontaneous complex spiking in Purkinje cells (which is caused by inferior olivary input) is significantly diminished in anesthetized rats that were exposed to ethanol as neonates compared with controls (Backman et al. 1998). In contrast, simple spiking remained normal, indicating that the mossy/parallel fiber input to Purkinje cells (and therefore pontine nuclear input) may remain normal in ethanol-exposed rats. Thus, rats exposed to binge levels of ethanol as neonates may show less learning-related activity in the interpositus nucleus during eyeblink conditioning because of loss of direct inferior olivary input to the interpositus nucleus and indirect inferior olivary input to the interpositus nucleus via Purkinje cells. This inferior olivary input is critical for learning eyeblink conditioning, because it conveys US-related activity to the cerebellum. Damage to the inferior olive, before training, in the absence of other damage, prevents eyeblink conditioning in rabbits (McCormick et al. 1985; Turker and Miles 1986; Mintz et al. 1994). Given that ethanol-exposed rats do learn eyeblink conditioning, although not as well as controls, it is likely that at least some of the critical inferior olivary cells that process the US remain and that they can relay that information to both Purkinje cells and to the interpositus nucleus. However, this information may be less than complete and could potentially be a major cause of reduced conditioning-related activity in the interpositus nucleus in adult rats exposed to binge levels of ethanol as neonates.
Conclusions
The current study showed that rats exposed to binge levels of ethanol as neonates are impaired in learning eyeblink conditioning. In addition, CR-related neural activity in the critical site of plasticity for eyeblink conditioning, the ipsilateral interpositus nucleus of the cerebellum, does not develop as quickly in these rats compared with controls, indicating that the interpositus nucleus may be only partially functional in ethanol-exposed rats. Future studies will examine neural activity during eyeblink conditioning in other areas of the eyeblink conditioning circuitry of ethanol-exposed rats, including Purkinje cells, inferior olivary cells, and lateral pontine nuclear cells. Collectively, these studies should provide a detailed description, at the neural level, of the impact of early exposure to ethanol on the developing cerebellum in the form of the long-term consequences on cerebellar-dependent learning.
MATERIALS AND METHODS
Subjects
Long-Evans male and female breeders, housed in the Indiana University–Purdue University at Indianapolis vivarium, were placed together on designated evenings at approximately 1700 h and allowed to mate overnight. Gestational day (GD) 0 was defined as the first morning that sperm was detected on a vaginal smear after an overnight mating. GD 22 was designated as PD 0, and >80% of births occurred on GD 22. Rats born on GD 21 were considered PD 0 the following day and rats born on GD 23 were considered PD 1 on that day. Litters were culled to eight pups, four males and four females when possible, on PD 1. Pups were identified by a code using a permanent tattoo on one or more paws, produced by subcutaneous injection of a small amount of nontoxic black ink (performed on PD 3, before group assignment). A total of 66 rats (31 males; 35 females) derived from 25 litters were included in this study. Other rats from these litters were used in other studies.
Neonatal Treatment Groups
On GD 26 (PD 4), pups of a given litter were randomly assigned to one of three treatment groups. Two males and two females were assigned to Group EtOH and an additional two males and two females were assigned to Group SI. These eight pups, all given intubation treatments, comprised a litter that remained with their birth dam. Separate litters, also culled to eight pups, comprised Group UC.
Pups in Group EtOH and Group SI were intubated three times a day from PD 4 to PD 9, with the intubations separated by 2 h (typically, 10:00, 12:00, and 14:00 h). The first two daily intubations for Group EtOH delivered a solution of 11.9% (v/v) ethanol in milk formula (West et al. 1984) in a volume of 0.02778 mL/g body weight (Goodlett and Johnson 1997; Goodlett et al. 1998); the third intubation consisted of milk formula only. Group SI pups were also intubated three times daily, but no formula was ever infused. This choice of not matching infusion calories in Group SI was derived from our previous observation that giving extra calories to nonintoxicated controls resulted in growth curves that were accelerated relative to Group UC (Goodlett and Johnson 1997; Goodlett et al. 1998).
Pups remained with the dam until weaning on PD 21. At that time they were marked with an ear punch for litter identification. Between 60 and 80 d of age, rats were transported in their home cages by vehicle to the Indiana University–Bloomington campus (less than a 90-min drive), and housed thereafter in the Indiana University–Bloomington Department of Psychology vivarium.
Determination of Blood Alcohol Concentrations
Blood samples were collected from a tail clip 2 h after the second ethanol intubation on PD 6. Blood was sampled from all Group EtOH and Group SI pups, but not from Group UC pups; only the Group EtOH samples were kept for analysis. BACs were determined using the Analox GL5 Analyzer (Analox Instruments). Twenty microliters of tail blood was collected into a heparinized capillary tube and dispensed into a microcentrifuge tube. Samples were centrifuged, and plasma was separated and either analyzed immediately or frozen at −20°C for later analysis. The Analox Analyzer used an oxygen-sensitive electrode to measure the rate of oxygen consumption resulting from oxidation of ethanol in the sample (by the ethanol oxidase reagent provided by Analox). The Analox Analyzer was calibrated (within the range of linearity for expected sample concentrations) with a known alcohol standard before each use. The alcohol concentration of each sample was calculated by comparison to the contemporary standard. Reliability of the Analox Analyzer was periodically checked by testing multiple samples of a known concentration of ethanol; variation typically was within ∼3% of the target concentration.
Surgery
When rats were at least 90 d old, they were prepared for eyeblink conditioning. Rats were anesthetized using intramuscular (IM) injections of an anesthetic cocktail (2.0 ml/kg) consisting of physiological saline, ketamine (37.0 mg/ml), xylazine (1.85 mg/ml), and acepromazine (0.37 mg/ml). Anesthesia was maintained with additional IM injections of a second anesthetic cocktail (0.15 ml) consisting of ketamine (5.0 mg) and xylazine (10.0 mg).
Each animal was surgically prepared with differential EMG recording wires, bipolar periocular stimulation US wires, and a pair of insulated microelectrodes. The EMG wires for recording activity of the external muscles of the eyelid, the orbicularis oculi, were constructed of two strands of ultra-thin (0.003") Teflon-coated stainless steel wire passed subdermally to penetrate the skin of the upper eyelid of the left eye. Bipolar stimulation wires were constructed from the same Teflon-coated wire and were positioned subdermally immediately caudal to, and dorsocaudal to, the left eye. Microelectrodes were constructed from stainless steel rods that were etched to a fine tip and insulated with Epoxylite. Tip impedance was brought to 1.5–4.0 MΩ (at 1 kHz) by passing a small amount of current between the electrode tip and a counter electrode (Ciancone and Rebec 1989). A pair of microelectrodes was stereotaxically placed in the region of the left interpositus nucleus (AP: −2.3 relative to the interaural line; ML: +2.3; DV: −5.7). A ground wire was connected to two stainless steel skull screws. All of the wires were attached to a 10-pin Augat-style connector and fixed into a cap of dental cement. The wound was salved with antibiotic ointment, and the animals were given at least 1 wk to recover before the start of the training procedures.
Apparatus
Eyeblink conditioning took place in an operant box within a sound-attenuating chamber. A fan provided background noise of approximately 65–70 dB sound pressure level (SPL). Stimulus delivery was controlled by an IBM PC-compatible computer running custom software (Chen and Steinmetz 1998). Recording of behavioral and neural activity was controlled by a computer interfaced with a Micro 1401 data acquisition unit and running Spike2 software (CED).
The 10-pin Augat socket cemented to the rat's skull carried two leads from the upper left eyelid for recording EMG activity, two leads for delivering periocular stimulation, and two leads from the cerebellar microelectrodes. The rat was plugged into a 10-channel commutator, which carried leads to and from peripheral equipment. The EMG signal was amplified 1000×, bandpass filtered at 100–1000 Hz, and rectified and integrated before being passed to a computer. The neural signal was passed through a JFET configured as a source follower, amplified 10,000×, bandpass filtered at 500–5000 Hz and passed to the same computer.
A 450-msec, 2800-Hz, 90-dB SPL tone delivered from an overhead speaker within the chamber served as the CS. A 100-msec periocular stimulation (60 Hz, 5-msec pulse width) was delivered through two of the commutator leads and served as the US. The amount of current delivered (mean of 1.7 mA) was adjusted for each subject to elicit a clear eyeblink that was sometimes accompanied by a slight head turn. Post hoc analyses revealed that there were no differences between treatment groups in the intensity of the periocular stimulation delivered as a US for training.
Conditioning Procedures
Mean age at testing across all rats was 154 days (range = 96 to 217 days) and there was no difference between treatment groups in age at testing. Because we were interested in the effects on the adult cerebellum of PD exposure to ethanol, we did not try to limit age at testing to a narrower range. Experimenters were blind to the neonatal treatment of the animal. Before training, all rats underwent one session of exposure to the training stimuli. During this session, 20 presentations of a single pulse of periocular stimulation (0.1-msec pulse width) were delivered followed by 20 presentations of the tone CS.
On the day following exposure to stimuli, rats began either paired or explicitly unpaired training. In a typical trial of paired training, the onset of the tone CS preceded the onset of the 100-msec coterminating periocular stimulation US by 350 msec. However, on every tenth trial, a CS-alone trial was delivered, which allowed inspection of any potential long latency responses without contamination because of the presence of the US. Rats given paired training received 100 trials per day for 10 days. Trials were separated by 20–40 sec. Following the last day of paired training, 4 d of 100 CS-alone trials per day were given to examine extinction of the learned response.
For rats that underwent explicitly unpaired training, each trial consisted of the presentation of either the tone CS or the periocular stimulation US in a pseudorandom order. Rats given explicitly unpaired training received 100 presentations of the tone CS intermixed with 90 presentations of the periocular stimulation US per day for 10 days. Trials were separated by 10–20 sec. Following the last day of unpaired training, 4 d of 100 CS-alone trials per day were given to compare with similar trials given to rats that had undergone paired training.
Histology
Following the last day of training, rats were killed with sodium pentobarbital (120 mg/kg). A small dc electrolytic lesion (100 μA, 20 sec) was made by passing current through the electrodes. Rats were perfused with 0.9% saline followed by 10% formalin, and the brain was extracted and stored in a 10% sucrose/30% formalin solution for at least 1 wk. Before sectioning, brains were embedded in albumin–gelatin and frozen. Using a sliding microtome, frozen coronal sections were taken at 80 μm. The tissue was stained with cresyl violet (for cell bodies) and Prussian blue (for iron deposits left by the marking lesions) and coverslipped with Permount.
Behavioral Data Analysis
Eyelid EMG activity was sampled for 1050 msec on each trial. Each trial was divided into three periods: (1) a pre-CS period, 350 msec before CS onset; (2) a CS–US period, 350 msec between CS onset and US onset; and (3) a post-US period, 350 msec after US onset. Trials in which an eyeblink occurred during the pre-CS period that was >50% of maximum eyelid closure were labeled as trials with excessive spontaneous movement and discarded. Percentage of discarded trials across all rats was 5.5–14.2%, depending on the session. There were no significant differences between treatment groups in percentage of discarded trials during either paired or unpaired training.
An eyeblink within 80 msec after CS onset that was greater than the mean activity during the pre-CS period + 5 SDs was scored as a reflexive startle response to the tone. An eyeblink 81–350 msec after CS onset that was greater than the mean activity during the pre-CS period + 5 SDs was scored as a CR. Across all trials, percentage of CRs and amplitude of eyeblinks during the CS–US period served as the dependent measures of learning.
Unit Data Analysis
Neural activity was sampled for 1050 msec on each trial. Offline separation of individual units was done with the threshold discrimination and template-matching algorithms of the Spike2 system (CED). For spike separation, the maximum percentage amplitude change for a match was 20%, and the percentage of a spike that had to lie within a template for a match was 70%. Threshold for spike detection was set to two times the noise threshold. Using this system, 1–3 units per session could be clearly separated from the multiple-unit signal.
Following spike separation, behavioral and unit data were binned (bin size = 2.832 msec), and analyzed using custom software (King and Tracy 1999). Data were separated according to trial type (CS only, US only, or paired) and behavior type (CR, non-CR), and analyzed independently. For analysis of increases and decreases in neural activity during trials, the 350-msec period between CS onset and US onset was divided into five periods of 70 msec each. For each trial, five difference scores were calculated by subtracting the mean activity for the entire pre-CS period from the mean activity for each of the five post-CS periods. For a session, five CS-period standard scores were formed by dividing the mean of the corresponding difference score by the standard error of the corresponding difference score. Criterion for a significant increase or decrease in activity in a particular CS period was 1.96 across sessions. Average unit firing frequency during the pre-CS and the CS—US interval was also calculated.
Behavior-Unit Relationship Analysis
Cross-correlations were conducted for each session between mean eyelid EMG activity and summed unit activity across all good trials of a session. For each cross-correlation, CS period neural data was lined up with pre-CS period behavioral data, a correlation coefficient was calculated, and neural data was shifted one bin. This process was repeated until pre-CS period neural data was lined up with CS period behavioral data. In the current study, there were 120 bins in the CS period, so that cross-correlations were calculated from a lag of −120 to a lag of +120. The lag of the largest correlation coefficient, when multiplied by the bin size, indexed the time by which neural activity preceded or followed behavior.
Figure 6.
Mean rectified and integrated eyelid EMG activity (top trace) and summed peristimulus time histograms for two separate units recorded from a Group Sham Intubated rat on trials with a CR during session 5 of paired eyeblink conditioning.
Acknowledgments
Support for this research came from NIAAA Grant #AA11945. We thank Tyler Brown, Rachel Huckfeldt, Stephanie Peterson, Olivia Rossebo, Jo Anne Tracy, Tuan Tran, and Brandt Young for technical assistance.
The publication costs of this article were defrayed in part by payment of page charges. This article must therefore be hereby marked “advertisement” in accordance with 18 USC section 1734 solely to indicate this fact.
Footnotes
E-MAIL jtgreen@indiana.edu; FAX (812)855–4691.
Article and publication are at http://www.learnmem.org/cgi/doi/10.1101/lm.47602.
REFERENCES
- Backman C, West JR, Mahoney JC, Palmer MR. Electrophysiological characterization of cerebellar neurons from adult rats exposed to ethanol during development. Alcohol Clin Exp Res. 1998;22:1137–1145. [PubMed] [Google Scholar]
- Berthier NE, Moore JW. Activity of deep cerebellar nuclear cells during classical conditioning of nictitating membrane extension in rabbits. Exp Brain Res. 1990;83:44–54. doi: 10.1007/BF00232192. [DOI] [PubMed] [Google Scholar]
- Bonthius DJ, West JR. Alcohol-induced neuronal loss in developing rats: Increased brain damage with binge exposure. Alcohol Clin Exp Res. 1990;14:107–118. doi: 10.1111/j.1530-0277.1990.tb00455.x. [DOI] [PubMed] [Google Scholar]
- Chen G, Steinmetz JE. A general-purpose computer system for behavioral conditioning and neural recording experiments. Behav Res Methods Instrum Comput. 1998;30:384–391. [Google Scholar]
- Chen L, Bao S, Lockard JM, Kim JJ, Thompson RF. Impaired classical eyeblink conditioning in cerebellar-lesioned and Purkinje cell degeneration (pcd) mutant mice. J Neurosci. 1996;16:2829–2838. doi: 10.1523/JNEUROSCI.16-08-02829.1996. [DOI] [PMC free article] [PubMed] [Google Scholar]
- Ciancone MT, Rebec GV. A simple device for the reliable production of varnish-insulated, high-impedance tungsten microelectrodes. J Neurosci Methods. 1989;27:77–79. doi: 10.1016/0165-0270(89)90053-8. [DOI] [PubMed] [Google Scholar]
- Clark RE, Zhang AA, Lavond DG. The importance of cerebellar cortex and facial nucleus in acquisition and retention of eyeblink/NM conditioning: Evidence for critical unilateral regulation of the conditioned response. Neurobiol Learn Mem. 1997;67:96–111. doi: 10.1006/nlme.1996.3740. [DOI] [PubMed] [Google Scholar]
- Diaz J, Samson HH. Impaired brain growth in neonatal rats exposed to ethanol. Science. 1980;208:751–753. doi: 10.1126/science.7189297. [DOI] [PubMed] [Google Scholar]
- Freeman JH, Nicholson DA. Neuronal activity in the cerebellar interpositus and lateral pontine nuclei during inhibitory classical conditioning of the eyeblink response. Brain Res. 1999;833:225–233. doi: 10.1016/s0006-8993(99)01547-4. [DOI] [PubMed] [Google Scholar]
- Freeman JH, Carter CS, Stanton ME. Early cerebellar lesions impair eyeblink conditioning in developing rats: Differential effects of unilateral lesions on PD day 10 or 20. Behav Neurosci. 1995;109:893–902. doi: 10.1037//0735-7044.109.5.893. [DOI] [PubMed] [Google Scholar]
- Goodlett CR, Eilers AT. Alcohol-induced Purkinje cell loss with a single binge exposure in neonatal rats: A stereological study of temporal windows of vulnerability. Alcohol Clin Exp Res. 1997;21:738–744. [PubMed] [Google Scholar]
- Goodlett CR, Johnson TB. Neonatal binge ethanol exposure using intubation: Timing and dose effects on place learning. Neurotoxicol Teratol. 1997;19:435–446. doi: 10.1016/s0892-0362(97)00062-7. [DOI] [PubMed] [Google Scholar]
- ————— . Temporal windows of vulnerability to alcohol during the third trimester equivalent: Why ‘knowing when‘ matters. In: Hannigan JH, Spear LP, Spear NE, Goodlett CR, editors. Alcohol and alcoholism: Effects on brain and development. Hillsdale, NJ: Lawrence Erlbaum; 1999. pp. 59–91. [Google Scholar]
- Goodlett CR, Lundahl KR. Temporal determinants of neonatal alcohol-induced cerebellar damage and motor performance deficits. Pharmacol Biochem Behav. 1996;55:531–540. doi: 10.1016/s0091-3057(96)00248-1. [DOI] [PubMed] [Google Scholar]
- Goodlett CR, Thomas JD, West JR. Long-term deficits in cerebellar growth and rotarod performance of rats following ‘binge-like‘ alcohol exposure during the neonatal brain growth spurt. Neurotoxicol Teratol. 1991;13:69–74. doi: 10.1016/0892-0362(91)90029-v. [DOI] [PubMed] [Google Scholar]
- Goodlett CR, Peterson SD, Lundahl KR, Pearlman AD. Binge-like alcohol exposure of neonatal rats via intragastric intubation induces both Purkinje cell loss and cortical astrogliosis. Alcohol Clin Exp Res. 1997;21:1010–1017. [PubMed] [Google Scholar]
- Goodlett CR, Pearlman AD, Lundahl KR. Binge neonatal alcohol intubations induce dose-dependent loss of Purkinje cells. Neurotoxicol Teratol. 1998;20:285–292. doi: 10.1016/s0892-0362(97)00102-5. [DOI] [PubMed] [Google Scholar]
- Gould TJ, Steinmetz JE. Changes in rabbit cerebellar cortical and interpositus nucleus activity during acquisition, extinction, and backward classical eyelid conditioning. Neurobiol Learn Mem. 1996;65:17–34. doi: 10.1006/nlme.1996.0003. [DOI] [PubMed] [Google Scholar]
- Green JT, Rogers RF, Goodlett CR, Steinmetz JE. Impairment in eyeblink classical conditioning in adult rats exposed to ethanol as neonates. Alcohol Clin Exp Res. 2000;24:438–447. [PubMed] [Google Scholar]
- Gruart A, Delgado-Garcia JM. Discharge of identified deep cerebellar nuclei neurons related to eye blinks in the alert cat. Neuroscience. 1994;61:665–681. doi: 10.1016/0306-4522(94)90443-x. [DOI] [PubMed] [Google Scholar]
- Hamre KM, West JR. The effects of the timing of ethanol exposure during the brain growth spurt on the number of cerebellar Purkinje and granule cell nuclear profiles. Alcohol Clin Exp Res. 1993;17:610–622. doi: 10.1111/j.1530-0277.1993.tb00808.x. [DOI] [PubMed] [Google Scholar]
- Hannigan JH. What research with animals is telling us about alcohol-related neurodevelopmental disorder. Pharmacol Biochem Behav. 1996;55:489–499. doi: 10.1016/s0091-3057(96)00251-1. [DOI] [PubMed] [Google Scholar]
- King DAT, Tracy J. 1999. http://www.novl.indiana.edu/∼dmunch/ http://www.novl.indiana.edu/∼dmunch/. . [Google Scholar]
- Lavond DG, Steinmetz JE. Acquisition of classical conditioning without cerebellar cortex. Behav Brain Res. 1989;33:113–164. doi: 10.1016/s0166-4328(89)80047-6. [DOI] [PubMed] [Google Scholar]
- Light KE, Kane CJM, Pierce DR, Jenkins D, Ge Y, Brown G, Yang H, Nyamweya N. Intragastric intubation: Important aspects of the model for administration of ethanol to rat pups during the postnatal period. Alcohol Clin Exp Res. 1998;22:1600–1606. doi: 10.1111/j.1530-0277.1998.tb03954.x. [DOI] [PubMed] [Google Scholar]
- Marcussen BL, Goodlett CR, Mahoney JC, West JR. Developing rat Purkinje cells are more vulnerable to alcohol-induced depletion during differentiation than during neurogenesis. Alcohol. 1994;11:147–156. doi: 10.1016/0741-8329(94)90056-6. [DOI] [PubMed] [Google Scholar]
- Mattson SN, Riley EP. A review of the neurobehavioral deficits in children with fetal alcohol syndrome or prenatal exposure to alcohol. Alcohol Clin Exp Res. 1998;22:279–294. doi: 10.1111/j.1530-0277.1998.tb03651.x. [DOI] [PubMed] [Google Scholar]
- Mauk MD. Roles of cerebellar cortex and nuclei in motor learning: Contradictions or clues? Neuron. 1997;18:343–346. doi: 10.1016/s0896-6273(00)81235-0. [DOI] [PubMed] [Google Scholar]
- McCormick DA, Steinmetz JE, Thompson RF. Lesions of the inferior olivary complex cause extinction of the classically conditioned eyeblink response. Brain Res. 1985;359:120–130. doi: 10.1016/0006-8993(85)91419-2. [DOI] [PubMed] [Google Scholar]
- Medina JF, Mauk MD. Simulations of cerebellar motor learning: Computational analysis of plasticity at the mossy fiber to deep nucleus synapse. J Neurosci. 1999;19:7140–7151. doi: 10.1523/JNEUROSCI.19-16-07140.1999. [DOI] [PMC free article] [PubMed] [Google Scholar]
- Meyer LS, Kotch LE, Riley EP. Neonatal ethanol exposure: Functional alterations associated with cerebellar growth retardation. Neurotoxicol Teratol. 1990;12:15–22. doi: 10.1016/0892-0362(90)90107-n. [DOI] [PubMed] [Google Scholar]
- Miki T, Harris S, Wilce P, Takeuchi Y, Bedi KS. The effect of the timing of ethanol exposure during early postnatal life on total number of Purkinje cells in rat cerebellum. J Anat. 1999;194:423–431. doi: 10.1046/j.1469-7580.1999.19430423.x. [DOI] [PMC free article] [PubMed] [Google Scholar]
- Mintz M, Lavond DG, Zhang AA, Yun Y, Thompson RF. Unilateral inferior olive NMDA lesion leads to unilateral deficit in acquisition and retention of eyelid classical conditioning. Behav Neural Biol. 1994;61:218–224. doi: 10.1016/s0163-1047(05)80004-4. [DOI] [PubMed] [Google Scholar]
- Napper RMA, West JR. Permanent neuronal cell loss in the cerebellum of rats exposed to continuous low blood alcohol levels during the brain growth spurt: A stereological investigation. J Comp Neurol. 1995a;362:283–292. doi: 10.1002/cne.903620210. [DOI] [PubMed] [Google Scholar]
- ————— Permanent neuronal cell loss in the inferior olive of adult rats exposed to alcohol during the brain growth spurt: A stereological investigation. Alcohol Clin Exp Res. 1995b;19:1321–1326. doi: 10.1111/j.1530-0277.1995.tb01619.x. [DOI] [PubMed] [Google Scholar]
- Pauli J, Wilce P, Bedi KS. Acute exposure to alcohol during early postnatal life causes a deficit in the total number of cerebellar Purkinje cells in the rat. J Comp Neurol. 1995;360:506–512. doi: 10.1002/cne.903600311. [DOI] [PubMed] [Google Scholar]
- Roebuck TM, Mattson SN, Riley EP. A review of the neuroanatomical findings in children with fetal alcohol syndrome or prenatal exposure to alcohol. Alcohol Clin Exp Res. 1998;22:339–344. doi: 10.1111/j.1530-0277.1998.tb03658.x. [DOI] [PubMed] [Google Scholar]
- Rogers RF, Britton GB, Steinmetz JE. Learning-related interpositus activity is conserved across species as studied during eyeblink conditioning in the rat. Brain Res. 2001;905:171–177. doi: 10.1016/s0006-8993(01)02532-x. [DOI] [PubMed] [Google Scholar]
- Skelton RW. Bilateral cerebellar lesions disrupt conditioned eyelid responses in unrestrained rats. Behav Neurosci. 1988;102:586–590. doi: 10.1037//0735-7044.102.4.586. [DOI] [PubMed] [Google Scholar]
- Sonderegger T, Colbern D, Calmes H, Corbitt S, Zimmermann E. Methodological note: Intragastric intubation of ethanol to rat pups. Neurobehav Toxicol Teratol. 1982;4:477–481. [PubMed] [Google Scholar]
- Stanton ME, Goodlett CR. Neonatal ethanol exposure impairs eyeblink conditioning in weanling rats. Alcohol Clin Exp Res. 1998;22:270–275. [PubMed] [Google Scholar]
- Steinmetz JE. Brain substrates of classical eyeblink conditioning: A highly localized but also distributed system. Behav Brain Res. 2000;110:13–24. doi: 10.1016/s0166-4328(99)00181-3. [DOI] [PubMed] [Google Scholar]
- Steinmetz JE, Tracy J, Green JT. Classical eyeblink conditioning: Clinical models and applications. Integr Physiol Behav Sci. 2001;36:220–238. doi: 10.1007/BF02734095. [DOI] [PubMed] [Google Scholar]
- Streissguth AP, O’Malley K. Neuropsychiatric implications and long-term consequences of fetal alcohol spectrum disorders. Semin Clin Neuropsychiatry. 2000;5:177–190. doi: 10.1053/scnp.2000.6729. [DOI] [PubMed] [Google Scholar]
- Thomas JD, Goodlett CR, West JR. Alcohol-induced Purkinje cell loss depends on developmental timing of alcohol exposure and correlates with motor performance. Brain Res Dev Brain Res. 1998;105:159–166. doi: 10.1016/s0165-3806(97)00164-8. [DOI] [PubMed] [Google Scholar]
- Turker KS, Miles TS. Climbing fiber lesions disrupt conditioning of the nictitating membrane response in the rabbit. Brain Res. 1986;363:376–378. doi: 10.1016/0006-8993(86)91026-7. [DOI] [PubMed] [Google Scholar]
- West JR. Use of pup in a cup model to study brain development. J Nutr. 1993;123:382–385. doi: 10.1093/jn/123.suppl_2.382. [DOI] [PubMed] [Google Scholar]
- West JR, Hamre KM, Pierce DR. Delay in brain growth induced by alcohol in artificially reared rat pups. Alcohol. 1984;1:83–95. doi: 10.1016/0741-8329(84)90101-0. [DOI] [PubMed] [Google Scholar]


