Abstract
The so-called ventriloquism aftereffect is a remarkable example of rapid adaptative changes in spatial localization caused by visual stimuli. After exposure to a consistent spatial disparity of auditory and visual stimuli, localization of sound sources is systematically shifted to correct for the deviation of the sound from visual positions during the previous adaptation period. In the present study, this aftereffect was induced by presenting, within 17 min, 1800 repetitive noise or pure-tone bursts in combination with synchronized, and 20° disparate flashing light spots, in total darkness. Post-adaptive sound localization, measured by a method of manual pointing, was significantly shifted 2.4° (noise), 3.1° (1 kHz tones), or 5.8° (4 kHz tones) compared with the pre-adaptation condition. There was no transfer across frequencies; that is, shifts in localization were insignificant when the frequencies used for adaptation and the post-adaptation localization test were different. It is hypothesized that these aftereffects may rely on shifts in neural representations of auditory space with respect to those of visual space, induced by intersensory spatial disparity, and may thus reflect a phenomenon of neural short-term plasticity.
Since the pioneering studies of Stratton (1896, 1897) and Helmholtz (1867) a multitude of psychophysical investigations has dealt with the issue of human cross-modal adaptation (for review, see Harris 1965; Kornheiser 1976; Welch 1978). One of the various adaptive phenomena found in those experiments is the so-called ventriloquism aftereffect. In this perceptual effect, localization of sound sources is systematically shifted after a period of exposure to a consistent auditory-visual spatial disparity.
Until now, only few attempts have been made to demonstrate the ventriloquism aftereffect. Adaptation with an auditory-visual disparity implemented by prism lenses has been shown to induce systematic errors in sound localization that were in the same direction as the lateral displacement of vision during the preceding adaptation period (Canon 1970, 1971). This auditory shift was generally smaller in amplitude than the angle of cross-modal disparity, but could be increased by instructions requiring participants to attend to the visual stimuli during adaptation. The effect occurred regardless of whether participants moved or could see parts of their body. Radeau and Bertelson (1977, 1978) have shown that synchronization of auditory and visual input is a decisive factor, whereas the complexity of the stimulus situation is not relevant for producing the aftereffect. In this respect, the ventriloquism aftereffect differs from the ventriloquism effect (denoting bias of auditory localization by simultaneously presented, spatially disparate, visual stimuli or even perceptual fusion of the two events), which can be additionally increased by cognitive factors, such as the compellingness of a common cause of auditory and visual events (for review, see Radeau 1994). Moreover, it should be noted that the ventriloquism aftereffect also emerges when participants are aware of the spatial discordance of the stimuli and may, consequently, be independent of perceptual fusion with adaptation.
The ventriloquism aftereffect was also induced when cross-modal disparity during the adaptation period was implemented by manipulation of auditory spatial cues in such a way that sound directions were laterally displaced (by use of a pseudophone), whereas vision remained uninfluenced. Post-adaptive shifts of auditory localization found in those experiments were opposite to the direction of sound displacement (Held 1955; Kalil and Freedman 1967; Canon 1970). Most importantly, in a recent study by Recanzone (1998) the ventriloquism aftereffect was shown to occur after mere presentation of synchronized, spatially disparate repetitive sound bursts and flashing light spots in total darkness for a few minutes. Thus, taken together, it seems that it is primarily the temporal correlation of the spatially deviating auditory and visual repetitive events that induces rapid development of a relative post-adaptive shift of representations of auditory and visual space.
The origin of this psychophysical effect is still unclear. However, there is evidence from experiments on owls, reared with prismatic spectacles, that both midbrain representations of auditory space and sound localization behaviour are shifted in the direction of visual displacement (Knudsen and Knudsen 1985, 1989; Brainard and Knudsen 1993; Knudsen 1999; Hyde and Knudsen 2000, 2002; Zheng and Knudsen 2001). These processes may rely on neural mechanisms on the basis of simple Hebbian learning rules (Feldman et al. 1996; Knudsen et al. 2000; Luksch et al. 2000). Even though these animal studies refer to long-lasting reorganizations, partially restricted to specific sensitive periods in development (Brainard and Knudsen 1995; Feldman and Knudsen 1997; DeBello et al. 2001; for review, see Sur et al. 1990), the concept that vision calibrates sound localization may also apply to potentially rapidly induced neural plasticity in the human cortex. Recanzone (1998) proposed that such a form of rapid plasticity may be the substrate of the ventriloquism aftereffect. This hypothesis was based primarily on the author's finding that the ventriloquism aftereffect was frequency specific as follows: when pure tones were used as acoustic stimuli during adaptation, the aftereffect fails to appear when sound localization was later tested with tones that differred by two octaves in frequency from the adapting stimuli. This frequency specificity found at the perceptual level could be related to the widths of frequency-tuning functions, measured in single neurons of the monkey primary auditory cortex during perfomance of a sound-localization task. However, Recanzone's (1998) conclusions were based on psychophysical experiments with a small number of participants and restricted stimulus conditions. Thus, because of the high theoretical significance of this issue, it was essential to replicate those findings with a larger sample of participants and greater variety of stimulus parameters. Moreover, a number of important questions still remained left open, which the present investigation aimed to address.
For this purpose, an experimental design was chosen that was generally similar to that used by Recanzone (1998), but with some significant differences from that study. First, the present study investigated post-adaptive shifts not only in auditory, but also in visual localization. Second, post-adaptive localization was measured by a task of manual pointing (for review, see Lewald et al. 2000), whereas both a task of head pointing and a task of disparity detection were used by Recanzone (1998). Third, the present task required participants to attend to the visual stimuli during adaptation, whereas participants in Recanzone's (1998) study attended to auditory stimuli.
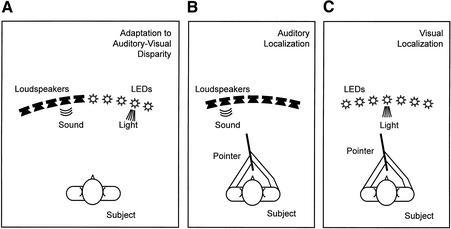
There were four main experiments. In Experiment 1, pulses of broad-band noise were presented 20° to the left or right of synchronized light flashes during adaptation. Pre- and post-adaptive localization performances were compared (Figs. 1 and 2). Experiment 2 was a control experiment in which auditory and visual stimuli were presented in spatial alignment during adaptation. Finally, in Experiments 3 and 4, the acoustic stimuli were tone pulses, with either the same frequency in all experimental conditions, or with the frequency during the adaptation period differring from the pre- and post-adaptation conditions. Assuming that neural circuits, composed of sharply frequency-tuned auditory units, are involved in the ventriloquism aftereffect, the expectation was that this aftereffect would be demonstrable only when sound localization is tested with the same acoustic stimuli as were presented during adaptation.
Figure 1.
Stimulus positions in Experiment 1. In the adaptation condition (A), sound stimuli were always 20° from visual stimuli. Positions of active loudspeakers and light-emitting diods (LEDs) were varied between trials. Immediately after completion of the adaptation condition, auditory (B) and visual localization (C) were tested by use of a pointing method. Trials with auditory and visual stimuli were presented in an alternating sequence.
Figure 2.
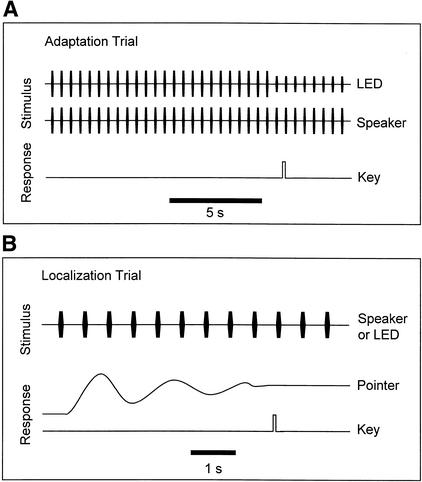
Temporal sequence of stimuli and responses in adaptation and localization conditions. (A) In adaptation trials, the spatially disparate sound and light pulses were synchronized. Participants pressed a key as soon as the brightness of the visual stimulus was reduced. (B) In localization trials, participants pointed with a hand pointer toward the azimuthal position of the sound or light source. Participants pressed a key to indicate the final adjustment of the pointer.
RESULTS
Experiment 1
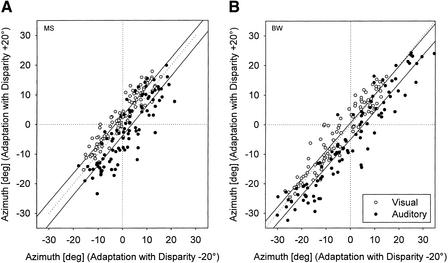
Experiment 1 was designed to measure shifts in auditory and visual localization induced by adaptation to auditory-visual spatial disparity of 20° (Figs. 1 and 2). Figure 3 shows individual data for two representative participants. In both, pointing responses to acoustic targets were more to the left after adaptation to +20° disparity (auditory stimuli to the right of the visual stimuli) than those obtained after adaptation to −20° disparity (auditory stimuli to the left of the visual stimuli; paired t-test, P <0.0001). In addition, there were opposite trends for visual localization; responses measured after adaptation to +20° disparity were to the right of those found after adaptation to −20° disparity (P <0.025). In one of the two participants, visual and auditory shifts were similar in magnitude (Fig. 3A). In the other participant, the visual shift was close to zero, although still significant (Fig. 3B).
Figure 3.
Shifts in auditory and visual localization in two participants (A,B) after adaptation to 20° auditory-visual disparity (Experiment 1). Final pointer positions obtained after adaptation with the auditory stimuli presented to the right of the visual stimuli (+20° disparity) are plotted against the respective positions measured after adaptation with the auditory stimuli presented to the left of the visual stimuli (−20° disparity). Data for auditory (●) and visual localization (○) were fit by regression lines. The shift of the regression lines for auditory localization in both participants to the right of the diagonal (broken line) indicates that pointing responses to acoustic targets were more to the left after adaptation to +20° disparity than those obtained after adaptation to −20° disparity. A slight opposite trend was found for visual localization. Negative azimuths indicate stimuli to the left, and positive azimuths stimuli to the right.
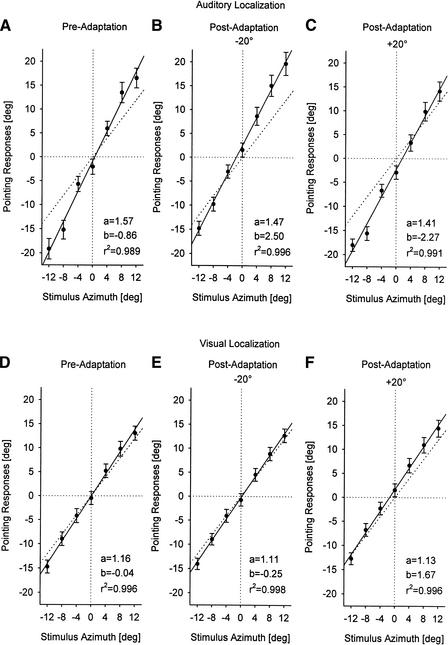
Figure 4 shows mean pointing responses for all participants, plotted as a function of stimulus azimuth. In all experimental conditons, data could be fit by regression lines (r2 >0.989; P <0.0001). In the pre-adaptation condition (Fig. 4A,D), performance of the participants was similar to that known from previous studies on auditory and visual localization, with characteristic overestimations of both auditory and visual eccentricities (for review, see Lewald and Ehrenstein 2000; Lewald et al. 2000). In the two post-adaptation conditions (−20° and +20° disparity), displacements of the regression lines calculated from the data suggested that sound localization shifted to the right of the pre-adaptation values after adaptation with −20° disparity (Fig. 4B) and to the left after adaptation with +20° disparity (Fig. 4C). For visual localization, adaptation effects seemed to be reversed, although a clear shift was found only after adaptation with +20° disparity (Fig. 4E,F).
Figure 4.
Mean azimuthal angles (± SE) of the pointing responses for all participants, plotted as a function of stimulus azimuth (Experiment 1). Localization of auditory (A–C) and visual targets (D–F) is shown prior to adaptation (A,E), after adaptation with auditory stimuli to the left of the visual stimuli (−20°; B,E), and after adaptation with auditory stimuli to the right of the visual stimuli (+20°; C,F). Data were fit by regression lines. Parameters of the resulting function y = ax + b and coefficients of determination for each fit are as given in the panels. Negative angles are to the left, positive to the right.
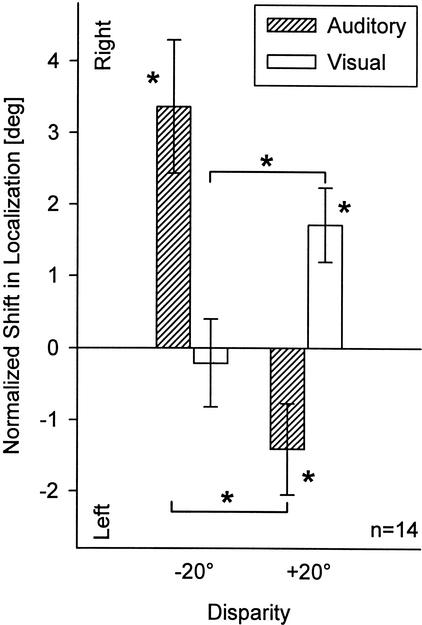
Mean post-adaptive shifts averaged over all stimulus azimuths are shown in Figure 5. As already suggested by the analyses described above, there were significant systematic shifts in auditory localization to the right (mean + 3.36°, SE ± 0.93; paired t-test, P = 0.003) and left (mean −1.41°, SE ± 0.64; P = 0.046) after adaptation to auditory-visual disparities of −20° and +20°, respectively. Also, a significant shift in visual localization (mean + 1.71°, SE ± 0.52; P = 0.006) was induced by adaptation to +20° disparity, whereas only an insignificant shift (mean −0.21°, SE ± 0.61; P >0.05) occurred after adaptation to −20° disparity. Even though the amplitudes of auditory and visual shifts appeared to be greater to the right than to left, these differences were not significant (P >0.1). Differences between shifts induced by adaptation to −20° and +20° disparities were significant both in the auditory (mean 4.77°; P <0.0001) and in the visual modality (mean 1.92°; P = 0.0009).
Figure 5.
Mean normalized shifts (± SE) in auditory (hatched bars) and visual localization (open bars), averaged over all stimulus positions, after adaptation to auditory-visual spatial disparity (Experiment 1; same data as in Fig. 4). Negative shifts are to the left, positive to the right. Asterisks next to bars indicate significant differences of pre- and post-adaptive localization; and asterisks next to brackets indicate significant differences of the respective auditory or visual shifts measured after adaptation to −20° and +20° disparity.
Experiment 2
Experiment 2 was performed to provide a control for Experiment 1. In particular, Experiment 2 examined whether presentation of visual stimuli in one hemifield may have any influence on post-adaptive auditory and visual localization. The main rationale was that possible effects of eccentric gaze direction and spatial attention could not be excluded in Experiment 1. For this purpose, conditions in Experiment 2 were as in Experiment 1, with the single exception that auditory stimuli were presented in spatial alignment with the visual stimuli. That is, during adaptation, paired sound and light pulses were presented together either to the left or right.
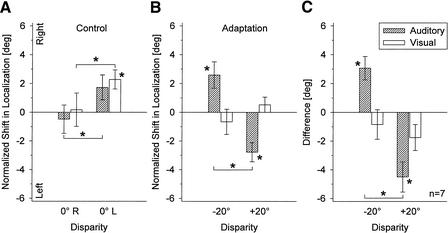
Unexpectedly, small, but significant, effects were obtained even under these control conditions. After stimulus presentation in the right hemifield, both auditory and visual stimuli were localized more to the left than after stimulus presentation to the left hemifield (paired t-test; auditory: mean difference 2.22°, P = 0.037; visual: mean difference 2.10°, P = 0.043; Fig. 6A). The most pronounced absolute shift was found for visual localization after stimulus presentation on the left side (mean shift +2.28°, P = 0.014).
Figure 6.
Mean normalized shifts (± SE) in auditory and visual localization after presentation of auditory and visual stimuli that were spatially aligned (Experiment 2). (A) Shifts measured after stimulus presentation to the right (0° R) and to the left (0° L) of the participant's median plane. (B) Shifts in the same participants as shown in A, obtained after adaptation to auditory-visual spatial disparity in Experiment 1. (C) Differences between normalized shifts measured in Experiments 1 (20° disparity) and 2 (0° disparity) with identical positions of visual stimuli. Conventions are as in Fig. 5. (Hatched bars) Auditory; (open bars) visual.
The results obtained in Experiment 1 from the same seven participants are shown in Figure 6B for comparison. As in the complete sample of participants (see above), this subgroup exhibited significant post-adaptive shifts in auditory localization (−20° disparity: mean +2.59°, SE ± 0.91°, P = 0.030; +20 disparity: −2.77°, SE ± 0.67°, P = 0.006), with a clear difference of 5.36° between shifts obtained in the two adaptation conditions (P <0.0001). Also, shifts in visual localization were in the same direction as those found for the whole group of participants (−20° disparity: mean −0.66°, SE ± 0.88°; +20 disparity: +0.53°, SE ± 0.53°), even though this effect did not reach statistical significance (P >0.1). To cancel any effects associated with the asymmetric presentation of the visual stimuli, the differences between normalized shifts measured in Experiments 1 and 2 for identical positions of visual stimuli were calculated. As shown in Figure 6C, the post-adaptive shifts in auditory localization were even stronger after this correction (−20° disparity: 3.07°, SE ± 0.81°, P = 0.009; +20° disparity: −4.50°, SE ± 1.05°, P = 0.005). However, no significant effects were apparent for visual localization (P >0.1).
Variation of Spatial Disparity
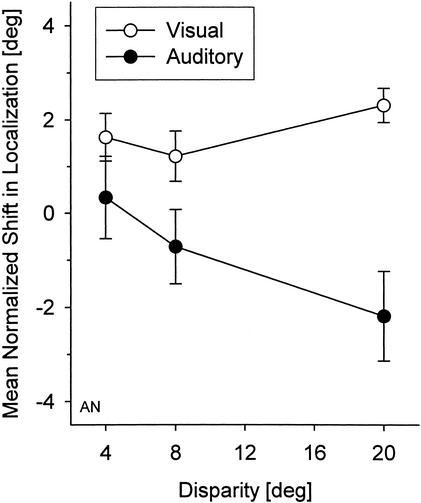
In addition to the Experiments 1 and 2 that used either 20° disparity, or spatial alignment of auditory and visual stimuli during adaptation, some further measurements were made with adaptation to smaller disparities of 4° and 8°. Figure 7 shows the mean normalized auditory and visual shifts after adaptation as a function of spatial disparity for one exemplary participant. There was a significant correlation, indicating an increase of auditory shifts with increasing spatial disparity (Spearman rank correlation coefficient rS = 0.11, P = 0.036). No correlation was found for shifts in visual localization (rS = 0.08, P >0.1).
Figure 7.
Mean normalized shift (± SE) in auditory (●) and visual localization (○) for one participant, plotted as a function of auditory-visual spatial disparity during adaptation. Results obtained after adaptation with auditory stimuli to the left and right of the visual stimuli are combined. Positive shifts indicate that localization is shifted toward the direction in which the auditory stimuli were presented during adaptation, and negative shifts indicate a shift to that side in which the visual stimuli have been presented during adaptation.
Experiment 3
Whereas in the experiments described above, broad-band noise was used as the standard auditory stimulus, 1-kHz pure tones were used in the localization conditions of Experiment 3. In the adaptation conditions, the auditory stimulus was composed of either 1- or 4-kHz tone pulses that were presented 20° from the visual stimuli. The rationale for this experimental design was to investigate whether or not post-adaptive shifts in auditory localization, such as shown in Experiment 1, also occur when the frequency of the auditory stimuli to be localized differs from that of the stimuli presented during adaptation before.
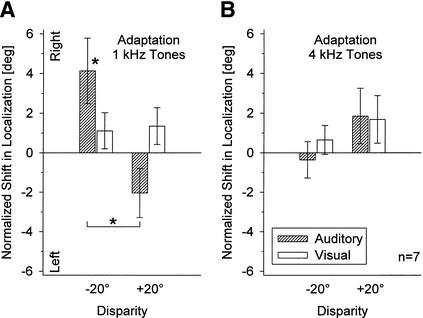
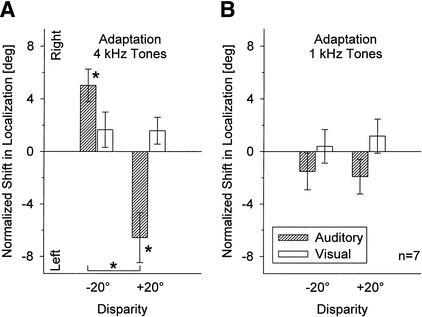
As shown in Figure 8A, when the stimulus frequencies in the adaptation and localization conditions were identical, the post-adaptive shift in auditory localization was similar to that found in Experiment 1, but larger (cf. Figs. 5 and 6B). After adaptation to −20° auditory-visual disparity, tones were significantly localized more to the right compared with adaptation to +20° disparity (mean difference 6.17°; paired t-test, P = 0.003). The largest auditory shift was found after adaptation to −20° disparity (+4.13°, SE ± 1.65°; P = 0.046). Only insignificant differences between shifts after adaptation to −20° and +20° disparity were obtained for visual localization (mean difference 0.24°; P >0.1).
Figure 8.
Mean normalized shifts (± SE) in localization of 1-kHz-tone and light pulses after adaptation to auditory-visual spatial disparity with either 1-kHz (A) or 4-kHz tone pulses (B). Conventions are as in Fig. 5.
In contrast, no significant effects at all were found when stimulus frequencies in adaptation and localization trials were different (Fig. 8B). After adaptation to 4-kHz tones, localization of 1-kHz stimuli seemed to shift in the opposite direction from that found after adaptation with 1-kHz tones, with an insignificant mean difference of 2.21° between shifts after adaptation to −20° and +20° disparity (P >0.1). Thus, these results generally resemble those obtained in Experiment 2 when auditory and visual stimuli were spatially aligned during the adaptation period (Fig. 6A).
Experiment 4
Pure-tone frequencies in Experiment 4 were reversed with respect to Experiment 3. That is, localization of 4-kHz tone pulses was tested after adaptation to 20° auditory-visual disparity with either 4- or 1-kHz tone pulses. As in Experiment 3, significant shifts were measured when auditory localization was tested after adaptation with auditory stimuli of the same frequency, but not when adaptation and test frequencies were different. In the first case (Fig. 9A), the magnitude of the post-adaptive shifts in auditory localization was +5.02° (SE ± 1.24°; paired t-test, P = 0.007) for −20° disparity and −6.57° (SE ± 1.90°; P = 0.013) for +20° disparity (mean difference 11.59°; P = 0.001); and in the latter case (Fig. 9B), the mean difference of the auditory shifts after adaptation to −20° and +20° disparity was only 0.40° (P >0.1). Also, no significant effects of adaptation on visual localization were found (mean difference for −20° and +20° disparity 0.8°, P >0.1; Fig. 9A,B).
Figure 9.
Mean normalized shifts (± SE) in localization of 4-kHz-tone and light pulses after adaptation to auditory-visual spatial disparity with either 4-kHz (A) or 1-kHz tone pulses (B). Conventions are as in Fig. 5.
DISCUSSION
The present results clearly confirm earlier work on the ventriloquism aftereffect by showing a post-adaptive shift in sound localization after presentation of synchronized and spatially disparate auditory and visual stimuli (Held 1955; Kalil and Freedman 1967; Canon 1970, 1971; Radeau and Bertelson 1977, 1978; Recanzone 1998). The direction of this shift tends to correct for the deviation of the sound azimuth from visual positions, thus suggesting a shift in the internal representation of auditory space toward that of visual space. Most importantly, the present study suggests that the mere presentation of synchronized sound bursts and light flashes with consistent angular disparity in absolute darkness is sufficient to induce this aftereffect. Moreover, Experiments 3 and 4 provided strong evidence for the conclusion of Recanzone (1998) that there is no transfer of the aftereffect across frequencies. As will be discussed below in detail, this finding suggests that the aftereffect may be related to rapidly induced coordinate transformations of brain representations of auditory space, formed by neurons that are tuned to specific frequencies.
Even though a very small, but still significant, aftereffect with pointing to visual targets was found in Experiment 1 (20° disparity), its occurrence in Experiment 2 (no disparity) suggested that it was not the adaptation to auditory-visual disparity that shifted visual localization (Fig. 6). Rather, a different kind of adaptation aftereffect may also have been involved that was induced by the eccentricity of the visual stimuli, which resulted in a slight post-adaptive shift in the representation of visual space opposite to the side of stimulus presentation. The origin of this unexpected effect, which may interfere with the genuine aftereffect of cross-modal disparity, has to be clarified by future experiments.
The magnitude of the present post-adaptive shift in sound localization was generally within about one-third of the adapting stimulus disparity, and, thus, roughly resembled that reported by most earlier studies (Held 1955; Kalil and Freedman 1967; Canon 1970, 1971; Radeau and Bertelson 1977, 1978). However, in apparent contrast to those investigations, as well as to the present one, Recanzone (1998) found post-adaptive displacements of apparent sound locations of approximately the same magnitude as that of the adapting cross-modal disparity (8°) when localization was measured by a task of head pointing. On the other hand, when in Recanzone's (1998) study sound localization was measured by a task that only required detection of spatial disparity, the aftereffect was incomplete, as it was in the present study. Thus, it seems likely that the method of head pointing used by Recanzone (1998) may have involved additional factors that either increased or were superimposed on the genuine ventriloquism aftereffect. In contrast, in the present experiments, involvement of head-motor or head-proprioceptive factors (Lewald et al. 1999, 2000) were excluded by fixating the participants' head position. Because the method used here differed in many details from that used by Recanzone (1998), further discussion of potential reasons for the obvious quantitative discrepancy in the results would be too speculative. In any case, it is clear that it was not the difference in the angle of adaptive auditory-visual disparity that was relevant (see Fig. 7). Also, additional experiments with ∼30 min exposure to the adaptative stimuli (data not shown) did not give any suggestion of substantial increases of the magnitude of the aftereffect.
The present findings may be related to a rapid shift in representations of acoustic space in the human brain, induced by synchronized visual input. This hypothetical shift is presumably restricted to those auditory neuronal circuits that are selective for the frequency of the adaptive sound stimuli. On the other hand, neurons that are tuned to frequencies other than that used for adaption may have remained unaffected by the adaptive stimuli. Thus, the present data may predict the existence of visual input, including spatio-temporal information, to spatially selective and sharply frequency-tuned auditory neurons.
Which areas in the human brain are compatible with these predictions? At first glance, one may assume that bimodal neurons, exhibiting spatio-temporal auditory-visual interactions, could be involved in the ventriloquism aftereffect. This type of neuron has been found in many subcortical and cortical areas, in the superior colliculus as well as in frontal, temporal, insular, parietal, and occipital cortex (e.g., Evans and Whitfield 1964; Morrell 1972; Fishman and Michael 1973; Benevento et al. 1977; Fallon and Benevento 1977; Vaadia et al. 1986; Stein and Meredith 1993; Mazzoni et al. 1996); and neuroimaging studies have indicated potential correlates of these interactions in the human cortex (for review, see Calvert 2001). However, sharp frequency tuning (narrower than two octaves), as was predicted by the present Experiments 3 and 4, seems to occur very rarely (e.g., Fishman and Michael 1973; Benevento et al. 1977; Middlebrooks and Knudsen 1984). Instead, bimodal neurons are known to generally prefer nonrepetitive, complex noise bursts (Wickelgren 1971; for review, see Knudsen 1983; Wallace et al. 1996). This makes it doubtful that this type of neuron actually subserves the present perceptual aftereffect, which appears to be even stronger with pure-tone adapting stimuli.
As proposed by Recanzone (1998), unimodal neurons in the primary auditory cortex could also be involved in the ventriloquism aftereffect. In fact, these cells perfectly match the present predictions of sharp frequency tuning and spatial selectivity (Recanzone 2000). Moreover, there is some evidence from neuroimaging studies that visual information could modulate activity in the human auditory cortex (Calvert et al. 1999; Laurienti et al. 2002). At present, the possibility that synchronized visual input specifically modulates spatial properties of neurons in auditory cortex is, however, pure speculation.
A further potential substrate of the ventriloquism aftereffect may be the inferior colliculus, which is a center of integration of input channels and distribution of output lines, lying in the middle of bottom-up and top-down processing within the auditory pathway (Ehret 1997). In the inferior colliculus, auditory information is integrated to create topographically organized maps of both frequency and space, formed by neurons exhibiting relatively sharp-frequency tuning and spatial selectivity (Semple et al. 1983; Aitkin et al. 1984, 1985; Moore et al. 1984a,b; for review, see Konishi 1986). In the barn owl, the topographical representation of auditory space in the external subnucleus of the inferior colliculus homolog has been shown to be calibrated by a visual instructional signal, originating in the visual map of the optic tectum, which arises from topographic projections from the retina (Brainard and Knudsen 1993, 1995; Feldman and Knudsen 1997; Hyde and Knudsen 2000, 2002; Knudsen et al. 2000; Luksch et al. 2000; DeBello et al. 2001; Zheng and Knudsen 2001). Investigations in mammals have been far less extensive, but mechanisms similar to those in the owl may occur (King 1993; King et al. 2000). However, it should be emphasized that these animal studies observed long-lasting neural reorganizations that developed over weeks, whereas the present perceptual adaptation effect emerges within minutes. Thus far, neurophysiological data that could be related to such a rapid plasticity of the processing of sound location in the auditory system are not available, other than a quite remarkable exception. Spatially selective responses to auditory stimuli in the primate inferior colliculus, superior colliculus, and parietal cortex have been shown to be modulated by changes in eye position, suggesting that an eye-position signal (of unknown origin) is used to transform the (originally head centered) auditory spatial cues into eye-centered coordinates with changes in gaze direction (Jay and Sparks 1984, 1987; Mazzoni et al. 1996; Stricanne et al. 1996; Groh et al. 2001). These findings provide evidence that an extremely rapid plasticity of spatial representations within the auditory system also exists. Possibly, short-term (order: <1 sec), intermediate (order: minutes), and long-term plasticities (order: weeks) are based on neural circuits that integrate auditory, visual, and eye-position information, to maintain a stable alignment of auditory and visual spatial representations. The present, intermediate aftereffect could reflect a first, preliminary stage of longer-lasting adaptive processes that are of particular importance during development, when head and pinnae grow and the relation of acoustic directional cues (interaural time and level differences, spectral cues) to the headcentric spatial coordinates changes. In the adult, the functional significance may lie in the maintenance of perceptual space constancy by permanent visual calibration of sound localization.
MATERIALS AND METHODS
Participants
A total of 14 volunteers, 10 female and 4 male, with a mean age of 27.8 (range 21–42) participated in this study. None had any known hearing deficiencies. The vision of all participants was either normal or corrected to normal by glasses or contact lenses. All were naive with respect to the purpose of these experiments. All participants completed the main Experiment 1, and a subgroup of seven participants performed the remaining experiments. All individuals of the latter subgroup first participated in Experiment 1. The sequence of Experiments 2–4 was balanced across subjects. Initial practice trials on each of the different tasks were given prior to the beginning of the experimental sessions.
Apparatus
The participant sat on a chair in an absolutely dark, sound-proof, and anechoic room (5.4 × 4.4 × 2.1 m; Guski 1990). The participant's head was fixed in a straight-ahead position by a custom-made restraint that consisted of stabilizing rests for the chin, forehead, and occiput. For auditory stimulation, a horizontal array of broad-band loudspeakers (Visaton SC5.9; 5 × 9 cm) was mounted along the arc of a circle (radius 1.5 m) at eye level and centered around the midpoint of the participant's interaural distance. This apparatus consists of 91 loudspeakers, covering an azimuthal range of 180°. However, only 11 loudspeakers were used in the present experiments, 1 loudspeaker was straight ahead of the participant, 5 were on the left, and 5 were on the right with constant angular separation of 4°. For visual stimulation, one white light-emitting diode (LED; ∅ 3 mm, ca. 5 mcd) was attached to the lower edge of the chassis of each of the loudspeakers. The luminance of the LEDs was so low that the participant could not see any details of the experimental apparatus when visual stimuli were presented. A hand pointer was mounted in front of the participant. The swivel pointer consisted of a metal rod that the participant could rotate in the horizontal plane. A key was mounted on the upper side of the rod. The azimuthal angle of the pointer was recorded by a potentiometer as soon as the key was pressed (for further details, see Lewald et al. 2000). Negative angles of pointing are to the left, and positive values are to the right.
Procedure for Experiment 1
Experiment 1 consisted of two sessions, conducted on different days. Each session was subdivided into five blocks that alternately used localization (blocks 1, 3, and 5) and adaptation conditions (blocks 2 and 4; Figs. 1 and 2). In block 1 of session 1, the participant was instructed to point with the unseen hand pointer toward either auditory or visual targets (localization condition; Fig. 1B,C). Block 1 was composed of 98 trials (48 trials with presentation of auditory targets and 48 trials with presentation of visual targets). Trials with presentation of auditory and visual stimuli alternated. The azimuthal positions of auditory and visual targets were varied between trials following a fixed, quasi-random order from −12° to the left to +12° to the right of straight ahead. The auditory stimulus was a sequence of twelve identical sound pulses of band-pass-filtered frozen noise that were presented at a constant rate of 2 s−1 from one of the loudspeakers (cutoff frequencies 0.5 and 8 kHz; sound pressure level 60 dB re 20 μPa; duration 100 msec; rise/fall time 20 msec; Fig. 2B). The visual stimulus consisted of a sequence of 12 light pulses (duration 100 msec), presented at a constant rate of 2 s−1 from one of the LEDs. Participants were instructed to direct the pointer as accurately as possible toward the perceived auditory or visual stimulus azimuth. As soon as the pointer adjustment was finished, the participant pressed the key on the pointer. At the moment the key was pressed, the stimulus disappeared. One second later, the next trial began. In the cases in which the key was pressed after presentation of the last sound or light pulse, the trial was repeated automatically at the end of the block. The duration of the block was usually ∼10 min. After the block was completed, the participant was allowed to rest for ∼5 min.
In Block 2, auditory and visual stimuli were presented simultaneously with constant spatial disparity (adaptation condition; Fig. 1A). In each of a total of 50 trials, auditory stimuli were 20° to the left of the visual stimuli; that is, the auditory azimuth was varied between trials following a quasi-random order from −20° to −4° to the left of straight ahead, and visual azimuth was varied from 0° to +16° to the right of straight ahead. The auditory-visual bimodal stimulus consisted of 36 synchronous noise and light pulses (duration of the pulse train 17.6 sec; all other parameters were as in block 1; Fig. 2A). After 16, 20, 24, 28, or 32 pulses, the luminance of the visual stimulus was reduced by 40%. The moment of the change in luminance varied between trials following a quasi-random order. The participant was instructed to press the same key as used in block 1 as soon as the brightness changed, but was not allowed to move the pointer. Thus, even though eye position was not measured, one may assume that participants fixated the visual stimulus during the adaptation period. This procedure was used only to keep constant fixation and spatial attention to the visual stimulus component, and results of this task were not analyzed further. The duration of each trial was 20 sec. The complete block, consisting of 1800 pairs of sound and light pulses in all, thus lasted about 17 min. No instruction was given with respect to the auditory stimuli. When questioned after completion of the experiment, most participants reported that they were not aware of the spatial disparity between the auditory and visual stimuli.
Block 3 was identical with block 1 and began immediately after completion of block 2. Block 4 was presented after a rest of about 5 min. Conditions in block 4 were as in block 2, with the single difference that auditory stimuli were now 20° to the right of the visual stimuli. Auditory azimuth was varied between trials following a quasi-random order from +4° to +20° and visual azimuth was varied from −16° to 0°. The final block 5, following immediately after completion of block 4, was identical to blocks 1 and 3.
Session 2 only differed from session 1 in that the sequence of the blocks was reversed. That is, in block 2, auditory stimuli were presented 20° to the right of the visual stimuli, whereas in block 4, auditory stimuli were 20° to the left of the visual stimuli. The sequence of sessions 1 and 2 was balanced across participants.
Additional measurements were made with some of the participants, using smaller auditory-visual disparities in the adaptation condition (blocks 2 and 4). The position of the visual stimuli was as in the main experiment, but auditory stimuli were either 4° or 8° to the left or right of the visual stimuli.
Procedure for Experiment 2
The main conditions of Experiment 2 were as in Experiment 1. However, auditory and visual stimuli in the adaptation trials (blocks 2 and 4) were always presented in spatial alignment, with the visual stimuli being in the same positions as in Experiment 1. That is, in block 2 of session 1, the azimuthal position of the auditory-visual stimulus pair was varied from 0° to +16° to the right of straight ahead, and in block 4 from −16° to the left to 0°. In session 2, the sequence was reversed.
Procedure for Experiment 3
Experiment 3 differed from Experiment 1 by the use of pure tones as the auditory stimuli. In the localization condition (blocks 1, 3, and 5 of sessions 1 and 2), the frequency of the sound stimulus was always 1 kHz (all other parameters were as in Experiment 1). In the adaptation condition with block 4 of session 1 and block 2 of session 2, the frequency was also 1 kHz, whereas in block 2 of session 1 and block 4 of session 2 it was 4 kHz. Thus, localization of 1-kHz tones was tested after adaptation to disparity of visual stimuli and auditory stimuli that were either identical or deviating in frequency by two octaves.
Procedure for Experiment 4
The main conditions in Experiment 4 were as in Experiment 3. However, localization of 4-kHz tones was now tested after adaptation to auditory stimuli of either 4- or 1-kHz frequency. That is, the frequency of the auditory stimulus in the localization conditions, as well as in the adaptation conditions of block 4 of session 1 and block 2 of session 2, was always 4 kHz, and in block 2 of session 1 and block 4 of session 2 it was 4 kHz.
Data Analysis
For the main analyses, final pointer positions measured in block 1 of each session were taken as the preadaptation reference values. The differences between these reference values and the post-adaptation measurements of blocks 3 and 5 were calculated. Data for related post-adaptation conditions obtained in different sessions were pooled. Also, data for all stimulus azimuths were collapsed, because relations of pointing responses and target positions were shown to be approximately linear (cf. Figs. 3 and 4). Statistical comparisons were made between the resulting mean normalized shifts in azimuthal localization measured for different adaptation conditions. Negative shifts in localization are to the left, positive shifts to the right. Negative spatial disparities indicate that auditory stimuli were presented to the left of visual stimuli during the adaptation period; positive disparities indicate that auditory stimuli were to the right of visual stimuli.
Acknowledgments
I thank W.H. Ehrenstein and R. Guski for their extensive support throughout this study, C.R. Cavonius for valuable comments on the manuscript, P. Dillmann for preparing the software and parts of the electronic equipment, and S. Schulz for help running the experiments. This work was supported by the Deutsche Forschungsgemeinschaft (Gu 261/7-2, Eh 91/4-4).
The publication costs of this article were defrayed in part by payment of page charges. This article must therefore be hereby marked “advertisement” in accordance with 18 USC section 1734 solely to indicate this fact.
Footnotes
E-MAIL joerg.lewald@ruhr-uni-bochum.de; FAX 49-234-32-02074.
Article and publication are at http://www.learnmem.org/cgi/doi/10.1101/lm.51402.
REFERENCES
- Aitkin LM, Gates GR, Phillips SC. Responses of neurons in inferior colliculus to variations in sound-source azimuth. J Neurophysiol. 1984;52:1–17. doi: 10.1152/jn.1984.52.1.1. [DOI] [PubMed] [Google Scholar]
- Aitkin LM, Pettigrew JD, Calford MB, Phillips SC, Wise LZ. Representation of stimulus azimuth by low-frequency neurons in inferior colliculus of the cat. J Neurophysiol. 1985;53:43–59. doi: 10.1152/jn.1985.53.1.43. [DOI] [PubMed] [Google Scholar]
- Benevento LA, Fallon J, Davis BJ, Rezak M. Auditory-visual interaction in single cells in the cortex of the superior temporal sulcus and the orbital frontal cortex of the macaque monkey. Exp Neurol. 1977;57:849–872. doi: 10.1016/0014-4886(77)90112-1. [DOI] [PubMed] [Google Scholar]
- Brainard MS, Knudsen EI. Experience-dependent plasticity in the inferior colliculus: A site for visual calibration of the neural representation of the barn owl. J Neurosci. 1993;13:4589–4608. doi: 10.1523/JNEUROSCI.13-11-04589.1993. [DOI] [PMC free article] [PubMed] [Google Scholar]
- ————— Dynamics of visually guided auditory plasticity in the optic tectum of the barn owl. J Neurophysiol. 1995;73:595–614. doi: 10.1152/jn.1995.73.2.595. [DOI] [PubMed] [Google Scholar]
- Calvert GA. Crossmodal processing in the human brain: Insights from functional neuroimaging studies. Cerebral Cortex. 2001;11:1110–1123. doi: 10.1093/cercor/11.12.1110. [DOI] [PubMed] [Google Scholar]
- Calvert GA, Brammer MJ, Bullmore ET, Campbell R, Iversen SD, David AS. Response amplification in sensory-specific cortices during crossmodal binding. NeuroReport. 1999;10:2619–2623. doi: 10.1097/00001756-199908200-00033. [DOI] [PubMed] [Google Scholar]
- Canon LK. Intermodality inconsistency of input and directed attention as determinants of the nature of adaptation. J Exp Psychol. 1970;84:141–147. doi: 10.1037/h0028925. [DOI] [PubMed] [Google Scholar]
- ————— Directed attention and maladaptive “adaptation” to displacement of the visual field. J Exp Psychol. 1971;88:403–408. doi: 10.1037/h0030878. [DOI] [PubMed] [Google Scholar]
- DeBello WM, Feldman DE, Knudsen EI. Adaptive axonal remodelling in the midbrain auditory space map. J Neurosci. 2001;21:3161–3174. doi: 10.1523/JNEUROSCI.21-09-03161.2001. [DOI] [PMC free article] [PubMed] [Google Scholar]
- Ehret G. The auditory midbrain, a “shunting yard” of acoustical information processing. In: Ehret G, Romand R, editors. The central auditory system. New York: Oxford UP; 1997. pp. 259–316. [Google Scholar]
- Evans EF, Whitfield IC. Classification of unit responses in the auditory cortex of the unanaesthetized and unrestrained cat. J Physiol. 1964;171:476–493. doi: 10.1113/jphysiol.1964.sp007391. [DOI] [PMC free article] [PubMed] [Google Scholar]
- Fallon JH, Benevento LA. Auditory-visual interaction in cat orbital-insular cortex. Neurosci Lett. 1977;6:143–149. doi: 10.1016/0304-3940(77)90009-x. [DOI] [PubMed] [Google Scholar]
- Feldman DE, Knudsen EI. An anatomical basis for visual calibration of the auditory space map in the barn owl's midbrain. J Neurosci. 1997;17:6820–6837. doi: 10.1523/JNEUROSCI.17-17-06820.1997. [DOI] [PMC free article] [PubMed] [Google Scholar]
- Feldman DE, Brainard MS, Knudsen EI. Newly learned auditory responses mediated by NMDA receptors in the owl inferior colliculus. Science. 1996;271:525–528. doi: 10.1126/science.271.5248.525. [DOI] [PubMed] [Google Scholar]
- Fishman MC, Michael CR. Integration of auditory information in the cat's visual cortex. Vision Res. 1973;13:1415–1419. doi: 10.1016/0042-6989(73)90002-3. [DOI] [PubMed] [Google Scholar]
- Groh JM, Trause AS, Underhill AM, Clark KR, Inati S. Eye position influences auditory responses in primate inferior colliculus. Neuron. 2001;29:509–518. doi: 10.1016/s0896-6273(01)00222-7. [DOI] [PubMed] [Google Scholar]
- Guski R. Auditory localization: Effects of reflecting surfaces. Perception. 1990;19:819–830. doi: 10.1068/p190819. [DOI] [PubMed] [Google Scholar]
- Harris CS. Perceptual adaptation to inverted, reversed, and displaced vision. Psychol Rev. 1965;72:419–444. doi: 10.1037/h0022616. [DOI] [PubMed] [Google Scholar]
- Held R. Shifts in binaural localization after prolonged exposures to atypical combinations of stimuli. Am J Psychol. 1955;68:526–548. [PubMed] [Google Scholar]
- Helmholtz H. Handbuch der physiologischen Optik. Leipzig, Germany: Voss; 1867. [Google Scholar]
- Hyde PS, Knudsen EI. Topographic projection from the optic tectum to the auditory space map in the inferior colliculus of the barn owl. J Comp Neurol. 2000;421:146–160. doi: 10.1002/(sici)1096-9861(20000529)421:2<146::aid-cne2>3.0.co;2-5. [DOI] [PubMed] [Google Scholar]
- ————— The optic tectum controls visually guided adaptive plasticity in the owl's auditory space map. Nature. 2002;415:73–76. doi: 10.1038/415073a. [DOI] [PubMed] [Google Scholar]
- Jay MF, Sparks DL. Auditory receptive fields in primate superior colliculus shift with changes in eye position. Nature. 1984;309:345–347. doi: 10.1038/309345a0. [DOI] [PubMed] [Google Scholar]
- ————— Sensorimotor integration in the primate superior colliculus. II. Coordinates of auditory signals. J Neurophysiol. 1987;57:35–55. doi: 10.1152/jn.1987.57.1.35. [DOI] [PubMed] [Google Scholar]
- Kalil R, Freedman SJ. Compensation for auditory re-arrangement in the absence of observer movement. Percep Mot Skills. 1967;24:475–478. doi: 10.2466/pms.1967.24.2.475. [DOI] [PubMed] [Google Scholar]
- King AJ. A map of auditory space in the mammalian brain: Neural computation and development. Exp Physiol. 1993;78:559–590. doi: 10.1113/expphysiol.1993.sp003708. [DOI] [PubMed] [Google Scholar]
- King AJ, Parsons CH, Moore DR. Plasticity in the neural coding of auditory space in the mammalian brain. Proc Natl Acad Sci. 2000;97:11821–11828. doi: 10.1073/pnas.97.22.11821. [DOI] [PMC free article] [PubMed] [Google Scholar]
- Knudsen EI. Space coding in the vertebrate auditory system. In: Lewis B, editor. Bioacoustics: A comparative approach. London, UK: Academic Press; 1983. pp. 311–344. [Google Scholar]
- ————— Mechanisms of experience-dependent plasticity in the auditory localization pathway of the barn owl. J Comp Physiol A. 1999;185:305–312. doi: 10.1007/s003590050391. [DOI] [PubMed] [Google Scholar]
- Knudsen EI, Knudsen PF. Vision guides the adjustment of auditory localization in young barn owls. Science. 1985;230:545–548. doi: 10.1126/science.4048948. [DOI] [PubMed] [Google Scholar]
- ————— Vision calibrates sound localization in developing barn owls. J Neurosci. 1989;9:3306–3313. doi: 10.1523/JNEUROSCI.09-09-03306.1989. [DOI] [PMC free article] [PubMed] [Google Scholar]
- Knudsen EI, Zheng W, DeBello WM. Traces of learning in the auditory localization pathway. Proc Natl Acad Sci. 2000;97:11815–11820. doi: 10.1073/pnas.97.22.11815. [DOI] [PMC free article] [PubMed] [Google Scholar]
- Konishi M. Centrally synthesized maps of sensory space. Trends Neurosci. 1986;9:162–168. [Google Scholar]
- Kornheiser AS. Adaptation to laterally displaced vision: A review. Psychol Bull. 1976;83:783–816. [PubMed] [Google Scholar]
- Laurienti PJ, Burdette JH, Wallace MT, Yen Y-F, Field AS, Stein BE. Deactivation of sensory-specific cortex by cross-modal stimuli. J Cog Neurosci. 2002;14:420–429. doi: 10.1162/089892902317361930. [DOI] [PubMed] [Google Scholar]
- Lewald J, Ehrenstein WH. Visual and proprioceptive shifts in perceived egocentric direction induced by eye position. Vision Res. 2000;40:549–557. doi: 10.1016/s0042-6989(99)00197-2. [DOI] [PubMed] [Google Scholar]
- Lewald J, Karnath H-O, Ehrenstein WH. Neck-proprioceptive influence on auditory lateralization. Exp Brain Res. 1999;125:389–396. doi: 10.1007/s002210050695. [DOI] [PubMed] [Google Scholar]
- Lewald J, Dörrscheidt GJ, Ehrenstein WH. Sound localization with eccentric head position. Behav Brain Res. 2000;108:105–125. doi: 10.1016/s0166-4328(99)00141-2. [DOI] [PubMed] [Google Scholar]
- Luksch H, Gauger B, Wagner H. A candidate pathway for a visual instructional signal to the barn owl's auditory system. J Neurosci. 2000;20:RC70. doi: 10.1523/JNEUROSCI.20-08-j0002.2000. (1–4). [DOI] [PMC free article] [PubMed] [Google Scholar]
- Mazzoni P, Bracewell RM, Barash S, Andersen RA. Spatially tuned auditory responses in area LIP of macaques performing delayed memory saccades to acoustic targets. J Neurophysiol. 1996;75:1233–1241. doi: 10.1152/jn.1996.75.3.1233. [DOI] [PubMed] [Google Scholar]
- Middlebrooks JC, Knudsen EI. A neural code for auditory space in the cat's superior colliculus. J Neurosci. 1984;4:2621–2634. doi: 10.1523/JNEUROSCI.04-10-02621.1984. [DOI] [PMC free article] [PubMed] [Google Scholar]
- Moore DR, Hutchings ME, Addison PD, Semple MN, Aitkin LM. Properties of spatial receptive fields in the central nucleus of the cat inferior colliculus. II. Stimulus intensity effects. Hearing Res. 1984a;13:175–188. doi: 10.1016/0378-5955(84)90107-2. [DOI] [PubMed] [Google Scholar]
- Moore DR, Semple MN, Addison PD, Aitkin LM. Properties of spatial receptive fields in the central nucleus of the cat inferior colliculus. I. Responses to tones of low intensity. Hearing Res. 1984b;13:159–174. doi: 10.1016/0378-5955(84)90106-0. [DOI] [PubMed] [Google Scholar]
- Morrell F. Visual system's view of acoustic space. Nature. 1972;238:44–46. doi: 10.1038/238044a0. [DOI] [PubMed] [Google Scholar]
- Radeau M. Auditory-visual interaction and modularity. Curr Psychol Cogn. 1994;13:3–51. doi: 10.1007/BF02686854. [DOI] [PubMed] [Google Scholar]
- Radeau M, Bertelson P. Adaptation to auditory-visual discordance and ventriloquism in semirealistic situations. Percept Psychophys. 1977;22:137–146. [Google Scholar]
- ————— Cognitive factors and adaptation to auditory-visual discordance. Percept Psychophys. 1978;23:341–343. doi: 10.3758/bf03199719. [DOI] [PubMed] [Google Scholar]
- Recanzone GH. Rapidly induced auditory plasticity: The ventriloquism aftereffect. Proc Natl Acad Sci. 1998;95:869–875. doi: 10.1073/pnas.95.3.869. [DOI] [PMC free article] [PubMed] [Google Scholar]
- ————— Spatial processing in the auditory cortex of the macaque monkey. Proc Natl Acad Sci. 2000;97:11829–11835. doi: 10.1073/pnas.97.22.11829. [DOI] [PMC free article] [PubMed] [Google Scholar]
- Semple MN, Aitkin LM, Calford MB, Pettigrew JD, Phillips DP. Spatial receptive fields in the cat inferior colliculus. Hearing Res. 1983;10:203–215. doi: 10.1016/0378-5955(83)90054-0. [DOI] [PubMed] [Google Scholar]
- Stein BE, Meredith MA. The merging of the senses. Cambridge, MA: MIT Press; 1993. [Google Scholar]
- Stratton GM. Some preliminary experiments on vision without inversion of the retinal image. Psychol Rev. 1896;3:611–617. [Google Scholar]
- ————— Vision without inversion of the retinal image. Psychol Rev. 1897;4:341–360. , 463–481. [Google Scholar]
- Stricanne B, Andersen RA, Mazzoni P. Eye-centered, head-centered, and intermediate coding of remembered sound locations in area LIP. J Neurophysiol. 1996;76:2071–2077. doi: 10.1152/jn.1996.76.3.2071. [DOI] [PubMed] [Google Scholar]
- Sur M, Pallas SL, Roe AW. Cross-modal plasticity in cortical development: Differentiation and specification of sensory neocortex. Trends Neurosci. 1990;13:227–233. doi: 10.1016/0166-2236(90)90165-7. [DOI] [PubMed] [Google Scholar]
- Vaadia E, Benson DA, Hienz RD, Goldstein MH. Unit study of monkey frontal cortex: Active localization of auditory and of visual stimuli. J Neurophysiol. 1986;56:934–952. doi: 10.1152/jn.1986.56.4.934. [DOI] [PubMed] [Google Scholar]
- Wallace MT, Wilkinson LK, Stein BE. Representation and integration of multiple sensory inputs in primate superior colliculus. J Neurophysiol. 1996;76:1246–1266. doi: 10.1152/jn.1996.76.2.1246. [DOI] [PubMed] [Google Scholar]
- Welch RB. Perceptual modification: Adapting to altered sensory environments. New York: Academic Press; 1978. [Google Scholar]
- Wickelgren BG. Superior colliculus: Some receptive field properties of bimodally responsive cells. Science. 1971;173:69–71. doi: 10.1126/science.173.3991.69. [DOI] [PubMed] [Google Scholar]
- Zheng W, Knudsen EI. GABAergic inhibition antagonizes adaptive adjustment of the owl's auditory space map during the initial phase of plasticity. J Neurosci. 2001;21:4356–4365. doi: 10.1523/JNEUROSCI.21-12-04356.2001. [DOI] [PMC free article] [PubMed] [Google Scholar]


