Abstract
The subpopulation of CD4+CD25+ immunoregulatory T (Tr) cells constitutes 5%–10% of CD4+ cells in humans. These cells play a crucial role in the control of tumor immune response. In this study, we evaluated the distribution of Tr cells in tumor-infiltrating lymphocytes of human glioblastoma multiforme and examined the difference between the brain and autologous blood with respect to Tr cells. Glioma samples from 10 patients were classified as WHO grade IV astrocytoma. Control samples were obtained from patients undergoing resection of a seizure focus. The samples were analyzed by flow cytometry to determine the frequency of Tr cells and by real-time PCR for forkhead box P3 (FOXP3) expression. We then examined the expression of CD62L, CD45RO, and cytotoxic T-lymphocyte-associated protein 4 (CTLA-4) and assessed the functionality of Tr cells in vitro. There was a significant difference in the number of FOXP3-expressing CD4+CD25+ T cells within glioma-infiltrating lymphocytes as compared to controls (P < 0.01). This difference was further observed in studies of autologous patient blood and control blood. The expression level of FOXP3 mRNA was high in Tr cells and weak in CD4+CD25− T cells. Moreover, the expression of CD62L and CTLA-4 was elevated in glioma Tr cells as compared to that in the controls. These cells were also CD45RO positive. Functional assays confirmed the suppressive activity of Tr cells in patients with glioma. The expression of CD4+CD25+FOXP3+ T cells was significantly higher in patients with glioblastoma multiforme than in controls. This increase in the frequency of Tr cells that display suppressive activity might play a role in modulation of the immune response against glioma. In light of these findings, Tr cells may represent a potential target for immunotherapy of malignant brain tumors.
Keywords: glioma, immunotherapy, regulatory T cells, tumor-infiltrating lymphocyte
Regulatory T (Tr)3 CD4+CD25+ cells constitute approximately 5%–10% of peripheral CD4+ cells (Gavin and Rudensky, 2003; Maloy and Powrie, 2001; Piccirillo and Shevach, 2004; Sakaguchi et al., 2001). Tr cells were first identified by their expression of CD25 (IL-2Rα chain) (Jonuleit et al., 2001). However, CD25 is an activation marker for Tr cells, present also on the surface of the T helper cells Th1 and Th2. Additional markers expressed by these cells include cytotoxic T-lymphocyte-associated protein 4 (CTLA-4), GITR (glucocorticoid-induced tumor necrosis factor receptor), lymphocyte activation gene 3, CD38, CD62L, and the transcriptional forkhead box P3 (FOXP3) repressor (Atabani et al., 2005; Fontenot et al., 2005; Jonuleit et al., 2001; Noma et al., 2005).
It has been shown that Tr cells can be generated in vitro or in vivo from human CD4+CD25− T cells under various stimulation conditions and that generation of these cells correlates with induction of FOXP3 expression (Fontenot et al., 2003, 2005). These results suggest that FOXP3 is a specific molecular marker of Tr cells for discrimination between Tr cells and activated regulatory T cells. The absence of CD4+CD25+FOXP3+ T cells is associated with severe autoimmunity (Sakaguchi et al., 2001). It has been proposed that mechanisms underlying autoimmunity and tumor immunity are linked (Turk et al., 2002). Experimental tumor models have shown that depletion of CD25+ T cells changes the immune response to tumors both in vitro and in vivo. The mechanism by which Tr cells regulate responses in vivo is unknown, and the contribution of Tr-cell-derived cytokines in disease regulation remains controversial. Tr cells are exceptional because their main role seems to be suppression of the function of other cells; hence they are called suppressor cells (Jiang and Chess, 2004). The suppressive mechanisms of Tr cells are not clear, but there is evidence that cell-cell contact is required and that expression of the inhibitory costimulatory molecule CTLA-4 (also called CTLA antigen 4) might be involved. Recently, CTLA-4 was implicated in regulatory T-cell development and was shown to account for the link between polymorphisms at this locus and the biological outcome of adaptive immune responses to self and to pathogens (Atabani et al., 2005). To date, an increased population of Tr cells has been reported in patients with gastric cancer (Ichihara et al., 2003; Wolf et al., 2003), colorectal cancer (Hickey, 1999), pancreatic cancer (Liyanage et al., 2002; Sasada et al., 2003), ovarian cancer, and lung cancer (Woo et al., 2001).
In humans, the presence of tumor-infiltrating lymphocytes (TILs) may be predictive of improved clinical outcomes (Woo et al., 2002), which supports the concept that tumors are antigenic and immunogenic and that the immune system is alert against cell transformation. In this study, several markers known to be expressed on Tr cells were investigated in the context of malignant brain tumors, and we report the first characterization of Tr cells from TILs of glioma patients, compared to peripheral blood of these patients and to controls. Our data show an increase of Tr cells in glioma and peripheral blood and suggest that these cells may downregulate the antitumor response in the CNS.
Materials and Methods
Tissue Specimens
Glioma samples were obtained from 10 patients undergoing a craniotomy for tumor resection at the University of Chicago. Control brain tissue was obtained from six patients undergoing a temporal lobectomy for seizures (Table 1). All tumor specimens were classified as grade IV glioblastoma multiforme. Peripheral blood was obtained during the time of the surgery from each of the groups. Of note, the study group and the control group both received perioperative steroids and underwent otherwise similar anesthesia. This study was approved by the Institutional Review Board of the University of Chicago.
Table 1.
Clinicopathologic features of patients with glioma and controls*
| Characteristic | Number of Patients† |
|---|---|
| A. Patients with glioblastoma multiforme | |
| Gender | |
| Male | 6 |
| Female | 4 |
| Average age | |
| Male | 52 (range, 30–62) |
| Female | 60 (range, 47–69) |
| Location of tumor | |
| Frontal | 2 |
| Parietal | 3 |
| Temporal | 4 |
| Occipital | 1 |
| Prior history of craniotomy, radiotherapy, and chemotherapy | 5 |
| B. Controls* | |
| Gender | |
| Male | 4 |
| Female | 2 |
| Average age | |
| Male | 41 (range, 33–52) |
| Female | 43 (range, 37–51) |
| Location of seizure focus | |
| Right | 5 |
| Left | 1 |
Control brain tissue was obtained from six patients undergoing temporal lobectomy for seizures.
Age is shown as an average value.
Collection of Peripheral Blood Mononuclear Cells
Peripheral venous blood (10–20 ml) was collected into heparinized tubes. The samples were hand carried to the laboratory and immediately centrifuged on Ficoll-Hypaque (Amersham Biosciences, Piscataway, N.J.). Peripheral blood mononuclear cells (PBMCs) were recovered, washed in staining buffer (PBS, 3% fetal calf serum), and used immediately for experiment.
T-Cell Isolation from Tumor
Cell suspensions of tumor were prepared by mechanical disruption of the tissue with a 16-gauge needle. The cells were then passed through a cell strainer and washed with PBS. Peripheral blood lymphocytes were isolated by centrifugation on Ficoll gradient, washed in staining buffer, and used immediately for analysis by flow cytometry.
Multicolor Flow Cytometry Analysis
Tumor and peripheral blood lymphocytes (1 × 10⁶ in 50 μl) were stained with 2 μl of antibody and incubated for 45 min at 4°C in the wells of round-bottom 96-well microtiter plates (BD Biosciences, San Jose, Calif.) to determine their immunophenotype. The antibodies used were anti-CD25-PE (1 μg/ml), anti-CD4-fluorescein isothiocyanate (2 μg/ml), anti-CD3-PE (1 μg/ml), anti-CD62L (5 μg/ml), anti-CD45RO (5 μg/ml), and anti-CTLA-4 (5 μg/ml) (BD Biosciences). The intracellular FOXP3 was stained as described by the manufacturer (eBioscience, San Diego, Calif.). Flow cytometry was performed on a FACSCalibur (Becton Dickinson, BD Biosciences) and analyzed with FlowJo software (Ashland, Oreg.).
Cell Sorting
The CD4+ T cells were directly purified from isolated cell suspension by incubation at 4°C for 15 min with 10 μl of antihuman CD4 microbeads per 107 total cells and positively sorted in a multiparameter magnetic cell sorter system (MACS; Miltenyi Biotech, Auburn, Calif.). After three washes in complete medium, the CD4-positive cells were stained with anti-CD25 (1 μg/ml). The Tr cells were sorted according to the functional activity of CD4+CD25+ T cells, described and illustrated in Results. Cell sorting was performed by using a MoFlo instrument (Cytomation, Fort Collins, Col.).
Cell-Proliferation Assay
CD4+CD25− and CD4+CD25+ cells from a glioma patient were sorted and purified as described under Cell Sorting. Cells from both fractions were incubated in different ratios and cultured on anti-CD3 monoclonal antibody (mAb) (10 ng/ml; BD PharMingen, San Diego, Calif.)–coated, 96-well, round-bottomed plates in the presence of anti-CD28 mAb (10 μg/ml; BD PharMingen) for 72 h. Cell proliferation was measured by incorporation of [3H]thymidine (1 μCi/well). The cells were harvested after 48 h, and thymidine incorporation was expressed as counts per minute.
Real-Time PCR Analysis
Total RNA was isolated by using an RNeasy kit (Ambion, Austin, Tex.). cDNA was made with the Superscript II reverse transcriptase kit (Invitrogen, Carlsbad, Calif.) and amplified by PCR using Red Taq polymerase (Sigma, St. Louis, Mo.). Primers were purchased from Invitrogen. The following primers were used to amplify FOXP3 target-gene cDNA: human GAPDH (forward: 5′-gtcgccagatttggtcgtat-3′; reverse: 5′-aggggagattcagtgtggtg-3′) and FOXP3 (forward: 5′-cgtgacagtttcccacaagc-3′; reverse: 5′-cctgttcgtccatcctcctt-3′).
Quantitative analysis of cDNA amplification was assessed by incorporation of SYBR Green into dsDNA. PCR reactions containing 1 μg of cDNA template, 0.5 μM each of the primers, and SYBR Green PCR Master Mix (Applied Biosystems, Foster City, Calif.) were performed in a total volume of 25 μl under the following conditions: 15-min hot start at 95°C, 15-s denaturation at 95°C, 20-s annealing of primers at 54°C, and 15-s elongation at 72°C, for 40 to 60 cycles. Gene expression was analyzed with the ABI Prism 7700 sequence detector (Applied Biosystems) and ABI Prism SDS software version 1.9.1 (Applied Biosystems). Samples were normalized by dividing the quantity of the FOXP3 gene by the value of the endogenous reference gene (GAPDH). Quadruplicate reactions were done using all cDNA samples. Relative expression was calculated for each gene by using the ΔCT (threshold cycle) method.
Statistical Analysis
Paired or unpaired groups were compared by using the appropriate Student’s t-tests. A P value of <0.05 was defined as statistically significant. All statistical analyses were performed with the SPSS statistical software package (SPSS 12.0 for Windows; SPSS Inc., Chicago, Ill.).
Results
Frequency of Lymphocytes in Brain and Blood of Patients with Glioma
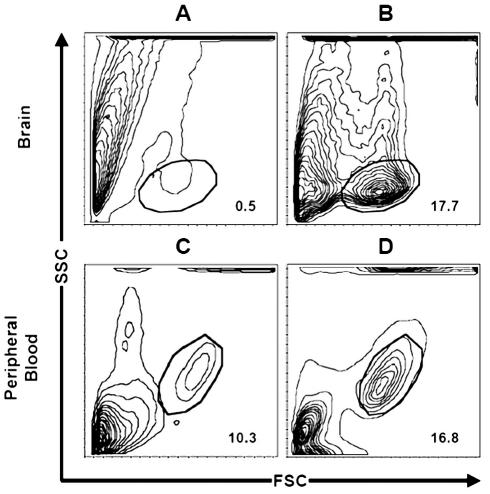
T cells isolated from TILs were first gated on total lymphocytes via their forward and side scatter properties. As shown in Fig. 1, the frequency of TILs was significantly increased (P < 0.01) in brain tumors (mean, 17.7% ± 2.7%; range, 12%–21.4%) versus controls (mean, 0.5% ± 0.28%; range, 0–0.85%). Similarly, we observed a significant (P < 0.01) increase in total autologous blood lymphocytes (mean, 16.8% ± 1.9%; range, 13.6%–20%) obtained from tumor patients as compared to peripheral blood (mean, 10.3% ± 1.51%; range, 7.8%–12.4%) from controls.
Fig. 1.
T-cell infiltrate in brain and blood of patients with malignant glioma. As compared to healthy brain (A), there is an increased percentage of tumor-infiltrating lymphocytes in brain with glioma (B). The frequency of TILs was significantly increased (P < 0.01) in brain tumors (mean, 17.7% ± 2.7%; range, 12%–21.4%) versus control brain (mean, 0.5% ± 0.28%; range, 0–0.85%). In addition, in comparison with percentage of total lymphocytes in the blood of control patients (C) (mean, 10.3% ± 1.51%; range, 7.8%–12.4%), there is an increased percentage of total lymphocytes in the blood of glioma patients (D) (mean, 16.8% ± 1.9%; range, 13.6%–20%) (P < 0.01). Cells were gated on lymphocytes via their forward and side scatter properties.
Frequency of Tr Cells in TILs of Glioma Patients and Control Blood
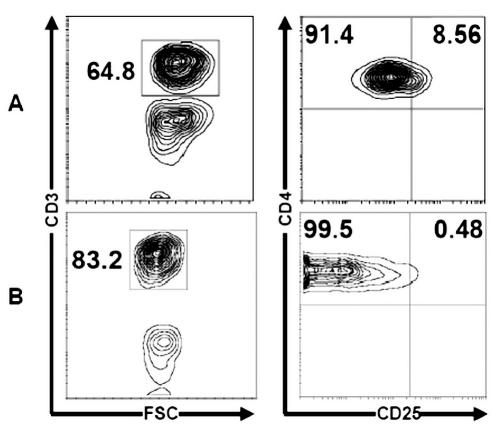
The frequency of Tr cells was defined as the frequency of cells that express a high level of CD25. The analysis of CD4+CD25+ T cells is shown in Fig. 2 as a percentage of total CD3+ cells evaluated in TILs of brain by flow cytometric analysis with triple-color staining. In our subset of 10 patients with glioma, the mean proportion of Tr cells in TILs was 24.7% ± 2.54% (range, 19.1%–27%) (Fig. 2). Tr cells were absent from control brain. Moreover, the frequency of Tr cells in glioma patients’ blood was increased when compared with the frequency observed in control blood (8.56% ± 2.46% [range, 6.4%–12.4%] vs. 0.48% ± 0.13% [range, 0.26%–0.7%]; P < 0.05) (Fig. 3). These data are summarized in Table 2.
Fig. 2.
Regulatory T cell frequency in total CD3+ T cells of brain. Flow cytometric analysis of CD3+ T cells (I) and CD4+CD25+ T cells (II) from brain with malignant glioma (A) and control brain (B). The mean of Tr cells in glioma-infiltrating lymphocytes was 24.7% ± 2.54% (range, 19.1%–27%), and Tr cells were absent from control brain. Representative FACS plots are shown demonstrating (I) CD3 and (II) CD4 versus CD25 staining.
Fig. 3.
Analysis of CD4+CD25+ T cells in peripheral blood. Autologous blood from glioma patient (A) versus control blood (B). Representative FACS plots are shown demonstrating CD3 (I) and CD4 and CD25 (II) staining. The frequency of Tr cells in the glioma patient’s blood was increased when compared with the frequency observed in control blood (8.56% ± 2.46% [range, 6.4%–12.4%] vs. 0.48 ± 0.13% [range, 0.26%–0.7%]; P < 0.05). Cumulative results of flow cytometric analyses of regulatory T cells are shown as the percentage of total CD4+ or CD3+ T cells.
Table 2.
Percentage of regulatory T cells in total CD3+ T cells in brain and in peripheral blood of glioma patients and controls
| Source | % CD3+ T cells | % CD4+CD25− | % CD4+CD25+ |
|---|---|---|---|
| A. Brain | |||
| TILs in glioma | 25.1 ± 2.08 | 18.9 ± 1.56 | 6.2 ± 0.51 |
| Control | 0 | 0 | 0 |
| B. Peripheral blood | |||
| Glioma | 64.8 ± 3.14 | 59.22 ± 2.87 | 5.54 ± 0.26 |
| Control | 83.2 ± 2.76 | 82.78 ± 2.74 | 0.4 ± 0.10 |
| P | <0.05 | <0.05 | <0.05 |
Abbreviation: TILs, tumor-infiltrating lymphocytes.
FOXP3 Expression in CD4+ T Cell Population
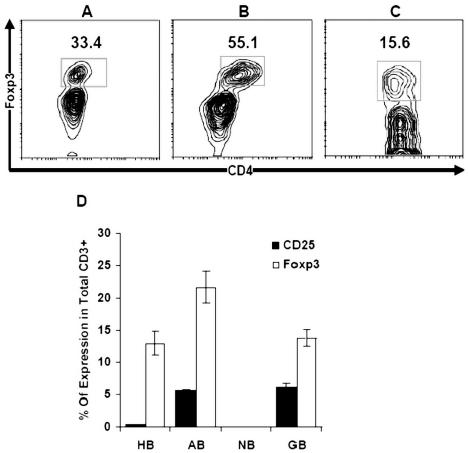
The intracellular expression of FOXP3 in patients with grade IV glioma was analyzed with flow cytometry and triple color. We found that 55.1% ± 1.88% (range, 51%–62.4%) of CD4+ cells in tumor infiltrates versus 33.4% ± 1.95% (range, 29.7%–38.4%) of CD4+ cells in autologous blood versus 15.6% ± 0.76% (range, 13.2%–17.1%) in control blood express FOXP3 (P < 0.01) (Fig. 4A–C). The expression of FOXP3 confirmed the presence of regulatory T cells in TILs. Although Tr cells in both blood and tumor infiltrates coexpressed FOXP3 and CD25+, the expression of FOXP3 was more pronounced in the CD4+CD25+ subset (Fig. 4D).
Fig. 4.
Expression of intracellular FOXP3 in total CD4+ cells. Higher levels of FOXP3 expression in CD4+CD25+ cells were observed in (B) regulatory T cells isolated from tumor tissue (55.1% ± 1.88%; range, 51%–62.4%) versus (A) autologous patient blood (33.4% ± 1.95%; range, 29.7%–38.4%) versus (C) control blood (15.6% ± 0.76%; range, 13.2%–17.1%) (P < 0.01). (D) Comparison of FOXP3 and CD25 expression on Tr in TILs, autologous blood, and peripheral blood of control. Abbreviations: HB, healthy blood; AB, autologous blood; NB, control brain; GB, glioma brain.
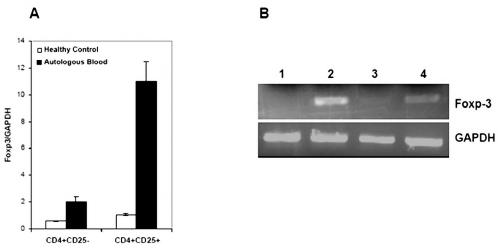
We further analyzed FOXP3 mRNA levels in either sorted CD4+CD25− or CD4+CD25+ cells obtained from patients with glioma versus the blood of controls. The real-time PCR data shows that the level of FOXP3 mRNA was fivefold to sixfold higher in CD4+CD25+ cells than in CD4+CD25− cells of glioma patients (Fig. 5A). This difference was significant with respect to control (P < 0.05). The result of semiquantitative PCR confirms the previously observed data, where the level of FOXP3 was increased in CD4+CD25+ cells (Fig. 5B).
Fig. 5.
Level of FOXP3 expression in CD4+ T cell subsets. FOXP3 quantification by real-time PCR (A) and semiquantitative PCR (B) in CD4+ T cells. The real-time PCR data shows that the level of FOXP3 mRNA was fivefold to sixfold higher in CD4+CD25+ cells (A). This difference was significant with respect to control (P < 0.05). Lines 1 and 2 consisted of CD4+CD25− and CD4+CD25+ sorted from autologous blood, and lines 3 and 4 consisted of CD4+CD25− and CD4+CD25+ sorted from control blood donor. CD4+CD25− and CD4+CD25+ were sorted separately from PBMCs with more than 97% purity.
Expression of CD62L, CD45RO, and CTLA-4 in CD4+CD25+ T Cells
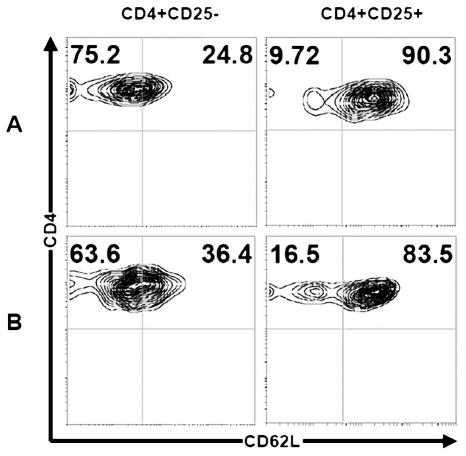
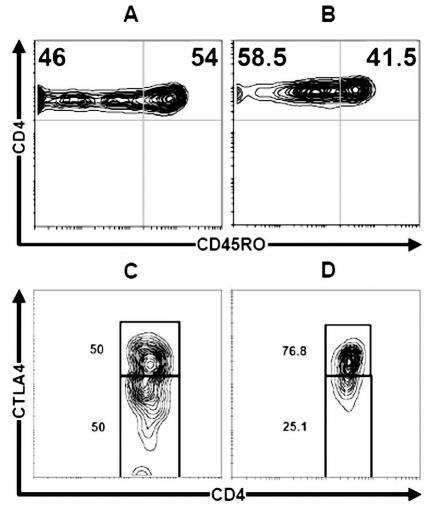
The phenotype of CD4+ T cells was analyzed for CD62L expression in different subsets of CD4+ T cells expressing CD25 (Fig. 6). The prevalence of Tr was compared in autologous PBMCs and control donors. Figure 6 shows an expansion of CD25−CD62L− subsets in glioma patient blood (mean, 75.2% ± 4.03%; range, 70%–81%) compared to control blood (mean, 63.6% ± 3.74%; range, 58%–69%) (P < 0.01). The same expansion of CD25+CD62L+ was seen in glioma patients (mean, 90.3% ± 2.83%; range, 88%–97%) versus controls (mean, 83.5% ± 4.34%; range, 77%–88%) (P < 0.01). Moreover, the Tr-cell phenotype was membrane positive for CD45RO (Fig. 7). In autologous blood of glioma patients, the pool of CD4+ T cells was CD45RO positive (mean, 41.5% ± 1.73%; range, 38.5%–43%), but the expression level of CD45RO was less than in control donors (mean, 54% ± 2.45%; range, 50%–57%) (P < 0.02) (Fig. 7A and B). Mean CTLA-4 expression on CD4+CD25+ regulatory T cells in autologous blood and control blood was 76.8% ± 2.1% (range, 74%–80.5%) versus 50% ± 1.8% (range, 47.7%–52%), respectively (Fig. 7C and D) (P < 0.01).
Fig. 6.
Regulatory T cells show suppressor phenotype. The expression of CD62L after gating of CD4+CD25+ or CD4+CD25− cells in autologous blood of patients (A) and control blood (B). The left panels of rows A and B show, respectively, an expansion of CD25−CD62L− subsets in glioma patient (mean, 75.2% ± 4.03%; range, 70%–81%) compared to control blood (mean, 63.6% ± 3.74%; range, 58%–69%) (P < 0.01). The same expansion of CD25+CD62L+ was seen in glioma patients (mean, 90.3% ± 2.83%; range, 88%–97%) versus controls (mean, 83.5% ± 4.34%; range, 77%–88%) (P < 0.01). The cells were stained with three-color fluorescence and analyzed by fluorescent flow cytometry.
Fig. 7.
Expression of CD45RO and CTLA-4 on CD4+ T cells. Flow cytometric analysis of CD45RO and CTLA-4 (CD152) on CD4+CD25+ T cells. A and C. Control blood. B and D. Autologous patient blood. In autologous blood of glioma patients, the pool of memory CD4+CD45RO+ T cells was CD45RO positive (mean, 41.5% ± 1.73%; range, 38.5%–43%), but the expression level of CD45RO was less than in control donors (mean, 54% ± 2.45%; range, 50%–57%) (P < 0.02) (A and B). The CTLA-4 expression on CD4+CD25+ T cells in autologous blood and control blood was 76.8% ± 2.1% [range, 74%–80.5%] versus 50% ± 1.8% [range, 47.7%–52%], respectively (C and D) (P < 0.01).
Functional Activity of CD4+CD25+ T Cells
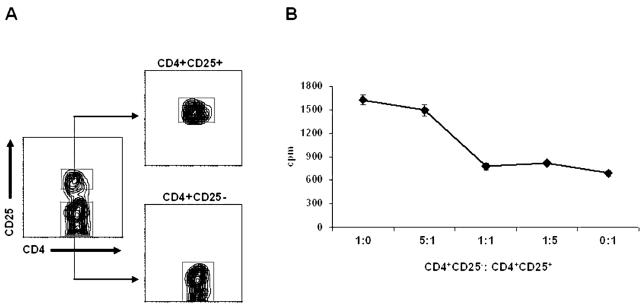
CD4+CD25+ and CD4+CD25− cells obtained from glioma were sorted as shown in Fig. 8A. The functional capacity of CD4+CD25+ cells was then analyzed in a dose-dependent manner by incubating the cells with autologous CD4+CD25− T cells. As shown in Fig. 8B, these CD4+CD25+ T cells show suppressive activity, a function that is consistent with the function of Tr cells.
Fig. 8.
In vitro suppression assay. CD4+CD25− T cells were cocultured alone or with CD4+CD25+ T cells at different ratios and stimulated with anti-CD3 and anti-CD28. Proliferation was assessed by [3H]thymidine incorporation. The results represent the average [3H]thymidine incorporation (cpm) from five replicate wells per culture. A. Gates used for sorting Tr cells. B. Suppressor activity of CD4+CD25+ T cells.
Discussion
The CNS has long been regarded as an immunologically privileged site. The mechanisms limiting immunoreactivity in the CNS are incompletely understood. The absence of naive T cells in the brain, low major histocompatibility complex expression in the brain parenchyma, and lack of adequate lymphatics are all factors that likely contribute to the lack of immune responses in the brain (Hickey, 1999; Hickey et al., 1991). However, there is increasing evidence that T lymphocytes and major histocompatibility complex antigens are detectable in the CNS during illness and disease (Horwitz et al., 1999). In fact, the brain can be the site of an aberrant immune response, as in the case of multiple sclerosis (Baranzini et al., 2005; Hafler et al., 2005; O’Connor et al., 2001). Moreover, the presence of TILs within high-grade gliomas has prompted a renewed interest in the role of T cells in primary brain tumors (Giometto et al., 1996; Kaluza et al., 1993; Mitchell et al., 2003).
Glioblastomas are highly infiltrative tumors that do not generally metastasize outside the brain. Immunohistological and molecular analyses of human malignant astrocytoma have shown that T-cell infiltration occurs frequently (Giometto et al., 1996; Kaluza et al., 1993; Perrin et al., 1999), but it has only occasionally been correlated with a favorable prognosis (Brooks et al., 1978). Elimination of a solid brain tumor by immune effector cells is a formidable challenge. Not only are these tumors protected from the immune system by the presence of the blood-brain barrier, but many of them secrete soluble factors that directly inhibit an active immune response (Giometto et al., 1996; Hishii et al., 1995; Kaluza et al., 1993; Sasaki et al., 1995; Schweitzer et al., 2001).
The published data regarding suppressive activities of Tr in patients with tumors (Dunn et al., 2002; Liyanage et al., 2002; Wolf et al., 2003) provide a rationale for analyzing this subset of T cells within glioblastomas. The localization of Tr cells to tumor site in glioma has not been previously investigated. Our results reveal that Tr cells are increased in glioma infiltrates and autologous blood as compared with tumor-free brain and control blood. Moreover, we have shown an expansion of the CD4+CD25+CD62L+ subset in peripheral blood of patients with glioma. Within the Tr-cell population, CD62+ Tr cells have been described as more efficient suppressors of T-cell proliferation than are CD62L− Tr cells (Kohm and Miller, 2003). Similar results were seen in the context of CTLA-4, a cell surface receptor that behaves as a negative regulator of the proliferation and the effector function of T cells (von Boehmer, 2005). Our functional study further confirms the suppressive function of Tr cells in patients with glioma, as CD4+CD25+ cells inhibited the proliferative response of CD4+CD25− T cells upon T-cell receptor stimulation. Taken together, our results suggest that the expansion of Tr with a suppressive activity in glioma patients may downregulate the antitumor response in the CNS.
When we compared the frequency of Tr cells in patient autologous PBMCs and in control donors, the frequency of Tr cells was elevated in patients with tumors. This suggests that, under normal circumstances, CD4+CD25− may suppress CD4+CD25+ in the periphery. Evidence for this comes from published literature, which indicates that the maintenance of CD25 expression by CD4+CD25+ cells depends on interleukin 2 secreted by cotransferred CD4+CD25− or by antigen-stimulated T cells in peripheral lymphoid organs (Curotto de Lafaille et al., 2004). In addition, CD4+CD25− cells can produce a number of immunosuppressive cytokines such as interleukin-10 and transforming growth factor β, which have been shown to down-regulate Tr cells (Dieckmann et al., 2005; Noma et al., 2005). The degree of such suppression is likely to be critical, since the loss of CD4+CD25+ cells is also associated with cases of autoimmune disease as well as graft-versus-host disease induction (Hoffmann et al., 2002; Kohm et al., 2003; Lee et al., 2004).
The forkhead/winged helix transcription factor FOXP3 is a master gene for Tr-cell function (Fontenot et al., 2005) and dominant tolerance (Rudensky, 2005). We have shown that the prevalence of FOXP3+ Tr cells is significantly elevated both in tumors and in autologous blood of patients. This further supports the immunosuppressive nature of Tr cells in patients with malignant glioma. One critical question that remains unanswered is how FOXP3 causes T cells to become regulatory. Choi et al. (2005) have shown that FOXP3 can induce heme oxygenase-1 (HO-1) expression and, subsequently, regulatory phenotypes such as the suppression of non-transfected cells in a cell-cell contact-dependent manner, as well as impaired proliferation and production of cytokines upon stimulation in Jurkat T cells. Moreover, the authors confirmed that the suppressive function of the cells was relieved by the inhibition of HO-1 activity. These findings may have important implications for glioma, where the expression of HO-1 has been shown to be elevated and responsible for tumor progression and angiogenesis (Deininger et al., 2000; Nishie et al., 1999).
As a functional consequence of an increased proportion of Tr cells, it has been shown that Tr cells can suppress immune responses of other CD4+ and CD8+ cells (Albers et al., 2005; Woo et al., 2001). It has also been shown that CD4+CD25+ Tr cells suppress the proliferation, cytokine secretion, and cytotoxic activity of Vα24+ natural killer T cells (Azuma et al., 2003). Thus, one of the explanations for impaired cell-mediated immunity in cancer-bearing hosts is the increased prevalence of Tr cells. More studies are needed to address the roles of the two types of Tr cells (natural and inducible) and to understand which one of them elicits a greater antitumor immune response. In line with these results, recent pre-clinical studies suggest that these cells are likely to play a key role in the development of tumor immunotherapy, because tumor immunity can be induced in nonresponding animals through the depletion of CD4+CD25+ cells (Casares et al., 2003; Shimizu et al., 1989). It is therefore possible that depletion of Tr cells via intravenous injection of anti-CD25 mAb can achieve vigorous, cytotoxic-T-lymphocyte-mediated immune rejection of a cerebral malignancy, a finding that we are currently attempting to corroborate and one that could be translated to the clinic.
Conclusions
In conclusion, our results show simultaneous increase of Tr cells in the tumors and peripheral blood of patients with glioblastoma. These results represent the first report of Tr cells in malignant glioma. Effective antitumor responses in individuals with cancer depend on the presence and function of immune cells that can recognize and eliminate tumor cells (Javia and Rosenberg, 2003; Marshall et al., 2004; Woo et al., 2001). However, immunotherapy for brain tumors must overcome some of these protective mechanisms to achieve the rejection of glioma cells without disturbing the delicate balance that protects against autoimmune disease of the central nervous system.
Footnotes
Support for this work was provided by The University of Chicago Cancer Research Center Seed Grant Program.
Abbreviations used are as follows: CTLA-4, cytotoxic T lymphocyte–associated protein 4; FOXP3, forkhead box P3; HO-1, heme oxygenase-1; mAb, monoclonal antibody; PBMC, peripheral blood mononuclear cells; TIL, tumor-infiltrating lymphocyte; Tr, immunoregulatory T (cell).
References
- Albers AE, Ferris RL, Kim GG, Chikamatsu K, Deleo AB, Whiteside TL. Immune responses to p53 in patients with cancer: Enrichment in tetramer+ p53 peptide-specific T cells and regulatory T cells at tumor sites. Cancer Immunol Immunother. 2005;54:1072–1081. doi: 10.1007/s00262-005-0670-9. [DOI] [PMC free article] [PubMed] [Google Scholar]
- Atabani SF, Thio CL, Divanovic S, Trompette A, Belkaid Y, Thomas DL, Karp CL. Association of CTLA4 polymorphism with regulatory T cell frequency. Eur J Immunol. 2005;35:2157–2162. doi: 10.1002/eji.200526168. [DOI] [PubMed] [Google Scholar]
- Azuma T, Takahashi T, Kunisato A, Kitamura T, Hirai H. Human CD4+ CD25+ regulatory T cells suppress NKT cell functions. Cancer Res. 2003;63:4516–4520. [PubMed] [Google Scholar]
- Baranzini SE, Bernard CC, Oksenberg JR. Modular transcriptional activity characterizes the initiation and progression of autoimmune encephalomyelitis. J Immunol. 2005;174:7412–7422. doi: 10.4049/jimmunol.174.11.7412. [DOI] [PubMed] [Google Scholar]
- Brooks WH, Markesbery WR, Gupta GD, Roszman TL. Relationship of lymphocyte invasion and survival of brain tumor patients. Ann Neurol. 1978;4:219–224. doi: 10.1002/ana.410040305. [DOI] [PubMed] [Google Scholar]
- Casares N, Arribillaga L, Sarobe P, Dotor J, Lopez-Diaz de Cerio A, Melero I, Prieto J, Borras-Cuesta F, Lasarte JJ. CD4+/CD25+ regulatory cells inhibit activation of tumor-primed CD4+ T cells with IFN-gamma-dependent antiangiogenic activity, as well as long-lasting tumor immunity elicited by peptide vaccination. J Immunol. 2003;171:5931–5939. doi: 10.4049/jimmunol.171.11.5931. [DOI] [PubMed] [Google Scholar]
- Choi BM, Pae HO, Jeong YR, Kim YM, Chung HT. Critical role of heme oxygenase-1 in Foxp3-mediated immune suppression. Biochem Biophys Res Commun. 2005;327:1066–1071. doi: 10.1016/j.bbrc.2004.12.106. [DOI] [PubMed] [Google Scholar]
- Curotto de Lafaille MA, Lino AC, Kutchukhidze N, Lafaille JJ. CD25− T cells generate CD25+Foxp3+ regulatory T cells by peripheral expansion. J Immunol. 2004;173:7259–7268. doi: 10.4049/jimmunol.173.12.7259. [DOI] [PubMed] [Google Scholar]
- Deininger MH, Meyermann R, Trautmann K, Duffner F, Grote EH, Wickboldt J, Schluesener HJ. Heme oxygenase (HO)-1 expressing macrophages/microglial cells accumulate during oligodendroglioma progression. Brain Res. 2000;882:1–8. doi: 10.1016/s0006-8993(00)02594-4. [DOI] [PubMed] [Google Scholar]
- Dieckmann D, Plottner H, Dotterweich S, Schuler G. Activated CD4+ CD25+ T cells suppress antigen-specific CD4+ and CD8+ T cells but induce a suppressive phenotype only in CD4+ T cells. Immunology. 2005;115:305–314. doi: 10.1111/j.1365-2567.2005.02144.x. [DOI] [PMC free article] [PubMed] [Google Scholar]
- Dunn GP, Bruce AT, Ikeda H, Old LJ, Schreiber RD. Cancer immunoediting: From immunosurveillance to tumor escape. Nat Immunol. 2002;3:991–998. doi: 10.1038/ni1102-991. [DOI] [PubMed] [Google Scholar]
- Fontenot JD, Gavin MA, Rudensky AY. Foxp3 programs the development and function of CD4+CD25+ regulatory T cells. Nat Immunol. 2003;4:330–336. doi: 10.1038/ni904. [DOI] [PubMed] [Google Scholar]
- Fontenot JD, Rasmussen JP, Williams LM, Dooley JL, Farr AG, Rudensky AY. Regulatory T cell lineage specification by the forkhead transcription factor Foxp3. Immunity. 2005;22:329–341. doi: 10.1016/j.immuni.2005.01.016. [DOI] [PubMed] [Google Scholar]
- Gavin M, Rudensky A. Control of immune homeostasis by naturally arising regulatory CD4+ T cells. Curr Opin Immunol. 2003;15:690–696. doi: 10.1016/j.coi.2003.09.011. [DOI] [PubMed] [Google Scholar]
- Giometto B, Bozza F, Faresin F, Alessio L, Mingrino S, Tavolato B. Immune infiltrates and cytokines in gliomas. Acta Neurochir. 1996;138:50–56. doi: 10.1007/BF01411724. [DOI] [PubMed] [Google Scholar]
- Hafler DA, Slavik JM, Anderson DE, O’Connor KC, De Jager P, Baecher-Allan C. Multiple sclerosis. Immunol Rev. 2005;204:208–231. doi: 10.1111/j.0105-2896.2005.00240.x. [DOI] [PubMed] [Google Scholar]
- Hickey WF. Leukocyte traffic in the central nervous system: The participants and their roles. Semin Immunol. 1999;11:125–137. doi: 10.1006/smim.1999.0168. [DOI] [PubMed] [Google Scholar]
- Hickey WF, Hsu BL, Kimura H. T-lymphocyte entry into the central nervous system. J Neurosci Res. 1991;28:254–260. doi: 10.1002/jnr.490280213. [DOI] [PubMed] [Google Scholar]
- Hishii M, Nitta T, Ishida H, Ebato M, Kurosu A, Yagita H, Sato K, Okumura K. Human glioma-derived interleukin-10 inhibits antitumor immune responses in vitro. Neurosurgery. 1995;37:1160–1166. doi: 10.1227/00006123-199512000-00016. [DOI] [PubMed] [Google Scholar]
- Hoffmann P, Ermann J, Edinger M, Fathman CG, Strober S. Donor-type CD4(+)CD25(+) regulatory T cells suppress lethal acute graft-versus-host disease after allogeneic bone marrow transplantation. J Exp Med. 2002;196:389–399. doi: 10.1084/jem.20020399. [DOI] [PMC free article] [PubMed] [Google Scholar]
- Horwitz MS, Evans CF, Klier FG, Oldstone MB. Detailed in vivo analysis of interferon-gamma induced major histocompatibility complex expression in the central nervous system: Astrocytes fail to express major histocompatibility complex class I and II molecules. Lab Invest. 1999;79:235–242. [PubMed] [Google Scholar]
- Ichihara F, Kono K, Takahashi A, Kawaida H, Sugai H, Fujii H. Increased populations of regulatory T cells in peripheral blood and tumor-infiltrating lymphocytes in patients with gastric and esophageal cancers. Clin Cancer Res. 2003;9:4404–4408. [PubMed] [Google Scholar]
- Javia LR, Rosenberg SA. CD4+CD25+ suppressor lymphocytes in the circulation of patients immunized against melanoma antigens. J Immunother. 2003;26:85–93. doi: 10.1097/00002371-200301000-00009. [DOI] [PMC free article] [PubMed] [Google Scholar]
- Jiang H, Chess L. An integrated view of suppressor T cell subsets in immunoregulation. J Clin Invest. 2004;114:1198–1208. doi: 10.1172/JCI23411. [DOI] [PMC free article] [PubMed] [Google Scholar]
- Jonuleit H, Schmitt E, Stassen M, Tuettenberg A, Knop J, Enk AH. Identification and functional characterization of human CD4(+)CD25(+) T cells with regulatory properties isolated from peripheral blood. J Exp Med. 2001;193:1285–1294. doi: 10.1084/jem.193.11.1285. [DOI] [PMC free article] [PubMed] [Google Scholar]
- Kaluza J, Adamek D, Bujny T. Immunocytochemical analysis of cellular infiltrates in primary glial and metastatic tumors in human brain. Patol Pol. 1993;44:65–73. [PubMed] [Google Scholar]
- Kohm AP, Miller SD. Role of ICAM-1 and P-selectin expression in the development and effector function of CD4+CD25+ regulatory T cells. J Autoimmun. 2003;21:261–271. doi: 10.1016/s0896-8411(03)00117-3. [DOI] [PubMed] [Google Scholar]
- Kohm AP, Carpentier PA, Miller SD. Regulation of experimental autoimmune encephalomyelitis (EAE) by CD4+CD25+ regulatory T cells. Novartis Found Symp. 2003;252:45–52. [PubMed] [Google Scholar]
- Lee MK, 4th Moore, D.J. Jarrett, B.P. Lian, M.M. Deng, S. Huang, X. Markmann, J.W. Chiaccio, M. Barker, C.F. Caton, A.J. and, Markmann JF. Promotion of allograft survival by CD4+CD25+ regulatory T cells: Evidence for in vivo inhibition of effector cell proliferation. J Immunol. 2004;172:6539–6544. doi: 10.4049/jimmunol.172.11.6539. [DOI] [PubMed] [Google Scholar]
- Liyanage UK, Moore TT, Joo HG, Tanaka Y, Herrmann V, Doherty G, Drebin JA, Strasberg SM, Eberlein TJ, Goedegebuure PS, Linehan DC. Prevalence of regulatory T cells is increased in peripheral blood and tumor microenvironment of patients with pancreas or breast adenocarcinoma. J Immunol. 2002;169:2756–2761. doi: 10.4049/jimmunol.169.5.2756. [DOI] [PubMed] [Google Scholar]
- Maloy KJ, Powrie F. Regulatory T cells in the control of immune pathology. Nat Immunol. 2001;2:816–822. doi: 10.1038/ni0901-816. [DOI] [PubMed] [Google Scholar]
- Marshall NA, Christie LE, Munro LR, Culligan DJ, Johnston PW, Barker RN, Vickers MA. Immunosuppressive regulatory T cells are abundant in the reactive lymphocytes of Hodgkin lymphoma. Blood. 2004;103:1755–1762. doi: 10.1182/blood-2003-07-2594. [DOI] [PubMed] [Google Scholar]
- Mitchell DA, Fecci PE, Sampson JH. Adoptive immunotherapy for malignant glioma. Cancer J. 2003;9:157–166. doi: 10.1097/00130404-200305000-00004. [DOI] [PubMed] [Google Scholar]
- Nishie A, Ono M, Shono T, Fukushi J, Otsubo M, Onoue H, Ito Y, Inamura T, Ikezaki K, Fukui M, Iwaki T, Kuwano M. Macrophage infiltration and heme oxygenase-1 expression correlate with angiogenesis in human gliomas. Clin Cancer Res. 1999;5:1107–1113. [PubMed] [Google Scholar]
- Noma K, Yamaguchi Y, Okita R, Matsuura K, Toge T. The spleen plays an immunosuppressive role in patients with gastric cancer: Involvement of CD62L+ cells and TGF-beta. Anticancer Res. 2005;25:643–649. [PubMed] [Google Scholar]
- O’Connor KC, Bar-Or A, Hafler DA. The neuroimmunology of multiple sclerosis: Possible roles of T and B lymphocytes in immunopathogenesis. J Clin Immunol. 2001;21:81–92. doi: 10.1023/a:1011064007686. [DOI] [PubMed] [Google Scholar]
- Perrin G, Schnuriger V, Quiquerez AL, Saas P, Pannetier C, de Tribolet N, Tiercy JM, Aubry JP, Dietrich PY, Walker PR. Astrocytoma infiltrating lymphocytes include major T cell clonal expansions confined to the CD8 subset. Int Immunol. 1999;11:1337–1350. doi: 10.1093/intimm/11.8.1337. [DOI] [PubMed] [Google Scholar]
- Piccirillo CA, Shevach EM. Naturally-occurring CD4+CD25+ immunoregulatory T cells: Central players in the arena of peripheral tolerance. Semin Immunol. 2004;16:81–88. doi: 10.1016/j.smim.2003.12.003. [DOI] [PubMed] [Google Scholar]
- Rudensky A. Foxp3 and dominant tolerance. Philos Trans R Soc Lond B Biol Sci. 2005;360:1645–1646. doi: 10.1098/rstb.2005.1731. [DOI] [PMC free article] [PubMed] [Google Scholar]
- Sakaguchi S, Sakaguchi N, Shimizu J, Yamazaki S, Sakihama T, Itoh M, Kuniyasu Y, Nomura T, Toda M, Takahashi T. Immunologic tolerance maintained by CD25+ CD4+ regulatory T cells: Their common role in controlling autoimmunity, tumor immunity, and transplantation tolerance. Immunol Rev. 2001;182:18–32. doi: 10.1034/j.1600-065x.2001.1820102.x. [DOI] [PubMed] [Google Scholar]
- Sasada T, Kimura M, Yoshida Y, Kanai M, Takabayashi A. CD4+CD25+ regulatory T cells in patients with gastrointestinal malignancies: Possible involvement of regulatory T cells in disease progression. Cancer. 2003;98:1089–1099. doi: 10.1002/cncr.11618. [DOI] [PubMed] [Google Scholar]
- Sasaki A, Naganuma H, Satoh E, Nagasaka M, Isoe S, Nakano S, Nukui H. Secretion of transforming growth factor-beta 1 and -beta 2 by malignant glioma cells. Neurol Med Chir (Tokyo) 1995;35:423–430. doi: 10.2176/nmc.35.423. [DOI] [PubMed] [Google Scholar]
- Schweitzer T, Vince GH, Herbold C, Roosen K, Tonn JC. Extraneural metastases of primary brain tumors. J Neurooncol. 2001;53:107–114. doi: 10.1023/a:1012245115209. [DOI] [PubMed] [Google Scholar]
- Shimizu J, Suda T, Yoshioka T, Kosugi A, Fujiwara H, Hamaoka T. Induction of tumor-specific in vivo protective immunity by immunization with tumor antigen-pulsed antigen-presenting cells. J Immunol. 1989;142:1053–1059. [PubMed] [Google Scholar]
- Turk MJ, Wolchok JD, Guevara-Patino JA, Goldberg SM, Houghton AN. Multiple pathways to tumor immunity and concomitant autoimmunity. Immunol Rev. 2002;188:122–135. doi: 10.1034/j.1600-065x.2002.18811.x. [DOI] [PubMed] [Google Scholar]
- von Boehmer H. Mechanisms of suppression by suppressor T cells. Nat Immunol. 2005;6:338–344. doi: 10.1038/ni1180. [DOI] [PubMed] [Google Scholar]
- Wolf AM, Wolf D, Steurer M, Gastl G, Gunsilius E, Grubeck-Loebenstein B. Increase of regulatory T cells in the peripheral blood of cancer patients. Clin Cancer Res. 2003;9:606–612. [PubMed] [Google Scholar]
- Woo EY, Chu CS, Goletz TJ, Schlienger K, Yeh H, Coukos G, Rubin SC, Kaiser LR, June CH. Regulatory CD4(+)CD25(+) T cells in tumors from patients with early-stage non–small cell lung cancer and late-stage ovarian cancer. Cancer Res. 2001;61:4766–4772. [PubMed] [Google Scholar]
- Woo EY, Yeh H, Chu CS, Schlienger K, Carroll RG, Riley JL, Kaiser LR, June CH. Cutting edge: Regulatory T cells from lung cancer patients directly inhibit autologous T cell proliferation. J Immunol. 2002;168:4272–4276. doi: 10.4049/jimmunol.168.9.4272. [DOI] [PubMed] [Google Scholar]


