

Abstract
We compared tissue and plasma pharmacokinetics of 14C-sucrose in subcutaneous RG-2 rat gliomas after administration by 3 routes, intravenous bolus (IV-B; 50 μCi over 30 s), continuous IV infusion (IV-C, 50 μCi at a constant rate), and convection-enhanced delivery (CED, 5 μCi infused at a rate of 0.5 μl/min), and for 3 experimental durations, 0.5, 2, and 4 h. Plasma, tumor, and other tissue samples were obtained to measure tissue radioactivity. Plasma radioactivity in the CED group increased exponentially and lagged only slightly behind the IV-C group. After 90 min, plasma values were similar in all. Mean tumor radioactivity was 100 to 500 times higher in the CED group at each time point than in the IV-B and IV-C groups. Tumor radioactivity was homogeneous in the IV groups at 0.5 h and inhomogeneous at 1 and 2 h. In CED, radioactivity distribution was inhomogeneous at all 3 time points; highest concentrations were in tissue around tumor and in necrosis, while viable tumor contained the lowest and sometimes negligible amounts of isotope. Systemic tissue radioactivity values were similar in all groups. Efflux of 14C-sucrose from tumors was evaluated in intracerebral tumors (at 0.5, 1, 2, and 4 h) and subcutaneous tumors (at 0 to 0.5 h). Less than 5% of 14C activity remained in intracerebral tumors at each time point. The efflux half-time from the subcutaneous tumors was 7.3 ± 0.7 min. These results indicate rapid efflux of drug from brain tumor and marked heterogeneity of drug distribution within tumor after CED administration, both of which may be potentially limiting factors in drug delivery by this method.
During the past few years, the direct infusion of therapeutic agents into brain tumors has become popular. The motivation behind this delivery approach has been the suspected, although never proven, limitation of drug delivery to brain tumors after administration by any form of intravascular delivery. Direct infusion into tumors, also called convection-enhanced delivery (CED)3 (Bobo et al. 1994), provides a method of drug administration in which the delivery-limiting properties of the blood-brain barrier are circumvented. Although CED is being studied by many different groups (Bruce et al., 2000; Giussani et al., 2003; Kaiser et al., 2000; Miller et al., 2002; Viola et al., 1995; Yang et al., 2002), there have been very few studies of either the plasma or tissue pharmacokinetics of drug delivery by this route. Consequently, the relative advantages or disadvantages of direct tumor delivery are poorly understood.
This study compares the plasma and tissue pharmacokinetics of 14C-sucrose delivered to subcutaneous RG-2 tumors by CED to 2 different intravenous (IV) administration protocols. We chose to use the subcutaneous RG-2 model because of the difficulties associated with localizing intracerebral tumors in rats for purposes of stereotaxic injection (which are illustrated in the experiments using intracerebral tumors in this study), and because previous studies have shown that the capillary structure and physiological properties of subcutaneous and intracerebral RG-2 gliomas are similar (Molnar et al., 1999; Schlageter et al., 1999). In addition to the tumor model, there were other considerations behind our experimental design. Many drugs are administered by rapid IV infusion to maximize the plasma concentrations and the “area under the curve,” while most CED infusion protocols use a constant infusion rate over a defined time period. This results in very different input functions for the 2 delivery methods. In addition, there were practical considerations based on the limitations of experimental methodologies. If the same amount of drug were administered by IV and CED routes, the amount of drug in tumor would be either too low (after IV administration) or too high (after CED administration) to be adequately visualized by quantitative autoradiography. We chose, therefore, to use 2 intravenous administration protocols: bolus and continuous administration, and a single continuous administration CED protocol. In addition, we used the amount of isotope that would be optimal for the particular experimental design and then normalized the plasma and tissue values post hoc by using the animal weight and administered dose so that the plasma and tissue values were directly comparable between animals.
Materials and Methods
Tumor Transplantation
All animal experimentation was reviewed and approved by the Institutional Animal Care and Use Committee of Evanston Northwestern Healthcare Research Institute. Fischer-344 rats (Harlan Industries, Indianapolis, Ind.) were anesthetized with isoflurane/nitrous oxide/oxygen anesthesia (1.5/30/70; v/v/v). For rats with intracerebral tumors, a burr hole was made through the skull, and a Kopf stereotaxic frame was used to insert an indwelling brain infusion cannula (Alzet Corp., Palo Alto, Calif.) into the caudate nucleus (2.5 mm lateral and 1 mm anterior to the bregma, and at a depth of 5 mm) according to the atlas of Paxinos and Watson (1986). The cannula was attached to the skull, 2 μl of RG-2 glioma cells (106 cells/ml) was injected, and the polyethylene catheter attached to the cannula was heat sealed. Another group of Fischer-344 rats was injected s.c. in the flank with 10 μl RG-2 glioma cells (106 cells/ml, or 1000 cells), as described previously (Groothuis et al., 1983a, b).
Animal Preparation
Rats were used for experiments 2 to 3 weeks after tumor cell injections, when the tumors were 8 to 10 mm in diameter, and were prepared for single-label, quantitative autoradiographic experiments as previously described (Groothuis et al., 1983a, b). Briefly, unilateral femoral arterial and venous polyethylene catheters (PE-50) were inserted under anesthesia, which was continued throughout the experiment. Blood pressure and rectal temperature were monitored and heat lamps used to maintain body temperature at 37°C. Systemic arterial hematocrit was measured at the beginning and end of the experiment. In rats used for direct tumor infusion, a 23 gauge needle was attached to PE-50 polyethylene tubing; the needle was inserted directly into the tumor, and the tubing was attached to a Sage 365 programmable infusion pump (ATI Orion, Boston, Mass.).
Experimental Procedures
Comparative Pharmacokinetics
Three different routes of administration were used: in the first group, isotope was administered by IV bolus (IV-B); in the second group, isotope was administered by continuous IV infusion (IV-C); and in the third group, isotope was administered directly into the tumor by CED. Within each experimental group, 3 rats each were used for experiment durations of 0.5, 2, and 4 h. In the IV-B group, 50 μCi 14C-sucrose (DuPont NEN, Wilmington, Del.; 632 mCi/mmol) was injected intravenously over 30 s. In the IV-C group, 50 μCi 14C-sucrose was administered intravenously at a rate of 10 μl/min; the volume was appropriate for the experiment duration. In the CED group, 5 μCi 14C-sucrose was administered at a constant rate of 0.5 μl/min over the duration of the experiment; the volume was appropriate for the experiment duration. For all animals, samples of the isotope infusion solution were obtained, and heparinized arterial blood samples were obtained at selected intervals and centrifuged. The infusion solution and plasma were used to determine radioactivity concentration by liquid scintillation counting (LSC) with appropriately quenched 14C standards. At the end of the experiment, the subcutaneous tumors were removed, including a margin of the tissue into which the tumor was growing. The tumor was frozen at −80°C in liquid Freon (E.I. DuPont de Nemours & Co., Wilmington, Del.) within 1 min of the conclusion of the experiment. Samples of heart, kidney, brain (frontal cortex), and liver were removed, placed in tared liquid scintillation vials, and solubilized until the tissue was dissolved, and radioactivity concentration was determined by LSC with appropriately quenched 14C standards. Plasma and tissue values from each experiment were normalized for an administered radioactivity dose of 50 μCi per animal and for animal weight.
Efflux Experiments
Rats with intracerebral or subcutaneous gliomas were used for 14C-sucrose efflux experiments. Under anesthesia, the rats with intracerebral tumors were placed in the Kopf stereotaxic frame (Alzet Corp.), the heat-sealed end of the catheter attached to the brain infusion cannula was recovered and opened, and 5 μCi of 14C-sucrose in 5 μl saline was injected over 3 min. Four animals were euthanized at time points of 0.5, 1, 2, and 4 h after injection, for a total of 16 animals. At the end of an experiment, the rat was decapitated; the brain was removed, frozen in liquid Freon, and serially sectioned at 20-μm thickness in the horizontal plane. Autoradiographic images were prepared as described elsewhere (Groothuis et al., 1999). The same brain sections used for autoradiography were then stained with hematoxylin and eosin and examined microscopically. The subcutaneous tumors were prepared in the same manner as for the animals used for CED infusion (see “Comparative Pharmacokinetics” above) except that 5 μCi 14C-sucrose in 10 μl saline was infused over 2 min. Five rats were euthanized at each of the following time points: 0, 2, 5, 10, 15, 20, and 30 min. The tumors were rapidly removed, frozen in liquid Freon (−80°C), weighed, and then homogenized. Radioactivity concentration in the homogenate was determined by LSC with appropriately quenched 14C standards.
Analysis
The plasma values of the IV-B group were fitted to a multi-exponential function to determine the α and β half-times of the plasma decay (Groothuis et al., 1999).
Preparation of autoradiographs of the subcutaneous tumors has been described (Blasberg et al., 1981; Groothuis et al., 1983a, b). The autoradiographs were digitized at a resolution of 50 μm/pixel with a video-based digitizing system, along with calibrated 14C-methylmethacrylate standards. After the autoradiographs were prepared, the tissue sections were stained with hematoxylin-eosin, digitized, and aligned with the autoradiographic images in computer memory. Regional tissue measurements of radioactivity (nCi/g) were obtained from the autoradiographs by using the histological images to define the region of interest. The tissue and plasma radioactivity concentrations were corrected for the actual administered isotope dose and animal weight to express each animal’s data as a normalized amount. The plasma values were used to construct a plasma arterial integral (or area under the curve) for each animal. The tissue radioactivity concentrations were expressed as normalized values and, for the IV-B group, as an apparent transfer constant Kapp,
 |
Where Ci is the tissue radioactivity concentration and Cp is the plasma radioactivity concentration.
The efflux constant was determined by methods similar to those described by Cserr et al. (1981). Normalized tissue radioactivity concentration (At) was plotted against time, and the data fit to a monoexponential expression
 |
where k is the first-order rate constant for total 14C-sucrose efflux from the brain.
Data were compared with parametric statistics. Student’s t-test was used for comparison of data from 2 locations. Groups were compared by using analysis of variance.
Results
Plasma Radioactivity Levels
The time course of plasma radioactivity levels and the plasma arterial integral for the 4-h experiments of the 3 groups are shown in Fig. 1A. Since the animals in the 0.5-h and 2-h groups received the same amount of isotope as the 4-h group, the plasma values were higher, but the plasma curves followed the same pattern as those shown in Fig. 1A. As expected, the plasma values from the IV-B group were at a maximum immediately after injection and declined exponentially. The data from the IV-B group was fit with a biexponential decay and yielded an α half-time of 1.5 min, with a β half-time of 31.5 min, similar to values in normal rats (Groothuis et al. 1999). The plasma values from the other 2 groups increased slowly from 0 to 90 min and remained constant after that. The plasma values from the CED group were slightly lower and lagged behind those of the IV-C group. The plasma arterial integrals reflected these patterns (Fig. 1B): The radioactivity level of the IV-B group was 39,156.6 nCi g−1 min, while that of the IV-C group was 11,975.7, and that of the CED group was 11,714 nCi g−1 min. The latter 2 values are not significantly different.
Fig. 1.
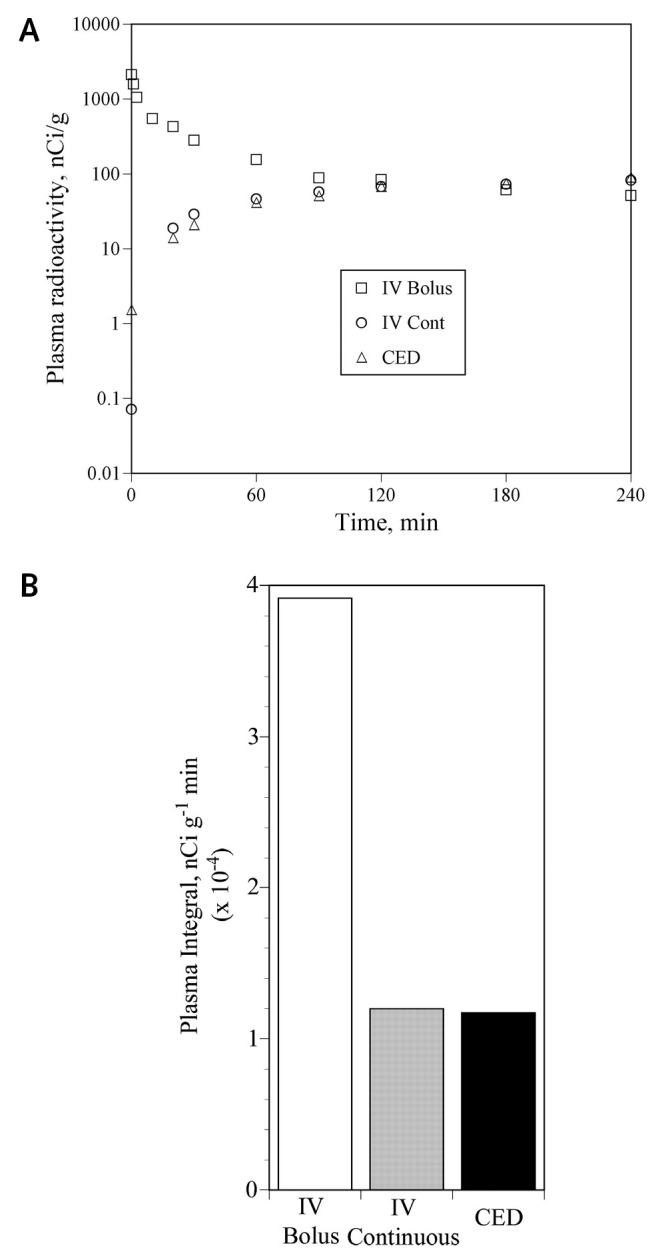
Plasma radioactivity values. A. Mean values from the 4-h animals in the IV-B (open squares), IV-C infusion (open circles), and convection-enhanced delivery (CED) (open triangles). Note that the y-axis is logarithmic. As expected, the plasma values after IV-B show a biexponential decay, while those from the IV-C and CED groups rise gradually and plateau at about 90 to 120 min. The plasma values from the CED group lag slightly behind those of the continuous infusion group. Error bars are not shown; in most cases the error bars (± SD) were within the plotted symbol of the mean and, when included, obscured the plot of the mean values. B. Integrated plasma activity (nCi g−1 min) for each of the 3 groups.
Tissue Radioactivity Concentrations in Other Organs
Figure 2 shows the tissue radioactivity concentrations in the 4-h groups in kidney, liver, heart, and frontal cortex. Similar patterns of tissue radioactivity concentration were observed in the 0.5-h and 2-h experimental time groups. Error bars are not shown in Fig. 2 because they were large and obscured the presentation. The SD values were similar in magnitude to each respective mean value and are large because precise tissue sampling was not used. For example, the tissue radioactivity concentration values at 4 h in the kidney were 635 ± 535 in the IV-B group, 536 ± 455 in the IV-C group, and 301 ± 248 nCi/g (SD) in the CED group. Consequently, because of the variation, there were no significant differences among the tissue concentrations in any of the groups. As expected, since the plasma levels were highest in the IV-B group, the tissue levels were also the highest in that group, followed by the IV-C group and then the CED group. The apparent influx constant, Kapp, of sucrose into frontal cortex was 0.8 μl g−1 min−1. It was 0.66 μl g−1 min−1 into heart, 10.1 μl g−1 min−1 into kidney, and 2.5 μl g−1 min−1 into liver, as calculated from the 0.5-h data of the IV-B group. For comparison, the influx constant of sucrose into the tumors of the IV-B group was 6.7 ± 0.07 μl g−1 min−1, as calculated from the 0.5-h data.
Fig. 2.

Tissue radioactivity values. Mean tissue radioactivity values (nCi/g) for kidney, liver, heart, and frontal cortex, for the 4-h groups of animals. The values for the IV bolus group are the open columns; those from the continuous IV group are the shaded columns, and those of the convection-enhanced delivery (CED) group are the black columns. At 4 h, the tissue 14C-sucrose levels are lowest in the CED group and highest in the IV bolus group. Error bars are not shown on this 3D plot; however, the SD for each value was approximately the same magnitude as the value itself (see Results).
Tumor Radioactivity Concentrations
Figure 3 shows the mean tumor tissue radioactivity concentrations on a logarithmic scale for each of the 3 groups at the end of each of the different time periods. At each time period, the tumor concentrations after intravenous bolus and continuous intravenous administration were similar, while tumor concentrations in the CED group were 100 to 500 times higher. Figure 3 also shows that the mean tumor concentration levels in the CED group remained nearly constant over the 0.5-h to 4-h time period. However, examination of the autoradiographs (Fig. 4) showed that there was marked variation in isotope distribution within the tumors that is not indicated by the whole-tumor values. When the autoradiographs were analyzed to determine mean tumor radioactivity concentration within histologically viable tumor tissue in the CED groups, the values were 1424 ± 240 nCi/g in the 0.5-h group, 2364 ± 320 nCi/g in the 2-h group, and 2645 ± 284 nCi/g in the 4-h group. These values are almost 10-fold lower than the mean whole tumor values, which suggests that the isotope was in some part of the gross tumor specimen that did not contain viable tumor cells. In both the IV-B and IV-C groups, the isotope distribution was homogeneous at 0.5 h, and as time progressed, the isotope became concentrated at the tumor edge. At the 4-h period, isotope was also beginning to concentrate within focal areas of tumor necrosis (Figs. 4 and 5). The spatial distribution of 14C activity within the CED group, however, was markedly inhomogeneous at all time points (Fig. 4). Some 14C-sucrose activity was found within viable tumor tissue, but the radioactivity tended to concentrate in areas of focal necrosis and at the edge of the tumor mass (Figs. 4 and 5). In some areas of histologically viable tumor, there were areas that contained almost no 14C-sucrose radioactivity (Fig. 4).
Fig. 3.

Mean whole-tumor radioactivity concentrations in each of the 3 experimental groups (IV bolus, continuous IV, and convection-enhanced delivery [CED]) at each of the 3 experimental time points. Values are means ± SEM. Note that the y-axis scale is logarithmic. At each time point, the mean tumor values in the CED groups are > 100-fold greater than those in the 2 corresponding intravenous groups.
Fig. 4.

Quantitative autoradiographs of 14C-sucrose distribution: Continuous infusion versus convection-enhanced delivery (CED). The gray scale to the right of each set of 3 figures reflects the concentration of 14C-sucrose in the tumors; note that the 2 scales are nonlinear and differ by a 100-fold maximum value. The tumors in the continuous IV infusion show a progression from homogeneous distribution at 0.5 h, to slightly inhomogeneous distribution with increased concentration at the tumor edge at 2 h, to inhomogeneous distribution with increased concentration at the tumor margin and in areas of focal necrosis at 4 h. In the CED group, the tumors are markedly inhomogeneous at all time points, with maximum tissue radioactivity concentration at the tumor edge and in areas of necrosis. Note that in the 0.5-h and 4-h CED tumors there are areas at the bottom of the tumor that have no, or very little, 14C-sucrose activity in areas of viable tumor. The histology of the 4-h tumors is shown in Fig. 5.
Fig. 5.

Digitized histologies of the 4-h tumors from the continuous IV and convection-enhanced delivery groups, corresponding to the autoradiographs shown in Fig. 4. The tumors are oriented in the same way as the autoradiographs. The arrows point to focal necrosis; in the lower tumor the white areas are cryosectioning artifacts in an area of necrosis corresponding to the arc-like distribution of 14C-sucrose radioactivity shown in Fig. 4. The V indicates areas of viable tumor tissue.
14C-Sucrose Efflux
Intracerebral Tumors
Analysis of all tissue from all 4 time points showed that less than 10% of injected 14C-sucrose remained in the tumors and/or surrounding brain (Fig. 6). These data were judged inadequate for calculating a tumor efflux constant. In addition, the brain infusion cannula was often located at some distance from the tumor center (Fig. 6C), which suggests that the infusion occurred near the tumor edge in some tumors. However, tumors from all 4 time points consistently showed a small amount of isotope remaining in tumor, usually in areas of necrosis, and the remainder of the isotope in the tissue sample was in brain surrounding the tumor (Figs. 6B and 6D).
Fig. 6.

Histology and autoradiographs of intracerebral RG-2 gliomas after injection of 14C-sucrose. A and B. Glioma from an animal euthanized 0.5 h after injection of 14C-sucrose. C and D. Glioma from an animal euthanized 1 h after injection. In the histology images (A and C), the round tumor mass in the left hemisphere is easily distinguished from normal brain. The white arrows point to the locations of the infusion sites. The white arrows with asterisks point to areas of necrosis. The autoradiographs, in the same orientation and magnification as the histology images, show the nearly complete lack of radioisotope in the tumor, with a predominance of remaining radioactivity either in necrotic tumor or in brain surrounding tumor.
14C-Sucrose Efflux: Subcutaneous Tumors
The data (mean ± SD) from the subcutaneous efflux experiments are shown in Fig. 7. The efflux constant was 0.0947 ± 0.009 min−1 (standard error = 0.00008, r2 = 0.98), which corresponds to an efflux half-time of 7.3 ± 0.7 min.
Fig. 7.

Efflux of 14C-sucrose from subcutaneous RG-2 gliomas. Each point represents the mean ± standard error of 5 animals. The curve is a monoexponential fit, from which the efflux rate constant was determined.
Discussion
These experiments show that delivery of 14C-sucrose to subcutaneous RG-2 rat gliomas is dominated by 2 features: the entry portal of 14C-sucrose into the body, and the clearance of 14C-sucrose from the tumors. A third feature, the distribution of the isotope within the tumor, is controlled by local tumor tissue physiological processes. Of the observations recorded by these experiments, 4 results are of particular interest with regard to the direct infusion of drugs into brain tumors.
First and foremost, as expected, there were higher tumor radioactivity concentrations in the CED group simply because the subcutaneous tumor represented the entry portal for 14C-sucrose before it redistributed in the body. Furthermore, and also as expected, the mean tumor radioactivity concentrations after CED administration were markedly higher than those after either intravenous route. Figure 3 illustrates this effect, with mean tumor concentrations in the CED group at each time point more than 100 times the concentrations after either intravenous route of administration. This observation is confirmed by comparing tumor exposure expressed as the area under the curve; the tumor concentration integrals were calculated by using the trapezoidal rule and the data from Fig. 3. The tumor concentration integral for the IV-B group was 1.5 × 10⁴, that for the IV-C group was 2.6 × 10⁴, and that for the CED group was 9.2 × 10⁶ nCi g−1 min. The integrated exposure in the CED group was 312 times higher than that in the IV-C group and 625 times higher than that in the IV-B group. The differences between the CED and other groups were significant at the P < 0.0001 level. In summary, the direct infusion of drugs into tumors will result in higher concentrations and therefore higher exposure values than after systemic administration by the intravenous route.
Despite the high 14C concentrations in the tumors infused by CED, the radioactivity did not remain long. A second but unexpected finding was the rapid clearance of the 14C-sucrose from the RG-2 tumors. We had originally intended to measure efflux from RG-2 tumors growing in the brain, and we selected time points that were used to measure efflux of 14C-sucrose from normal brain, that is, 0.5 h to 4 h. The efflux half-time of 14C-sucrose from normal brain was 2.75 h (unpublished observations). However, at 0.5 h, almost all of the 14C-sucrose had left the tumor and was either in brain surrounding tumor (Fig. 6B) or had left the brain. By 1 h, less than 3% of the administered dose was present in either tumor or surrounding brain (Fig. 6D). In addition, since we could not control how the tumor grew around the brain infusion cannula, the cannula was often located off center in the tumor. We repeated the efflux experiments with subcutaneous tumors with shorter experimental durations and so that we could better control the placement of the infusion needle into the center of the tumor. The data confirmed the observations from the intracerebral tumors. The rapid efflux is demonstrated in 2 ways in the data from the subcutaneous tumors. First, by direct measurement (Fig. 7), the clearance half-time from the tumors was 7.3 min, which is more than 20 times faster than the efflux constant of 14C-sucrose from normal brain. Second, the plasma values in the CED group lagged behind those of the IV-C group only slightly (Fig. 1), resulting in nearly identical plasma curves for the 2 groups. As will be discussed below, the rapid clearance of 14C-sucrose from the tumors was believed to be due to high interstitial fluid pressure within the tumors, causing convective flow from the tumor extracellular fluid into surrounding tissue. The rapidity of the clearance half-time can be compared to an equilibration half-time, assuming a simple 2-compartment model and passive distribution (i.e., diffusional distribution but no convective efflux) (Blasberg et al., 1981). The equilibration half-time for sucrose, calculated from the influx constant into the RG-2 tumors, would be expected to be 115 min. That the efflux half-time is 15 times faster than the equilibration half-time of a passive system is indicative of the magnitude of the processes driving sucrose efflux from the tumors.
A third finding, again unexpected, was the similarity of tissue radioactivity concentrations in systemic tissues regardless of the route of isotope administration (Fig. 2). This implies that, for the same administered dose, the risk of systemic tissue toxicity may be similar regardless of the route of administration. This interpretation must be viewed cautiously since in the present experiments the dose was normalized in each experimental group in order to be directly comparable. In a clinical situation, the dose administered by CED may or may not be similar to the IV dose. However, it will be important to remember that all, or nearly all, of the drug infused into the tumor will eventually redistribute within the rest of the body, and the present data suggest that the redistribution occurs very quickly.
The fourth and perhaps most important observation with regard to the direct infusion of drugs into brain tumors was the variability of isotope distribution within individual tumors, as seen in Figs. 4 and 6. Shortly after the intravenous administration of 14C-sucrose (0.5 h), the distribution of radioactivity within the tumor was homogeneous. This was expected on the basis of the previous studies of blood-to-tumor permeability in RG-2 tumors, which is similar in both intracerebral (Groothuis et al., 1983a, b) and subcutaneous tumors (Groothuis et al., 1983a, b; Schlageter et al., 1999). However, even in the intravenously injected animals, the distribution became inhomogeneous at 2 h and markedly so at 4 h (Fig. 4). Examination of the isotope distribution at these later time points indicated that there was movement of 14C-sucrose into areas of necrosis and out of the tumor into the surrounding tissue. By 4 h, the isotope concentration in these latter 2 areas was higher than in viable tumor tissue (Figs. 4 and 5). That is, convective forces similar to those operating in the CED group were operative in the IV groups. In contrast, in the CED groups, at all time points, isotope distribution was preferentially found in areas of necrosis and at the tumor margin (Figs. 4 and 6). Indeed, at all 3 time points, there were areas of viable tumor that contained negligible amounts of radioactivity.
The data from the brain tumors contrast sharply with those from injections into normal brain. The distribution of 14C-sucrose into normal rat brain produced a much more uniform and predictable distribution (Groothuis et al., 1999). The data from the RG-2 tumors suggest that there are actually 3 different regions that should be studied in brain tumors, that is, normal brain itself, the tumor tissue, and the area in which the 2 collide, often called brain around tumor.
A physiological factor that has not been studied extensively in brain tumors nor included in many pharmaco-kinetic models of drug distribution in brain tumors, and which could explain these observations, is interstitial fluid pressure. Jain et al. have shown that interstitial fluid pressure in experimental brain tumors can reach levels of 15 to 25 mm Hg (Baxter and Jain, 1989; Boucher and Jain, 1992; Boucher et al., 1990, 1997; Jain, 1990; Less et al., 1992; Netti et al., 1995). This pressure most likely has both hydrostatic and osmotic components. RG-2 tumor microvessels contain “holes” large enough to allow extravasation of plasma proteins, which could generate a significant osmotic pressure. As a result of the change from a continuous plasma membrane to one perforated by populations of large and small “pores,” the movement of drugs across the blood-tumor barrier changes from passive diffusion to a pressure-driven situation in which Starling’s law becomes applicable. This pressure gradient across tumor microvessels occurs within viable tumor, thus explaining the low tissue radioactivity concentrations in viable tumor regions (Figs. 4 and 5), and produces a pressure gradient in tumor extracellular space from high levels within viable tumor to lower levels in areas of necrosis and surrounding tissues. These pressure gradients account both for the tissue radioactivity distribution pattern within the tumors (Fig. 4) and for the increased rate of drug efflux from the tumors.
On the basis of these observations, some implications of drug distribution on therapy may be considered. When drugs are administered by CED, there is likely to be inhomogeneous distribution within most malignant gliomas, resulting in islands of cells that receive minimal exposure to therapeutic agents. This would suggest a high probability of local recurrence in these situations. However, there are variables to consider. For example, a long-term infusion may produce local effects on the tumor vasculature surrounding an island of viable tumor cells, which may in turn, over time, make the island more susceptible to the effects of therapy. Chemotherapy protocols that involve short-term infusions would be especially liable to marked variation in tissue distribution. In this study, we used a single flow rate for infusions. Increasing the flow rate, and thereby increasing the local hydrostatic pressure of the infusion, may be one alternative method for circumventing the local tissue interstitial pressure gradients. Especially disconcerting are the short distances that were involved in these studies. The tumors were 8 to 10 mm in size, and yet there were areas of viable tumor cells in all CED infusions that did not contain radioisotope. Human brain tumors are often much larger. The flow rates that are needed to overcome the local tumor-generated hydrostatic pressures are likely to be variable from one tumor to the next, and perhaps within individual tumors, and whether the infusion pressures needed to exceed the tumor interstitial pressure can be achieved has yet to be determined. It may also be possible to acutely or chronically alter the tumor interstitial pressure and to lower the pressure gradient for effective therapy. Kristajansen et al. (1993) demonstrated that dexamethasone lowered interstitial pressure in one experimental tumor model.
Direct infusion of drugs into brain tumors represents an exciting new avenue for therapy of malignant brain tumors. However, it is clear that failure may be still be due to drug delivery as well as ineffective agents, and that considerable work remains to be done to understand and effectively manipulate drug delivery within an individual tumor. It would be a tragedy if a truly effective therapeutic agent were discarded as being ineffective when the basis for failure was ineffective delivery. This study focused on sucrose, a small water-soluble compound. Clinical studies of convective delivery to brain tumors are using a broad range of compounds, including small lipid-soluble drugs (Hassenbusch et al., 2002; Heimberger et al., 2000), small water-soluble drugs (Mardor et al., 2001; Patchell et al., 2002), and large compounds, often linked to receptor ligands (Laske et al., 1994, 2002; Reardon et al., 2002; Weber and Hingorani, 2002; Yang et al., 2002). Although the rate of convective clearance is similar for compounds of a wide range of molecular weights in normal brain (Cserr et al., 1981), it remains to be seen whether this is true in brain tumors, especially for the receptor-mediated compounds.
Footnotes
This work was supported by NIH grant R01-NS12745 and by the Mark Moritz and Richard M. Lilienfield Memorial Funds. D. Groothuis is supported by the Stanley C. Golder Chair of Neuroscience Research, Evanston Northwestern Healthcare.
Abbreviations used are as follows: CED, convection-enhanced delivery; IV, intravenous; IV-B, bolus intravenous administration; IV-C, continuous intravenous administration; LSC, liquid scintillation counting.
References
- Baxter LT, Jain RK. Transport of fluid and macromolecules in tumors. I Role of interstitial pressure and convection. Microvasc Res. 1989;37:77–104. doi: 10.1016/0026-2862(89)90074-5. [DOI] [PubMed] [Google Scholar]
- Blasberg RG, Groothuis DR, Molnar P. Application of quantitative autoradiographic measurements in experimental brain tumors. Semin Neurol. 1981;1:203–224. [Google Scholar]
- Bobo RH, Laske DW, Akbasak A, Morrison PF, Dedrick RL, Oldfield EH. Convection enhanced delivery of macromolecules in the brain. Proc Natl Acad Sci USA. 1994;91:2076–2080. doi: 10.1073/pnas.91.6.2076. [DOI] [PMC free article] [PubMed] [Google Scholar]
- Boucher Y, Jain RK. Microvascular pressure is the principal driving force for interstitial hypertension in solid tumors: Implications for vascular collapse. Cancer Res. 1992;52:5110–5114. [PubMed] [Google Scholar]
- Boucher Y, Baxter LT, Jain RK. Interstitial pressure gradients in tissue-isolated and subcutaneous tumors: Implications for therapy. Cancer Res. 1990;50:4478–4484. [PubMed] [Google Scholar]
- Boucher Y, Salehi H, Witwer B, Harsh G.R. 4th, Jain RK. Interstitial fluid pressure in intracranial tumours in patients and in rodents. Br J Cancer. 1997;75:829–836. doi: 10.1038/bjc.1997.148. [DOI] [PMC free article] [PubMed] [Google Scholar]
- Bruce JN, Falavigna A, Johnson JP, Hall JS, Birch BD, Yoon JT, Wu EX, Fine RL, Parsa AT. Intracerebral clysis in a rat glioma model. Neurosurgery. 2000;46:683–691. doi: 10.1097/00006123-200003000-00031. [DOI] [PubMed] [Google Scholar]
- Cserr HF, Cooper DN, Suri PK, Patlak CS. Efflux of radio-labeled polyethylene glycols and albumin from rat brain. Am J Physiol. 1981;240:F319–F328. doi: 10.1152/ajprenal.1981.240.4.F319. [DOI] [PubMed] [Google Scholar]
- Giussani C, Carrabba G, Pluderi M, Lucini V, Pannacci M, Caronzolo D, Costa F, Minotti M, Tomei G, Villani R, Bikfalvi A, Bello L. Local intracerebral delivery of endogenous inhibitors by osmotic minipumps effectively suppresses glioma growth in vivo. Cancer Res. 2003;63:2499–2505. [PubMed] [Google Scholar]
- Groothuis DR, Fischer JM, Pasternak JF, Blasberg RG, Bigner DD, Vick NA. Regional measurements of blood-to-tissue transport in transplanted RG-2 rat gliomas. Cancer Res. 1983a;43:3368–3373. [PubMed] [Google Scholar]
- Groothuis DR, Pasternak JF, Fischer JM, Blasberg RG, Vick NA, Bigner DD. Regional measurements of blood flow in transplanted RG-2 rat gliomas. Cancer Res. 1983b;43:3362–3367. [PubMed] [Google Scholar]
- Groothuis DR, Ward S, Itskovich AC, Dobrescu C, Allen CV, Dills C, Levy RM. Comparison of 14C-sucrose delivery to the brain by intravenous, intraventricular, and convection-enhanced intracerebral infusion. J Neurosurg. 1999;90:321–331. doi: 10.3171/jns.1999.90.2.0321. [DOI] [PubMed] [Google Scholar]
- Hassenbusch S, Levin V, Cozzens J, Paleologos N, Smith D, Phuphanich S, Brem S, Chen T, Chamberlain M, Hariharan S, Krouwer H, Mueller W, Resnick G, Pietronigro D. Multi-center phase I/II trial of stereotactic injection of DTI-015 into inoperable recurrent malignant glioblastoma multiforme. Neuro-oncol. 2002;4:S43. (abstract) [Google Scholar]
- Heimberger AB, Archer GE, McLendon RE, Hulette C, Friedman AH, Friedman HS, Bigner DD, Sampson JH. Temozolomide delivered by intracerebral microinfusion is safe and efficacious against malignant gliomas in rats. Clin Cancer Res. 2000;6:4148–4153. [PubMed] [Google Scholar]
- Jain RK. Vascular and interstitial barriers to delivery of therapeutic agents in tumors. Cancer Metastasis Rev. 1990;9:253–266. doi: 10.1007/BF00046364. [DOI] [PubMed] [Google Scholar]
- Kaiser MG, Parsa AT, Fine RL, Hall JS, Chakrabarti I, Bruce JN. Tissue distribution and antitumor activity of topotecan delivered by intracerebral clysis in a rat glioma model. Neurosurgery. 2000;47:1391–1398. [PubMed] [Google Scholar]
- Kristjansen PE, Boucher Y, Jain RK. Dexamethasone reduces the interstitial fluid pressure in a human colon adenocarcinoma xenograft. Cancer Res. 1993;53:4764–4766. [PubMed] [Google Scholar]
- Laske DW, Ilercil O, Akbasak A, Youle RJ, Oldfield EH. Efficacy of direct intratumoral therapy with targeted protein toxins for solid human gliomas in nude mice. J Neurosurg. 1994;80:520–526. doi: 10.3171/jns.1994.80.3.0520. [DOI] [PubMed] [Google Scholar]
- Laske DW, Rossi P. Phase II multicenter trial of intratumoral/ interstitial therapy with TransMID in patients with refractory and progressive glioblastoma multiforme (GBM) and anaplastic astrocytoma (AA) Neuro-oncol. 2002;4:S58. (abstract) [Google Scholar]
- Less JR, Posner MC, Boucher Y, Borochovitz D, Wolmark N, Jain RK. Interstitial hypertension in human breast and colorectal tumors. Cancer Res. 1992;52:6371–6374. [PubMed] [Google Scholar]
- Mardor Y, Roth Y, Lidar Z, Jonas T, Pfeffer R, Maier SE, Faibel M, Nass D, Hadani M, Orenstein A, Cohen JS, Ram Z. Monitoring response to convection-enhanced taxol delivery in brain tumor patients using diffusion-weighted magnetic resonance imaging. Cancer Res. 2001;61:4971–4973. [PubMed] [Google Scholar]
- Miller CR, Williams CR, Buchsbaum DJ, Gillespie GY. Intra-tumoral 5-fluorouracil produced by cytosine deaminase/5-fluorocytosine gene therapy is effective for experimental human glioblastomas. Cancer Res. 2002;62:773–780. [PubMed] [Google Scholar]
- Molnar P, Fekete I, Schlageter KE, Lapin GD, Groothuis DR. Absence of host-site influence on angiogenesis, blood flow, and permeability in transplanted RG-2 gliomas. Drug Metab Dispos. 1999;27:1085–1091. [PubMed] [Google Scholar]
- Netti PA, Baxter LT, Boucher Y, Skalak R, Jain RK. Time dependent behavior of interstitial fluid pressure in solid tumors: Implications for drug delivery. Cancer Res. 1995;55:5451–5458. [PubMed] [Google Scholar]
- Patchell RA, Regine WF, Ashton P, Tibbs PA, Wilson D, Shappley D, Young B. A phase I trial of continuously infused intratumoral bleomycin for the treatment of recurrent glioblastoma multiforme. J Neurooncol. 2002;60:37–42. doi: 10.1023/a:1020291229317. [DOI] [PubMed] [Google Scholar]
- Paxinos, G., and Watson, C. (1986) The Rat Brain in Stereotaxic Coordinates, 2nd ed. Orlando: Academic Press.
- Reardon D, Akabani G, Friedman A, Friedman H, Herndon J, McLendon R, Quinn J, Rich J, Penne K, Sampson J, Shafman T, Wong T, Zalutsky M, Bigner D. Treatment of patients with newly diagnosed malignant gliomas using iodine 131-labeled human-mouse chimeric antitenascin monoclonal antibody 81C6 via surgically created resection cavities: Phase I/II trial results. Neuro-oncol. 2002;4:S80. (abstract) [Google Scholar]
- Schlageter KE, Molnar P, Lapin GD, Groothuis DR. Microvessel organization and structure in experimental brain tumors: Microvessel populations with distinctive structural and functional properties. Microvasc Res. 1999;58:312–328. doi: 10.1006/mvre.1999.2188. [DOI] [PubMed] [Google Scholar]
- Viola JJ, Agbaria R, Walbridge S, Oshiro EM, Johns DG, Kelley JA, Oldfield EH, Ram Z. In situ cyclopentenyl cytosine infusion for the treatment of experimental brain tumors. Cancer Res. 1995;55:1306–1309. [PubMed] [Google Scholar]
- Weber FW, Hingorani V. Local treatment of recurrent glioblastoma by bulk infusion of recombinant IL-4 immunotoxin. Neuro-oncol. 2002;4:S101. (abstract) [Google Scholar]
- Yang W, Barth RF, Adams DM, Ciesielski MJ, Fenstermaker RA, Shukla S, Tjarks W, Caligiuri MA. Convection-enhanced delivery of boronated epidermal growth factor for molecular targeting of EGF receptor-positive gliomas. Cancer Res. 2002;62:6552–6558. [PubMed] [Google Scholar]